Strong Purcell enhancement of an optical magnetic dipole transition
Abstract
Engineering the local density of states with nanophotonic structures is a powerful tool to control light-matter interactions via the Purcell effect. At optical frequencies, control over the electric field density of states is typically used to couple to and manipulate electric dipole transitions. However, it is also possible to engineer the magnetic density of states to control magnetic dipole transitions. In this work, we experimentally demonstrate the optical magnetic Purcell effect using a single rare earth ion coupled to a nanophotonic cavity. We engineer a new single photon emitter, Er3+ in MgO, where the electric dipole decay rate is strongly suppressed by the cubic site symmetry, giving rise to a nearly pure magnetic dipole optical transition. This allows the unambiguous determination of a magnetic Purcell factor . We further extend this technique to realize a magnetic dipole spin-photon interface, performing optical spin initialization and readout of a single Er3+ electron spin. This work demonstrates the fundamental equivalence of electric and magnetic density of states engineering, and provides a new tool for controlling light-matter interactions for a broader class of emitters.
one´
The interaction of electromagnetic radiation with matter is of fundamental importance and underlies numerous current and future technologies. In particular, the absorption and emission of light by atomic or molecular transitions has enabled technologies such as the laser, MRI and atomic clocks Svanberg (2012). The ability to control absorption and emission through engineering the environment is particularly relevant for quantum technologies requiring efficient light-matter interfaces, and has been demonstrated using optical cavities and numerous emitters including atoms and ions McKeever et al. (2004); Stute et al. (2012); Tiecke et al. (2014), quantum dots Arcari et al. (2014); Hummel et al. (2019) and atom-like defects in the solid state Faraon et al. (2011); Zhong et al. (2015); Dibos et al. (2018); Merkel et al. (2020).
Light-matter interaction can take place through multiple processes, including electric dipole (ED), magnetic dipole (MD), or higher order multipole transitions Condon and Shortley (1951). The natural scale of ED transitions is the largest, and therefore ED transitions are most often targeted for controlling light-matter interactions. However, in certain atoms ED transitions are suppressed, such that higher-order processes become dominant. Many experiments have demonstrated magnetic local density of states (LDOS) engineering in the microwave frequency domain, using metallic or superconducting cavities coupled to spin ensembles Breeze et al. (2015) and, recently, individual spins Wang et al. (2023).
Demonstrating magnetic LDOS engineering in the optical domain is more challenging, as many emitters with significant MD decay pathways have competing decay processes that must be distentangled, such as forced electric dipoles and nonradiative decay. In emitters with mixed MD and ED decay pathways, the relative contributions can be distinguished through the angular spectrum of the emitted radiation Freed and Weissman (1941). Furthermore, placing emitters near dielectric interfaces and in thin film structures has enabled small modifications of ED and MD decay rates through the Purcell effect Drexhage (1974); Lukosz and Kunz (1977); Kunz and Lukosz (1980); Barnes (1998); Taminiau et al. (2012). However, demonstrating strong modification of the emission of magnetic dipole emitters in the optical domain via magnetic density of states engineering is a long-standing goal Baranov et al. (2017); Freed and Weissman (1941); Drexhage (1974); Kunz and Lukosz (1980); Taminiau et al. (2012); Rolly et al. (2012); Albella et al. (2013); Karaveli et al. (2013); Shafiei et al. (2013); Decker et al. (2013); Aigouy et al. (2014); Hussain et al. (2015).
In this work, we demonstrate strong Purcell enhancement of an optical MD transition in a single Er3+ ion using a nanophotonic cavity. This is enabled by engineering a new single photon emitter, Er3+:MgO, which by symmetry has a nearly pure MD optical transition at a wavelength of 1540.48 nm. The MD nature of the transition is experimentally confirmed via lifetime measurements, and comparison of the measured fluorescence and absorption spectra with a crystal field model. By evanescently coupling individual Er3+ ions to a silicon nanophotonic cavity with a small magnetic mode volume of m3, we demonstrate a large Purcell enhancement factor of which can be unambiguously attributed to the magnetic dipole. Additionally, we use the cavity-enhanced MD transition to realize a spin-photon interface. With this, we determine the ground state spin structure and measure the lifetime and coherence time of a single Er3+ spin. This work opens the door to using nanophotonic structures to control MD emission and enables the use of a wider class of atoms and atom-like systems for quantum technologies.
Realizing a large magnetic Purcell effect requires two components: a cavity with a large magnetic LDOS, and an emitter with a dominant MD decay pathway. The magnetic LDOS of a cavity can be quantified using the magnetic Purcell factor , which is defined analogously to the electric Purcell factor as Breeze et al. (2015):
| (1) |
Here, denotes the quality factor of the cavity, while the electric (magnetic) mode volume describes the field strength at the position of the emitter. For electric fields, the mode volume is defined by the electric field and relative permittivity as:
| (2) |
For a magnetic dipole transition, the analogous expression is:
| (3) |
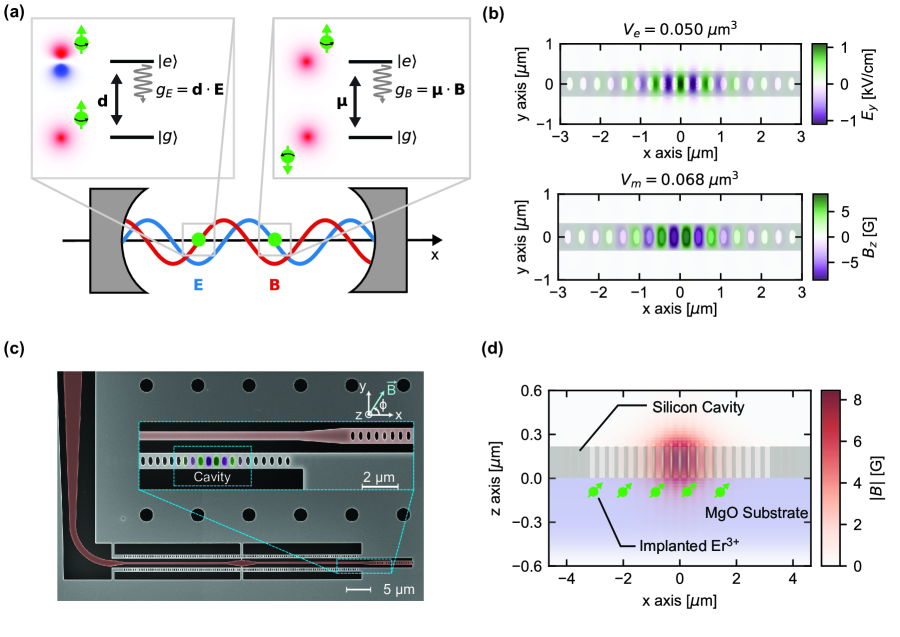
where is the the magnetic field of the cavity mode and the relative magnetic permeability. In a simple cavity such as a Fabry-Perot resonator, and are identical for optimally positioned emitters, as the distribution of the and fields are the same except for a phase shift along the cavity axis by a quarter wavelength (Fig. 1(a)).
In this work, we use a dielectric photonic crystal cavity to achieve very small mode volumes. The behavior of the electric and magnetic fields is qualitatively similar to the Fabry-Perot case (Fig. 1(b)). However, differences in the dielectric boundary conditions for and fields results in a slight difference in mode volumes, and from numerical simulations we find m3and m3. Therefore, this type of cavity is well-suited for attaining large electric and magnetic Purcell factors, depending on the type of emitter.
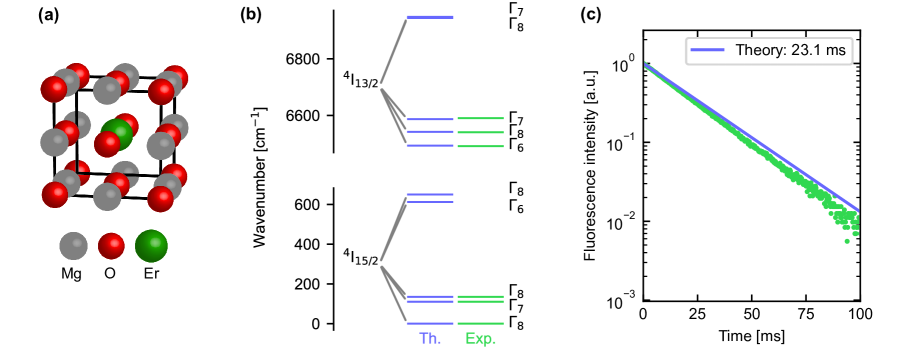
To address the second requirement of an emitter with a dominant MD decay pathway, we focus on Er3+ ions. The 1.5 m optical transition in Er3+ connects the and levels; since these have the same parity, an electric dipole transition between them is forbidden in a spherically symmetric environment. In host crystals with low site symmetry, admixtures of orbitals can lead to a so-called forced ED transition, which is often the dominant decay pathway Dieke and Crosswhite (1968). However, this is forbidden in centrosymmetric environments Görller-Walrand and Binnemans (1998), which leads us to consider MgO as an Er3+ host.
We incorporate Er into MgO using ion implantation followed by annealing (see Supplementary Information for additional information). To spectroscopically identify the cubic site in MgO, we perform site-selective excitation spectroscopy Stevenson et al. (2022) in a heavily implanted sample ( Er/cm2, sample A) and measure the lowest few ground () and excited state () crystal field levels for six distinct sites. Previous studies of Er3+:MgO have found a large number of spectral lines, suggesting that Er3+ incorporates into the crystal in several different configurations Descamps and D’Aubigne (1964); Ayant et al. (1962); Belorizky et al. (1966); Borg et al. (1970); Stevenson et al. (2022). Many do not have cubic point group symmetry, most likely because the Er3+ sits next to a vacancy or interstitial. However, one of the observed sites, with a transition at 1540.48 nm, can be reproduced with a cubic crystal-field model (Fig. 2(b)) with only four free parameters, with an r.m.s. deviation of 1.6 cm-1 (see Supplementary Information for further details).
To provide further confirmation of the MD nature of this transition, we measure the excited-state lifetime of the lowest excited crystal field state for this site, . The experimentally measured value, ms (Fig. 2(c)) is considerably longer than Er3+ lifetimes in many other materials (typically 5-10 ms Stevenson et al. (2022)) and only slightly shorter than the theoretically predicted MD lifetime of ms, calculated from the cubic crystal-field model and the refractive index of MgO (see Supplementary Information). Therefore, we conclude that the overall decay is approximately 91% MD, with the remainder being nonradiative or forced ED arising from a small distortion of the crystal. We note that other emitters in MgO have been observed to have significant nonradiative or forced ED phonon sideband transitions Karaveli et al. (2013); their absence for Er3+ is a consequence of the isolated nature of the 4 electrons. The contribution of the next-order multipole, the electric quadrupole (E2), is estimated to be smaller than the MD rate for the state of Er3+ (see Supplementary Information) Dodson and Zia (2012).
To study the magnetic Purcell effect, we fabricate silicon nanophotonic resonators from a silicon-on-insulator wafer, and bond them onto Er-implanted MgO crystals using a stamping process described previously Dibos et al. (2018). Each device consists of an array of cavities evanescently coupled to a single bus waveguide (Fig. 1(c)), which is coupled to an optical fiber using a grating coupler Chen et al. (2021). The in-plane distribution of the field is shown in Fig. 1(d); the peak field strength with a single photon in the cavity is G. While the field decays exponentially into the substrate, it remains larger than 2.50 G at depths up to 100 nm.
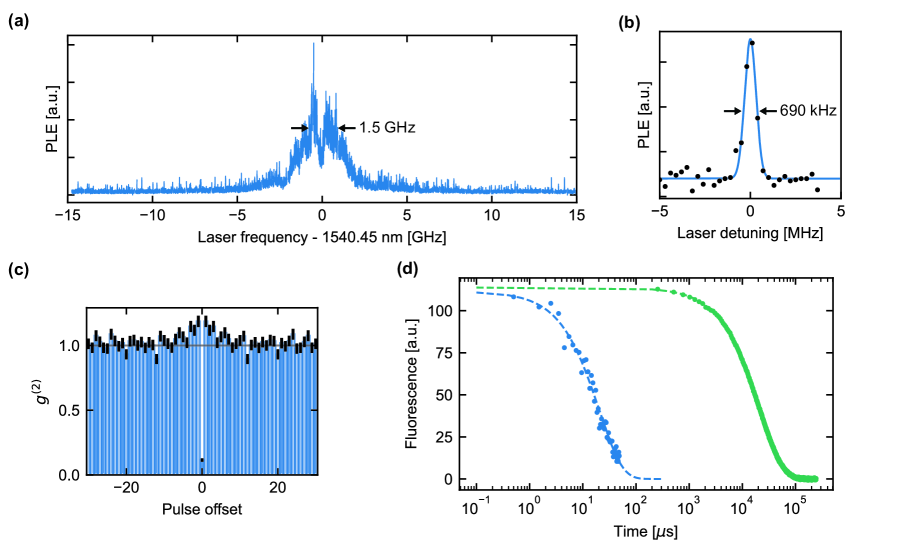
In a first experiment to probe the magnetic Purcell enhancement, we use a sample implanted with Er/cm2, distributed uniformly between the surface and a depth of 100 nm (sample B). After tuning the cavity resonance to the 1540.48 nm transition using gas deposition Dibos et al. (2018), we probe the cavity-coupled ions using photoluminescence excitation spectroscopy (PLE) by sweeping a pulsed laser over the Er3+ resonance while collecting time-delayed fluorescence photons with a superconducting nanowire single photon detector (SNSPD). PLE spectroscopy reveals a forest of single ion lines (Fig. 3(a)). The single-ion nature is confirmed by measuring the second-order autocorrelation function () of the emitted photons (Fig. 3(c)). Individual ions have linewidths as narrow as 690 kHz (Fig. 3(b)), which is significantly smaller than previous measurements of shallow Er3+ ions in Y2SiO5 Dibos et al. (2018), LiNbO3 Yang et al. (2023), or silicon Gritsch et al. (2023) (though we note that narrower linewidths for single Er3+ ions have been observed for deeper ions in YSO Merkel et al. (2020), and for shallow ions in a non-polar site in CaWO4 Ourari et al. (2023)). This is likely a consequence of the absence of a permanent electric dipole-moment for Er3+ substituted at the cubic site, which renders the emitter insensitive to charge noise.
Focusing on a single ion, we determine the MD coupling strength to the cavity from the fluorescence lifetime. A representative time trace is shown in Fig. 3(d) alongside the bulk Er3+:MgO fluorescence lifetime for comparison. The single ion decay rate is s, which is shorter than the bulk lifetime by , thereby demonstrating strong magnetic Purcell enhancement. Using the relationship , with the cavity decay rate GHz (), we extract an atom-cavity coupling strength of MHz. With and a theoretical dipole moment of (where is the Bohr magneton), we determine the single-photon magnetic field of G at the position of the ion. This is in good agreement with the simulated magnetic field strength for an optimally positioned ion at a depth of 65 nm (Fig. 1(d)), consistent with the expected ion distribution for sample B.
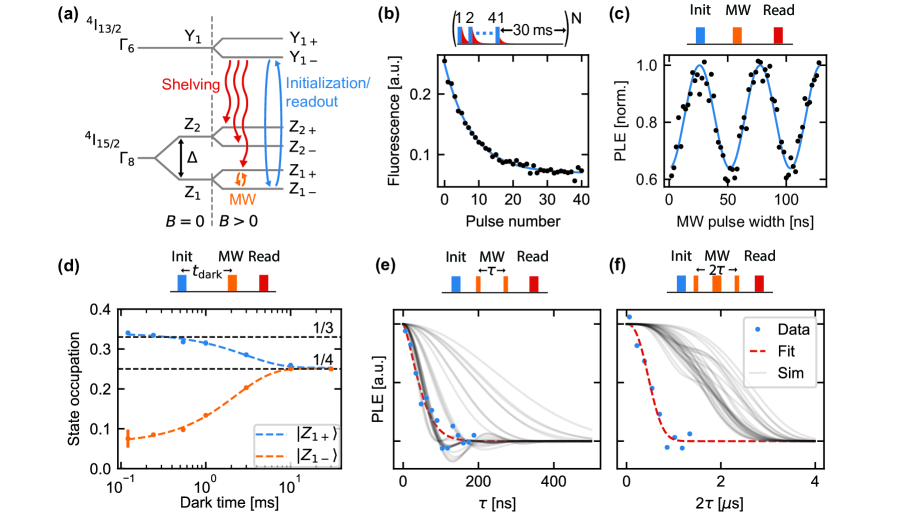
Lastly, we use the Purcell-enhanced MD transition to realize a spin-photon interface. We use a third sample with an even lower Er3+ implantation dose to allow clearer resolution of single ions (sample C, Er/cm2). Based on the crystal field model, the ground state is expected to be a effective spin-3/2 quartet state ( in Bethe notation), which is only allowed for Er3+ at a cubic site Abragam and Bleaney (1970). However, an infinitesimal distortion breaking the cubic symmetry can lift this degeneracy, resulting in two Kramers’ doublets, and , and the presence of such a perturbation is suggested by the double-peak structure in Fig. 3(a), with a splitting of 1.5 GHz. A small magnetic field (50 G) further separates the Kramers’ doublets into single states, that is, and (Fig. 4a).
With the laser and cavity tuned into resonance with the transition, repeated application of laser pulses results in an exponential decay of the fluorescence (Fig. (4b)). The initial fluorescence amplitude is proportional to the spin population in , while the decay indicates optical pumping into other states. After initializing a population imbalance in this way, we were able to observe coherent Rabi oscillations between and while applying a microwave (MW) drive with frequency GHz.
By using the initialization and readout sequence from Fig. 4(b), and calibrated microwave rotations from Fig. 4(c), we can measure the coherence properties of the ground state. To measure the lifetime, we first initialize with optical pumping, and then measure the final state population in (using a direct fluorescence measurement) and (using a MW pulse followed by direct fluorescence measurement). We find a population relaxation time of 2.6 ms. In most other Er3+ materials, the lowest Kramers’ doublet has a relaxation time exceeding several seconds at sub-Kelvin temperatures Raha et al. (2020); Ourari et al. (2023), because there is no direct phonon matrix element between the spin sublevels Abragam and Bleaney (1970). We attribute the shorter observed lifetime to thermal transitions to the low-lying level. If the separation of this level is much less than the Boltzmann energy GHz (here, is the environment temperature, is the Boltzmann constant, and is the Planck constant), then we expect the population of the lowest four levels to change from approximately after optical pumping (assuming the branching ratio to and is similar), to after thermalization. This is in agreement with the observed change in population of the state, providing support for the role of the levels in the spin relaxation, although we note that we did not directly observe the levels for the single ion. A similar relaxation timescale has been observed for Er3+:MgO ensembles in bulk EPR measurements Borg et al. (1970); Baker and Currell (1976).
Finally, we measure the spin coherence of the states using Ramsey and Hahn echo sequences (Fig. 4(e-f)), finding ns and ns, respectively. The measured value of is in good agreement with the predicted range of values from the 25Mg nuclear spins bath (, relative abundance = 10%), estimated using cluster correlation expansion (CCE) Yang and Liu (2008) simulations. However, the Hahn echo time, , is shorter than predicted from the nuclear spin dynamics alone, indicating an additional source of noise with fast fluctuations. The most likely sources are native defects (that is, F centers Hutchison (1949)), paramagnetic impurities or surface spins.
In conclusion, we have demonstrated magnetic Purcell enhancement with a Purcell factor of . This was enabled by engineering a new single photon emitter, Er3+:MgO, and coupling it to a silicon nanophotonic cavity. This large Purcell enhancement establishes the equivalence of electric and magnetic density of states for nanophotonic engineering and opens the door to engineering strong light-matter interaction with a wider range of emitters.
There are several aspects of these results worth discussing. First, the observed magnetic Purcell factor is not only the first strong Purcell enhancement for an optical magnetic dipole transition, but it is also comparable to the largest Purcell factors ever reported for electric dipole transitions in any context, using nanopohtonic cavities Dibos et al. (2018); Ourari et al. (2023) or plasmonic devices Russell et al. (2012); Hoang et al. (2016). This provides a striking demonstration of the equivalence of optical density of states engineering with electric and magnetic fields.
A particularly valuable application of magnetic Purcell enhancement is to develop new quantum emitters and spin-photon interfaces based on magnetic dipole transitions. Rare earth ions in centrosymmetric sites are one interesting class of MD emitters, which includes the example studied in this work. The main benefit of a centrosymmetric site is the absence of a permanent electric dipole moment and corresponding linear DC Stark shift in the presence of charge noise, which can suppress the spectral diffusion that prevents indistinguishable photon generation Ourari et al. (2023), which is important for applications in quantum networks Pompili et al. (2021). In fact, we attribute the narrow single-ion optical linewidth observed in this work to this effect. The observed nearly-quartet ground state is problematic for use as a qubit, because of fast spin relaxation. This effect could be overcome by the deliberate introduction of strain to further separate the and levels (e.g., using mechanical structures Meesala et al. (2018) or epitaxial growth Niu et al. (2006)), or by using host crystals that are centrosymmetric but not cubic. Finally, materials with strong optical MD transitions are of particular interest for the development of negative refractive index materials Sikes and Yavuz (2011); Buckholtz and Yavuz (2020).
Acknowledgements This work was primarily supported by the U.S. Department of Energy, Office of Science, National Quantum Information Science Research Centers, Co-design Center for Quantum Advantage (C2QA) under contract number DE-SC0012704. We also acknowledge support from the DOE Early Career award (for modeling of decoherence mechanisms and spin interactions), as well as AFOSR (FA9550-18-1-0334 and YIP FA9550-18-1-0081), the Eric and Wendy Schmidt Transformative Technology Fund, the Princeton Catalysis Initiative, and DARPA DRINQS (D18AC00015) for establishing the materials spectroscopy pipeline and developing integrated nanophotonic devices. CMP was supported by a National Defense Science and Engineering Graduate (NDSEG) Fellowship.
References
- Svanberg (2012) S. Svanberg, Atomic and Molecular Spectroscopy: Basic Aspects and Practical Applications (Springer Berlin Heidelberg, 2012).
- McKeever et al. (2004) J. McKeever, A. Boca, A. D. Boozer, R. Miller, J. R. Buck, A. Kuzmich, and H. J. Kimble, Science 303, 1992 (2004).
- Stute et al. (2012) A. Stute, B. Casabone, P. Schindler, T. Monz, P. O. Schmidt, B. Brandstätter, T. E. Northup, and R. Blatt, Nature 485, 482 (2012).
- Tiecke et al. (2014) T. G. Tiecke, J. D. Thompson, N. P. de Leon, L. R. Liu, V. Vuletić, and M. D. Lukin, Nature 508, 241 (2014).
- Arcari et al. (2014) M. Arcari, I. Söllner, A. Javadi, S. Lindskov Hansen, S. Mahmoodian, J. Liu, H. Thyrrestrup, E. Lee, J. Song, S. Stobbe, and P. Lodahl, Physical Review Letters 113, 093603 (2014).
- Hummel et al. (2019) T. Hummel, C. Ouellet-Plamondon, E. Ugur, I. Kulkova, T. Lund-Hansen, M. A. Broome, R. Uppu, and P. Lodahl, Applied Physics Letters 115, 021102 (2019).
- Faraon et al. (2011) A. Faraon, P. E. Barclay, C. Santori, K.-M. C. Fu, and R. G. Beausoleil, Nature Photonics 5, 301 (2011).
- Zhong et al. (2015) T. Zhong, J. M. Kindem, E. Miyazono, and A. Faraon, Nature Communications 6, 8206 (2015).
- Dibos et al. (2018) A. Dibos, M. Raha, C. Phenicie, and J. Thompson, Physical Review Letters 120, 243601 (2018).
- Merkel et al. (2020) B. Merkel, A. Ulanowski, and A. Reiserer, Physical Review X 10, 041025 (2020).
- Condon and Shortley (1951) E. U. Condon and G. H. Shortley, The Theory of Atomic Spectra (Cambridge University Press, 1951).
- Breeze et al. (2015) J. Breeze, K.-J. Tan, B. Richards, J. Sathian, M. Oxborrow, and N. M. Alford, Nature Communications 6, 6215 (2015).
- Wang et al. (2023) Z. Wang, L. Balembois, M. Rančić, E. Billaud, M. L. Dantec, A. Ferrier, P. Goldner, S. Bertaina, T. Chanelière, D. Estève, D. Vion, P. Bertet, and E. Flurin, “Single electron-spin-resonance detection by microwave photon counting,” (2023).
- Freed and Weissman (1941) S. Freed and S. I. Weissman, Physical Review 60, 440 (1941).
- Drexhage (1974) K. H. Drexhage, in Progress in Optics, Vol. 12, edited by E. Wolf (Elsevier, 1974) pp. 163–232.
- Lukosz and Kunz (1977) W. Lukosz and R. E. Kunz, JOSA 67, 1615 (1977).
- Kunz and Lukosz (1980) R. E. Kunz and W. Lukosz, Physical Review B 21, 4814 (1980).
- Barnes (1998) W. L. Barnes, Journal of Modern Optics 45, 661 (1998).
- Taminiau et al. (2012) T. H. Taminiau, S. Karaveli, N. F. van Hulst, and R. Zia, Nature Communications 3, 979 (2012).
- Baranov et al. (2017) D. G. Baranov, R. S. Savelev, S. V. Li, A. E. Krasnok, and A. Alù, Laser & Photonics Reviews 11, 1600268 (2017).
- Rolly et al. (2012) B. Rolly, B. Bebey, S. Bidault, B. Stout, and N. Bonod, Physical Review B 85, 245432 (2012).
- Albella et al. (2013) P. Albella, M. A. Poyli, M. K. Schmidt, S. A. Maier, F. Moreno, J. J. Sáenz, and J. Aizpurua, The Journal of Physical Chemistry C 117, 13573 (2013).
- Karaveli et al. (2013) S. Karaveli, A. J. Weinstein, and R. Zia, Nano Letters 13, 2264 (2013).
- Shafiei et al. (2013) F. Shafiei, F. Monticone, K. Q. Le, X.-X. Liu, T. Hartsfield, A. Alù, and X. Li, Nature Nanotechnology 8, 95 (2013).
- Decker et al. (2013) M. Decker, I. Staude, I. I. Shishkin, K. B. Samusev, P. Parkinson, V. K. A. Sreenivasan, A. Minovich, A. E. Miroshnichenko, A. Zvyagin, C. Jagadish, D. N. Neshev, and Y. S. Kivshar, Nature Communications 4, 2949 (2013).
- Aigouy et al. (2014) L. Aigouy, A. Cazé, P. Gredin, M. Mortier, and R. Carminati, Physical Review Letters 113, 076101 (2014).
- Hussain et al. (2015) R. Hussain, S. S. Kruk, C. E. Bonner, M. A. Noginov, I. Staude, Y. S. Kivshar, N. Noginova, and D. N. Neshev, Optics Letters 40, 1659 (2015).
- Dieke and Crosswhite (1968) G. H. Dieke and H. Crosswhite, Spectra and energy levels of rare earth ions in crystals (Interscience Publishers, 1968).
- Görller-Walrand and Binnemans (1998) C. Görller-Walrand and K. Binnemans, in Handbook on the Physics and Chemistry of Rare Earths, Vol. 25 (Elsevier, 1998) pp. 101–264.
- Stevenson et al. (2022) P. Stevenson, C. M. Phenicie, I. Gray, S. P. Horvath, S. Welinski, A. M. Ferrenti, A. Ferrier, P. Goldner, S. Das, R. Ramesh, R. J. Cava, N. P. de Leon, and J. D. Thompson, Physical Review B 105, 224106 (2022).
- Descamps and D’Aubigne (1964) D. Descamps and Y. D’Aubigne, Physics Letters 8, 5 (1964).
- Ayant et al. (1962) Y. Ayant, E. Bélorizky, and J. Rosset, Journal de Physique et le Radium 23, 201 (1962).
- Belorizky et al. (1966) E. Belorizky, Y. Ayant, D. Descamps, and Y. Merle D’aubigné, Journal de Physique 27, 313 (1966).
- Borg et al. (1970) M. Borg, R. Buisson, and C. Jacolin, Physical Review B 1, 1917 (1970).
- Dodson and Zia (2012) C. M. Dodson and R. Zia, Physical Review B 86, 125102 (2012).
- Chen et al. (2021) S. Chen, S. Ourari, M. Raha, C. M. Phenicie, M. T. Uysal, and J. D. Thompson, Optics Express 29, 4902 (2021).
- Yang et al. (2023) L. Yang, S. Wang, M. Shen, J. Xie, and H. X. Tang, Nature Communications 14, 1718 (2023).
- Gritsch et al. (2023) A. Gritsch, A. Ulanowski, and A. Reiserer, “Purcell enhancement of single photon emitters in silicon,” (2023).
- Ourari et al. (2023) S. Ourari, Łukasz. Dusanowski, S. P. Horvath, M. T. Uysal, C. M. Phenicie, P. Stevenson, M. Raha, S. Chen, R. J. Cava, N. P. de Leon, and J. D. Thompson, “Indistinguishable telecom band photons from a single erbium ion in the solid state,” (2023).
- Abragam and Bleaney (1970) A. Abragam and B. Bleaney, Electron Paramagnetic Resonance of Transition Ions (Oxford University Press, 1970).
- Raha et al. (2020) M. Raha, S. Chen, C. M. Phenicie, S. Ourari, A. M. Dibos, and J. D. Thompson, Nature Communications 11, 1605 (2020).
- Baker and Currell (1976) J. M. Baker and G. Currell, Journal of Physics C: Solid State Physics 9, 3819 (1976).
- Yang and Liu (2008) W. Yang and R. B. Liu, Physical Review B 78, 1 (2008).
- Hutchison (1949) C. A. Hutchison, Physical Review 75, 1769 (1949).
- Russell et al. (2012) K. J. Russell, T.-L. Liu, S. Cui, and E. L. Hu, Nature Photonics 6, 459 (2012).
- Hoang et al. (2016) T. B. Hoang, G. M. Akselrod, and M. H. Mikkelsen, Nano Letters 16, 270 (2016).
- Pompili et al. (2021) M. Pompili, S. L. N. Hermans, S. Baier, H. K. C. Beukers, P. C. Humphreys, R. N. Schouten, R. F. L. Vermeulen, M. J. Tiggelman, L. dos Santos Martins, B. Dirkse, S. Wehner, and R. Hanson, Science 372, 259 (2021), https://www.science.org/doi/pdf/10.1126/science.abg1919 .
- Meesala et al. (2018) S. Meesala, Y.-I. Sohn, B. Pingault, L. Shao, H. A. Atikian, J. Holzgrafe, M. Gündoğan, C. Stavrakas, A. Sipahigil, C. Chia, R. Evans, M. J. Burek, M. Zhang, L. Wu, J. L. Pacheco, J. Abraham, E. Bielejec, M. D. Lukin, M. Atatüre, and M. Lončar, Physical Review B 97, 205444 (2018).
- Niu et al. (2006) F. Niu, A. L. Meier, and B. W. Wessels, Journal of Vacuum Science & Technology B: Microelectronics and Nanometer Structures Processing, Measurement, and Phenomena 24, 2586 (2006).
- Sikes and Yavuz (2011) D. E. Sikes and D. D. Yavuz, Physical Review A 84, 053836 (2011).
- Buckholtz and Yavuz (2020) Z. N. Buckholtz and D. D. Yavuz, Physical Review A 101, 023831 (2020).
- Ziegler et al. (2010) J. F. Ziegler, M. D. Ziegler, and J. P. Biersack, Nuclear Instruments and Methods in Physics Research Section B: Beam Interactions with Materials and Atoms 268, 1818 (2010).
- Carnall et al. (1989) W. T. Carnall, G. L. Goodman, K. Rajnak, and R. S. Rana, The Journal of Chemical Physics 90, 3443 (1989).
- Wybourne (1965) B. G. Wybourne, Spectroscopic Properties of Rare Earths (Interscience Publishers, 1965).
- McLeod and Reid (1997) D. P. McLeod and M. F. Reid, Journal of Alloys and Compounds 250, 302 (1997).
- Horvath et al. (2019) S. Horvath, J. Rakonjac, Y.-H. Chen, J. Longdell, P. Goldner, J.-P. Wells, and M. Reid, Physical Review Letters 123, 057401 (2019).
- Reid (2006) M. F. Reid, in Spectroscopic Properties of Rare Earths in Optical Materials, edited by G. Liu and B. Jacquier (Springer Science & Business Media, 2006).
- Bond (1965) W. L. Bond, Journal of Applied Physics 36, 1674 (1965).
I Supplementary Information
II MgO sample preparation
The MgO samples used in this study were procured from MTI Corporation. They have a double-sided epi polish, and are specified by the vendor to have a chemical purity %. Erbium was introduced into the samples using ion implantation (II-VI Inc.). A total of three different implantation and annealing treatments were used for different experiments. Sample A was implanted with an erbium density of Er/cm2 targeting a uniform erbium distribution between the surface and a depth of 100 nm, using the fluences and energies shown in Tab. 1. After implantation, this sample was annealed in air at 600 ∘C for 6 hours. Sample B was implanted with an erbium density of Er/cm2 and targeted a uniform erbium density between the surface and a depth of 100 nm (Tab. 1), with no post-implantation anneal. Finally, sample C was implanted with an erbium density of Er/cm2 using a 35 keV implantation energy corresponding to a target depth of 15 nm. After implantation, this sample was annealed in air at 400 ∘C for 8 hours. The implantation energies were chosen to match the target depth based on simulations using the Stopping-Range of Ions in Matter package Ziegler et al. (2010).
| Er/cm2 total flux | Er/cm2 total flux | ||
|---|---|---|---|
| Energy (keV) | Flux (Er/cm2) | Energy (keV) | Flux (Er/cm2) |
| 10 | 10 | ||
| 25 | 25 | ||
| 50 | 50 | ||
| 100 | 100 | ||
| 150 | 150 | ||
| 250 | 250 | ||
| 350 | 350 | ||
III Experimental details
Nanophotonic devices were fabricated from silicon on insulator wafers and transferred to the MgO substrate. Light was coupled to the devices via a grating coupler using an angle polished fiber and MW delivery was achieved using a scanning probe head. Details of the fabrication procedure and experimental apparatus can be found in Ref. Chen et al. (2021).
The single ion fluorescence measurement (Fig. 3(a)) was performed at 4 K with the sample cooled with a Montana Inc Cryostation. All other single ion measurements were conducted at 500 mK using a BlueFors 3He cryostat.
The fluorescence measurement (Fig. 3(a)) was performed using 4.2 s excitation pulses interleaved with 101 s fluorescence collection windows, repeated times for each frequency step, respectively. The narrow single ion measurement (Fig. 3(b)) utilized 4.2 s excitation pulses and 41 s fluorescence collection windows repeated times. The second order auto-correlation experiment (Fig. 3(c)) used 4.2 s excitation pulses and 500 s fluorescence collection windows, repeated times. The single ion lifetime measurement (Fig. 3(d)) utilized 4.2 s excitation pulses interleaved with 101 s fluorescence collection windows, repeated times per shot. The lifetime was averaged over a total of 91 shots.
Spin characterization experiments were all performed with sample C using two distinct magnetic field orientations. Initialization experiments used an external magnetic field magnitude of G and an orientation of selected to maximize cyclicity (see Fig. 1(c) of main text for coordinate system definition). Using this configuration, 41 pulses were used to initialize the spin state (Fig. 4(b) of main text). Increasing the number of pulses beyond this did not improve the initialization since an equilibrium between the optical pumping rate and phonon cross-relaxation rate (discussed in the main text) is reached. The same field configuration was utilized for spin characterization. The optical pulse sequence used for Fig. 4(b) and Fig. 4(d) consisted of a 4.2 s optical excitation pulse interleaved with s fluorescence collection windows, and was repeated a total of times.
Rabi, Ramsey and Hahn echo measurements were performed using a magnetic field magnitude of G, with an orientation of , selected to minimize background fluorescence from neighboring ions. This field corresponded to a ground state splitting of GHz. The optical pulses used for acquiring Rabi oscillation data consisted of a 4.2 s excitation pulses in tandem with 101 s fluorescence windows, with each point repeated times. The Ramsey data used optical excitation pulses of length 4.2 s with fluorescence collection windows of 101 s length, repeated times for each data point. Finally, the Hahn data used optical excitation pulses of length ns interleaved with 101 s length fluorescence collection windows and a total of repetitions. The very short optical excitation pulses corresponded to calibrated optical pulses and were performed with a peak optical power four orders of magnitude larger than the uncalibrated 4.2 s excitation pulses used in other experiments.
For ensemble spectroscopy (Fig. 2(b-c) and Fig. S1), we used a separate setup at 4 K, based on an Oxford Instruments Optistat cryostat.
IV Crystal-field modeling of the cubic site
A crystal field model was developed to verify that the observed transitions are consistent with a cubic point-group symmetry, and to determine a theoretical lifetime of the optical excited state. The complete Hamiltonian for the electrons has the form
| (4) |
where is the free-ion contribution, is the crystal-field Hamiltonian, and is the nuclear magnetic-dipole interaction. The free-ion Hamiltonian follows the parameterization of Carnall et al. Carnall et al. (1989)
| (5) |
with the central field Hamiltonian. Subsequent terms are arranged in pairs of parameters multiplied by the matrix elements of an operator. Specifically, are the Slater parameters and the components of the angular part of the electrostatic repulsion, is the spin-orbit coupling constant with the spin-orbit coupling operator. The parameters , , and account for two-body interactions (Trees parameters) and the parameters account for three-body interactions (Judd parameters). Furthermore, and are the eigenvalues of the Casimir operators of the groups and Wybourne (1965).

For a substitutional site with a cubic point-group symmetry, the crystal-field Hamiltonian reads
| (6) |
Here, the and are the crystal field parameters and are spherical tensor operators expressed using the normalization of Wybourne Wybourne (1965). The last term in Eq. (5), , accounts for the nuclear magnetic dipole; a detailed description of this contribution to can be found in Ref. McLeod and Reid (1997).
The Hamiltonian parameters, shown in Tab. 2, were optimized by fitting the eigenvalues of the Hamiltonian (4) to the energy levels of Er3+:MgO (Fig. 5) reported in Ref. Stevenson et al. (2022).
| Parameter | Value (cm-1) |
|---|---|
| 35879 | |
| 2356 | |
| 3403 | |
| 290 | |
| 97483 | |
| 67904 | |
| 54010 |
The experimental and theoretical energies are summarized in Tab. 3, yielding an r.m.s. difference of 1.6 cm-1. This close agreement establishes that the studied Er3+ site in Er3+:MgO has cubic point-group symmetry.
We note that due to available experimental data being limited to the and multiplets, it was only possible to fit the two crystal-field parameters and , as well as the central field contribution and the spin-orbit coupling constant . The remaining parameters were fixed to values of Er3+:LaF3 from Carnall et al. Carnall et al. (1989). As a consequence, the obtained fit is unlikely to accurately reproduce the inter-multiplet spacing of higher energy terms. However this does not affect the accuracy of the fitted cubic crystal-field parameters to leading order. Additionally, high-resolution spectroscopy of the to transition showed a lifting of the quartet into two Kramers’ doublets with a splitting of 1.5 GHz. It was possible to reproduce this by adding a small axial perturbation to the cubic crystal field of cm-1. To achieve close agreement with the observed lineshape, it was necessary to include an additional rank 2 contribution of cm-1, along with the nuclear magnetic dipole hyperfine interaction with a coupling strength of 0.0054 cm-1 Horvath et al. (2019).
| State | Experiment (cm-1) | Cubic model (cm-1) |
|---|---|---|
| * | 0, 0.08 | |
| 110.4 | ||
| * | 134.8 | |
| - | ||
| * | - | |
| 6491.5 | ||
| * | 6539.8, 6540.1 | |
| 6590.2 | ||
| * | - | |
| - |
V Predicted magnetic dipole decay rate
In order to evaluate the optical lifetime of the state for the cubic site, we use the Hamiltonian (4) to determine the magnetic dipole moment. Following the treatment of Ref. Reid (2006), we note that
| (7) |
where is the rank 1 magnetic dipole operator with polarization . The transition strength for magnetic dipole transitions from initial state to final state can be found by summing over all the and components of these states:
| (8) |
We note that the excited state lifetime is the inverse of the sum over emission rates from all polarizations. Therefore, one can define an effective emission rate by Reid (2006)
| (9) |
Here is the permittivity of free space, the angular frequency, is Planck’s constant, the speed of light, the refractive index of the host crystal, and the degeneracy of the initial state.
The transition dipole moment can be determined from the wavefunctions obtained from Eq. (4). We find . For a refractive index of Bond (1965) we then find s-1, corresponding to a lifetime of ms. We note that the lifetime of Er3+ has been previously calculated for the free-ion case in Ref Dodson and Zia (2012), yielding ms after scaling by to account for the MgO host. The slightly slower decay rate that we predict is related to the MD matrix element. We believe our predicted matrix element is more accurate because we include the effect of the crystal field (), and also fit the spin-orbit constant to the spectroscopic data.
VI Other contributions to the decay rate
The theoretically calculated magnetic dipole relaxation rate for MgO is slightly slower than the experimentally observed decay rate, implying an additional relaxation path. It is therefore possible that the observed Purcell enhancement could be attributed to the other decay pathway, instead of the MD decay. However, given the comparable electric and magnetic mode volumes of the cavity, the maximum attainable Purcell factor for pure ED and pure MD emitters are also comparable. The observed Purcell factor agrees well with the predicted enhancement for a pure MD emitter. Therefore, it is not plausible to attribute the bulk of the Purcell enhancement to the < 10% ED decay fraction.
Finally we note that in addition to a small ED decay component, one may also consider the possibility of an electric quadrupole contribution. The electric quadrupole decay rate for the term of Er3+ has been estimated using a free-ion Hamiltonian to be s-1 Dodson and Zia (2012). To first order, the free-ion case can be used to estimate the expected decay rate in a host material using Dodson and Zia (2012), which yields s-1. This decay rate is negligible compared to the MD decay rate and may therefore be disregarded.