Visualization Supporting Talent Portrait Generation: an Empirical Study
Abstract
In today’s era of scientific and technological advancements, the importance of talent resources is increasingly highlighted. This article will attempt to summarize the academic trajectories and successes of numerous scientists from both past and present, aiming to reproduce the correlation between scientists’ personal development and their academic output. Firstly, this article analyzes the life trajectories of researchers, visualizing their research accomplishments, collaborative partners, and research inheritance, and analyze based on the results.
1 Introduction
The development of science is not only about the constant updating of scientific theories and technological means, but also the process of inheritance and development of scientific knowledge, scientific traditions, and scientific culture among generations of scientists. Scientists at the forefront of the world often have distinct teacher-student relationships. [16] once said in ”General History of Chinese Academics”: ”The history of academia is derived from academia. Therefore, the nature of academia determines the nature of its history.”
With the emergence of talent shortages, brain drain, and structural contradictions in employment, the use of visual methods for human resource management has become increasingly popular in describing talent development. The ”14th Five Year Plan” Big data Industry Development Plan proposes to build a prosperous and orderly industrial ecology and improve the level of Big data public services such as talent training. Many local governments, enterprises, and institutions also use visual and quantitative features to search for talents that meet their needs. In this article, we suggest combining visualization methods with researchers’ career trajectories to analyze their careers from three perspectives: (1) research projects led by the researchers themselves, (2) collaborative projects in which the researchers participate, and (3) teacher-student relationships between researchers. In addition, this article will quantitatively study the output of researchers through longitudinal analysis and use it to predict the future development of researchers.
2 Research status
Currently, there is no paper in domestic and foreign research that uses visualization techniques to evaluate scientists themselves and quantitatively analyze their achievements at the same time. However, individual topics have been studied. For example, [20] evaluate the extent of researchers’ involvement in various fields through an evaluation graph with eight dimensions, including social sciences, natural sciences, and engineering. Then they use the t-sne visualization method to evaluate the similarity between different researchers’ studies. [18] integrate scientists in the field of geology with scientific discoveries, terms, and concepts, helping future geologists learn and research through spatial data and process diagrams. [22] use the Gartner model, business process diagrams, and T-type evaluation diagrams to evaluate the capabilities and research status of foreign data scientists.
In terms of academic inheritance research, various departments of universities in the West have commemorative webpages for the school’s inheritance. For example, the University of Manchester commemorates the school’s history in the school history museum, including the research process and achievements of 25 Nobel Prize winners since the Victorian era, as well as the research achievements of famous researchers in the school’s history. European higher education organizations also document a large number of great achievements and inventions, as well as famous researchers and their lineage, in famous universities in Europe since the establishment of the University of Bologna in 1088. There are also studies on academic inheritance topics in China. [30] discusses the academic inheritance of Chinese scientists from the perspectives of learning Western modern science and rediscovering the traditional academic values of China.
Qualitative methods have become a popular method in recent years to evaluate the performance of candidates when applying. At present, the most popular method in China is the study of competency models. It is generally believed that competence is a personal condition and behavioral characteristic that directly affects work performance, referring to the deep-seated characteristics of individuals who can distinguish outstanding achievements from ordinary people in a certain job[27]. For example, [7] proposed a human resource performance management system based on personal competence. Every employee must possess corresponding abilities to achieve their job performance goals. In addition, [19], [15], and [25] have all discussed the practice and application of competency models from different perspectives. In addition to the competency model, [29] classified the current domestic intellectuals into six categories: basic research talents, applied research talents, technology development talents, achievement transformation talents, technology management service talents, and experimental technology talents. They also created a user tag based on all published journal, conference, and patent results, to evaluate a talent from different perspectives. Of course, there are also many domestic studies scoring talents in the form of Indexation. For example, Qiu Junping and Miao Wenting used the Hirsch index to evaluate researchers in the field of library and information science [11]. In addition to the h index, the Ht index proposed by [23], the Prathap index proposed by [31], and the RAC index proposed by [13] all try to evaluate talents in a quantitative way.
3 Framework of data visualization
Peter F. Drucker, the father of modern management, has the following opinion on Talent management: ”Only measured talents can be effectively managed.” Because of the small number of employees, the traditional Talent management system often relies on qualitative methods. However, as companies expand, people increasingly need more complex management methods. The commonly used quantitative analysis methods in human resources include comparative analysis, attribute analysis, and graphic analysis. Comparative analysis and comparison of data to demonstrate differences between different data groups; Attribute analysis focuses on studying the changes between things, tending towards traditional quantitative analysis; Graphic analysis utilizes graphics as a means to provide readers with a better reading experience[12].
In the past, human resource management in universities mainly focused on managing the current situation of human resources, lacking foresight. Currently, due to limited information, human resource services have become increasingly passive. [14] believe that there are five main problems in current human resource management in universities: the inability to achieve precise matching between positions and in-service personnel, as well as potential recruitment talents [26]; The quantification level of performance evaluation indicators is not high [17]; The information is limited and cannot be predicted; The phenomenon of brain drain is widespread [5]; Human resource management is too rigid to meet individual needs [24].
Therefore, this article proposes a framework map for analyzing data from researchers. For any government agency or enterprise or institution that wants to recruit, visual charts can be created, compared, and evaluated through the above methods.
3.1 Data collection and clssification
There are a large number of platforms at home and abroad that provide scientific research data for researchers, especially journals and related data. Many researchers themselves create personal interfaces or provide relevant personal information on school platforms. In addition, platforms such as CNKI, Google Academic, ResearchGate, and Web of Science all provide specific data on the authors, citations, and downloads of journal and conference papers.
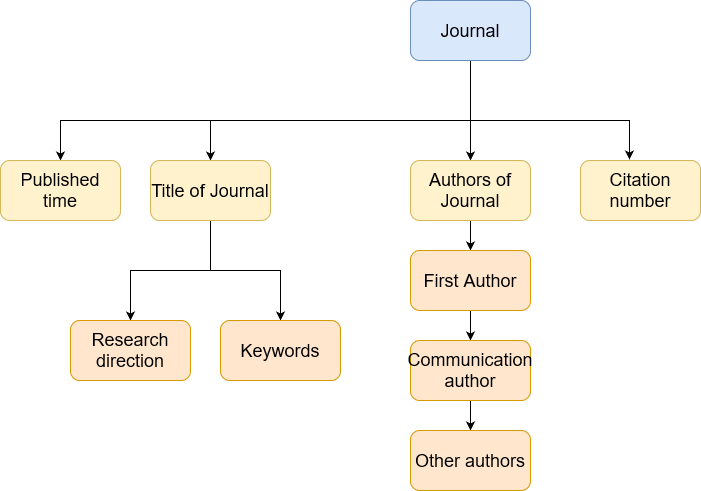
In the process of data collection, a common situation is that the publication time of the paper on the personal interface does not match the data platform. This is due to the fact that the publication process of the paper spans years, resulting in different information between the two. In this case, the publication time of the personal interface should prevail. The detailed framework for data collection is shown in Figure 1.
There are also various ways to collect data on academic inheritance relationships: firstly, if the researcher’s field is mathematics or computer science, they can be directly queried from websites such as Mathematical Genealogy Engineering. However, these websites only provide data from researchers related to the subject. If the research object does not belong to these fields, it should be collected through methods such as the researcher’s personal interface, the school’s paper database, and the departmental interface.
After collecting the data, the data should be classified and all articles of the research object should be classified as research projects led by the researcher themselves and research projects participated by the researcher. This article believes that in most cases, if the first author of the article is the research subject, or if the corresponding author is the research subject and the first author is the school of the research subject, then the research is a research project led by the researcher himself, and vice versa, it is a scientific research project participated by the researcher.
3.2 Framework for analysis of Journals
The purpose of establishing a literature analysis framework in this article is to reflect the changes in the quality of papers while reflecting the number of papers published each year. Therefore, this article adopts a columnar line overlay chart to simultaneously include two sets of data.
The innovation of this article lies in the addition of the label of more influential papers, taking into account data dimensionality reduction [21], to demonstrate the proportion of outstanding papers by researchers in the total number of papers per year. Due to the different number of factors in journals of different disciplines, the proportion of high factor papers varies among disciplines. Taking statistics as an example, journals with factors ranging from 4 to 5 are usually considered influential. Therefore, excellent papers can include papers published in journals with high impact factors, as well as papers with high citations. However, overall, the proportion of excellent papers should be around 10-20%, and should not exceed 20%. In the future, the improvement direction of the literature analysis framework is to consider more elements of high-dimensional analysis [28, 8].
3.3 Framework for analysis of co-authors
The collaborators of researchers include all research projects that involve researchers, and this article analyzes these projects in two different ways. Firstly, this article analyzed the working institutions of all participants in these projects and conducted spatial data analysis on these institutions. Subsequently, the article analyzed the cooperation between participants in each project, except for the research subjects, and found the frequency of academic cooperation from two aspects. In the process of visualization, we should focus on the ethnic level of academic cooperation, and reflect the number of cooperation in the form of thick and thin lines. In the future, collaborators can also conduct clustering analysis of data texts [2] or multi factor analysis using different colors for labeling [3].
3.4 Framework for analysis of academic inheritance
Academic inheritance analysis also includes two different visualization methods. The first part shows the Doctoral advisor of the research goal and the upward inheritance. In the process of visualization, it is necessary to collect the birth and death dates of each researcher on the inheritance tree, so as to build a complete Gantt chart. The second section displays the graduation destinations of all doctoral students under the guidance of the researchers, and displays them through spatial data. It should be noted that the visualization process should include students heading to work in the industry, and each student’s position should be processed according to the latest position.
3.5 Dealing with missing data
Missing data is a very common phenomenon in data processing. Generally speaking, when there is a missing data, the most common approach is the data filling method, which converts a dataset with missing data into a complete dataset by filling in the mean, mode, or classification values such as 1 and -1 [1]. Within the framework of this article, common missing data values include: impact factors of journals that cannot be queried, graduates that cannot be queried, and the biographies of ancient scientists. Due to the importance of these values, the use of data filling method is not reasonable. Generally speaking, as long as the total missing rate of each data item is not higher than 5%, only complete data can be analyzed [10].
4 Data Visualization
This section will introduce our visualization works to describe the efforts of scientists, we will estimate a faculty’s work with 3 different perspectives: 1) Journals published in recent years, 2) Collaborators in the world and 3) Academic Inheritance.
4.1 Analysis of Journals
As shown in Figure 2, it displays all the papers published by Professor Richard Cook from the Department of Actuarial Science and Statistics at the University of Waterloo since 2009. The figure presents several significant papers published by Professor Cook, which are either published in high-impact factor journals or have gained a large amount of application.
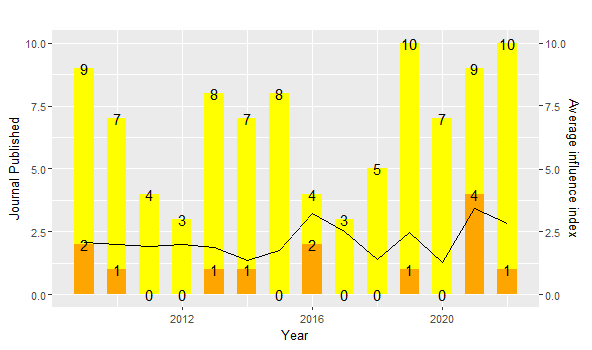
From the graph, it is not difficult to see that the number of articles published by Professor Cook has been around 5 to 6 per year since 2009. Among them, the number of publications clearly shows differences with troughs and peaks. The years 2011-2012 and 2016-2017 had a lower number of articles published. However, the average impact factor of the published articles has shown a gradual increase. It has remained stable at around 2.5 in the early years and has been increasing in recent years, reaching a peak of 4 in one year. This is related to the fact that journals in the field of statistics generally have lower impact factors.
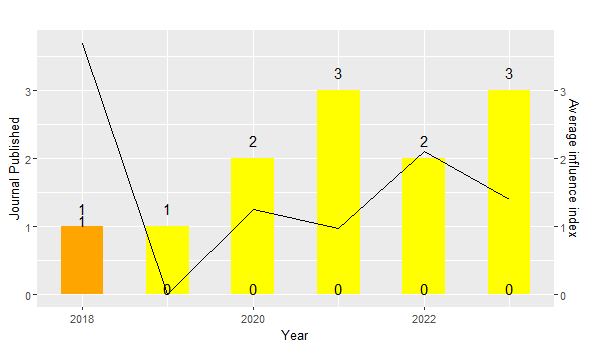
As a comparison, we selected Professor Richard Cook’s doctoral graduate, Liqun Diao, for comparison. Figure 3 shows the publication status of Liqun Diao’s papers in the past six years. It is not difficult to see that as an assistant professor, Liqun Diao’s number of published papers, more influential articles, and impact factors remain around 2-3. However, the data in recent years has also shown an upward trend.
4.2 Analysis of co-authors
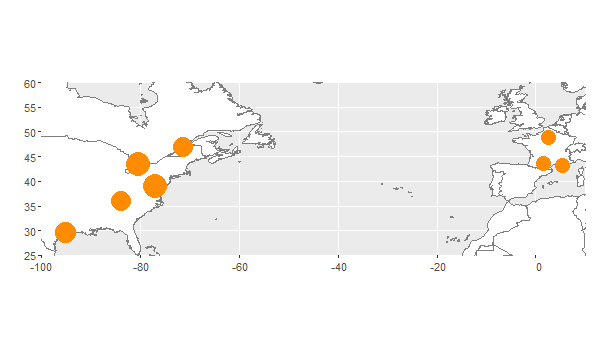
As shown in Figure 4, it displays the other researchers that Professor Richard Cook from the Department of Actuarial Science and Statistics at the University of Waterloo has collaborated with since 2009. It is evident that as a professor at a Canadian university, Professor Cook’s main collaborators come from schools and institutions in both Canada and the United States, with a small number also from schools and institutions in France.
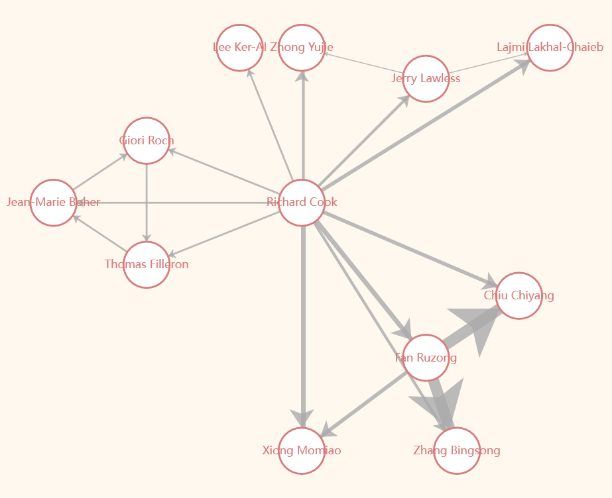
The next figure 5 presents the exact people co-authored with Richard Cook. The result obvious reveals the distribution of members, the downer part of members are his students and colleagues within the University of Waterloo, the left hand part of the graph are another academic team from Aix-Marseille Univesity in France, and the upper right hand part reveals clear relation of several Chinese academics working in US universities.
4.3 Analysis of academic inheritance
Currently, there are multiple academic projects dedicated to reproducing the history of academic inheritance and tracing the lineage between scholars. For instance, the ”Mathematics Genealogy Project” has organized the genealogy of scientists, primarily mathematicians, from ancient times to the present.
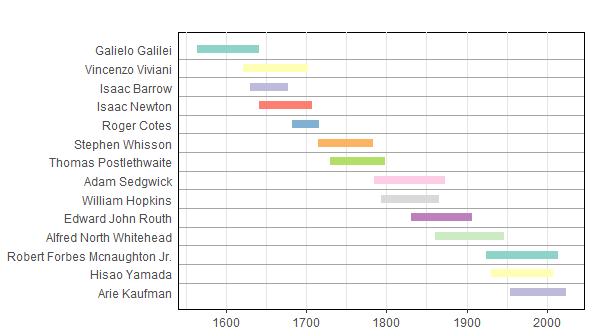
This article aims to reproduce the connections between scholars from a visual perspective based on the information primarily sourced from the Mathematics Genealogy Project. As shown in Figure 6, an analysis of academic inheritance is conducted using Professor Ari Kauffman from Stony Brook University as an example. It is worth noting that the list includes many well-known names, such as Newton and Galileo. In fact, this is a common phenomenon discovered by the genealogy project, whereby after multiple tracing, one’s academic lineage can be traced back to familiar names like Leibniz and Newton.
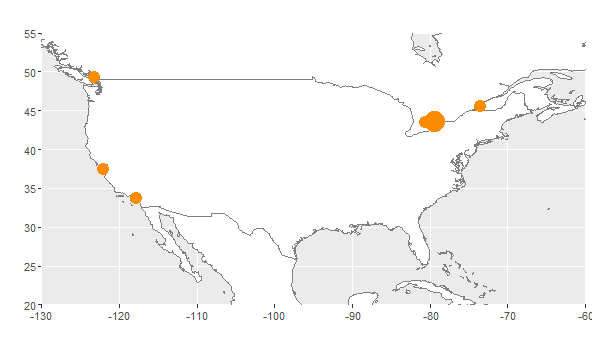
In addition to analyzing academic heritage, this article also proposes a visual method for analyzing students’ whereabouts. As shown in Figure 7 , it shows the whereabouts of 17 doctoral graduates under the guidance of Professor David Andrews Francis in the Department of Statistics at the University of Toronto. The figure shows the destinations chosen by graduates, most of whom choose to teach in schools in the United States and Canada. Due to Professor Andrews’ collaboration with British schools, some graduates have also chosen to teach at universities in the UK. Some graduates choose to join the industry.
5 Conclusion
This article presents a visual analysis of the research achievements of existing researchers, and draws the following conclusions: firstly, visual analysis of researchers is very important. By converting a large amount of data and information into charts, it can help universities, businesses, or governments more intuitively understand various aspects of researchers, including academic achievements, recent academic status, international cooperation status, and student distribution. As young researchers gradually mature and publish more results in academia. Major universities should also make possible predictions in order to establish a preliminary understanding of their future and make more informed plans for the future development of schools and researchers. In the future, with the development of Metaverse, Web 3.0 and other technologies [4, 9, 6], the visual analysis of scientific researchers will also display their research level and achievements more intuitively and accurately.
References
- [1] George H. Chen “A General Framework for Visualizing Embedding Spaces of Neural Survival Analysis Models Based on Angular Information”, 2023 arXiv:2305.06862 [stat.ML]
- [2] Shenghui Cheng and Klaus Mueller “The Data Context Map: Fusing Data and Attributes into a Unified Display” In IEEE Transactions on Visualization and Computer Graphics 22.1, 2016, pp. 121–130
- [3] Shenghui Cheng, Wei Xu, Wen Zhong and Klaus Mueller “A Data-Driven Approach for Mapping Multivariate Data to Color”, 2016 arXiv:1608.05772 [cs.GR]
- [4] Shenghui Cheng et al. “Roadmap toward the metaverse: An AI perspective” In The Innovation 3.5 Elsevier, 2022, pp. 100293
- [5] Qu Dan “Research on the Application of Data Mining Technology in Human Resource Management in Universities” In Computer Knowledge and Technology 10.2182-2183+2198, 2014
- [6] Yuqing Fan, Tianyi Huang, Yiran Meng and Shenghui Cheng “The current opportunities and challenges of Web 3.0”, 2023 arXiv:2306.03351 [cs.CY]
- [7] Xu Feng “Construction of Human Resource Performance Management System: From the Perspective of Competency Model” In Entrepreneur Economy 31.68-71, 2012
- [8] Tianyi Huang, Shenghui Cheng, Stan Z. Li and Zhengjun Zhang “High-dimensional Clustering onto Hamiltonian Cycle”, 2023 arXiv:2304.14531 [cs.AI]
- [9] Tianyi Huang, Stan Z. Li, Xin Yuan and Shenghui Cheng “Roadmap towards Meta-being”, 2023 arXiv:2303.06795 [cs.CY]
- [10] Janus Jakobsen, Christian Gluud, Jørn Wetterslev and Per Winkel “When and how should multiple imputation be used for handling missing data in randomised clinical trials - A practical guide with flowcharts” In BMC Medical Research Methodology 17, 2017
- [11] Qiu Junping and Liao Wenting “The Application of H-index in Talent Evaluation – A Case Study of Chinese Scholars in the Field of Library and Information Science” In Science Focus, 2007
- [12] Ren Kanglei “Quantitative Management and Data Analysis of Human Resources” Beijing: Poststelicommunications Press, 2019
- [13] Fu Leiming, Yang Ming, Wang Zhaohua and Chen Yifei “RAC Index - A New Indicator for Improving the Fairness of Assessing the Influence of Scientific Researchers” In Journal of Intelligence 38.151-158, 2019
- [14] Zhang Lina and Xia Qingli “The Realistic Dilemma and Countermeasures of Human Resources Management in Colleges and Universities – Discussion on the informatization construction of Dang’an in colleges and universities based on Big data thinking” In Academic Forum 39.157-161, 2016
- [15] Cheng Liwei and Liuyudou “Analysis of the Core Competency of Enterprise Human Resources - On the Establishment of a Human Resource Competency Model” In Market Modernization, 2006
- [16] Zhang Liwen “General History of Chinese Learning” Beijing: People press, 2004
- [17] Liao Long “Human Resource Management and Research of University Teachers Based on Personnel Information Platform” In Chine Economist No.273.96-97, 2011
- [18] Alan M. MacEachren, Mark Gahegan and William Pike “Visualization for constructing and sharing geo-scientific concepts” In Proceedings of the National Academy of Sciences 101.1, 2004, pp. 5279–5286
- [19] Liu Shucai and Ge Lirong “Research on Human Resource Performance Management System Based on Competency Model” In China Economist No.232.182-183, 2008
- [20] Oleksandr Sokolov et al. “Scientists’ Contribution to Science and Methods of Its Visualization”, 2020, pp. 159–168
- [21] Yanli Wang et al. “Two-stage decomposition method based on cooperation coevolution for feature selection on high-dimensional classification” In Ieee Access 7 IEEE, 2019, pp. 163191–163201
- [22] Qin Xiaoyan and Chujingli “Research and Enlightenment on Data Scientist Competency Systems Abroad” In Library and Information Service 61.40-50, 2017
- [23] Xu Xin and Xu Yifang “Ht index - H-index correction based on time dimension” In Journal of the China Society for Scientific and Technical Information 33.605-613, 2014
- [24] Gu Yansheng, Wang Guixia and Zhao Mingkai “Analysis of the Current Situation and Countermeasures of Human Resource Management in Universities” In Chine Economist No.320.238-239, 2015
- [25] Hu Yanxi and Guan Zhihua “A Review of Research on Competency Models at Home and Abroad” In Market Modernization No.556.248-250, 2008
- [26] Liu Yong “Innovative application and potential dilemma of Big data in human resource management” In Human Resource Management No.105.11-12, 2015
- [27] Li Yue “The Application of Competency Model in Performance Management” In Talent Exploitation, 2006
- [28] Zelin Zang et al. “EVNet: An Explainable Deep Network for Dimension Reduction”, 2022 arXiv:2211.15478 [cs.LG]
- [29] Yao Zhanlei, Chen Honglin and Xu Xin “Research on Classification and Grading Evaluation of Scientific Research Talents” In Journal of Southwest Minzu University(Humanities and Social Sciences Edition) 41.234-240, 2020
- [30] Li Zhengfeng “The Inheritance and Innovation of the Chinese Scientists’ Academic Thoughts: Concepts,Features and Methods” In Nanjing Social science No.294.1-8+17, 2012
- [31] Wang Zhijun and Zheng Dejun “An Empirical Study on the Effectiveness of P-Index in Talent Evaluation” In Library and Information Service 56.93-97, 2012