Through the Fairness Lens:
Experimental Analysis and Evaluation of Entity Matching
Abstract.
Entity matching (EM) is a challenging problem studied by different communities for over half a century. Algorithmic fairness has also become a timely topic to address machine bias and its societal impacts. Despite extensive research on these two topics, little attention has been paid to the fairness of entity matching.
Towards addressing this gap, we perform an extensive experimental evaluation of a variety of EM techniques in this paper. We generated two social datasets from publicly available datasets for the purpose of auditing EM through the lens of fairness. Our findings underscore potential unfairness under two common conditions in real-world societies: (i) when some demographic groups are overrepresented, and (ii) when names are more similar in some groups compared to others. Among our many findings, it is noteworthy to mention that while various fairness definitions are valuable for different settings, due to EM’s class imbalance nature, measures such as positive predictive value parity and true positive rate parity are, in general, more capable of revealing EM unfairness.
PVLDB Reference Format:
PVLDB, 16(10): , 2023.
doi:
††This work is licensed under the Creative Commons BY-NC-ND 4.0 International License. Visit https://creativecommons.org/licenses/by-nc-nd/4.0/ to view a copy of this license. For any use beyond those covered by this license, obtain permission by emailing info@vldb.org. Copyright is held by the owner/author(s). Publication rights licensed to the VLDB Endowment.
Proceedings of the VLDB Endowment, Vol. 16, No. 10 ISSN 2150-8097.
doi:
PVLDB Artifact Availability:
The source code, data, and/or other artifacts have been made available at https://github.com/UIC-InDeXLab/fair_entity_matching.
1. Introduction
Entity matching (EM) seeks to match pairs of entity records from (the same or different) data sources that refer to the same real-world entity. EM is very useful in many applications domains, including (a) healthcare, where matching of patient records from different healthcare facilities (e.g., emergency rooms, hospitals, etc.) can be used to determine if they refer to the same real-world person; (b) airline security, where airline passenger records are matched against no-fly list records to identify people who should be prevented from boarding flights or should undergo additional screening; (c) e-commerce, where product records from different retailers’ websites can be matched to identify popular products and fraudulent knockoffs; and so on.
EM is a challenging problem that has been extensively investigated for over half a century by different communities, e.g., statistics, databases (DB), natural language processing (NLP), and machine learning (ML), resulting in a variety of techniques proposed in the literature for addressing this problem. These challenges arise because entities in autonomous data sources can be represented in a variety of ways (e.g., highly structured records versus textual descriptions), using different conventions (e.g., the many ways in which person names and postal addresses are represented), data quality issues (e.g., misspellings, missing values), and so on. A consequence is that, despite significant advances in recent years (especially with recent neural techniques like Ditto (Li et al., 2020a)), EM techniques still result in both false positives (non-matching record pairs that are declared as matches) and false negatives (matching record pairs that are declared as non-matches). These errors can have serious consequences in practice, as seen in the following examples.
Example 1.
(No-fly list) Consider the airline security application, which aims to identify passengers that are likely to be dangerous (e.g. terrorists) for screening and potentially preventing them from boarding the flights. Using a dataset of criminal records called the no-fly list, passenger names (and other information) are matched against the no-fly list for this purpose. False positives in airline security can lead to significantly inconveniencing passengers. On the other hand, false negatives can result in known terrorists being permitted to board flights with undesirable consequences. Due to historical biases, the no-fly list datasets could over-represent some minority groups in comparison to society’s population distribution. This, as we shall evaluate in our experiments, can result in higher false positive rates for those demographic groups. Another potential issue is that some demographic groups have more similar names. Hence, passengers from those groups may have a higher chance of having the same or similar information to those of known terrorists, which in turn will cause higher false positive rates for them.
In Example 1, getting (falsely) matched is harmful. We next show an example where not getting matched can be harmful.
Example 2.
(High-value customers list) Upselling to potentially high-value customers is critical for many businesses such as the fashion industry, airlines, and tourism. Suppose business acquires a list of names of high-value customers from other businesses. Business uses EM techniques to match its own customers against list and sends exclusive offers to upsell to the matching cases in order to prioritize them. Unlike the previous example, in this case, over-representation in the high-value customer’s list is beneficial. However, unlike the no-fly list, the privileged group(s) are likely to be over-represented and minority groups under-represented in the list . As a result, a lower (true and false) positive match rate is expected for minority groups and they end up receiving fewer exclusive offers, resulting in biased advertising (Miller and Hosanagar, 2019; Advertising, 2022; Bach and Bernat, 2022).
When such disparities (e.g., false positives) occur in a systematic way for some demographic (sub-)groups, thereby disadvantaging them over others, concerns about the fairness of EM techniques arise. While the fairness of ML models has been the topic of much recent work in the literature (Barocas et al., 2019; Dwork et al., 2012; Feldman et al., 2015; Zhang et al., 2021; Feldman et al., 2015; Zafar et al., 2017; Hardt et al., 2016; Zemel et al., 2013; Kusner et al., 2017), not much attention has been paid to the fairness of EM techniques.
In this paper, we seek to address this gap in the literature and perform an extensive experimental evaluation and analysis of a variety of EM techniques on a range of datasets through the fairness lens. Traditionally, blocking may precede matching to reduce the space of possible matching candidates from quadratic to sub-quadratic, e.g., linear. A rich body of research focuses on blocking algorithms (Papadakis et al., 2016, 2020; Li et al., 2020b; Christophides et al., 2020). In this paper, our goal is to audit off-the-shelf entity matching systems used in practice. As such, our evaluation and analysis are performed on end-to-end matching systems which may include their own built-in blocking algorithms.
Summary of Contributions: In summary, we make the following technical contributions in this paper:
-
•
Given the pairwise nature of EM, we propose the use of single fairness and pairwise fairness to evaluate entity matchers. We adopt 11 popular fairness measures from the literature for this task and analyze their suitability for EM.
-
•
We select a suite of 13 EM techniques (including 1 declarative rule-based technique, 7 non-neural ML techniques, and 5 neural ML techniques) and 6 benchmark datasets (including 2 structured datasets, 2 textual datasets, and 2 dirty datasets) that have been used in prior work on entity matching for fairness evaluation.
Using publicly available individual-level data, we also created and used two semi-synthetic matching social datasets for fairness evaluation. These datasets are shared publicly as benchmarks for auditing the fairness of matchers.
-
•
We evaluated all combinations of EM techniques, datasets, and fairness measures and analyzed the outcomes to obtain generalizable results. We classified the results into four cases based on whether an (EM technique, dataset, or fairness measure) yielded (i) accurate or inaccurate matching results, and (ii) fair or unfair matching results. Interestingly, all four classes contained configurations involving ML-based classifiers.
Some of our findings in this study are as follows:
-
–
Our results on social data confirm matching unfairness when (i) there are higher similarities among records of a certain group, (ii) the representation of demographic groups in data is biased.
-
–
Our results underscore that responsible EM requires training data that is representative of different possibilities from various (demographic) groups.
-
–
While different fairness measures are valuable for different settings, due to the class-imbalance property of EM, measures such as positive predictive value parity and true positive rate parity are more capable of revealing EM unfairness.
-
–
Significantly relying on proxy attributes such as name, can cause unfairness in non-neural models. On the other hand, relying on pre-trained language models and embeddings, or not fully considering the dataset structure can cause unfairness in neural matchers.
We use our findings and lessons learned to put together a set of rules of thumb for responsible entity matching (Table 8).
-
–
2. Related Work
Fairness in entity resolution (ER) has briefly been studied in the literature. In (Efthymiou et al., 2021), a constraint-based formulation for fairness is proposed to mitigate bias in ER tasks by ensuring that all (sub-)groups have the same opportunity to be resolved. Furthermore, (Makri et al., 2022) proposes a (sub-)group-based training for different ethnicities in order to increase both accuracy and fairness in SVM-based ER which is consistent with our suggestion to use ensemble learning for EM. Finally, in a parallel work (Nilforoushan et al., 2022), the authors propose an AUC-based fairness definition for EM and ER tasks and try to resolve the bias issues through a data augmentation solution. To the best of our knowledge, we are the first to comprehensively audit off-the-shelf entity matching models for fairness and propose proper measures, datasets, and comparison angles fitting the problem settings given the inherent differences with typical machine learning tasks that have so far been studied.
3. Fairness Evaluation Framework
3.1. Background
Given two sets of records and , the EM problem is to identify all correspondences between record pairs in that correspond to the same real-world entity. A correspondence interrelates two records and with a confidence value that indicates the similarity of and or the confidence of a matcher about and referring to the same entity (Köpcke and Rahm, 2010). To decide whether the record pair of is a match or non-match, matchers often apply a threshold on (Yu et al., 2016; Barlaug and Gulla, 2021). We decouple the choice of a threshold from the outcome of the matching and consider the outcome of an EM task as pairs of matching and non-matching records. Formally, we consider the following EM problem:
Definition 0 (Entity Matching Problem).
Consider two sets of records and . For every pair of records , let be the ground-truth label indicating if and refer to the same entity. Given all pairs , the EM problem is to predict with a label . That is, refers to the decision of the matcher about the label of and (match or non-match).
In a fairness-sensitive setting, records are accompanied by sensitive attributes (e.g. gender, country, race, etc.). Let be the sensitive attributes, be the domain of , and be the set of all groups of interest, i.e. . The mapping relates a record to its associated groups . In other words, is the group that belongs to. Given two sets of records and and the set , we would like to audit the fairness of a matcher with respect to groups.
3.2. Single and Pairwise Lens
3.2.1. Group Selection
The first step in auditing an entity matcher for fairness is identifying meaningful (sub-)groups in sensitive attributes. An input dataset to a matcher includes record ids, the value ((sub-)group) of each record for sensitive attributes, the decisions of , as well as true labels for the record pairs. Depending on the type, cardinality, and the number of sensitive attributes, multiple fairness cases may happen that are presented in Table 1.
| Type | Description | Example |
|---|---|---|
| Single Attribute w/ Binary Values | Each record belongs to one of | attribute: gender={male, female} |
| two groups in the attribute domain. | group(e) = {female} | |
| Single attribute w/ multiple | Each record belongs to exactly | attribute: gender={male, female, transgender, non-binary, other} |
| exclusive values | one group in the attribute domain. | group(e) = {non-binary} |
| Single setwise attribute | Each record belongs to a subset of | attribute: genre={Pop, Rock, Jazz} |
| values in the attribute domain. | group(e) ={Pop, Rock} | |
| Multiple attributes | Groups could be either one or | attributes: genre and gender |
| a combination of the three cases above. | group(e) = {male-Pop, male-Rock, male-Jazz} |
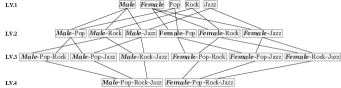
The space of groups for a single attribute with binary or multiple values is the domain of the corresponding attribute. In multiple-attribute settings, we can define intersectional subgroups, as the cartesian product of group values. The subgroups can be presented in a hierarchical data structure, where the first level includes all groups (of all attributes), while the -th level includes the set of non-overlapping groups created by combining groups from different attributes. When one attribute is of the single setwise type, level includes groups from the setwise attribute with one group from a binary or multi-value attribute.
Example 2.
Figure 1 shows the intersectional subgroup hierarchy of sensitive attributes gender and genre for a dataset that matches songs of different artists. Note that gender is a binary attribute and genre is a setwise attribute. The level- of this hierarchy includes all combinations of groups from gender and genre in level-. Level- enumerates -combinations of the domain of genre with groups from gender.
Note that a subgroup hierarchy represents the space of groups and does not mean a data set must or does contain all these groups. In addition to enabling fairness audit on a particular group selected by a user, we allow batch auditing subgroups of each level. That is, a matcher’s fairness is evaluated for all subgroups of a particular level selected by a user.
3.2.2. Single and Pairwise Fairness Evaluation
Given the pairwise nature of EM tasks, there are two ways to audit entity matchers:
-
•
Single Fairness: The performance of a matcher is evaluated for one group against either record in a pair. Given a correspondence and a group of interest, is legitimate, if either or belong to group .
-
•
Pairwise Fairness: The performance of a matcher is evaluated for a pair of groups against both records in a pair. Given a correspondence and a pair of groups of interest, is legitimate, if belongs to and belongs to , or vice versa. From an encoding perspective, we concatenate the encodings of groups and into a vector and the encodings (explained in the technical report (Shahbazi et al., 2023a)) of and into a vector and validates vector belongs to with both directions of and .
We consider the EM task to be symmetric in single and pairwise fairness definitions. We remark that these definitions can be extended to ordered single and ordered pairwise fairness where the groups are defined on left or right records. In this paper, we focus on non-directional single and pairwise fairness.
3.3. Correctness
The correctness of a matcher measures how well its matching predictions conform with the ground-truth. Given a test dataset with correspondences of , where is a binary variable indicating the result of EM (match or non-match) for records with encodings and , and is a binary variable indicating the ground-truth for matching, we profile predictions of using the numbers of true positives (TP), true negatives (TN), false positives (FP), and false negatives (FN), respectively. Unlike a classification task, in the confusion matrix of a matching task, the result is counted both for the group(s) of and the group(s) of . For further explanations, please refer to the technical report (Shahbazi et al., 2023a).
3.4. Fairness Measures
Similar to many of the existing works on algorithmic fairness and responsible data science (Shetiya et al., 2022; Nargesian et al., 2021; Calmon et al., 2017; Asudeh et al., 2019a; Celis et al., 2019; Feldman et al., 2015; Hardt et al., 2016; Swift et al., 2022), we use the terms bias and unfairness interchangeably to refer to when a matcher is not fair. At a high level, fairness definitions can be viewed from three perspectives: group, subgroup, and individual fairness (Barocas et al., 2019). The most granular notion of fairness is individual fairness that requires similar outcomes for similar individuals (Dwork et al., 2012). The more popular perspective of fairness, (sub)group fairness, requires similar treatment for different (sub)groups. A model/algorithm satisfies some fairness constraints if it has equal or similar performance (according to some fairness measure) on different (sub)groups. The focus of this paper is on (sub)group fairness. Most of the group fairness measures belong to one of the following four categories (Barocas et al., 2019; Asudeh and Jagadish, 2020). (1) Independence requires independence of analysis outcome from demographic groups. (2) Separation requires independence of the outcome from demographic groups conditioned on the target variable. (3) Sufficiency requires independence of the target variable from demographic groups conditioned on the outcome. (4) Causation requires that in a counterfactual world, the decision would not change had the individual belonged to a different demographic group. Since we only assume access to a matcher’s decisions and true labels, we do not consider Causal fairness in our audit. In Table 2, we present our suite of fairness measures, adapted from the notions of fairness in classification (Barocas et al., 2019), for auditing an entity matcher for a set of (sub)groups.
| Name | Description | Equation () |
|---|---|---|
| Accuracy Parity (AP) | requires the independence of matchers’s accuracy from groups | |
| Statistical Parity (SP) | requires the independence of the matcher from groups | |
| 111This measure is only meaningful for (a) single fairness and (b) pairwise fairness cases when groups are overlapping.True Positive Rate | a.k.a Equal Opportunity; in the group of true matches | |
| Parity (TPRP) | requires the independence of match predictions from groups | |
| False Positive Rate | in the group of true non-matches, requires | |
| Parity (FPRP) | the independence of match predictions from groups | |
| 111This measure is only meaningful for (a) single fairness and (b) pairwise fairness cases when groups are overlapping.False Negative Rate | in the group of true matches, requires | |
| Parity (FNRP) | the independence of non-match predictions from groups | |
| True Negative Rate | in the group of true non-matches, requires | |
| Parity (TNRP) | the independence of non-match predictions from groups | |
| 111This measure is only meaningful for (a) single fairness and (b) pairwise fairness cases when groups are overlapping.Equalized Odds (EO) | in both groups of true matches and true non-matches | |
| requires the independence of match predictions from groups | ||
| 111This measure is only meaningful for (a) single fairness and (b) pairwise fairness cases when groups are overlapping.Positive Predictive | among the pairs predicted as match | |
| Value Parity (PPVP) | requires the independence of true matches from groups | |
| 111This measure is only meaningful for (a) single fairness and (b) pairwise fairness cases when groups are overlapping.Negative Predictive | among the pairs predicted as non-match, requires | |
| Value Parity (NPVP) | the independence of true non-matches from groups | |
| 111This measure is only meaningful for (a) single fairness and (b) pairwise fairness cases when groups are overlapping.False Discovery Rate | among the pairs predicted as match, requires | |
| Parity (FDRP) | the independence of true non-matches from groups | |
| 111This measure is only meaningful for (a) single fairness and (b) pairwise fairness cases when groups are overlapping.False Omission Rate | among the pairs predicted as non-match, requires | |
| Parity (FORP) | the independence of true matches from groups |
3.5. Selecting Fairness Measures for EM
Depending on the context of an EM task at hand, proper fairness measures should be employed. Besides, a major difference between EM and regular classification tasks is that the input to EM tasks is a pair of records. Due to its pairwise matching nature, class imbalance is a distinguishing property of EM, compared to regular classification tasks. To better explain this, let us consider a toy example, where two data sources and contain exactly the same set of records. Each pair of records and is passed as an input to an entity matcher. In this setting, only of the pairs are matches, and the others are non-matches. In other words, the probability a random pair is a match is as low as . Class imbalance is also a challenge in some of classification problems but the degree of imbalance is often constant while in EM tasks, it is as high as . Indeed, blocking techniques (Papadakis et al., 2020) can help in reducing the extreme class imbalance. Even after blocking, a high class imbalance is expected for EM tasks.
Guide for Practitioners: Let us consider the fairness measures in Table 2. Which measures to choose depends on the downstream task and the problem context. Therefore, practitioners should choose measures depending on the importance of TPs (true match), FPs, FNs, and TNs in the problem context. For example, among the fairness measures, statistical parity does not consider the ground-truth labels and requires equal match ratios from different groups, independent of whether they really are a match or not. As a result, this measure (and other measures in the independence category) does not seem reasonable for deduplication tasks using EM. On the other hand, it may be useful to ensure equal representation of different groups when using EM for joining tables.
When the input to the EM task is imbalanced and most of the pairs are non-matches, some measures are more capable of revealing the unfairness of matchers. First, note that even a matcher that marks all pairs as non-matches has high accuracy in this setting. Subsequently, accuracy parity may not reveal the unfairness. Similarly, measures such as FPRP and TNRP may fail to reveal unfairness in detecting true matches. In these settings, the fairness measure for successfully discovering these events is Positive Predictive Value Parity (PPVP). Another important measure in this context is True Positive Rate Parity (TPRP), a.k.a Equal Opportunity, which focuses on correct match predictions among the (rare) true matches. These recommendations are consistent with our comprehensive experiments on several data sets, in § 5, where PPVP and TPRP were the two measures that could reveal the unfairness of the matchers.
We also note that some of the measures cannot be applied in pairwise fairness scenarios where conceptually, the equality of groups restricts matching results. In some scenarios, two records with different groups can never be considered match in the ground-truth. For instance, in a matching task defined between DBLP and ACM publications, two records with different venues (after standardization) are never a true match. More concretely, when pairwise fairness is evaluated on non-overlapping groups, TPs and FNs are always zero; hence, measures based on TPs and FNs become inapplicable.
3.6. Measuring Unfairness
Consider a fairness notion and a group . In a perfect situation, the matcher should satisfy the parity (equality) between two probabilities in the following form: , where and are specified by the fairness measure. For example, for Positive Predictive Parity, is and is . On the other hand, due to the trade-offs (Kleinberg et al., 2016) between different fairness notions and the impossibilities theorems (Chouldechova, 2017), it is often not possible to satisfy complete parity on all fairness measures. As a result, the objective is to make sure that disparity (also known as unfairness) is less than a given threshold for a matcher to be fair. Given a fairness notion and a group , one way to compute disparity is to use subtraction (Bellamy et al., 2018), as follows.
| (1) |
For example, for accuracy parity ( is and is null), the disparity can be computed as follows.
| (2) |
Alternatively, given a fairness notion and a group , the disparity can be computed using division (Feldman et al., 2015) , as follows.
| (3) |
Guide for Practitioners: When evaluating the unfairness of a matcher, the objective is to determine whether unfairness is less than a given threshold. For example, the 20% rule (Feldman et al., 2015) suggests the threshold as . Note that if the accuracy for the group is higher than the average accuracy of the matcher, it is not considered as unfairness. Also, note that Equation 1 considers the higher the probability, the better. Depending on fairness measures (and application), the direction may be as the lower the probability, the better. For example, for FNRP, a lower probability of a false negative is preferred. For such cases, one should consider . As a result, for false negative rate ( is and is ) the disparity can be computed as
| (4) |
Similar to Equation 1, Equation 3 also considers the higher the probabilities the better. For the cases (such as FNRP or FDRP) where the lower probabilities are better, one should swap the numerator and the denominator in the equation. Therefore, for false discovery rate ( is and is ) the disparity can be computed as
Our proposal in this paper is agnostic to the choice of operation for computing the disparities. Still, in our experiments, without any preference, we use subtraction to compute the disparities.
4. Entity Matching Approaches
The existing techniques for EM fall into one of the following three categories: 1) declarative rule-based, 2) ML-based, and 3) crowd-sourcing-based approaches. The last class of techniques relies on crowd-worker knowledge for EM tasks and we do not include them in our analysis. From each of the remaining categories, we select a few important matchers to be assessed for fairness. The specifications of the evaluated matchers are presented in Table 3.
4.1. Rule-based Matchers
Rule-based approaches perform EM based on the conjunction/disjunction of a few logical predicates, each specifying a matching condition. Each matching condition consists of a similarity measure (e.g., Hamming, cosine, Levenshtein, Jaccard, etc.) computed between record pair columns, a comparison operator (e.g., ¡, =, ¿), and a threshold value specifying the similarity value. Rule-based matchers are scalable to large settings and provide results that are explainable. However, they highly depend on human experts with relevant domain knowledge to assist with rule specification. For more information on rule specification in EM, we would like to direct the reader to (Wang et al., 2011; Singh et al., 2017; Panahi et al., 2017; Paganelli et al., 2019).
4.2. ML-based Matchers
A crucial part of rule-based matching that affects the overall correctness of the task is the selection and configuration of the rules used for comparison. This task is difficult and laborious even for domain experts. ML-based supervised EM approaches reduce the associated manual labor by benefiting from the training data at hand. They significantly reduce the rule discovery efforts by extracting fitting parameters (e.g., model weights) from the data. However, preparing the training data itself imposes an additional cost. Furthermore, such techniques are computationally expensive (demanding a blocking phase to reduce the search space) (Köpcke and Rahm, 2010) and are less explainable on account of using black-box classification methods (Barlaug, 2022; Wang and Li, 2022). Depending on the employed classification technique, ML-based matchers belong to one of the non-neural or neural categories.
4.2.1. Non-neural Matchers
This category of matchers uses traditional ML algorithms such as decision tree, SVM, etc., to decide whether or not a pair of records is a match. Since the number of meaningful insights that can be extracted from data and fed as features to the learning algorithm are limited to word-level similarity metrics and TF-IDF scores, non-neural matchers may not perform well for cases where datasets are less structured, and column values are more in a textual format consisting of long spans of text.
4.2.2. Neural Matchers
Deep learning techniques have recently shown promising results in NLP applications. Due to the growing demand for matching textual data instances, it only makes sense to adopt such techniques where the other approaches usually fall short. Deep learning methods transform text into numerical values using character/word embeddings often through pre-trained embedding models such as word2vec (Mikolov et al., 2013), GloVe (Pennington et al., 2014), fastText (Bojanowski et al., 2016). Due to the sequential nature of text, to better capture the semantics of the data, sequence models such as RNN and its variants (e.g., LSTM, GRU, etc.), where prior sequences of inputs can affect the current input and output, are utilized (Barlaug and Gulla, 2021). Further improvement mechanisms such as attention (Vaswani et al., 2017), pre-trained language models (Devlin et al., 2018), domain knowledge injection, data augmentation, summarization, etc., deliver further insights into the models to make better matching decisions. The superiority of neural matchers for textual and dirty data sets has been pointed out in the existing research (Mudgal et al., 2018). However, there are associated challenges, such as high computation costs and large training data requirements, making them not suitable for every EM scenario.
| Name | Type | Description |
|---|---|---|
| BooleanRuleMatcher (Konda, 2018) | Rule-based | Conjunction of rules defined using a similarity measure, a comparison operator, and a threshold value |
| between the record pair columns, part of Magellan framework | ||
| Dedupe (Gregg and Eder, 2022) | Non-neural | Uses regularized logistic regression for agglomerative hierarchical clustering of records |
| DTMatcher (Konda, 2018) | Non-neural | Uses decision tree classifier for matching, part of Magellan framework |
| SVMMatcher (Konda, 2018) | Non-neural | Uses SVM classifier for matching, part of Magellan framework |
| RFMatcher (Konda, 2018) | Non-neural | Uses random forest classifier for matching, part of Magellan framework |
| LogRegMatcher (Konda, 2018) | Non-neural | Uses logistic regression classifier for matching, part of Magellan framework |
| LinRegMatcher (Konda, 2018) | Non-neural | Uses linear regression classifier for matching, part of Magellan framework |
| NBMatcher (Konda, 2018) | Non-neural | Uses naive bayes classifier for matching, part of Magellan framework |
| DeepMatcher (Mudgal et al., 2018) | Neural | Provides a variety of deep learning approaches such as aggregation-based, RNN-based, attention-based and, |
| hybrid (RNN+attention) to learn latent semantic features for a pair of records | ||
| Ditto (Li et al., 2020a) | Neural | Deep learning approach utilizing pre-trained transformer-based language models and optimizing |
| performance using domain knowledge injection, text summarization, and data augmentation techniques | ||
| GNEM (Chen et al., 2021) | Neural | One-to-set neural framework (unlike remaining pairwise solutions) benefiting from graph neural networks |
| HierMatcher (Fu et al., 2021) | Neural | Deep learning approach based on RNN, attribute-aware attention mechanism and cross attribute |
| token alignment, built on top of DeepMatcher framework | ||
| MCAN (Zhang et al., 2020) | Neural | Deep learning approach based on RNN and multi-context attention mechanisms such as self-attention, |
| pair-attention, global-attention, and gating mechanism, built on top of DeepMatcher framework |
| Name | Repository | Domain | Type | Train | Test | % Pos. | # Attr. | Sens. Attr. | Sens. Attr. Type |
|---|---|---|---|---|---|---|---|---|---|
| FacultyMatch | Population | Structured | 271108 | 1084432 | 0.21% | 2 | country | Single attr. w/ binary values | |
| NoFlyCompas | Population | Structured | 20122 | 75459 | 0.63% | 3 | race | Single attr. w/ binary values | |
| iTunes-Amazon | Magellan | Music | Structured | 321 | 109 | 24.7% | 8 | genre | Single setwise attr. |
| Dblp-Acm | Magellan | Publications | Structured | 7417 | 2473 | 17.9% | 4 | venue | Single attr. w/ multiple exclusive values |
| Dblp-Scholar | Magellan | Publications | Dirty | 225 | 100 | 19% | 10 | entry type | Single attr. w/ multiple exclusive values |
| Cricket | Magellan | Sports | Dirty | 2277 | 1013 | 96.5% | 20 | batting style | Single attr. w/ binary values |
| Shoes | WDC | Products | Textual | 24111 | 10717 | 10.3% | 1 | company | Single attr. w/ multiple exclusive values |
| Cameras | WDC | Products | Textual | 5476 | 2434 | 17.2% | 1 | company | Single attr. w/ multiple exclusive values |
5. Evaluation and Analysis
5.1. Evaluation Plan
To evaluate the matchers for fairness, we investigate the performance of matchers in terms of single and pairwise fairness for all valid groups in the datasets w.r.t. a variety of fairness definitions. To present a side-by-side comparison and visualization, we aggregate the results based on the dataset and the type of fairness (i.e., single and pairwise). Next, we look into some of the identified discriminated groups from different settings and investigate the reasoning behind the unfair behavior of matchers.
5.1.1. Experimental Settings
We conducted the experiments on a 3.5 GHz Intel Core i9 processor, 128 GB memory, running Ubuntu. The evaluation framework was implemented in Python. We accessed the source code of the entity matchers either through the authors’ public GitHub or by directly contacting the authors.
5.1.2. Social Datasets.
The concept of fairness holds significant societal implications and carries more significance when studied on the individual records. Unfortunately, public access to such data, especially demographic information, is restricted owing to privacy concerns. Therefore, we construct semi-synthetic datasets based on two publicly available real-world datasets CSRankings and Compas (COM, 2015). We selected these datasets based on our airline security example discussed in the introduction. Particularly, we want to evaluate the fairness of the matchers under two conditions: (a) when two demographic groups have different degrees of similarities in their names, and (b) when there is an over-representation of some groups in the data. CSRankings222csrankings.org is a global ranking system that evaluates computer science departments based on the scholarly research activities of their faculty members from universities across the world. CSRankings dataset is publicly available (CSR, 2023). For each faculty, in addition to their names, the dataset contains other information such as affiliation country. Having observed various name similarities between different geographical regions, we found this dataset as a good candidate for evaluating (a). Compas, on the other hand, is a public dataset of criminal records that has been widely used in Fair ML research. In addition to names and other information, the dataset contains demographic information for each individual. The dataset over-represents Black/African-Americans, which makes it a good candidate for evaluating (b).
To create our first EM dataset FacultyMatch based on CSRankings, we do the following steps333Semi-synthetic data generators are available for public access in (InDeXLab, 2023).:
-
•
Using fullName and country for matching, we only focus on two demographic groups of faculties working in Germany de and China cn.
-
•
We perform a Cartesian product on the sample and label each pair as a match if left and right records have identical scholarIDs.
-
•
We perturb the values of fullName column for the right-side records which involve randomly adding, removing, or replacing a random character in the cell.
Following our motivating example in the introduction, we create NoFlyCompas, a no-fly list scenario based on Compas:
-
•
Using firstName, lastName, and race for matching, we focus only on individuals that are either Caucasian or Black/African-American.
-
•
We create the no-fly list by taking a uniform sample from Compas comprising of 48% Caucasian records and 52% Black/African-American (the distribution of the two groups in the Compas dataset).
-
•
In accordance with the racial distribution of the U.S. population as reported by the Census Bureau Data (usC, [n.d.]), we create a passenger table by taking a sample from Compas that includes 80% Caucasian and 20% Black/African-American individuals.
-
•
We perform a Cartesian product on the two tables and label each pair as a match if left and right records have identical personIDs.
-
•
Similar to the aforementioned process for FacultyMatch, the right records (that correspond to the no-fly list table) undergo perturbation in the firstName and lastName columns.
5.1.3. Complementary Datasets.
Data in the context of EM tasks usually fall into one of the following categories:
-
•
Structured: In this category of datasets, attribute values are atomic, meaning that they cannot be broken into multiple values. Furthermore, there are no missing values in the data.
-
•
Dirty: This category of datasets is similar to structured datasets; however, they include far too many random missing values in their columns. Therefore an attribute value may appear for a record while it does not exist for another one.
-
•
Textual: Textual datasets are made of a single attribute per record containing a textual description.
For the completeness of our experiments, we select several datasets from each category on which we evaluate the matchers. The complementary datasets are chosen from WDC (Primpeli et al., 2019) and Magellan (Mudgal et al., 2018) repositories which are the standard benchmark corpora used in EM literature. Aside from the dataset type, we carefully handpicked the datasets w.r.t. domain, sensitive attribute type, and ground-truth class balance to cover a variety of possible settings. For the textual datasets Shoes and Cameras, we extract the manufacturer of the corresponding product from the description as the sensitive attribute. Table 4 shows the details of the selected datasets.
5.1.4. Entity Matchers
To cover the breadth of existing methods in our experiments, we picked 13 EM tools from each of the discussed approaches (1 rule-based, 7 non-neural, and 5 neural). The selection criteria included the public availability and error-free execution of the source codes. To ensure the satisfactory performance of the entity matchers, we took the following steps:
BooleanRuleMatcher
We used the automatic feature generation tool provided in the Magellan library to extract features based on the similarity of the columns in the input table w.r.t. multiple distance measures. Next, we handpick some of the generated features based on which we declare matching conditions. For each attribute, the generator creates multiple features based on different distance measures. Depending on the attribute involved in the generated features, we either use the exact match of the attribute values (for attributes with short and atomic values, e.g., year) or choose one of the distance-based features (e.g. cosine similarity between left and right attribute values) with a similarity threshold of greater than 0.5 (for attributes with longer values, e.g., paper title).444Details on the specified rules for each dataset are provided in the GitHub repository.
Non-neural Matchers
For all non-neural matchers except for Dedupe, we used the automatic feature generation tool in the Magellan library. Next, all of the generated features are fed to the models for training. Dedupe’s active learning component requires manual labeling of difficult record pairs, which is an uphill task. To bypass this step, we converted the training data into Dedupe’s generated cache file format and utilized the entire training samples to keep the experiment consistent with the other matchers. Finally, Dedupe did not scale for FacultyMatch, NoFlyCompas, Shoes and Cameras.
Neural Matchers
We tuned the hyper-parameters of all the matchers according to their results on the validation set. For DeepMatcher, HierMatcher, and Mcan we trained the models for 10 epochs with a batch size of 16 and used fastText (Bojanowski et al., 2016) pre-trained word embeddings. We used the hybrid model of DeepMatcher that reportedly performs better than the other models. For HierMatcher, we used the attribute-aware attention mechanism. For Mcan, we utilized self-attention, pair-attention, global-attention, and gating mechanisms that reportedly would achieve the best results. For Gnem, we trained the GCN models for 10 epochs with a batch size of 2 and 768 nodes at each layer. For Ditto, we trained the models for 40 epochs with a batch size of 64 while using the DistilBERT language model and optimizations such as data augmentation, sequence summarization, and domain knowledge injection.
For all datasets except Cricket, we declare a pair of records as a “match” if the similarity between the two is greater than 0.5. Our choice of threshold value has a probabilistic interpretation of having a higher likelihood of being a match rather than being non-match. In other words, we follow a randomized rounding logic, where non-integer values in range are rounded to the closer integer. Moreover, we empirically observed that a reasonably high accuracy occurs among all the matchers with a threshold over , as shown in § 5.3.4. For the Cricket dataset, however, due to the high similarity of all pairs, we had to choose a higher similarity threshold of 0.9 because otherwise, all of the models would predict all pairs as “match”, which would affect the models’ correctness. As for the fairness threshold, we follow EEOC’s 80% rule (Commission, 1979), that only 20% disparity is tolerated.
5.2. Results for Social Cases
5.2.1. NoFlyCompas
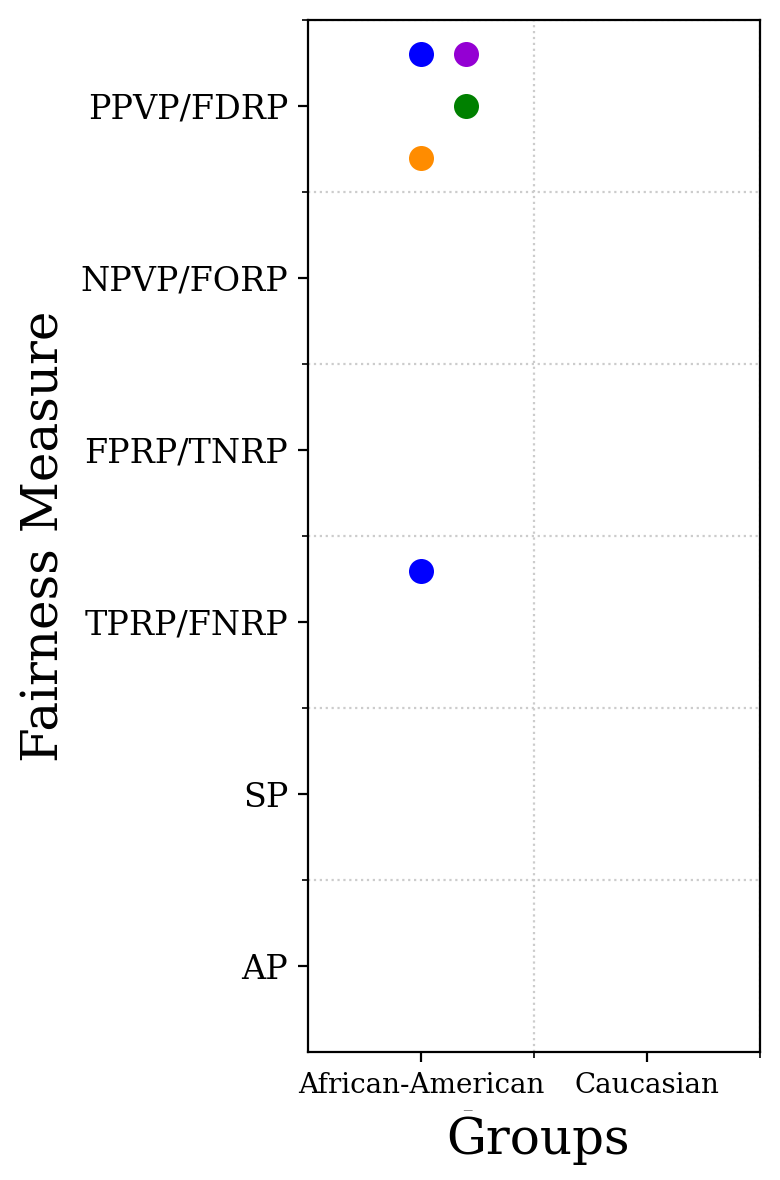
We begin our experiments by evaluating matchers’ fairness on our NoFlyCompas dataset. Recall that NoFlyCompas dataset is the matching between the no-fly list and the passengers list, where the two lists have different distributions of the demographic groups. In particular, while in the U.S. population (passenger list) the White population (75%) is significantly higher than the Black (13%), in the no-fly list Blacks are over-represented and the White and Black ratios are almost the same. It is common for a no-fly list to suffer from sampling bias. Table 5 includes the breakdown of experiment results. All the non-neural matchers had a perfect prediction performance, meaning that the TPR, FDR, and disparity values were 1.00, 0.00, and 0.00 respectively. Figure 3 reports the unfair matchers toward the African-Americans with respect to different measures.
Due to the disjoint nature of the binary-sensitive attribute race in our comparison, single and pairwise fairness results are identical and therefore we only report the single fairness results. The first observation is the superiority of non-neural matchers over neural matchers for this task, both on fairness and the overall performance. The higher performance of these models for structured datasets has previously been reported in (Mudgal et al., 2018), where the majority of non-neural matchers performed on par with or outperform the neural matchers. Next, by looking into the neural matchers in Table 5, we see a significant disparity against African-American group. More specifically, in terms of FDR the African-American to Caucasian ratio is between 1.11 to 3.8 (280% larger) across different matchers. This translates to a significantly higher chance of preventing an African-American person to board a flight or enter a country compared to a Caucasian person.
| TPR | Disparity | FDR | Disparity | |||||
| Matcher | Afr. | Cauc. | sub | div | Afr. | Cauc. | sub | div |
|---|---|---|---|---|---|---|---|---|
| DeepMatcher | 0.89 | 0.86 | -0.03 | -0.03 | 0.20 | 0.18 | 0.02 | 0.11 |
| Ditto | 0.76 | 0.82 | 0.06 | 0.08 | 0.31 | 0.22 | 0.09 | 0.41 |
| GNEM | 0.84 | 0.84 | 0.00 | 0.00 | 0.17 | 0.09 | 0.08 | 0.88 |
| HierMatcher | 0.72 | 0.74 | 0.02 | 0.10 | 0.22 | 0.16 | 0.06 | 0.38 |
| MCAN | 0.54 | 0.57 | 0.03 | 0.05 | 0.19 | 0.05 | 0.14 | 2.8 |
To better illustrate the root cause behind the disparity, let us highlight the following case that is falsely labeled as “match” by Ditto:
(left record) firstName: James lastName: Brown race: African-American
(right record) firstName: Samanthai lastName: Browne race: African-American
Some names are more common within certain demographic groups than others. For example, last names that are very common among black people include Brown, Jackson, Williams, Johnson, etc. Since the no-fly list in our NoFlyCompas dataset over-represents the Black group, for an individual in this group there is a higher chance of getting falsely labeled as a match.
5.2.2. FacultyMatch
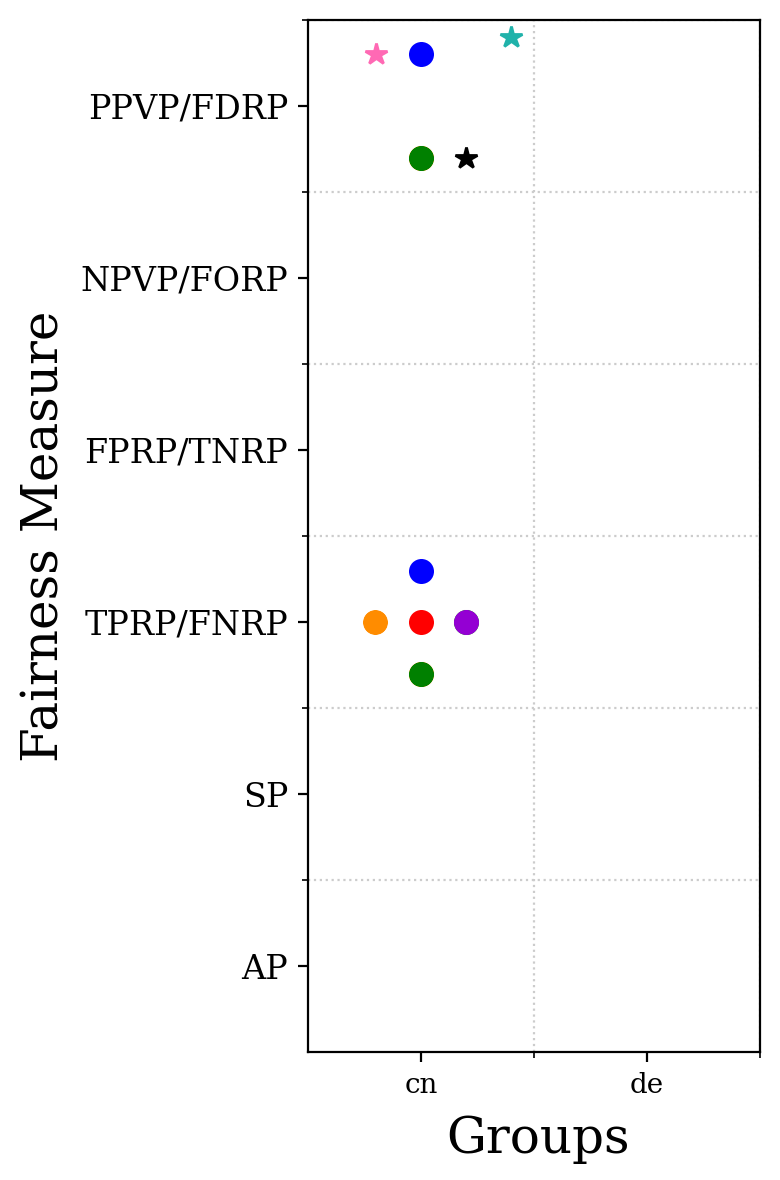
Having seen the impact of disproportionate representation of records in data w.r.t. the sensitive attributes, we turn our attention to another type of discrimination attributable to EM systems. Consider the FacultyMatch dataset described in § 5.1.2. There are 2,061 Chinese cn faculty members in this dataset compared to 1,595 German de ones. Therefore, when we create the EM dataset by performing the Cartesian product, the group of Chinese faculty members has the larger population in the dataset. To increase the population gap even wider, we remove 80% of the non-match pairs that have a German faculty member either on the right side or the left side. As a result, the number of Chinese pairs becomes more than 6 times the number of German pairs in the final sample ensuring proper representation. Next, using a variety of matchers, we conduct the matching task on the data and audit the matchers for fairness. Table 6 includes the breakdown of experiment results. Figure 3 reports the unfair matchers toward Chinese cn faculties with respect to measures. Overall, non-neural matchers outperform neural matchers in terms of model performance and fairness. Within the neural matchers we observe between 9% to 22% more prone to make an erroneous positive prediction (match) for the cn group. Further investigating the false-positives, we observed that those mostly include names that are very similar in the English transcription. An example of such cases (FP by Ditto) is brought in the following:
(left record) fullName: Qingming Huang country: cn
(right record) fullName: Qing-Hu Huang country: cn
Furthermore, the models make somewhere between 44% to 75% more mistakes in terms of false-negative predictions for the cn group. Due to the higher degree of similarities in Chinese names, models in general become more sensitive to minor differences and tend to mismatch. An example of such cases is the following:
(left record) fullName: LinLin Shen country: cn
(right record) fullName: Linlin phen country: cn
More extensive results on the overall performance of the matchers across social datasets are provided in (Shahbazi et al., 2023a).
| TPR | Disparity | PPV | Disparity | |||||
| Matcher | cn | de | sub | div | cn | de | sub | div |
|---|---|---|---|---|---|---|---|---|
| DeepMatcher | 0.48 | 0.72 | 0.23 | 0.50 | 0.79 | 0.87 | 0.08 | 0.11 |
| Ditto | 0.59 | 0.85 | 0.26 | 0.44 | 0.77 | 0.94 | 0.17 | 0.22 |
| GNEM | 0.78 | 0.90 | 0.12 | 0.15 | 0.83 | 0.92 | 0.08 | 0.11 |
| HierMatcher | 0.47 | 0.78 | 0.31 | 0.66 | 0.78 | 0.89 | 0.11 | 0.14 |
| MCAN | 0.40 | 0.70 | 0.30 | 0.75 | 0.86 | 0.94 | 0.08 | 0.09 |
| DTMatcher | 0.95 | 0.90 | -0.05 | -0.05 | 0.89 | 0.98 | 0.09 | 0.10 |
| LinRegMatcher | 0.33 | 0.23 | -0.09 | -0.43 | 0.44 | 0.96 | 0.52 | 1.18 |
| LogRegMatcher | 0.95 | 0.88 | -0.07 | -0.08 | 0.93 | 1.0 | 0.07 | 0.07 |
| NbMatcher | 0.99 | 0.99 | 0.00 | 0.00 | 0.03 | 0.58 | 0.55 | 18.3 |
| RfMatcher | 0.96 | 0.89 | -0.06 | -0.08 | 0.98 | 0.99 | 0.01 | 0.01 |
| SvmMatcher | 0.95 | 0.87 | -0.07 | -0.09 | 0.94 | 0.99 | 0.05 | 0.05 |
5.3. Comprehensive Results
This section provides a comprehensive evaluation of the matchers’ fairness and correctness using the benchmark datasets.
Summary of result: In summary, our results confirm the higher accuracy (§ 5.3.1) and fairness (§ 5.3.3) of neural matchers for textual and dirty data (Figure 13), and non-neural matchers for structured data (Figures 8 and 12). While heavily relying on problematic proxies hurts the fairness of non-neural matchers, not fully considering the dataset structure and heavily relying on semantic similarities and (biased) pretrained models hurts the fairness of neural matchers. TPRP and PPVP were more capable of revealing matching unfairness (§ 5.3.2). Finally, we observed a higher fairness sensitivity of neural matchers on matching thresholds (§ 5.3.4).
5.3.1. Correctness
Due to space limitations, here we present a summary of our correctness results. More extensive results on the overall performance of the matchers across the datasets, fairness and accuracy synergies, and detailed discussions can be found in the technical report (Shahbazi et al., 2023a). In summary, aligned with (Mudgal et al., 2018), throughout our extensive experiments, we observed that neural matchers are more accurate than non-neural matchers on textual and dirty data. Modern neural matchers draw on external knowledge by incorporating language models, which helps a matcher to learn the relevance of records despite the lack of structure and syntactic similarity in text records. This result is consistent with what is reported by the state-of-art matchers. On the other hand, our results corroborate that non-neural matchers are more accurate than neural matchers on structured data. Various combinations of correctness and fairness exist in EM as some matchers have low accuracy and F-1 score, while no unfairness issue is observed. This can be explained by the low accuracy of these matchers for all groups across the board which makes the disparity a low value. In Figure 4, we present a selective overview of the unfairness and accuracy of matchers across all datasets. The general message is that similar to accuracy, unfairness is dataset and measure-dependent. No matcher is unfair across all datasets and no matcher is unfair across all measures.
| Accurate | Fair | Evidence |
|---|---|---|
| RfMatcher: Cameras: {TPRP,PPVP} | ||
| BooleanRuleMatcher: iTunes-Amazon: {AP,SP,PPVP} | ||
| Gnem: iTunes-Amazon: {AP,PPVP,…} | ||
| ✓ | LinRegMatcher: Shoes; Gnem: Dblp-Acm | |
| BooleanRuleMatcher: Cricket | ||
| ✓ | HierMatcher: iTunes-Amazon: {AP,PPVP,…} | |
| SvmMatcher: Dblp-Acm: PPVP | ||
| Mcan: Cameras: TPRP; Ditto: Dblp-Scholar: {AP,TPRP,…} | ||
| DeepMatcher: Camera: {PPVP,TPRP} | ||
| ✓ | ✓ | Mcan: Dblp-Acm; Ditto: Cricket |
| NbMatcher: Dblp-Scholar |
| Model | Marker |
|---|---|
| DeepMatcher | \faCircle |
| Ditto | \faCircle |
| Gnem | \faCircle |
| HierMatcher | \faCircle |
| Mcan | \faCircle |
| SvmMatcher | \faStar |
| RfMatcher | \faStar |
| NbMatcher | \faStar |
| LogRegMatcher | \faStar |
| LinRegMatcher | \faStar |
| DtMatcher | \faStar |
| Dedupe | \faStar |
| BooleanRuleMatcher | \faStar |
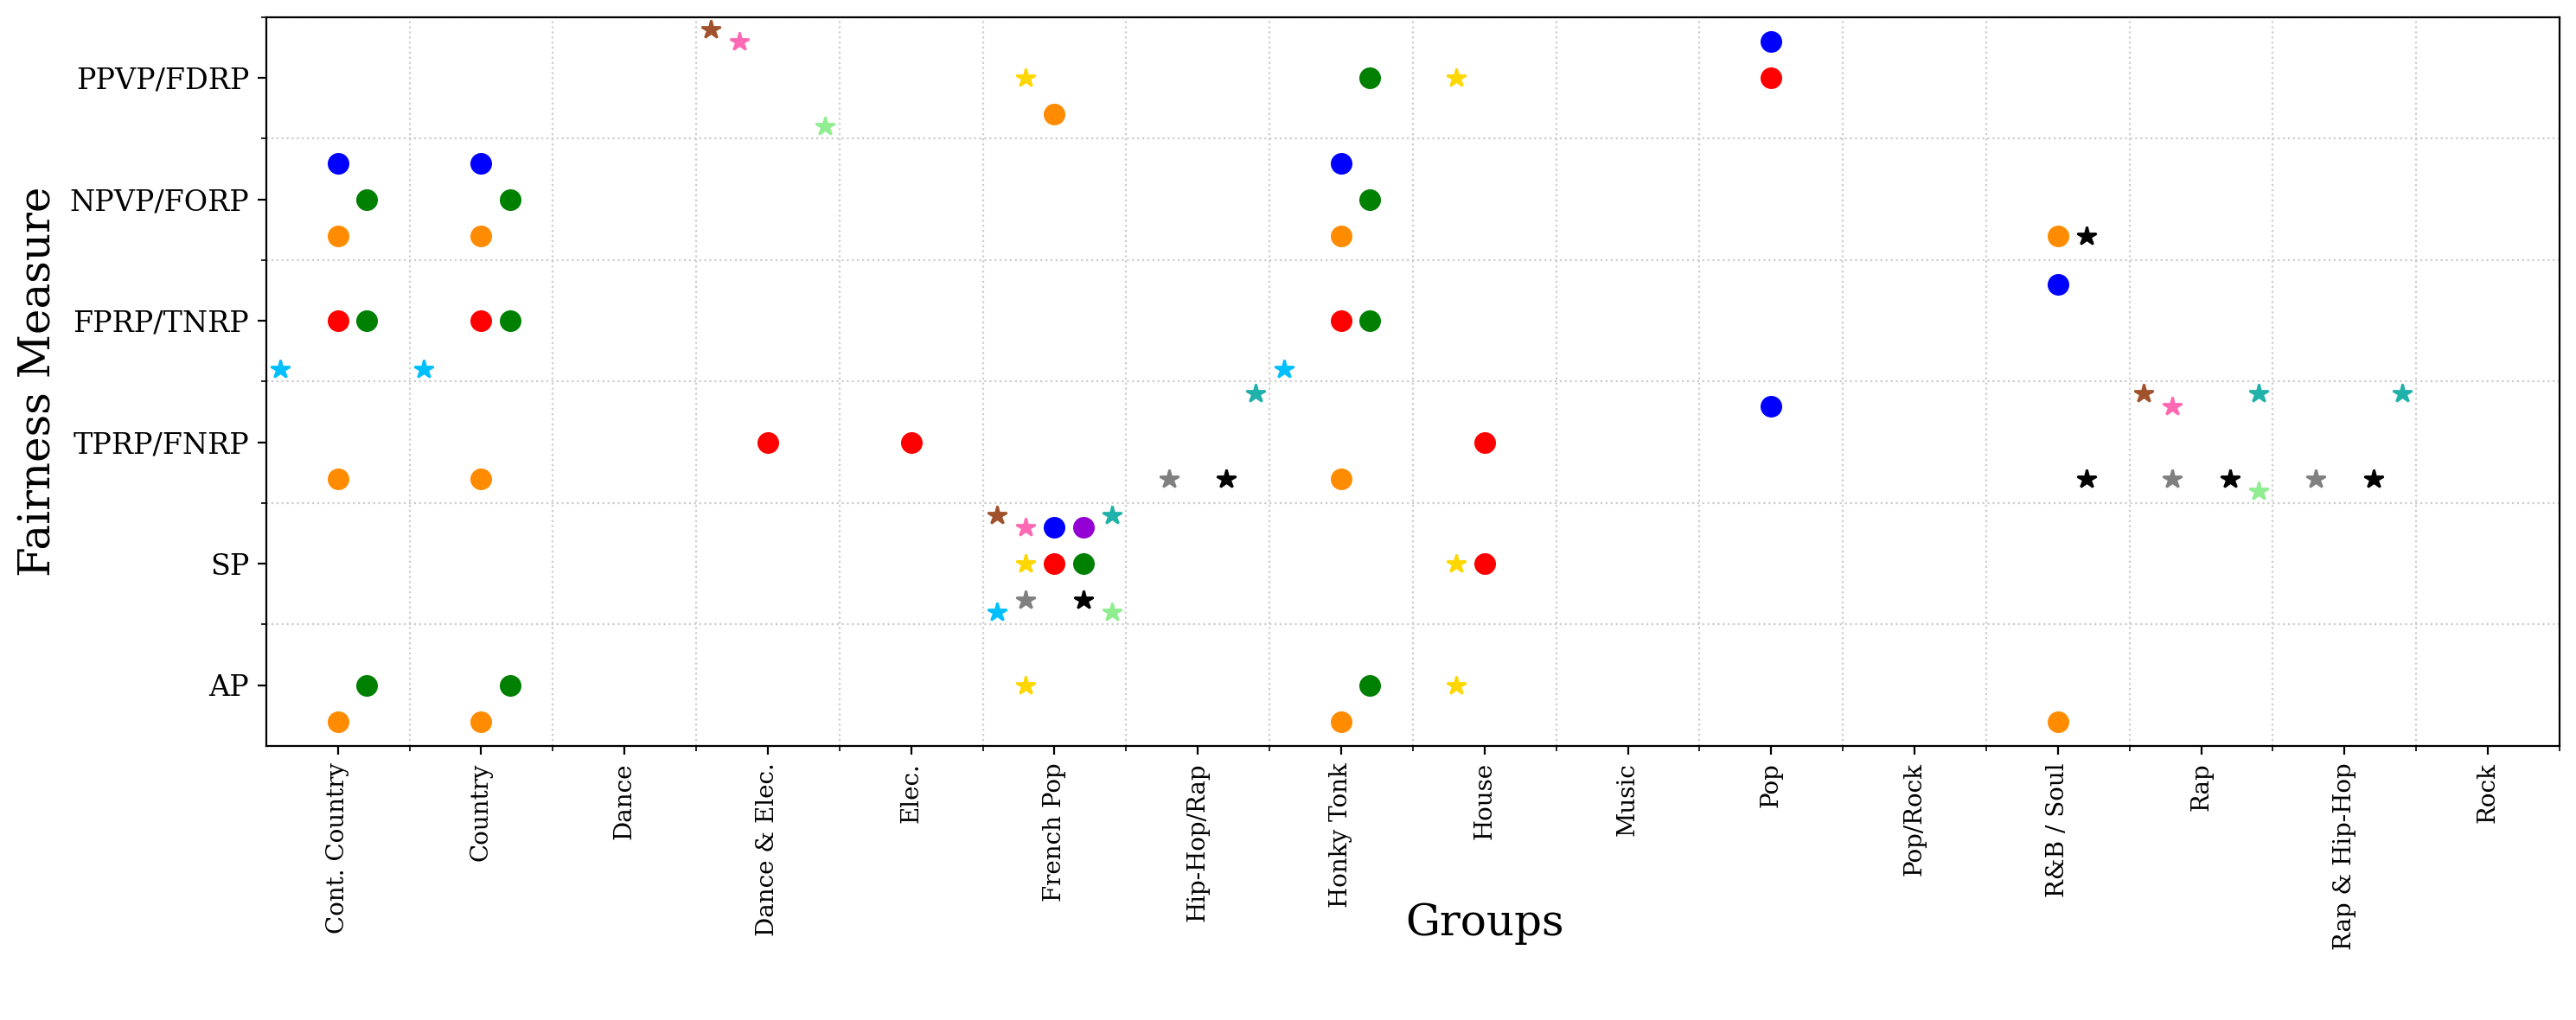
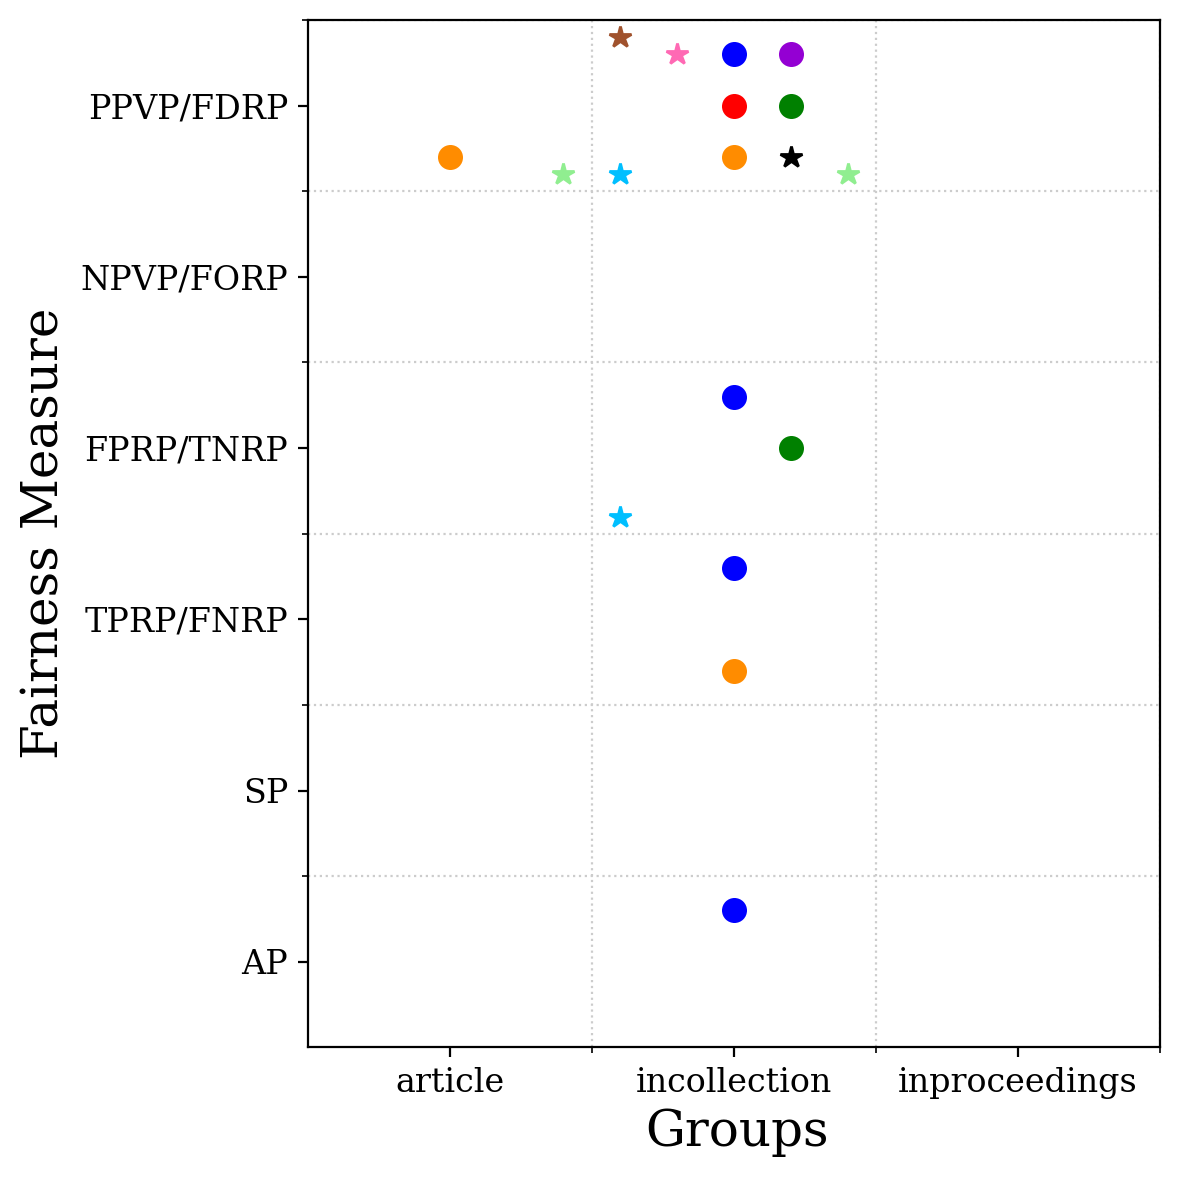
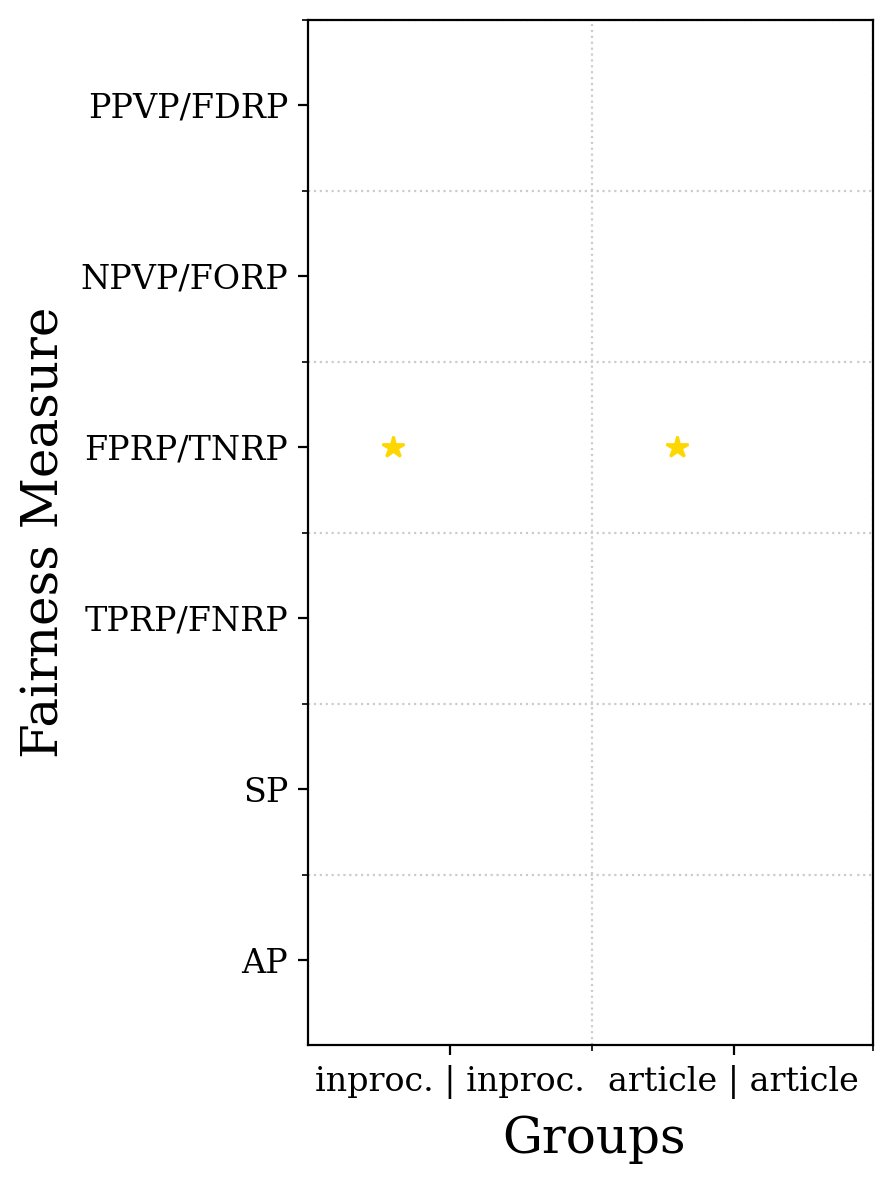
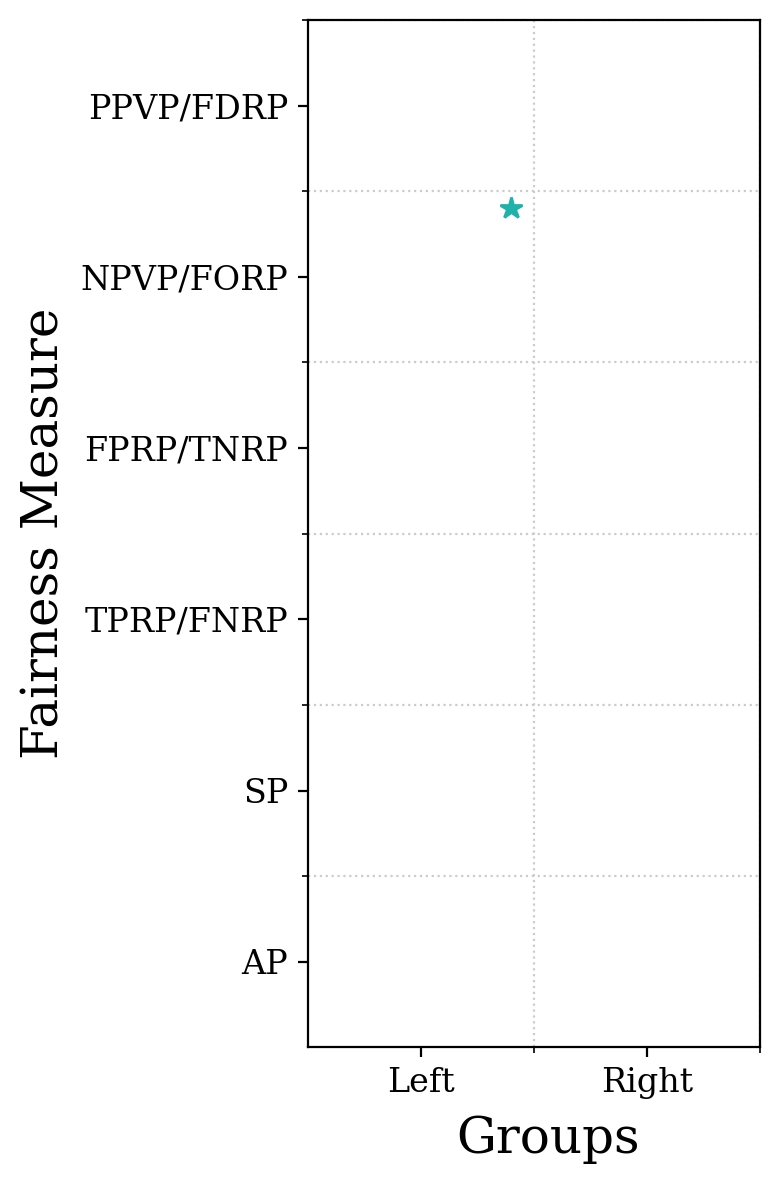
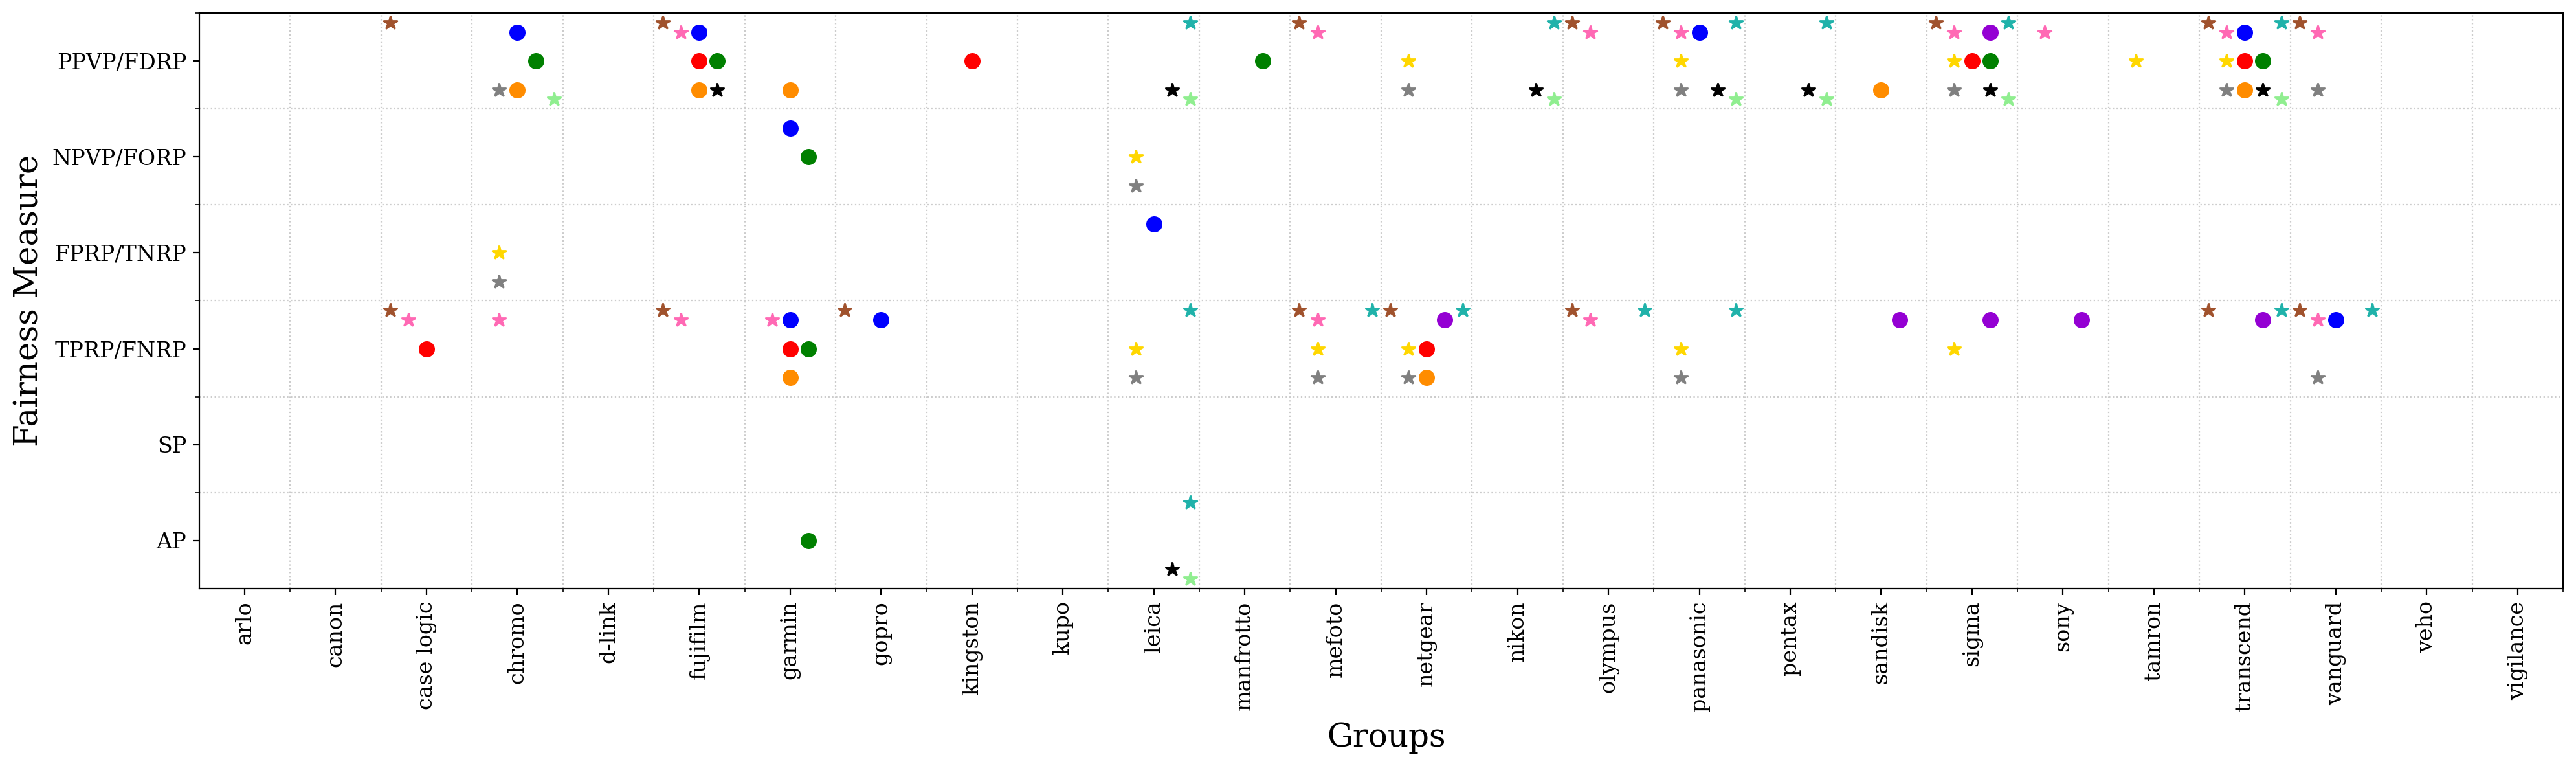
5.3.2. Fairness: Measure Types
55footnotetext: For the evaluation of ML-based matchers, we used random train/test splits from the datasets published by Magellan (Konda, 2018). To be consistent, all matchers are evaluated in a standard framework against the same datasets. We acknowledge that these results may not exactly match the accuracy results reported by matchers’ papers.Some fairness measures are not applicable to EM, and some are more capable of revealing the unfairness of matcher. We have extensively discussed this point in § 3.5. Here, we bring some empirical evidence of such scenarios. Figures 6 to 13 show our fairness evaluation results for all matchers across the benchmark datasets. In each plot, the x-axis shows the groups (single or pairwise), while the fairness measures are provided in the y-axis. The corresponding marker of a matcher is placed in a specific cell, if that matcher is unfair for the group shown in the cell’s column based on the measure in its row. In the majority of our experiments, PPVP and TPRP were the measures that discover unfairness the most across all datasets and matchers. Nevertheless, it is not the case that one measure fits all settings. When data has match/non-match negative imbalance, i.e., the number of matching pairs is much higher than non-matching pairs in the ground-truth, NPVP and FPRP are the most appropriate measures. This is because while the majority of pairs are positive instances, the failure of a matcher in identifying non-matches makes it unfair to certain groups. Consider the Cricket dataset that contains a larger number of pairs of matching cricket batters than non-matching batters. As shown in Figure 12, NPVP allows us to detect the unfairness of a matcher such as LogRegMatcher to left-handed batters due to the large number of FNs generated by this matcher. SP does not consider the ground-truth labels and requires the independence of the matching prediction from the groups. In other words, SP requires equal match ratios from different groups, independent of whether they really are a match or not. Then, when the ground-truth has (non-)match imbalance for a group, that is, the ratio of matched pairs to unmatched ones, is low, the SP measure falsely identifies a matcher as unfair for that group. An example of this phenomenon can be observed in Figure 8, for French-Pop group in the iTunes-Amazon dataset, where SP unfairness is indeed due to the fact that the ground-truth only contains TNs.
Some measures can be explained by others. For example, let us consider the AP unfairness of Gnem on iTunes-Amazon for the group of country genres, including Country, Cont. Country, and Honky Tonk, reported in Figure 8. This matcher has low accuracy for this group of genres because it identifies a small number of true matches (i.e., has a low number of TPs, thus, suffers from TPRP). Instead, the matchers falsely identify many pairs as non-match (i.e., have a high number of FPs, thus, suffer from NPVP). Similarly, we observe that HierMatcher demonstrates AP unfairness on iTunes-Amazon for the group of country genres because it incurs a large number of FPs, thus, suffers from FPRP unfairness.
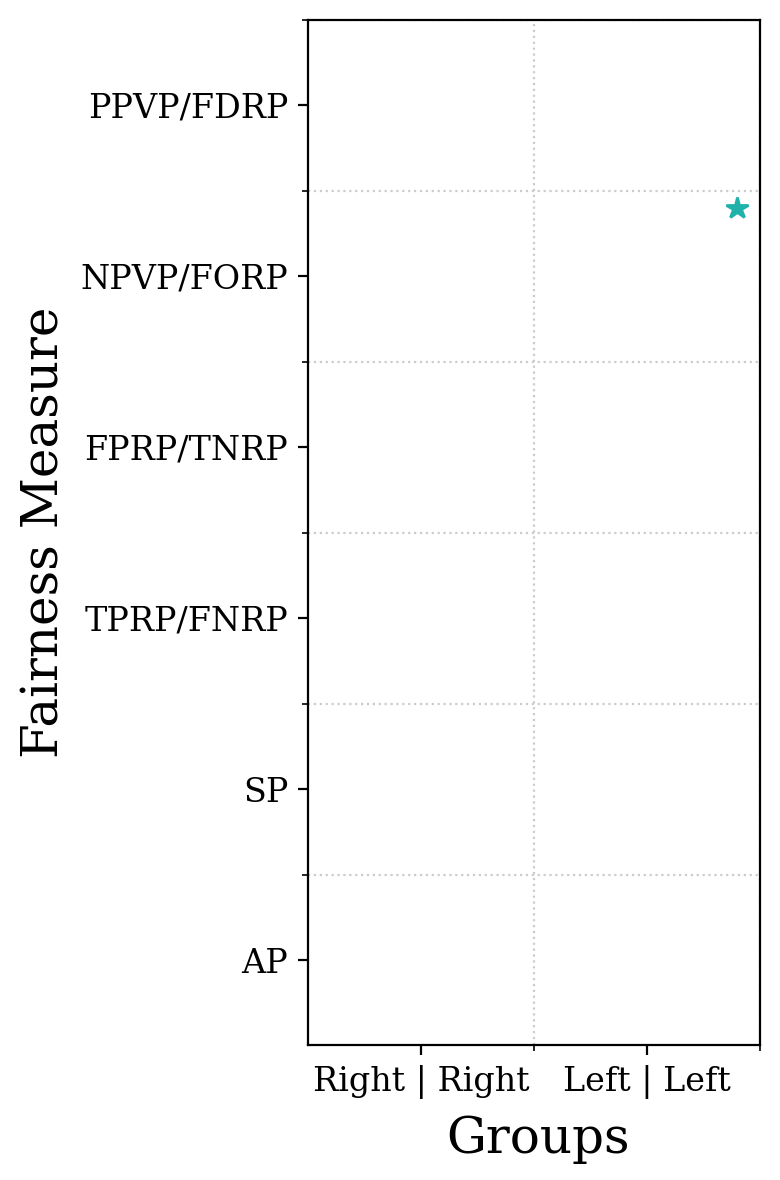
Single unfairness can potentially propagate to pairwise fairness. In Figure 12 and 12, we observe that the unfairness of LogRegMatcher for the single Left Handed group incurs its unfairness for the pairwise Left Handed-Left Handed groups because most likely only a left-handed batter can be matched with another left-handed batter.
5.3.3. Fairness: Matcher Types
Neural Matchers:
Neural matchers demonstrate more unfairness on structured datasets than non-neural matchers, as shown in Figures 8 and 12.
One reason is that matchers such as Ditto merge the content of different attributes as a single block and use token similarity as a signal for matching.
However, for structured data, this technique may lose the important information specified by the structure. In particular, in the following example from Dblp-Acm dataset, the two records have similar titles and are predicted as match despite the fact that they are (i) written by different authors, (ii) published in different venues, and (iii) published in different years.
(left record) title: lineage tracing for general data warehouse transformations; author: jennifer widom , yingwei cui; venue: VLDBJ; year: 2003
(right record) title: data extraction and transformation for the data warehouse; author: case squire; venue: SIGMOD; year: 1995
One of the reasons Ditto was unfair for VLDBJ is that, similar to the following example, it is common to publish extended versions of previously published papers in this venue. As a result,
after merging different attributes as a block of text for each record,
similar titles and authors may cause enough similarity between the two phrases that the Ditto mistakenly predicts them as a match.
(left record) title: efficient schemes for managing multiversionxml documents; author: shu-yao chien , carlo zaniolo , vassilis j. tsotras; venue: VLDBJ; year: 2002
(right record) title: efficient management of multiversion documents by object referencing; author: shu-yao chien , vassilis j. tsotras , carlo zaniolo; venue: VLDB; year: 2001
External bias could be injected into neural matchers through the use of language models and word embeddings.
For example, Hiermatcher uses language models and word embeddings to compare the attribute similarities of records.
As a result, it may mistakenly match articles with similar titles. Below is an FP example for HierMatcher. Both articles are published in the same year. But they appear in different venues and are written by different authors. Still, language models find sufficient similarity between titles to persuade the matcher to label the records as a match. Perhaps this is because of the similarity of words like “efficient” and “effective” in the embedding space.
(left record) title: efficient and cost-effective techniques for browsing and indexing large video databases; author: kien a. hua , jung-hwan oh; venue: SIGMOD; year: 2000
(right record) title: effective timestamping in databases; author: kristian torp , christian s. jensen , richard thomas snodgrass; venue: VLDBJ; year: 2000
Another example we bring is from iTunes-Amazon dataset. The following pair records is an FP by Ditto. First, both songs are by Kenny Chesney.
But more importantly, using a pre-trained language model, Likes Me and Loves Me are considered (almost) identical.
As a result, the model mistakenly labeled the left and right songs as a match.
Interestingly, such cases happen to be more frequent in genres such Country, resulting in FPRP unfairness for those groups, as shown in Figure 8.
(left record) song: Tequila Loves Me; artist: K. Chesney
(right record) song: Likes Me; artist: K. Chesney
Our fourth example is from the Cameras dataset, where camera records are matched based on their descriptions.
A successful matcher on a dataset that includes descriptions in many languages requires extensive coverage of language models on various languages.
For example, Mcan returns the following pair of records as an FN, although the model and the brand match, and Prijzen is the Dutch translation of word Prices. We suspect that this is due to the poor coverage of word embeddings on the Dutch language.
(left record) title: Sony Cyber-shot RX100@en RX100 Prices - CNET@en
(right record) tile: Sony Cyber-shot RX100 Zwart - Prijzen @NL Tweakers@NL
One model does not fit all. In iTunes-Amazon dataset, an interesting observation is that neural matchers perform poorly for the class of country (because a neural matcher creates a curvy decision boundary for all groups and fails for easy groups), while non-neural matchers perform poorly for the class of rap (because non-neural matchers make simple decision boundaries which may not work for a difficult group such as the class of rap genres).
For setwise attributes, matchers demonstrate similar unfair behavior on groups with overlapping semantics. In practice, we observe that, in single setwise sensitive attributes, different sets of groups highly overlap. This is sometimes due to the existence of a semantic hierarchy of groups. For example, in the iTunes-Amazon dataset, Honky Tonk and Cont. Country are subclasses of Country in the semantic taxonomy of Wikipedia. As a result, we observe similar behavior of matchers across these groups. For instance, Figure 8 shows extensive unfair behavior of neural matchers on country music groups: Honky Tonk, Cont. Country, and Country. Following the same trend, non-neural matchers perform poorly on groups Hip-hop/Rap and Rap and Rap & Hip-Hop, suggesting these matchers are unfair to rap and hip-hop singers.
Non-neural Matchers:
The non-neural matchers universally failed for the textual datasets (Camera and Shoes), with F-1 measures as low as zero in several cases. This underscores that these matchers are not fit for unstructured data. Still, in some settings, these matchers were both inaccurate and unfair for different groups, as shown in Figure
13.
Note that a matcher being fair in these cases simply means that it equally failed for all groups, not that it is a good choice.
For example, LinRegMatcher was fair for the Shoes dataset.
However, looking at its overall performance, it turns out it did not correctly find any of the true matches for any of the groups, hence was equally bad for all groups.
On the other hand, non-neural matchers performed well for the structured datasets. Still, similar to the neural matchers, all of them showed unfairness in multiple cases.
Further investigating this unfairness, we realized that by minimizing the overall error, these models put high weights on attributes that often indicate a match.
In other words, overall, those attributes are good proxies for the ground-truth labels. However, when it comes to certain groups, they may not be as good proxies, causing the model to underperform for those groups.
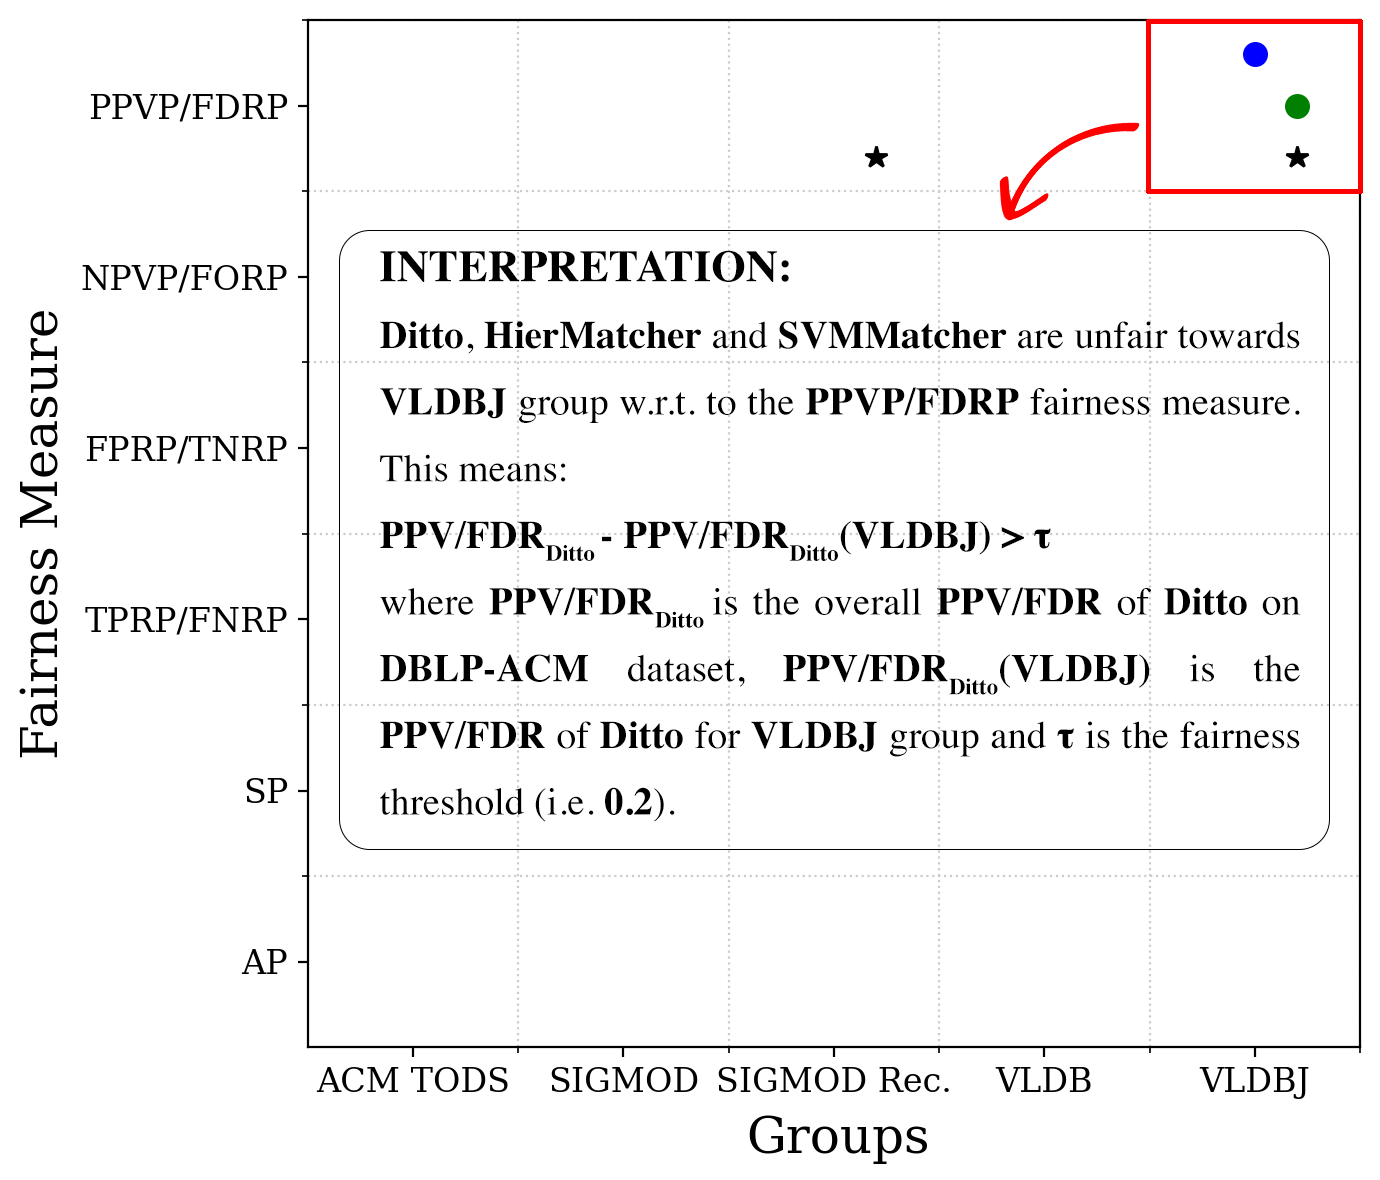
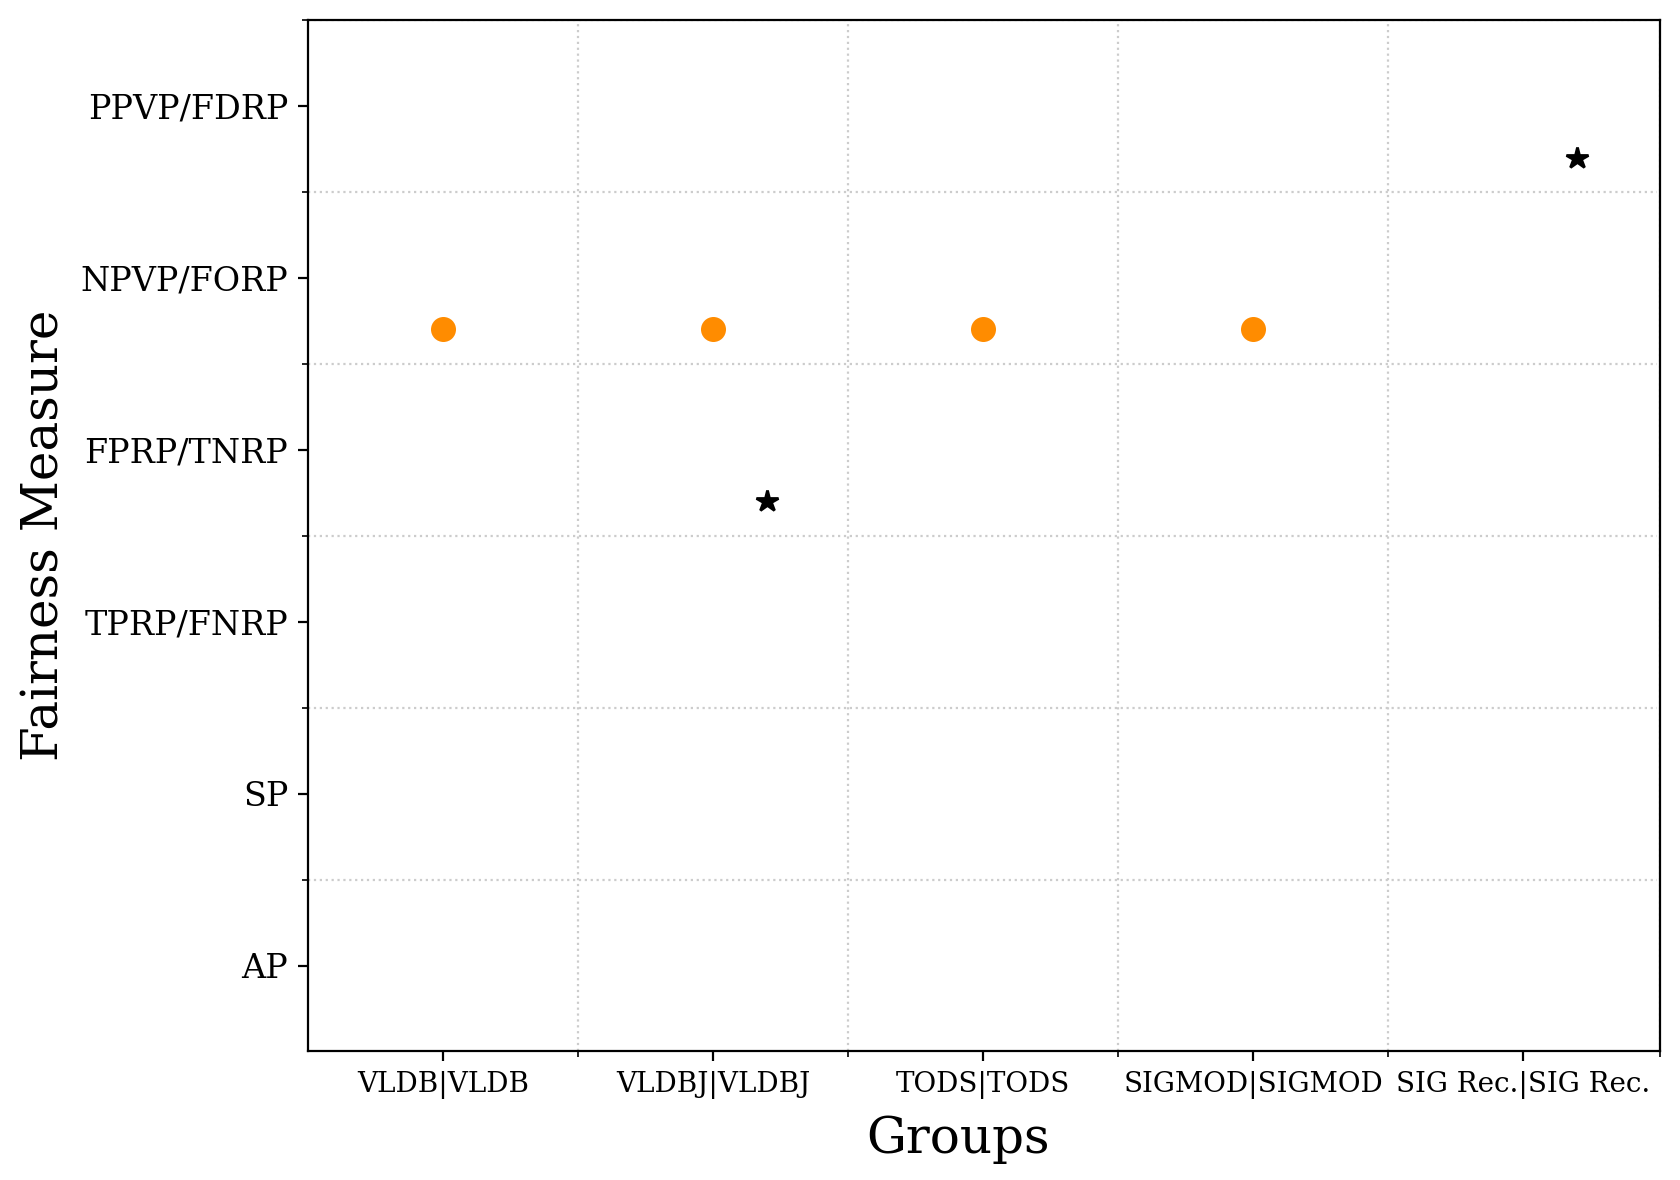
For example, consider SvmMatcher for the Dblp-Acm dataset, which was unfair for SIGMOD Rec. and VLDBJ.
First, we realized that both these groups frequently publish reports or editorial articles with the same title but different years and authors. Being trained to perform for all groups, the SvmMatcher model assigned a high weight to the title, assuming that different articles have different titles. Therefore, for examples like the one below, it matched them, although different authors wrote those in different years. This caused a higher ratio of false match detection (FP) compared to the other groups resulting in PPVP unfairness.
(left record) title: guest editorial; author: alon y. halevy; venue: VLDBJ; year: 2002
(right record) title: guest editorial ; author: vijay atluri , anupam joshi , yelena yesha; venue: VLDBJ; year: 2003
Besides, in Figure 7 the unfairness due to the high FP for SIGMOD Rec. and VLDBJ, caused pairwise unfairness for these two groups as well.
Note that this issue is not necessarily limited to the non-neural matchers. For example, (Di Cicco et al., 2019) also reports that an RNN-based matcher heavily relied on the “time” attribute when matching songs in the iTunes-Amazon dataset.
Lack of proper coverage (Asudeh
et al., 2019b; Shahbazi
et al., 2023b; Asudeh
et al., 2021) from some groups is the reason the models do not get well-trained for those. For example, in the Dblp-Acm case, the training data did not include enough non-match cases with (almost) identical titles to reduce the correlation of the title with the ground-truth label.
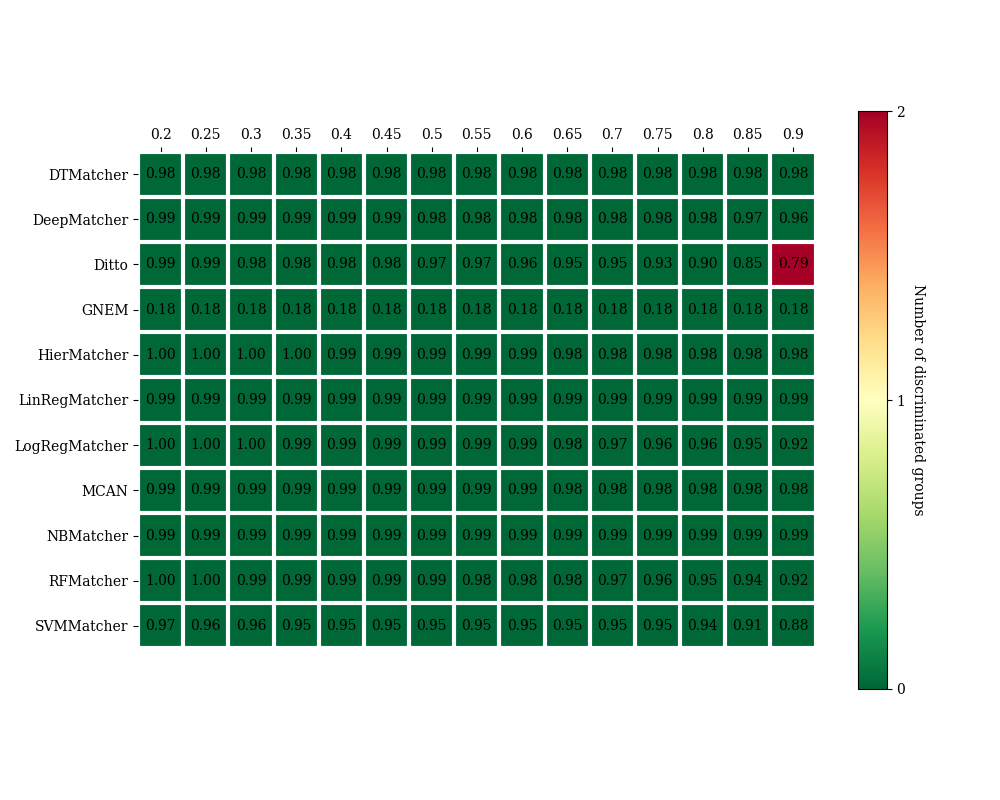
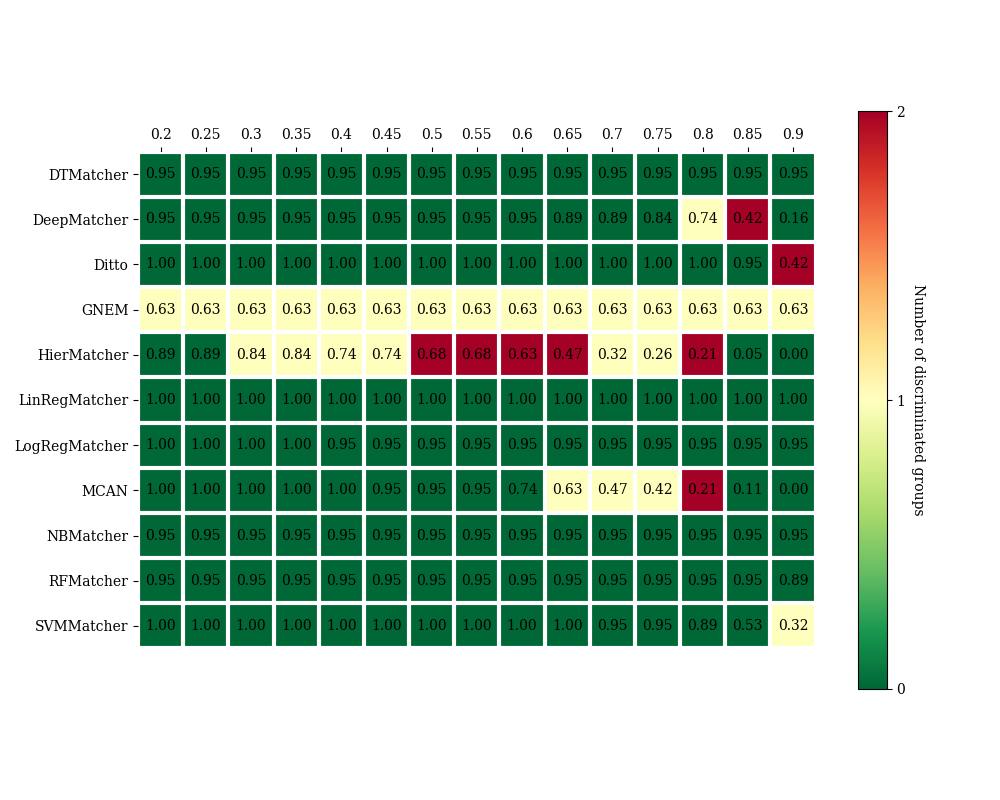
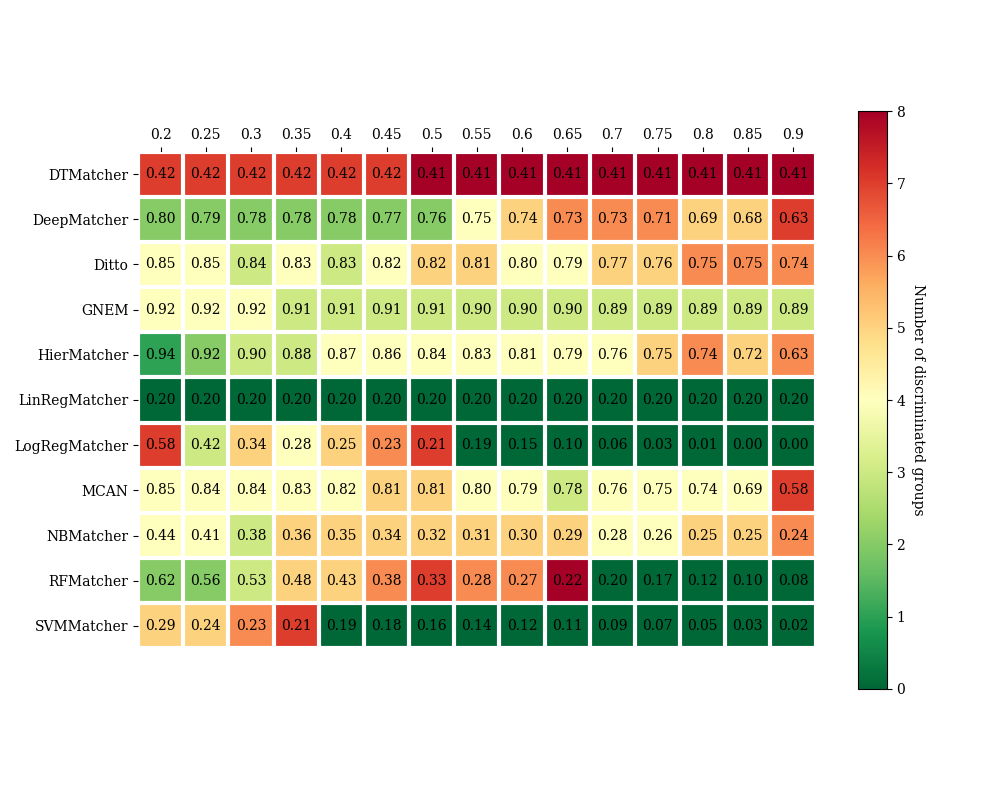
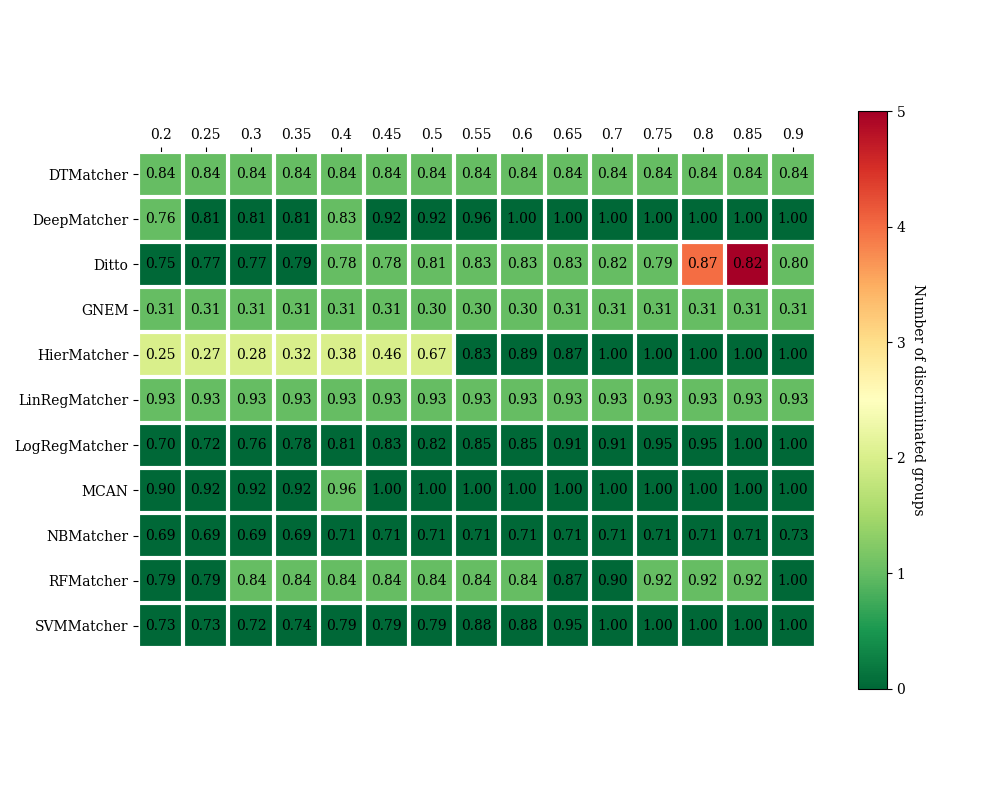
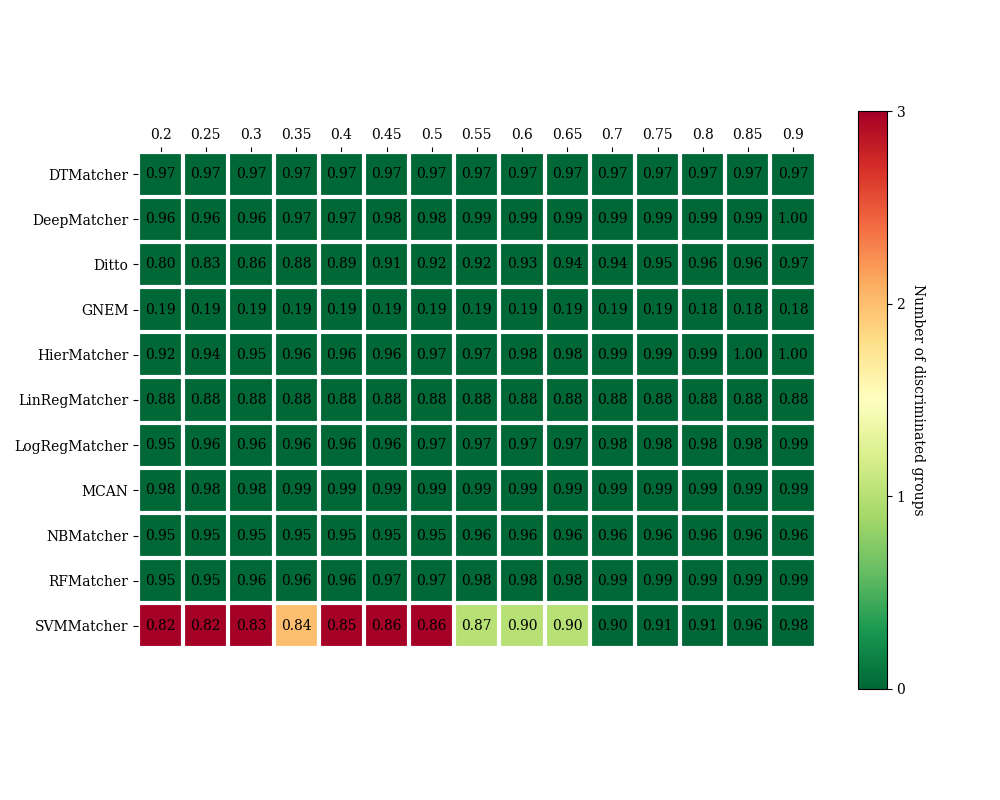
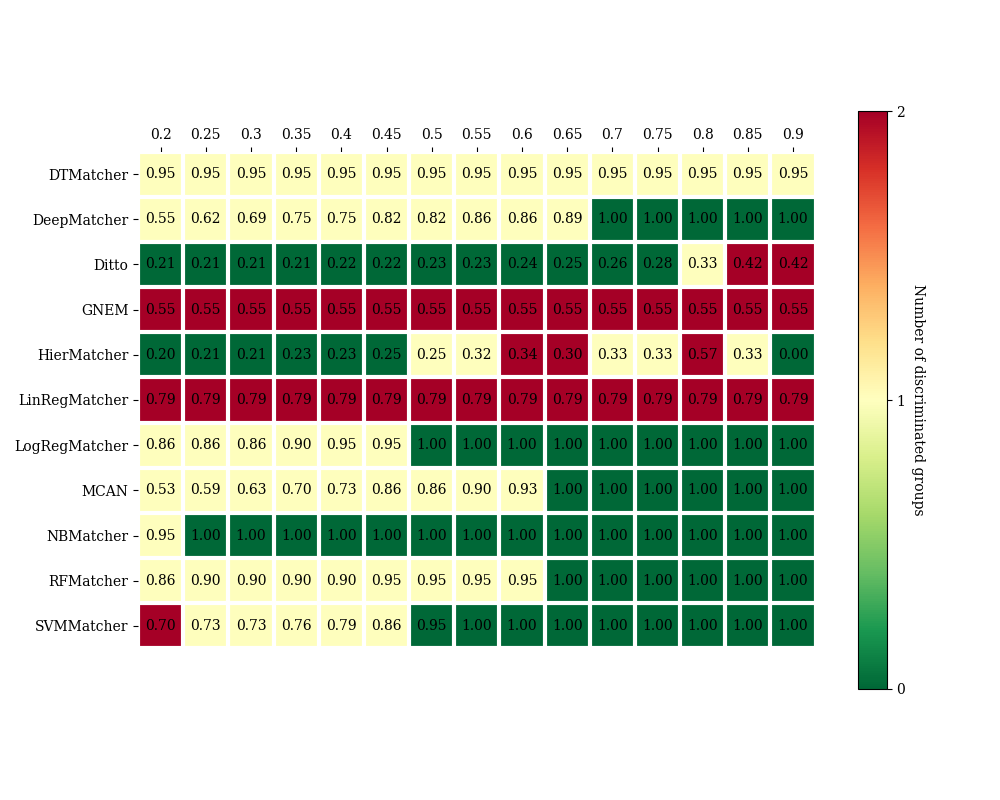
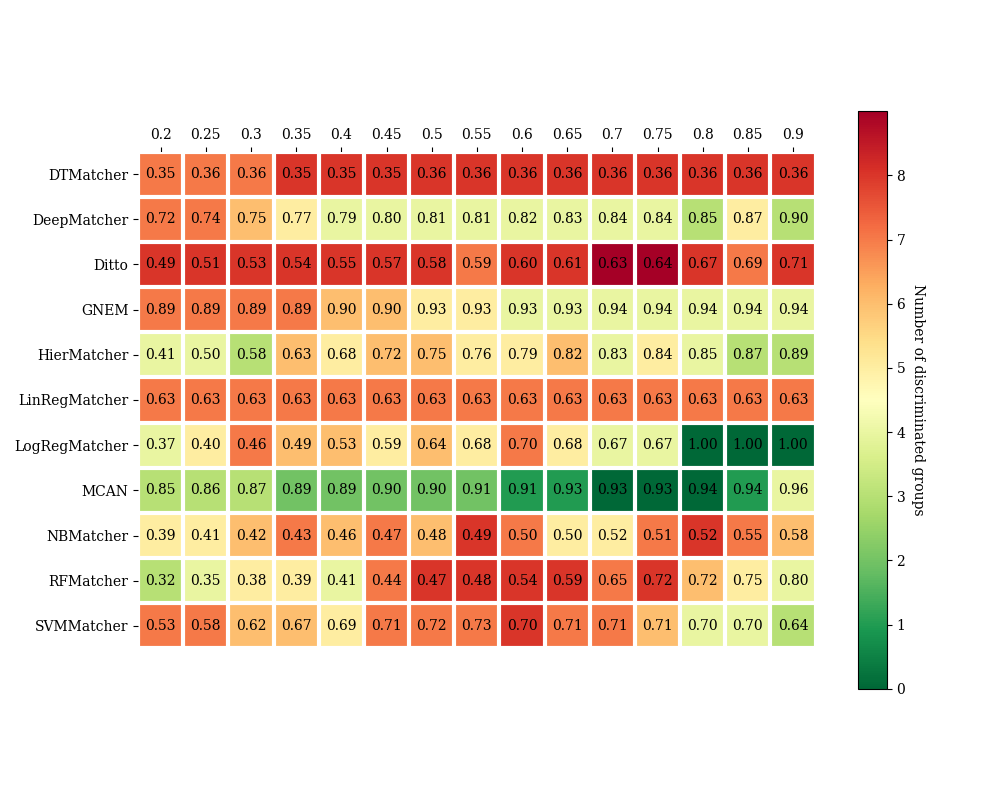
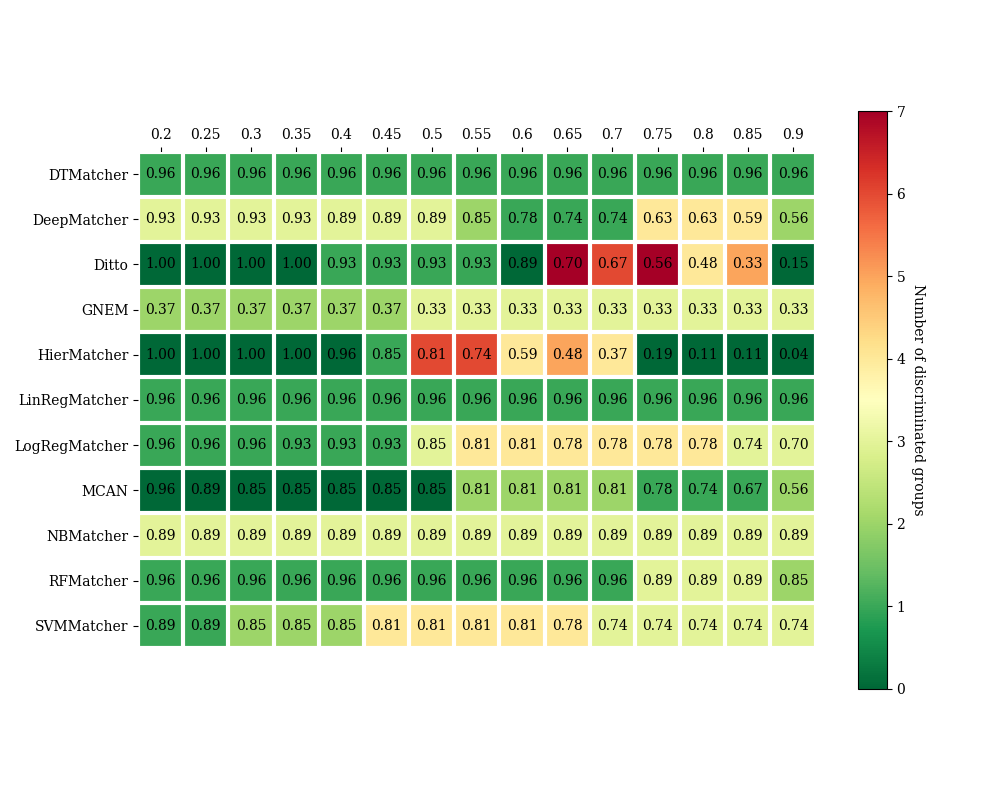
5.3.4. Matching Threshold vs. Fairness and Accuracy
In this experiment, we study the sensitivity of the models’ fairness to the matching threshold. Based on our previous results, we only focus on the two measures of TPRP and PPVP. Figure 14 shows the number of discriminated groups with respect to TPRP (as the color code) and the overall TPR values (written in every cell) for different threshold values on the iTunes-Amazon dataset. It is evident in Figure 14 that neural matchers are more sensitive to the choice of thresholds. For example, while Ditto is completely fair at threshold 0.6, with a small increase in the matching threshold (to 0.65) it becomes unfair for 7 groups. To further investigate this empirical observation over various datasets and both TPRP and PPVP, we define the threshold sensitivity of each matcher on a dataset as the distance on the number of groups a matcher is being unfair for between the adjacent matching thresholds. The results are provided in Table 7. Larger values indicate more sensitivity to the matching threshold. Aligned with our observation in Figure 14, the table shows higher sensitivity (less robustness) for the neural matchers. Some of the non-neural matchers have high sensitivity values for Cameras dataset. However, the model accuracy was universally bad for non-neural matchers on this dataset and regardless of fairness those matchers are not reliable.
| Non-neural | Neural | |||||||||||
| Dataset | DtMatcher | LinRegMatcher | LogRegMatcher | NbMatcher | RfMatcher | SvmMatcher | DeepMatcher | Ditto | Gnem | HierMatcher | Mcan | |
|---|---|---|---|---|---|---|---|---|---|---|---|---|
| TPRP | iTunes-Amazon | 0 | 0 | 2.4 | 0 | 2.2 | 2.4 | 3.9 | 9.3 | 1 | 6.9 | 2.4 |
| Cameras | 1 | 0 | 8.4 | 2.8 | 8.7 | 7.1 | 3.3 | 2.8 | 1 | 2.6 | 3.6 | |
| Dblp-Acm | 0 | 0 | 0 | 0 | 0 | 0 | 0 | 2 | 0 | 0 | 0 | |
| Dblp-Scholar | 0 | 0 | 0 | 0 | 0 | 1 | 2.4 | 2 | 0 | 2.2 | 2.4 | |
| PPVP | iTunes-Amazon | 0 | 0 | 0 | 0 | 2 | 0 | 1.7 | 5.2 | 0 | 2 | 1.4 |
| Cameras | 1 | 0 | 5.8 | 4.5 | 4.6 | 3.7 | 3.4 | 2.4 | 1.7 | 4.6 | 3.6 | |
| Dblp-Acm | 0 | 0 | 0 | 0 | 0 | 2.6 | 0 | 0 | 0 | 0 | 0 | |
| Dblp-Scholar | 0 | 0 | 1 | 1 | 1 | 1.4 | 1 | 1.4 | 0 | 2.4 | 1 | |
6. Lessons and Discussion
Some of the lessons learned in this study include:
(i) Call for action to collect EM benchmarks on societal applications: Perhaps the most challenging burden when auditing EM techniques from the fairness perspective is lack of proper benchmark datasets. Fairness is a societal issue and is meaningful when the EM task is on individual records. In real-world, EM is frequently used for tasks such as terrorist watch list screening (Krouse and Elias, 2009), record linkage for data integration on medical data (Acheson et al., 1967; Nargesian et al., 2022), individual records deduplication (Scanlon, 2016), and many more. On the other hand, due to reasons such as privacy, such data are not publicly available. Although the EM community already has some benchmarks (Wang et al., 2021; Konda, 2018), a thorough audit of existing and future EM techniques requires benchmark entity-matching data for societal applications. In this paper, we took the first steps towards addressing this need by creating and publishing two semi-synthetic social datasets using publicly available real datasets. NoFlyCompas and FacultyMatch are generated for auditing the fairness of EM techniques when some groups are over-represented in data and when two demographic groups have different degrees of similarity in their names.
(ii) Over-representation and name similarity in social data: Group over-representation and higher similarity degrees for specific groups are common in social data. Experiment results on our social datasets confirm the general unfairness of entity matchers under these conditions. Interestingly, under the group over-representation, we observed the superiority of non-neural matchers in terms of model performance and accuracy. Over-representation in general can increase the chance of finding similar non-matches for an entity, which can be falsely labeled as a match. Likewise, when names in one group are more similar, there is a higher chance of mistakenly labeling non-matching tuples from that group as a match. Considering more (unbiased) attributes can help in such situations.
(iii) Unbiased and representative training data: Responsible training of EM techniques requires access to unbiased data with proper coverage of different groups and possible cases. Insufficient coverage of different groups can bias the models in favor of some of the groups, making the model unfair. In particular, given the class imbalance nature of EM tasks, it is important to ensure enough representatives from different groups in both (match/unmatch) classes.
(iv) Proper fairness measures for EM: Different fairness definitions are valuable for different settings. Still, due to its pairwise matching nature, class imbalance, with most of the records being non-match, is a distinguishing property of EM. In this setting, positive predictive value parity and true positive rate parity a.k.a. equal opportunity is more capable of revealing the matchers’ unfairness. Finally, some of the unfairness of a matcher, such as AP, could be explained using other measures, such as TPRP.
(v) Proper matching techniques for different settings: Different matching techniques perform differently for different dataset types. At a high level, non-neural matchers fail for textual datasets while performing well for structured data. Lack of proper coverage in training data can bias these models to significantly rely on attributes (such as name) that are highly correlated with the ground-truth label but may bias their performance for the minority groups. Neural matchers, on the other hand, generally perform well for different dataset types. Still, (a) using pre-trained language models and embeddings, (b) relying less on the structure of data caused these matchers to be unfair for different settings. The fairness of neural matchers is more sensitive to the choice of the similarity threshold, as small changes in the threshold value can significantly change their fairness. Therefore, it is important to identify the right threshold to find the most fair/accurate one.
(vi) Ensemble learning for fair EM: We observed that, in a fixed dataset, some groups needed matchers with more complex decision boundaries, while others required matchers with simpler decision boundaries. As a result, adapting either of the neural/non-neural matchers would show unfairness for some groups. This observation underscores the need for techniques such as ensemble learning to consider a range of matchers with different properties to assure similar performance across different groups. Specifically, for cases with a single sensitive attribute with exclusive values, we recommend to train a set of matchers, for each group identify the one that performs the best, and use it for that group. This helps to maximize the performance for the under-performing groups. Note that this is different from the ensemble-learning-based approaches, since their goal is to improve the overall EM accuracy (Liu, 2022), not reducing unfairness. For instance, Jurek et al. apply ensemble learning based on feature selection (Jurek et al., 2017), while Yu et al. create an ensemble of models based on different similarity metric schemes (Yi et al., 2017). We leave designing ensemble EM techniques for fairness as future work.
Rule of Thumb: Following our findings and the lessons learned in this study, we would like to conclude the paper by Table 8, which provides some actionable insights and rules of thumb for responsible entity matching.
| Rules of Thumb | |
| Structured datasets | – Non-neural matchers are preferred |
| – Obtain attributes with min correlation with sensitive attributes | |
| – Minimize Representation bias in training data | |
| – Make sure the model is not putting high weights on only a few attributes | |
| Textual& dirty datasets | – Neural matchers are preferred |
| – Obtain additional (unbiased) features | |
| – Use unbiased pretrained models | |
| – Minimize Representation bias in training data | |
| – Considering their sensitivity, try out different matching thresholds | |
| and select the most fair/accurate one | |
| Fairness measure: TPRP and PPVP are usually preferred (see § 3.5 and § 5.3.2) | |
| Use an ensemble of matchers (for single sensitive attributes with exclusive | |
| values): construct a set of matchers; for each group use the matcher with best | |
| performance on it (using separate test sets for each group) | |
Acknowledgement
The authors would like to thank Dongxiang Zhang and Zepeng Li for providing Mcan matcher’s code. The work by Nima Shahbazi and Abolfazl Asudeh was supported in part by the National Science Foundation (Grant No. 2107290). Fatemeh Nargesian was supported in part by the National Science Foundation (Grant No. 2107050).
References
- (1)
- usC ([n.d.]) [n.d.]. u.s. census bureau quickfacts: united states. https://www.census.gov/quickfacts/fact/table/US/PST045221
- COM (2015) 2015. COMPAS Recidivism Risk Score Data and Analysis. www.propublica.org/datastore/dataset/compas-recidivism-risk-score-data-and-analysis.
- CSR (2023) [visited: 2023]. CSRankings GitHub Repository. https://github.com/emeryberger/CSRankings.
- Acheson et al. (1967) Ernest Donald Acheson et al. 1967. Medical record linkage. Medical record linkage. (1967).
- Advertising (2022) IBM Watson Advertising. 2022. Bias in Advertising: Confronting & Addressing the Challenge. https://www.ibm.com/watson-advertising/thought-leadership/bias-in-advertising.
- Asudeh et al. (2019a) Abolfazl Asudeh, HV Jagadish, Julia Stoyanovich, and Gautam Das. 2019a. Designing fair ranking schemes. In Proceedings of the 2019 international conference on management of data. 1259–1276.
- Asudeh and Jagadish (2020) Abolfazl Asudeh and H. V. Jagadish. 2020. Fairly evaluating and scoring items in a data set. PVLDB 13, 12 (2020), 3445–3448.
- Asudeh et al. (2019b) Abolfazl Asudeh, Zhongjun Jin, and HV Jagadish. 2019b. Assessing and remedying coverage for a given dataset. In ICDE. IEEE, 554–565.
- Asudeh et al. (2021) Abolfazl Asudeh, Nima Shahbazi, Zhongjun Jin, and HV Jagadish. 2021. Identifying insufficient data coverage for ordinal continuous-valued attributes. In Proceedings of the 2021 international conference on management of data. 129–141.
- Bach and Bernat (2022) Tho Bach and Kenny Bernat. 2022. The Business Impact of Biased Advertising (and How to Fix It). https://www.wpromote.com/blog/digital-marketing/biased-advertising.
- Barlaug (2022) Nils Barlaug. 2022. LEMON: explainable entity matching. IEEE Transactions on Knowledge and Data Engineering (2022).
- Barlaug and Gulla (2021) Nils Barlaug and Jon Atle Gulla. 2021. Neural networks for entity matching: A survey. ACM Transactions on Knowledge Discovery from Data (TKDD) 15, 3 (2021), 1–37.
- Barocas et al. (2019) Solon Barocas, Moritz Hardt, and Arvind Narayanan. 2019. Fairness and machine learning: Limitations and opportunities. fairmlbook.org.
- Bellamy et al. (2018) Rachel KE Bellamy, Kuntal Dey, Michael Hind, Samuel C Hoffman, Stephanie Houde, Kalapriya Kannan, Pranay Lohia, Jacquelyn Martino, Sameep Mehta, Aleksandra Mojsilovic, et al. 2018. AI Fairness 360: An extensible toolkit for detecting, understanding, and mitigating unwanted algorithmic bias. arXiv preprint arXiv:1810.01943 (2018).
- Bojanowski et al. (2016) Piotr Bojanowski, Edouard Grave, Armand Joulin, and Tomas Mikolov. 2016. Enriching Word Vectors with Subword Information. arXiv preprint arXiv:1607.04606 (2016).
- Calmon et al. (2017) Flavio Calmon, Dennis Wei, Bhanukiran Vinzamuri, Karthikeyan Natesan Ramamurthy, and Kush R Varshney. 2017. Optimized pre-processing for discrimination prevention. Advances in neural information processing systems 30 (2017).
- Celis et al. (2019) L Elisa Celis, Lingxiao Huang, Vijay Keswani, and Nisheeth K Vishnoi. 2019. Classification with fairness constraints: A meta-algorithm with provable guarantees. In Proceedings of the conference on fairness, accountability, and transparency. 319–328.
- Chen et al. (2021) Runjin Chen, Yanyan Shen, and Dongxiang Zhang. 2021. GNEM: a generic one-to-set neural entity matching framework. In Proceedings of the Web Conference 2021. 1686–1694.
- Chouldechova (2017) Alexandra Chouldechova. 2017. Fair prediction with disparate impact: A study of bias in recidivism prediction instruments. Big data 5, 2 (2017), 153–163.
- Christophides et al. (2020) Vassilis Christophides, Vasilis Efthymiou, Themis Palpanas, George Papadakis, and Kostas Stefanidis. 2020. An overview of end-to-end entity resolution for big data. ACM Computing Surveys (CSUR) 53, 6 (2020), 1–42.
- Commission (1979) Equal Employment Opportunity Commission. 1979. The U.S. Uniform guidelines on employee selection procedures.
- Devlin et al. (2018) Jacob Devlin, Ming-Wei Chang, Kenton Lee, and Kristina Toutanova. 2018. Bert: Pre-training of deep bidirectional transformers for language understanding. arXiv preprint arXiv:1810.04805 (2018).
- Di Cicco et al. (2019) Vincenzo Di Cicco, Donatella Firmani, Nick Koudas, Paolo Merialdo, and Divesh Srivastava. 2019. Interpreting deep learning models for entity resolution: an experience report using LIME. In Proceedings of the Second International Workshop on Exploiting Artificial Intelligence Techniques for Data Management. 1–4.
- Dwork et al. (2012) Cynthia Dwork, Moritz Hardt, Toniann Pitassi, Omer Reingold, and Richard Zemel. 2012. Fairness through awareness. In Proceedings of the 3rd innovations in theoretical computer science conference. 214–226.
- Efthymiou et al. (2021) Vasilis Efthymiou, Kostas Stefanidis, Evaggelia Pitoura, and Vassilis Christophides. 2021. FairER: Entity Resolution With Fairness Constraints. In Proceedings of the 30th ACM International Conference on Information & Knowledge Management. 3004–3008.
- Feldman et al. (2015) Michael Feldman, Sorelle A Friedler, John Moeller, Carlos Scheidegger, and Suresh Venkatasubramanian. 2015. Certifying and removing disparate impact. In proceedings of the 21th ACM SIGKDD international conference on knowledge discovery and data mining. 259–268.
- Fu et al. (2021) Cheng Fu, Xianpei Han, Jiaming He, and Le Sun. 2021. Hierarchical matching network for heterogeneous entity resolution. In Proceedings of the Twenty-Ninth International Conference on International Joint Conferences on Artificial Intelligence. 3665–3671.
- Gregg and Eder (2022) Forest Gregg and Derek Eder. 2022. Dedupe. https://github.com/dedupeio/dedupe.
- Hardt et al. (2016) Moritz Hardt, Eric Price, and Nati Srebro. 2016. Equality of opportunity in supervised learning. Advances in neural information processing systems 29 (2016).
- InDeXLab (2023) InDeXLab. 2023. Fair Entity Matching. github.com/UIC-InDeXLab/fair_entity_matching/tree/main/synthetic%20dataset%20generator.
- Jurek et al. (2017) Anna Jurek, Jun Hong, Yuan Chi, and Weiru Liu. 2017. A novel ensemble learning approach to unsupervised record linkage. Information Systems 71 (2017), 40–54.
- Kleinberg et al. (2016) Jon Kleinberg, Sendhil Mullainathan, and Manish Raghavan. 2016. Inherent trade-offs in the fair determination of risk scores. arXiv preprint arXiv:1609.05807 (2016).
- Konda (2018) Pradap Venkatramanan Konda. 2018. Magellan: Toward building entity matching management systems. The University of Wisconsin-Madison.
- Köpcke and Rahm (2010) Hanna Köpcke and Erhard Rahm. 2010. Frameworks for entity matching: A comparison. Data & Knowledge Engineering 69, 2 (2010), 197–210.
- Krouse and Elias (2009) William J Krouse and Bart Elias. 2009. Terrorist watchlist checks and air passenger prescreening. LIBRARY OF CONGRESS WASHINGTON DC CONGRESSIONAL RESEARCH SERVICE.
- Kusner et al. (2017) Matt J Kusner, Joshua Loftus, Chris Russell, and Ricardo Silva. 2017. Counterfactual fairness. Advances in neural information processing systems 30 (2017).
- Li et al. (2020b) Bo-Han Li, Yi Liu, An-Man Zhang, Wen-Huan Wang, and Shuo Wan. 2020b. A survey on blocking technology of entity resolution. Journal of Computer Science and Technology 35 (2020), 769–793.
- Li et al. (2020a) Yuliang Li, Jinfeng Li, Yoshihiko Suhara, AnHai Doan, and Wang-Chiew Tan. 2020a. Deep entity matching with pre-trained language models. arXiv preprint arXiv:2004.00584 (2020).
- Liu (2022) Ling Liu. 2022. Ensemble Learning Methods for Dirty Data. In CIKM, Keynote.
- Makri et al. (2022) Christina Makri, Alexandros Karakasidis, and Evaggelia Pitoura. 2022. Towards a more Accurate and Fair SVM-based Record Linkage. In 2022 IEEE International Conference on Big Data (Big Data). IEEE, 4691–4699.
- Mikolov et al. (2013) Tomas Mikolov, Kai Chen, Greg Corrado, and Jeffrey Dean. 2013. Efficient estimation of word representations in vector space. arXiv preprint arXiv:1301.3781 (2013).
- Miller and Hosanagar (2019) Alex P Miller and Kartik Hosanagar. 2019. How targeted ads and dynamic pricing can perpetuate bias. Harvard Business Review (2019).
- Mudgal et al. (2018) Sidharth Mudgal, Han Li, Theodoros Rekatsinas, AnHai Doan, Youngchoon Park, Ganesh Krishnan, Rohit Deep, Esteban Arcaute, and Vijay Raghavendra. 2018. Deep learning for entity matching: A design space exploration. In Proceedings of the 2018 International Conference on Management of Data. 19–34.
- Nargesian et al. (2021) Fatemeh Nargesian, Abolfazl Asudeh, and HV Jagadish. 2021. Tailoring data source distributions for fairness-aware data integration. PVLDB 14, 11 (2021), 2519–2532.
- Nargesian et al. (2022) Fatemeh Nargesian, Abolfazl Asudeh, and HV Jagadish. 2022. Responsible Data Integration: Next-generation Challenges. In Proceedings of the 2022 International Conference on Management of Data. 2458–2464.
- Nilforoushan et al. (2022) Soudeh Nilforoushan, Qianfan Wu, and Mostafa Milani. 2022. Entity Matching with AUC-Based Fairness. In 2022 IEEE International Conference on Big Data (Big Data). IEEE, 5068–5075.
- Paganelli et al. (2019) Matteo Paganelli, Paolo Sottovia, Francesco Guerra, and Yannis Velegrakis. 2019. Tuner: Fine tuning of rule-based entity matchers. In Proceedings of the 28th ACM International Conference on Information and Knowledge Management. 2945–2948.
- Panahi et al. (2017) Fatemah Panahi, Wentao Wu, AnHai Doan, and Jeffrey F Naughton. 2017. Towards Interactive Debugging of Rule-based Entity Matching.. In EDBT. 354–365.
- Papadakis et al. (2020) George Papadakis, Dimitrios Skoutas, Emmanouil Thanos, and Themis Palpanas. 2020. Blocking and filtering techniques for entity resolution: A survey. ACM Computing Surveys (CSUR) 53, 2 (2020), 1–42.
- Papadakis et al. (2016) George Papadakis, Jonathan Svirsky, Avigdor Gal, and Themis Palpanas. 2016. Comparative analysis of approximate blocking techniques for entity resolution. Proceedings of the VLDB Endowment 9, 9 (2016), 684–695.
- Pennington et al. (2014) Jeffrey Pennington, Richard Socher, and Christopher D Manning. 2014. Glove: Global vectors for word representation. In Proceedings of the 2014 conference on empirical methods in natural language processing (EMNLP). 1532–1543.
- Primpeli et al. (2019) Anna Primpeli, Ralph Peeters, and Christian Bizer. 2019. The WDC training dataset and gold standard for large-scale product matching. In Companion Proceedings of The 2019 World Wide Web Conference. 381–386.
- Scanlon (2016) Mark Scanlon. 2016. Battling the digital forensic backlog through data deduplication. In 2016 sixth international conference on innovative computing technology (INTECH). IEEE, 10–14.
- Shahbazi et al. (2023a) Nima Shahbazi, Nikola Danevski, Fatemeh Nargesian, Abolfazl Asudeh, and Divesh Srivastava. 2023a. Through the Fairness Lens: Experimental Analysis and Evaluation of Entity Matching. https://github.com/UIC-InDeXLab/fair_entity_matching/blob/main/techrep.pdf.
- Shahbazi et al. (2023b) Nima Shahbazi, Yin Lin, Abolfazl Asudeh, and HV Jagadish. 2023b. Representation Bias in Data: A Survey on Identification and Resolution Techniques. ACM Computing Surveys (2023).
- Shetiya et al. (2022) Suraj Shetiya, Ian P. Swift, Abolfazl Asudeh, and Gautam Das. 2022. Fairness-Aware Range Queries for Selecting Unbiased Data. In 2022 IEEE 38th International Conference on Data Engineering (ICDE). IEEE.
- Singh et al. (2017) Rohit Singh, Venkata Vamsikrishna Meduri, Ahmed Elmagarmid, Samuel Madden, Paolo Papotti, Jorge-Arnulfo Quiané-Ruiz, Armando Solar-Lezama, and Nan Tang. 2017. Synthesizing entity matching rules by examples. Proceedings of the VLDB Endowment 11, 2 (2017), 189–202.
- Swift et al. (2022) Ian P Swift, Sana Ebrahimi, Azade Nova, and Abolfazl Asudeh. 2022. Maximizing Fair Content Spread via Edge Suggestion in Social Networks. Proceedings of the VLDB Endowment 15, 11 (2022).
- Vaswani et al. (2017) Ashish Vaswani, Noam Shazeer, Niki Parmar, Jakob Uszkoreit, Llion Jones, Aidan N Gomez, Łukasz Kaiser, and Illia Polosukhin. 2017. Attention is all you need. Advances in neural information processing systems 30 (2017).
- Wang et al. (2011) Jiannan Wang, Guoliang Li, Jeffrey Xu Yu, and Jianhua Feng. 2011. Entity matching: How similar is similar. Proceedings of the VLDB Endowment 4, 10 (2011), 622–633.
- Wang and Li (2022) Jin Wang and Yuliang Li. 2022. Minun: evaluating counterfactual explanations for entity matching. In Proceedings of the Sixth Workshop on Data Management for End-To-End Machine Learning. 1–11.
- Wang et al. (2021) Jin Wang, Yuliang Li, and Wataru Hirota. 2021. Machamp: A Generalized Entity Matching Benchmark. In CIKM. ACM, 4633–4642.
- Yi et al. (2017) Liu Yi, Diao Xing-Chun, Cao Jian-Jun, Zhou Xing, and Shang Yu-Ling. 2017. A method for entity resolution in high dimensional data using ensemble classifiers. Mathematical Problems in Engineering 2017 (2017).
- Yu et al. (2016) Minghe Yu, Guoliang Li, Dong Deng, and Jianhua Feng. 2016. String similarity search and join: a survey. Frontiers of Computer Science 10, 3 (2016), 399–417.
- Zafar et al. (2017) Muhammad Bilal Zafar, Isabel Valera, Manuel Gomez Rogriguez, and Krishna P Gummadi. 2017. Fairness constraints: Mechanisms for fair classification. In Artificial intelligence and statistics. PMLR, 962–970.
- Zemel et al. (2013) Rich Zemel, Yu Wu, Kevin Swersky, Toni Pitassi, and Cynthia Dwork. 2013. Learning fair representations. In International conference on machine learning. PMLR, 325–333.
- Zhang et al. (2020) Dongxiang Zhang, Yuyang Nie, Sai Wu, Yanyan Shen, and Kian-Lee Tan. 2020. Multi-context attention for entity matching. In Proceedings of The Web Conference 2020. 2634–2640.
- Zhang et al. (2021) Hantian Zhang, Nima Shahbazi, Xu Chu, and Abolfazl Asudeh. 2021. FairRover: explorative model building for fair and responsible machine learning. In Proceedings of the Fifth Workshop on Data Management for End-To-End Machine Learning. 1–10.
Appendix
Appendix A Group Encoding
To unify all attribute-value types, we summarize subgroups in an encoding and use this encoding to represent individual entities and entity pairs. Given a set of sensitive attributes and value domains for attributes , denotes the set of all level-1 groups, i.e. . We represent a subgroup of level (-combination) consisting of groups , with a binary encoding , where and is one if and is zero otherwise. Note that for a -combination subgroup, exactly entries of get the value one. We represent an entity associated with groups with a binary encoding , where is one if and is zero otherwise. An entity with groups belongs to subgroup if . Given an entity encoding and a subgroup encoding , we say belongs to subgroup if , i.e. the entity belongs to every group that defines the subgroup . The encoding of an entity pair is the concatenation of the encodings of and .
Example 1.
Consider attributes genre and gender of Figure 1. Assuming a lexicographical order on all groups, the encoding of entity with associated groups ={Female, Pop, Rock} is . The encoding of a level- subgroup ={Female, Pop} is .
Appendix B Evaluating the Correctness of Entity Matchers
The correctness of a matcher measures how well its matching predictions match the ground-truth. Given a test dataset with correspondences of , where is a binary variable indicating the result of EM (match or non-match) for entities with encodings and , and is a binary variable indicating the ground-truth for matching, we profile predictions of using the numbers of true positives (TP), true negatives (TN), false positives (FP), and false negatives (FN), respectively. Unlike a classification task, in the confusion matrix of a matching task, the result is counted both for the group(s) of and the group(s) of .
Example 1.
Consider a test dataset, shown in Table 15, for a matcher , where columns and contain entity encodings, column is the output decision of , and column is the ground-truth. Comparing columns and , we add and populate column for each entity pair. Consider the simple case of having two groups . Suppose we would like to evaluate single fairness for and . We describe how the confusion matrices of these groups are created. Consider the first row in Table 15(a), which happens to be an FP. Since and both belong to group , the value will be added to the count of FPs in the confusion matrix of . However, in the second row which happens to be a TN, belongs to while belongs to . Thereby, we will add one to both TN values of the confusion matrix corresponding to group and . We repeat the same procedure for rows three and four. The completed confusion matrices are shown in Figures 15(b) and 15(c).
We measure correctness for single and pairwise fairness through well-studied metrics in literature, including precision, recall, and F-1 score.
| id1 | id2 | group() | group() | Result | ||
| ‘M’ | ‘N’ | FP | ||||
| ‘N’ | ‘N’ | TN | ||||
| ‘M’ | ‘M’ | TP | ||||
| ‘N’ | ‘M’ | FN |
| Actual | |||
| y=‘M’ | y=‘N’ | ||
| Predicted | h=‘M’ | TP=2 | FP=2 |
| h=‘N’ | FN=1 | TN=1 | |
| Actual | |||
| y=‘M’ | y=‘N’ | ||
| Predicted | h=‘M’ | TP=0 | FP=0 |
| h=‘N’ | FN=1 | TN=1 | |
Appendix C Deploying Fair Entity Matching Framework
In this section, we provide a step-by-step instruction set on how to use our proposed fair entity matching framework:
Appendix D Additional Experiments
D.1. Correctness
| NoFlyCompas | FacultyMatch | iTunes-Amazon | Dblp-Acm | Dblp-Scholar | Cricket | Shoes | Camera | |||||||||
| Matcher | Acc | F-1 | Acc | F-1 | Acc | F-1 | Acc | F-1 | Acc | F-1 | Acc | F-1 | Acc | F-1 | Acc | F-1 |
|---|---|---|---|---|---|---|---|---|---|---|---|---|---|---|---|---|
| BooleanRuleMatcher | 0.99 | 0.14 | 0.99 | 0.37 | 0.29 | 0.41 | 0.41 | 0.38 | 0.38 | 0.38 | 0.03 | 0.0 | 0.82 | 0.28 | 0.81 | 0.4 |
| DeepMatcher | 0.99 | 0.84 | 0.99 | 0.70 | 0.94 | 0.88 | 0.99 | 0.98 | 0.97 | 0.92 | 0.87 | 0.92 | 0.96 | 0.82 | 0.93 | 0.81 |
| Ditto | 0.99 | 0.79 | 0.99 | 0.78 | 0.91 | 0.84 | 0.99 | 0.98 | 0.95 | 0.87 | 0.96 | 0.98 | 0.95 | 0.78 | 0.91 | 0.76 |
| Gnem | 0.99 | 0.86 | 0.99 | 0.85 | 0.64 | 0.31 | 0.70 | 0.18 | 0.83 | 0.58 | 0.96 | 0.98 | 0.96 | 0.80 | 0.97 | 0.91 |
| HierMatcher | 0.99 | 0.77 | 0.99 | 0.72 | 0.93 | 0.87 | 0.95 | 0.88 | 0.96 | 0.9 | 0.81 | 0.89 | 0.96 | 0.81 | 0.94 | 0.83 |
| Mcan | 0.99 | 0.69 | 0.99 | 0.68 | 0.97 | 0.94 | 0.99 | 0.99 | 0.97 | 0.92 | 0.95 | 0.97 | 0.95 | 0.73 | 0.93 | 0.78 |
| SvmMatcher | 0.99 | 0.99 | 0.99 | 0.94 | 0.92 | 0.84 | 0.96 | 0.90 | 0.94 | 0.86 | 0.96 | 0.98 | 0.89 | 0.0 | 0.84 | 0.27 |
| RfMatcher | 1.00 | 1.00 | 0.99 | 0.95 | 0.94 | 0.89 | 0.99 | 0.97 | 0.98 | 0.94 | 0.96 | 0.98 | 0.88 | 0.29 | 0.82 | 0.38 |
| NbMatcher | 0.99 | 0.98 | 0.96 | 0.11 | 0.88 | 0.78 | 0.98 | 0.97 | 0.99 | 0.97 | 0.96 | 931 | 0.86 | 0.26 | 0.82 | 0.38 |
| LogRegMatcher | 1.00 | 1.00 | 0.99 | 0.93 | 0.91 | 0.83 | 0.99 | 0.97 | 0.99 | 0.97 | 0.96 | 0.98 | 0.89 | 0.04 | 0.84 | 0.31 |
| LinRegMatcher | 0.99 | 0.95 | 0.99 | 0.38 | 0.97 | 0.94 | 0.97 | 0.93 | 0.95 | 0.88 | 0.96 | 0.97 | 0.89 | 0.0 | 0.84 | 0.30 |
| Dedupe | - | - | - | - | 0.94 | 0.89 | 0.95 | 0.85 | 0.95 | 0.87 | 0.96 | 0.98 | - | - | - | - |
| DtMatcher | 1.00 | 1.00 | 0.99 | 0.93 | 0.94 | 0.89 | 0.99 | 0.97 | 0.98 | 0.94 | 0.93 | 0.96 | 0.85 | 0.30 | 0.84 | 0.31 |
| Accurate | Fair | Evidence |
|---|---|---|
| RfMatcher: Cameras: {TPRP,PPVP} | ||
| BooleanRuleMatcher: iTunes-Amazon: {AP,SP,PPVP} | ||
| Gnem: iTunes-Amazon: {AP,PPVP,…} | ||
| ✓ | LinRegMatcher: Shoes | |
| Gnem: Dblp-Acm | ||
| BooleanRuleMatcher: Cricket | ||
| ✓ | HierMatcher: iTunes-Amazon: {AP,PPVP,…} | |
| SvmMatcher: Dblp-Acm: PPVP | ||
| Mcan: Cameras: TPRP | ||
| Ditto: Dblp-Scholar: {AP,TPRP,…} | ||
| DeepMatcher: Camera: {PPVP,TPRP} | ||
| ✓ | ✓ | Mcan: Dblp-Acm |
| Ditto: Cricket | ||
| NbMatcher: Dblp-Scholar |
Neural matchers are more accurate than non-neural matchers on textual and dirty data. The correctness results of the textual datasets: Shoes and Camera, can be found in Table 9. Non-neural matchers extensively suffer in F-1 score, compared to neural matchers that have higher ranges of F-1 score. Modern neural matchers such as Ditto and DeepMatcher draw on external knowledge by incorporating language models, which helps a matcher to learn the relevance of entities despite the lack of structure and syntactic similarity in text entities. This result is consistent with what is reported by the state-of-art matchers.
Non-neural matchers are more accurate than neural matchers on structured data. Considering the structured datasets: iTunes-Amazon and Dblp-Acm, although all matchers, with the exception of BooleanRuleMatcher, perform quite well, the non-neural matchers have slightly higher F-1 scores overall.
The main job of a matcher is to find matching entities. A failure in doing so results in a low number of TPs, which reflects in not only a low F-1 score but also unfairness with respect to TPRP and PPVP measures for many groups across the board, as we observe in Figures 13 and 20. Recall that these measures verify how well a matcher performs in identifying true positives. Similar observations can be made in both datasets regarding the unfairness of the BooleanRuleMatcher. One interesting observation in Gnem, which is the only neural matcher with a low F-1 score for the Dblp-Acm dataset, is that the high number of FNs of Gnem results in the pairwise unfairness for pairs (e.g., SIGMOD|SIGMOD and ACM TODS|ACM TODS). Gnem does not demonstrate NPVP unfairness on pairs, particularly in the Dblp-Acm dataset, because often two entities with are not a match (e.g. it is rare that a ACM TODS publication is matched with a publication SIGMOD).
The flip side of correctness and fairness also exists in EM. For example, the BooleanRuleMatcher and Gnem have low accuracy and F-1 score on Dblp-Acm, while no unfairness issue is reported for these matchers, in Figure 6. This can be explained by the low accuracy of these matchers for all groups across the board which makes the disparity a low value. In Figure 16, we present a selective overview of the unfairness and accuracy of matchers across all datasets. The general message is that similar to accuracy, unfairness is dataset and measure dependent. First, no matcher is unfair across all datasets. For example, Gnem is unfair for iTunes-Amazon and Dblp-Acm but is not unfair for the Cricket dataset. No matcher is unfair across all measures. For example, on Dblp-Scholar dataset, HierMatcher is only unfair with respect to PPVP and FPRP and not other measures. We will have a more detailed discussion on the behavior of matcher w.r.t measures in § 5.3.2.
D.2. Cameras Dataset: Pairwise Fairness
| Model | Marker |
|---|---|
| DeepMatcher | \faCircle |
| Ditto | \faCircle |
| Gnem | \faCircle |
| HierMatcher | \faCircle |
| Mcan | \faCircle |
| SvmMatcher | \faStar |
| RfMatcher | \faStar |
| NbMatcher | \faStar |
| LogRegMatcher | \faStar |
| LinRegMatcher | \faStar |
| DtMatcher | \faStar |
| Dedupe | \faStar |
| BooleanRuleMatcher | \faStar |
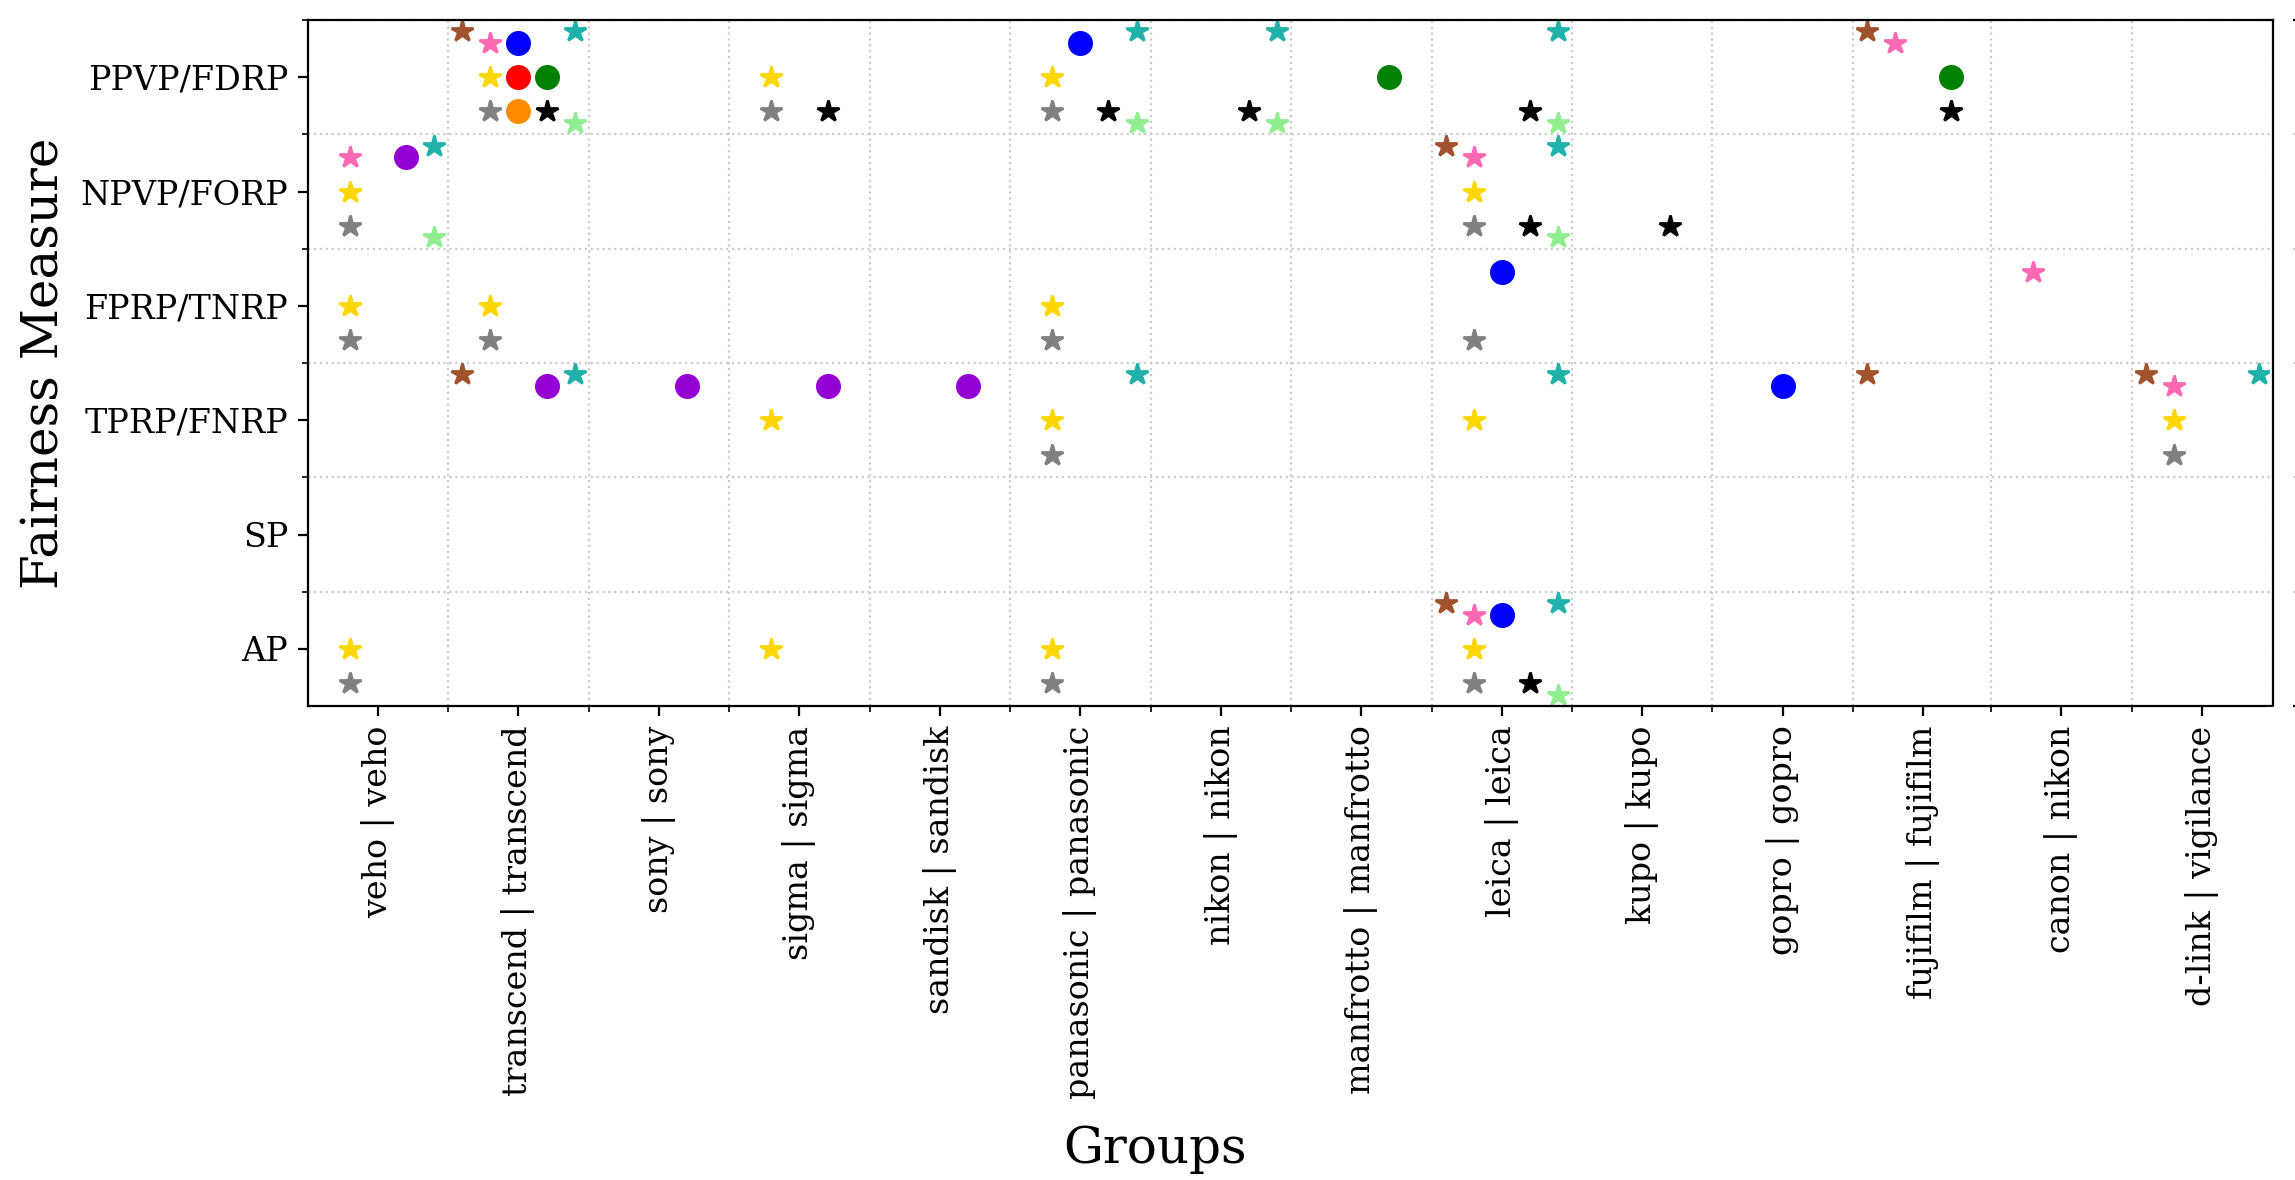
D.3. iTunes-Amazon Dataset: Pairwise Fairness
In Figure 18, extensive unfair behavior of neural matchers happens in the pairwise matching of Dance & Electronic with Music and Dance.
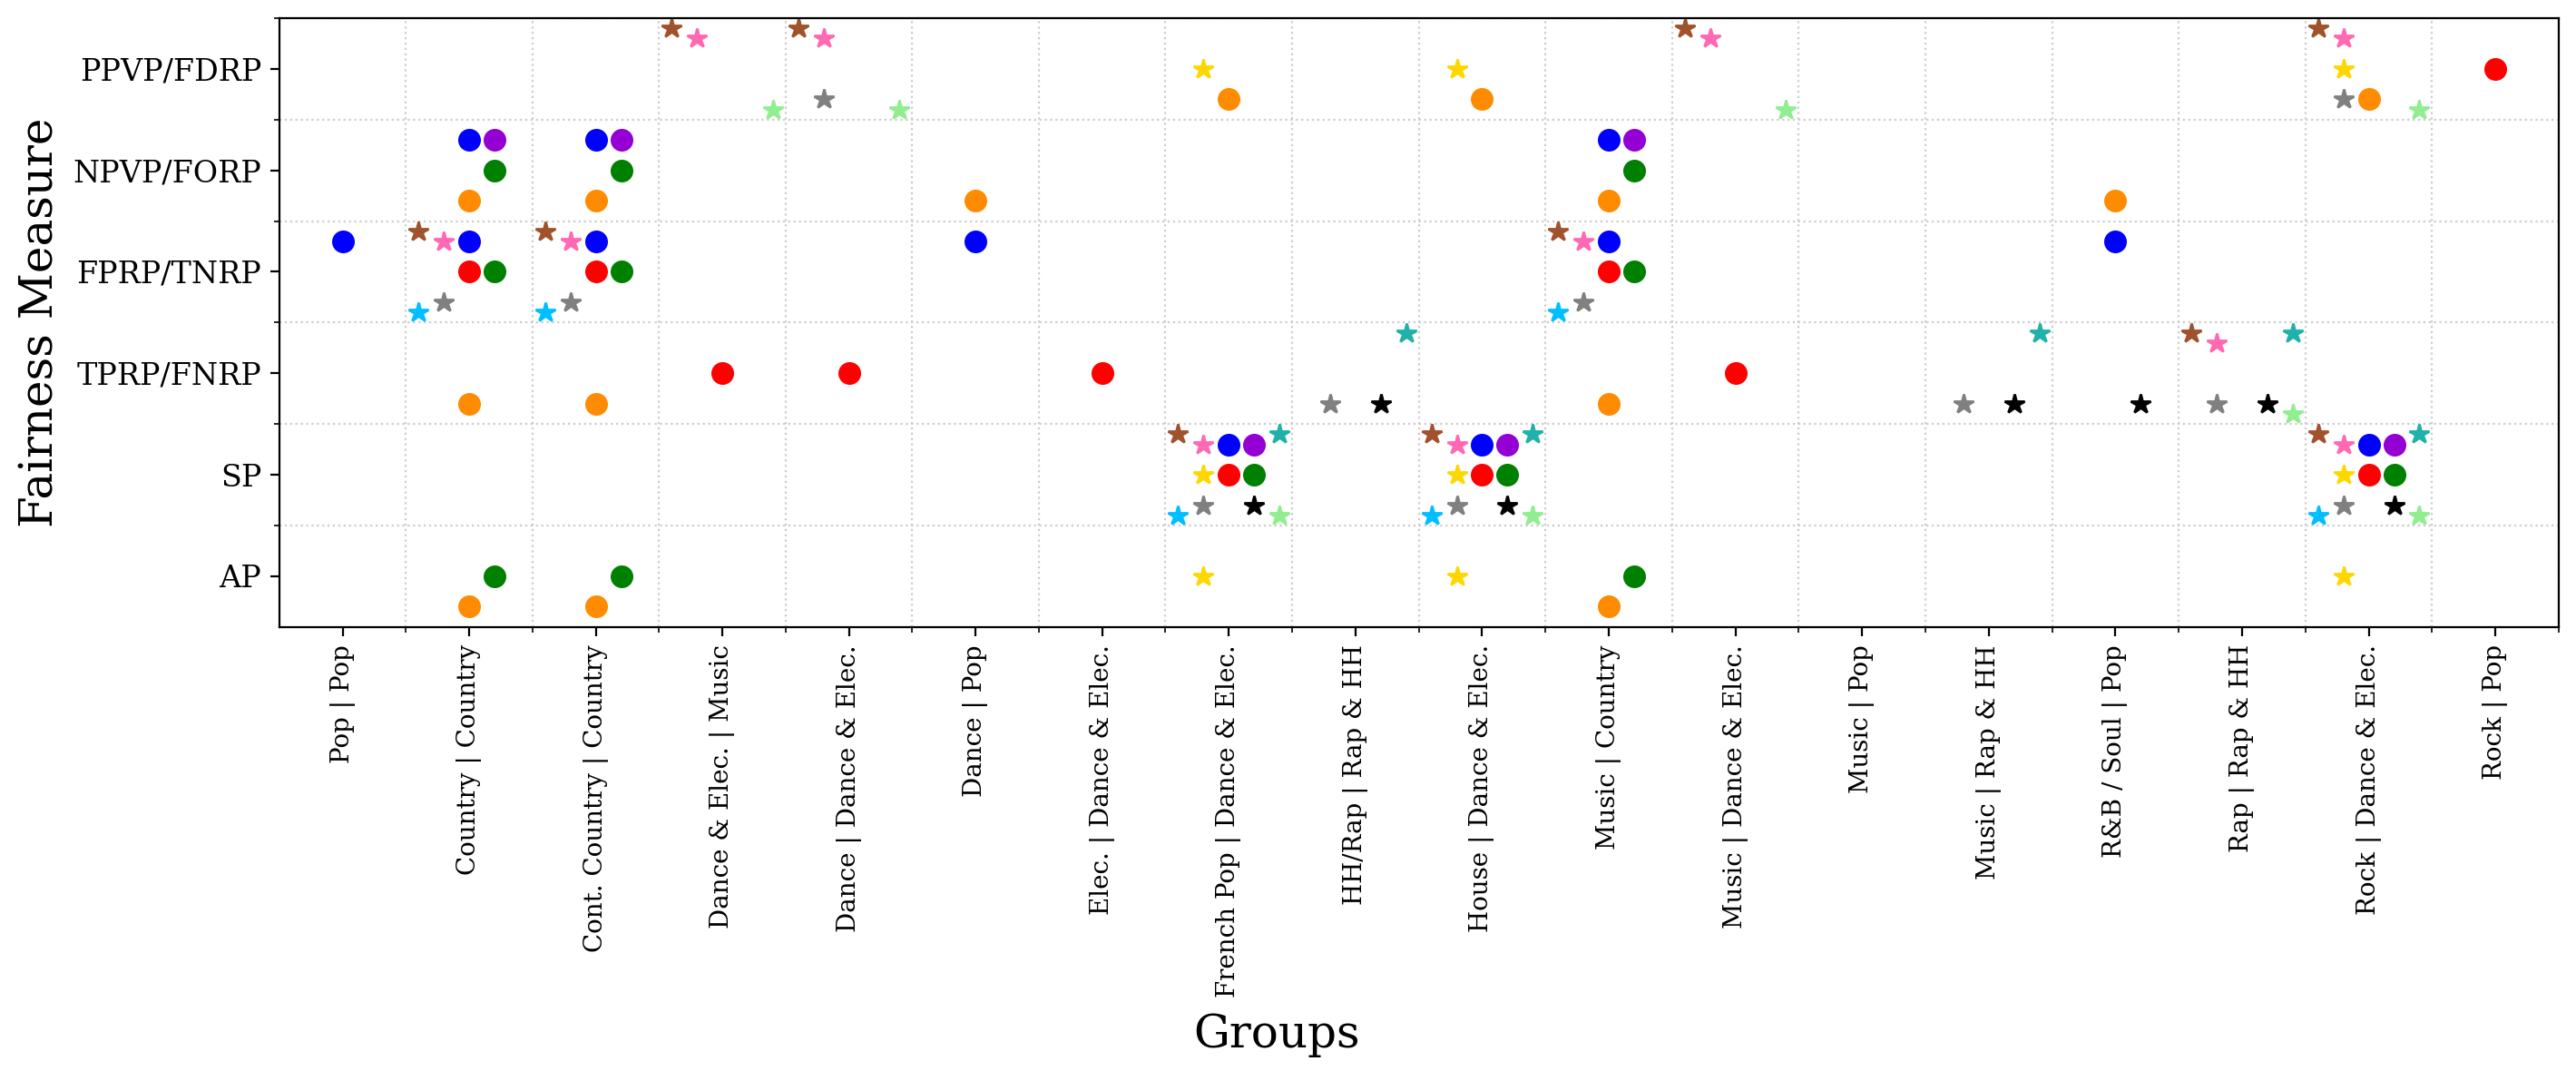
D.4. Shoes Dataset: Single and Pairwise Fairness
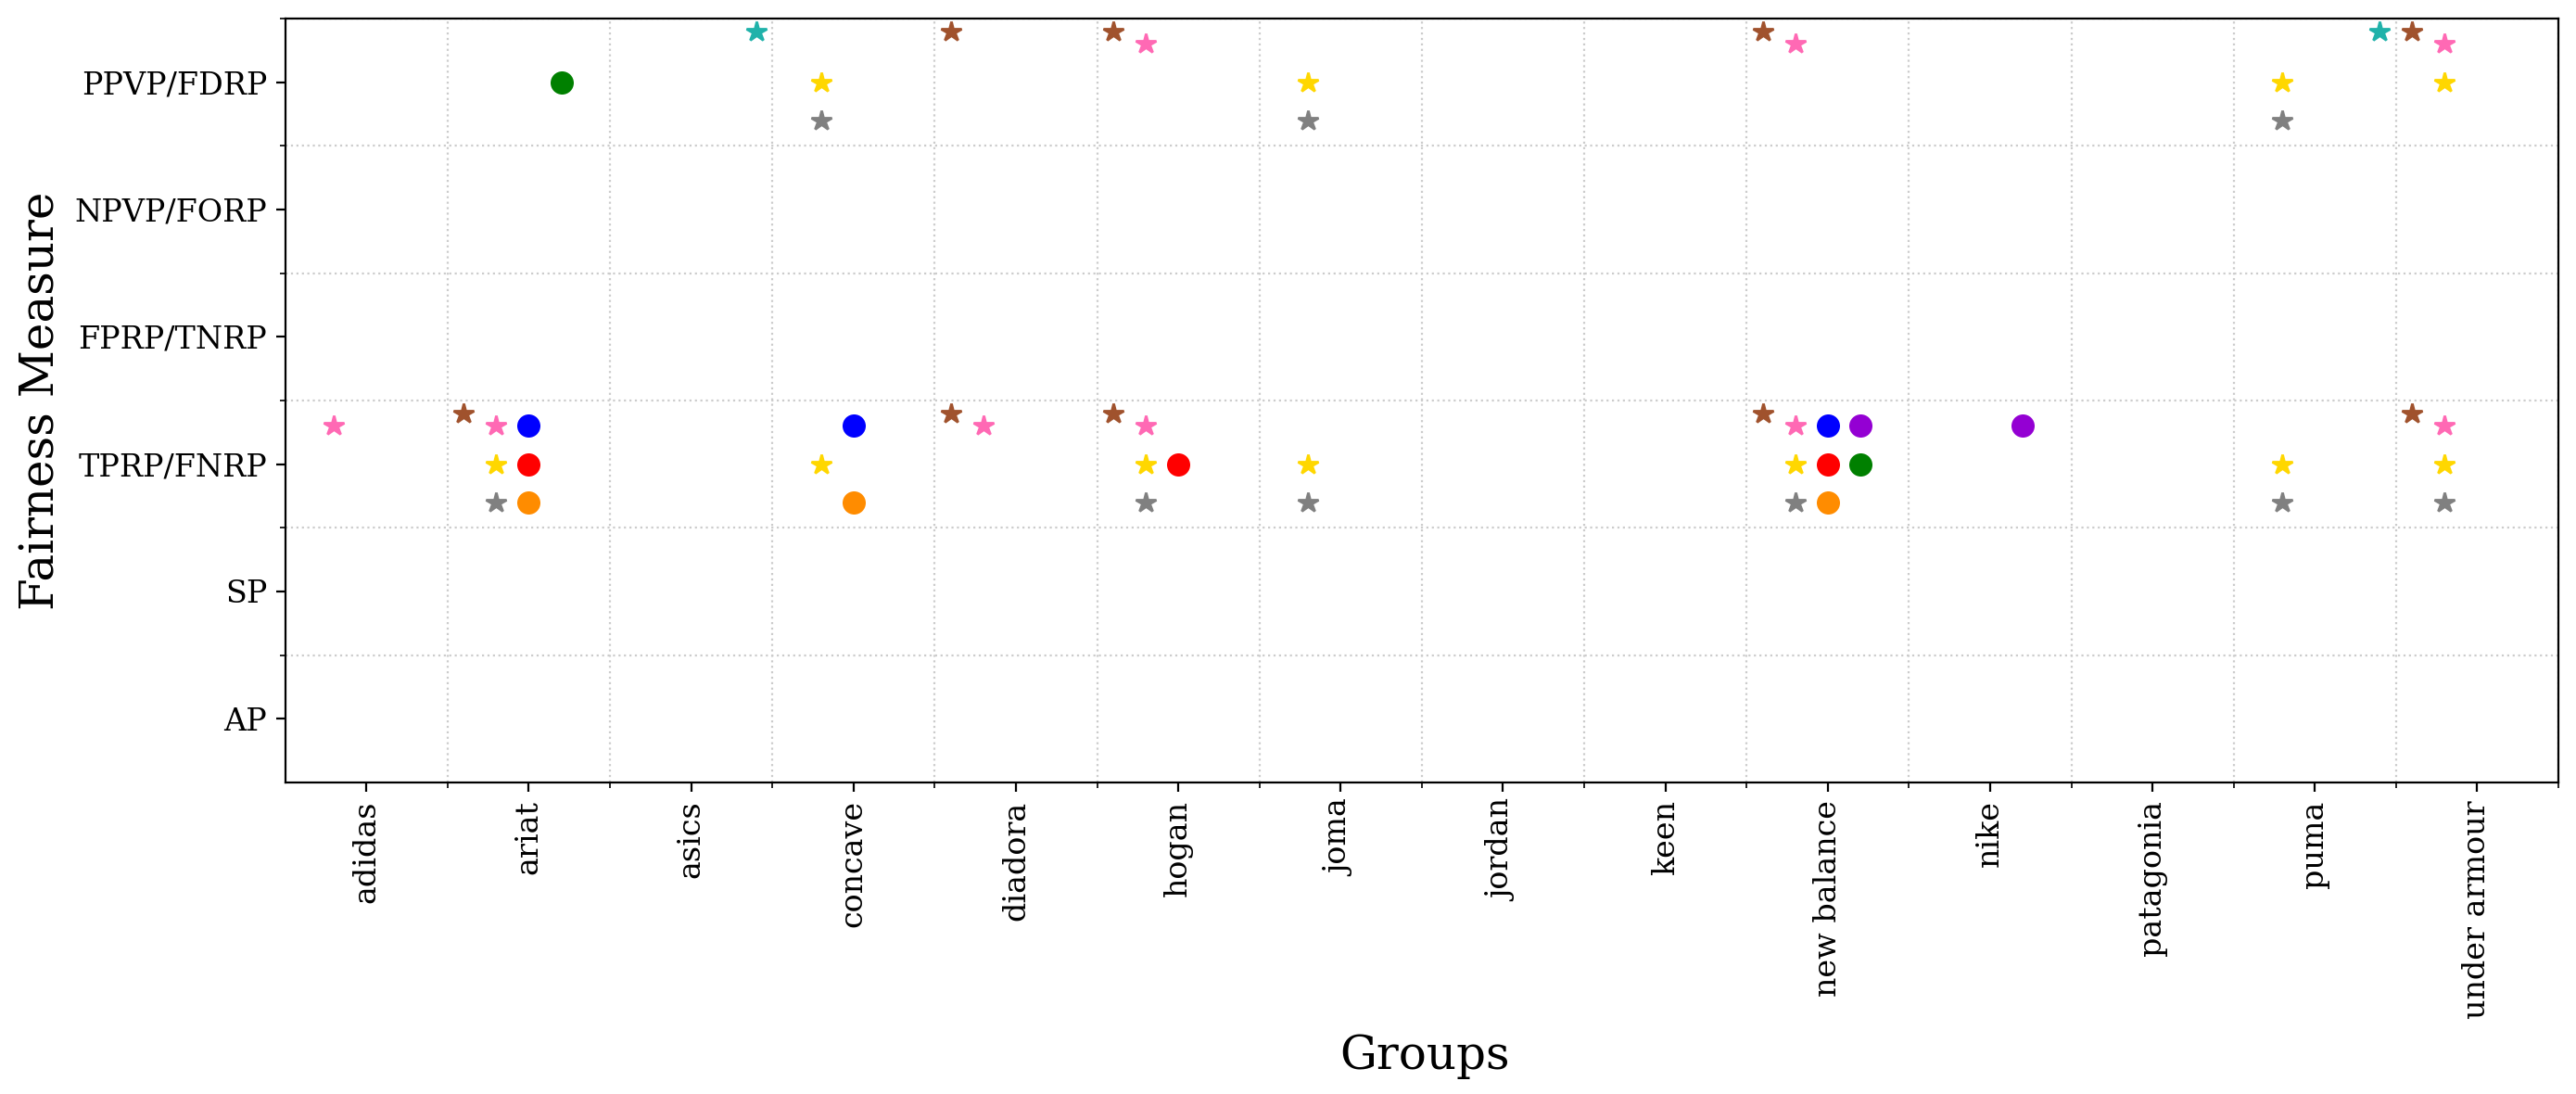
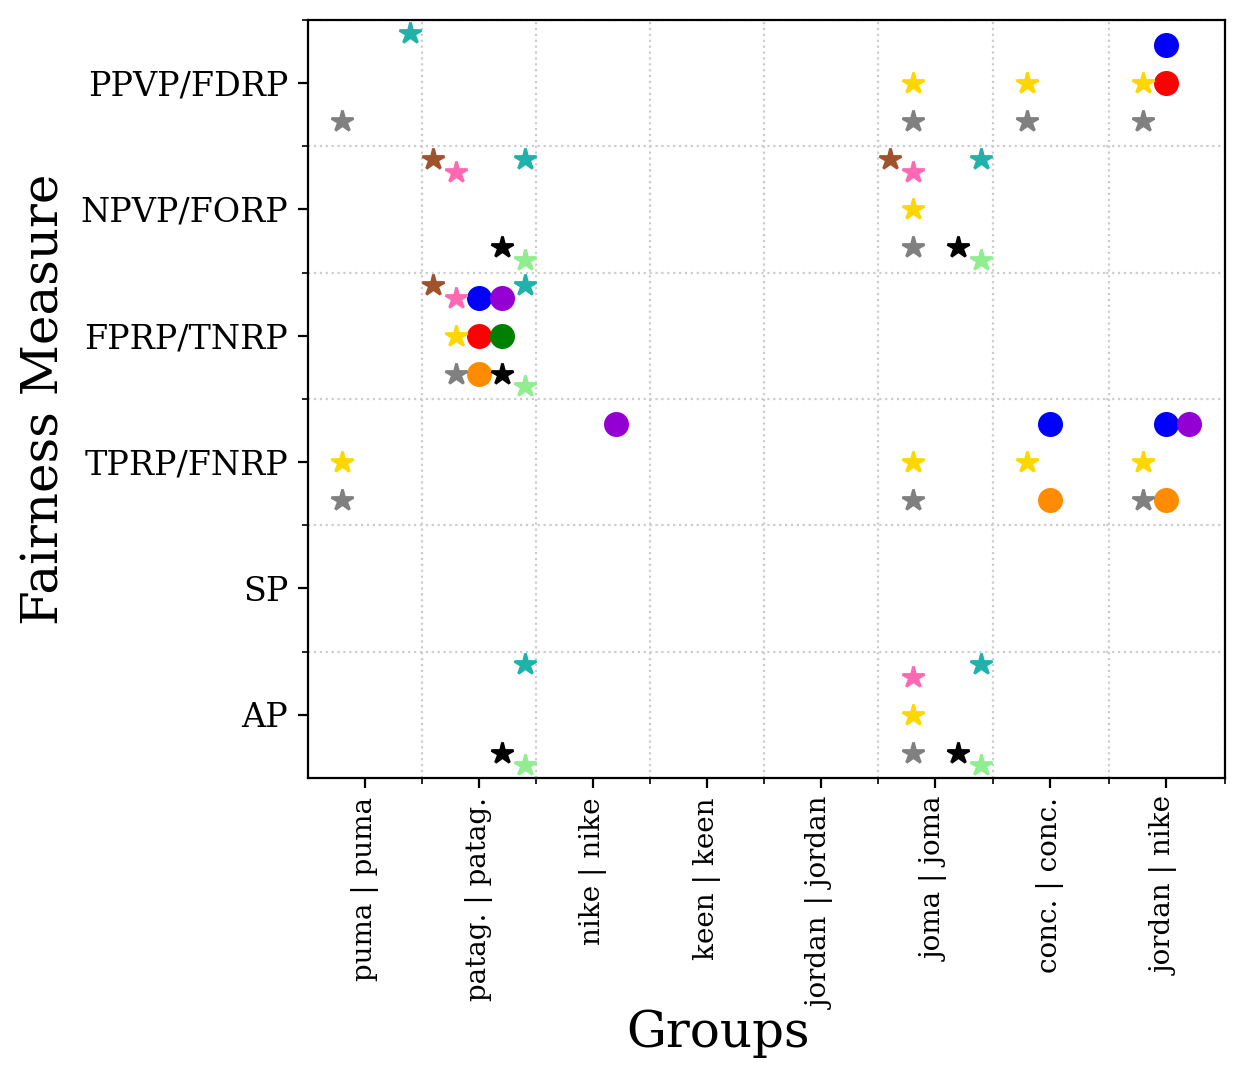
D.5. Matching Threshold vs. Fairness and Accuracy
In Figures 22, 22, 24 we show the behavior of matchers at different matching thresholds for DBLP-ACM, DBLP-Scholar and Cameras datasets w.r.t. accuracy (TPR) and fairness (TPRP). Figures 24, 26, 26, 27, show the same thing for iTunes-Amazon DBLP-ACM, DBLP-Scholar and Cameras datasets w.r.t. accuracy (PPV) and fairness (PPVP).