AT2022aedm and a new class of luminous, fast-cooling transients in elliptical galaxies
Abstract
We present the discovery and extensive follow-up of a remarkable fast-evolving optical transient, AT2022aedm, detected by the Asteroid Terrestrial impact Last Alert Survey (ATLAS). AT2022aedm exhibited a rise time of days in the ATLAS -band, reaching a luminous peak with mag. It faded by 2 magnitudes in -band during the next 15 days. These timescales are consistent with other rapidly evolving transients, though the luminosity is extreme. Most surprisingly, the host galaxy is a massive elliptical with negligible current star formation. X-ray and radio observations rule out a relativistic AT2018cow-like explosion. A spectrum in the first few days after explosion showed short-lived He II emission resembling young core-collapse supernovae, but obvious broad supernova features never developed; later spectra showed only a fast-cooling continuum and narrow, blue-shifted absorption lines, possibly arising in a wind with km s-1. We identify two further transients in the literature (Dougie in particular, as well as AT2020bot) that share similarities in their luminosities, timescales, colour evolution and largely featureless spectra, and propose that these may constitute a new class of transients: luminous fast-coolers (LFCs). All three events occurred in passive galaxies at offsets of kpc from the nucleus, posing a challenge for progenitor models involving massive stars or massive black holes. The light curves and spectra appear to be consistent with shock breakout emission, though usually this mechanism is associated with core-collapse supernovae. The encounter of a star with a stellar mass black hole may provide a promising alternative explanation.
1 Introduction
Astrophysical transients are now found in their thousands by optical time-domain surveys with wide-field robotic telescopes, such as the Asteroid Terrestrial impact Last Alert System (ATLAS; Tonry et al., 2018), Panoramic Survey Telescope and Rapid Response System (Pan-STARRS; Chambers et al., 2016), Zwicky Transient Facility (ZTF; Bellm et al., 2019), and All-sky Automated Search for Supernovae (ASAS-SN; Shappee et al., 2014). These are unearthing a variety of new phenomena, and survey power is now set to increase even further with the Rubin Observatory, the first wide-field survey on an 8m-class telescope (Ivezić et al., 2019).
Improvements in survey cadence allow us to probe populations of transients that rise and fade on timescales of days, compared to the weeks-months of typical supernovae (SNe). The majority of fast transients seem to arise from stripped massive stars (Ho et al., 2023). These include the initial cooling peaks of Type IIb SNe, as well as events strongly interacting with a dense circumstellar medium (CSM) deficient in hydrogen (SNe Ibn; Pastorello et al., 2007; Hosseinzadeh et al., 2017) and sometimes helium (SNe Icn; Fraser et al., 2021; Gal-Yam et al., 2022; Perley et al., 2022).
A more mysterious population of fast transients has also been uncovered, with blue colours and a wide range of peak luminosities up to mag, approaching superluminous supernovae (SLSNe; Quimby et al., 2011; Gal-Yam, 2019). Since their identification in Pan-STARRS by Drout et al. (2014), such objects have been discovered in data from the Palomar Transient Factory and the Supernova Legacy Survey (Arcavi et al., 2016), the Dark Energy Survey (Pursiainen et al., 2018), ATLAS (Prentice et al., 2018), Kepler (Rest et al., 2018), Hyper Suprime Cam (HSC; Tampo et al., 2020; Jiang et al., 2022) and ZTF (Ho et al., 2023). They have been termed Fast Blue Optical Transients (FBOTs) or Rapidly Evolving Transients (RETs). Their association with star-forming galaxies suggests a connection with massive stars (Wiseman et al., 2020), and their photometric evolution appears consistent with shock breakout from a dense, extended envelope (Drout et al., 2014; Pursiainen et al., 2018).
Several of the best observed RETs also show persistent high temperatures and luminous X-ray and radio emission. The most famous example is AT2018cow (Prentice et al., 2019; Margutti et al., 2019; Perley et al., 2019), but other well-studied objects include CSS161010 (Coppejans et al., 2020), AT2018lug (Ho et al., 2020), AT2020xnd (Perley et al., 2021; Ho et al., 2022; Bright et al., 2022), and AT2020mrf (Yao et al., 2022). These ‘Cow-like’ events seem to be energised by continuous injection from a central engine (Margutti et al., 2019), though interaction with CSM can also contribute luminosity (Ho et al., 2020). Tidal disruption events (TDEs) of stars by intermediate-mass black holes (BHs) have been considered as an alternative model (Perley et al., 2019), though accretion onto a stellar-mass BH following the collapse of a massive star appears to be favoured by most authors (e.g Perley et al., 2021; Coppejans et al., 2020; Gottlieb et al., 2022).
Here we present an extraordinary new rapid transient that points to a distinct class of luminous, fast-cooling events. AT2022aedm, or ATLAS22bonw, was discovered by ATLAS on 30 Dec 2022 (Tonry et al., 2022). Spectroscopy carried out the following day by the Advanced Public ESO Spectroscopic Survey of Transient Objects (ePESSTO+; Smartt et al., 2015) suggested a likely SN, though of indeterminate spectral type (Gkini et al., 2022). A spectroscopic host galaxy redshift from the Sloan Digital Sky Survey (SDSS; Albareti et al., 2017) indicated a peak absolute magnitude mag111We assume a flat CDM cosmology with km s-1 Mpc-1 and , giving a luminosity distance Mpc, and a Galactic extinction for this line-of-sight (Schlafly & Finkbeiner, 2011), but the rising light curve was faster than any known SLSN. A relatively featureless spectrum, and most surprisingly an elliptical host galaxy, further added to the intrigue of this event, motivating extensive follow-up observations.
2 Observations
2.1 Ground-based imaging
AT2022aedm was discovered in the ATLAS transient stream processed by the ATLAS Transient Science Server (Smith et al., 2020). Calibrated ATLAS data in the cyan () and orange () bands were obtained using the ATLAS forced photometry service (Tonry et al., 2018; Smith et al., 2020; Shingles et al., 2021). ATLAS typically obtains four exposures per night in a given band; we combined each quad into a single average flux measurement to improve the signal-to-noise ratio. After AT2022aedm had faded below mag, observations were binned over neighbouring nights to improve the signal-to-noise ratio.
Follow-up photometry was obtained from Pan-STARRS in the bands, the Las Cumbres observatory global telescope network (LCO, as part of the Global Supernova Project) in the bands, the Liverpool Telescope (LT) in the bands. Data from the European Southern Observatory New Technology Telescope (NTT) were obtained using both EFOSC2 for the optical bands and SOFI for the near-infrared (NIR) bands, as part of ePESSTO+. Data were reduced (de-biased and flat-fielded) either automatically by facility pipelines, or manually using the PESSTO pipeline (Smartt et al., 2015) in the case of the NTT data.
2.2 Photometry sans frustration
Photometry was performed using a custom pipeline, ‘Photometry Sans Frustration’ (or psf)222https://github.com/mnicholl/photometry-sans-frustration.. This is a fully python-based code, employing aperture and Point-spread function (PSF) fitting photometry routines from astropy (Astropy Collaboration et al., 2013, 2018) and photutils (Bradley et al., 2020). As well as deriving the image background, PSF and zeropoint, the code provides options to automatically download local star catalogs and reference images using astroquery (Ginsburg et al., 2019), solve the coordinate system using astrometry.net (Lang et al., 2010), clean cosmic rays using lacosmic (van Dokkum et al., 2012), align and stack images using astroalign (Beroiz et al., 2020), and subtract transient-free reference images of the field using pyzogy (Zackay et al., 2016; Guevel & Hosseinzadeh, 2017).
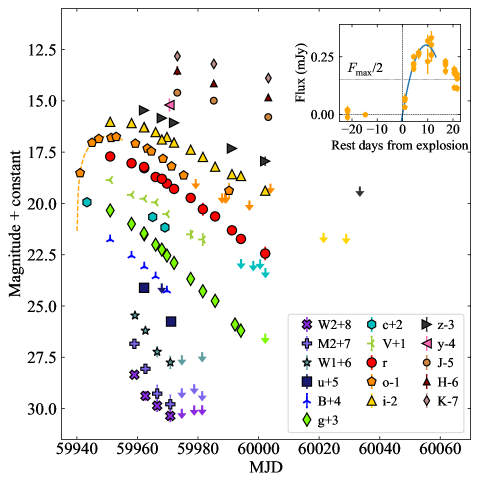
All NTT, LCO and LT images were first cleaned and stacked within each night. Calibration stars and template images were obtained in from Pan-STARRS (Flewelling et al., 2020), in from the SDSS, and in from the VISTA Kilo-degree Galaxy Survey (VIKINGS; Edge et al., 2013). LCO reference images were obtained after the transient faded. The PSF for each science and template image was determined using the local reference stars. All transient fluxes were measured after template subtraction to remove host galaxy light. The full photometric data set is shown in Figure 1.
2.3 Swift observations
We obtained ultraviolet (UV) and X-ray data using target of opportunity observations with the UV-Optical Telescope (UVOT; Roming et al. 2005) and X-ray Telescope (XRT; Burrows et al. 2005) on-board the Neil Gehrels Swift Observatory (Swift; Gehrels et al. 2004). UVOT imaging was carried out in the , and filters. The light curves were measured using a aperture. Count rates were obtained using the Swift uvotsource tools and converted to magnitudes (in the AB system) using the UVOT photometric zero points (Breeveld et al., 2011). No host subtraction was performed in the UV bands, as host contamination is negligible at these wavelengths (this is confirmed by the later UVOT visits that result in only non-detections).
We processed the XRT data using the online analysis tools provided by the UK Swift Science Data Centre (Evans et al., 2007, 2009). AT2022aedm is not detected in the combined ks exposure, with a limiting count rate s-1. Assuming a power-law spectrum with (Coppejans et al., 2020), and a Galactic hydrogen column density towards AT2022aedm of cm-2 (HI4PI Collaboration et al., 2016), this corresponds to an unabsorbed 0.3-10 keV luminosity erg s-1. This upper limit is deeper than the observed X-ray luminosities erg s-1 in AT2018cow (Margutti et al., 2019), AT2020xnd (Ho et al., 2022) and AT2022tsd (Matthews et al., 2023).
2.4 Radio observations
We observed AT2022aedm with the Arcminute Microkelvin Imager - Large Array (AMI–LA; Zwart et al., 2008; Hickish et al., 2018) over 4 epochs, beginning 20 days after discovery. AMI–LA is an eight-dish interferometer based in Cambridge, UK. Each dish is 12.8 m in diameter enabling an angular resolution of . The facility observes at a central frequency of 15.5 GHz with a bandwidth of 5 GHz.
Data taken with AMI–LA were reduced using a custom pipeline reduce_dc. We used 3C286 and J11190410 as the primary and secondary calibrators, respectively, to perform amplitude and phase calibration. The pipeline also flags the data for radio-frequency interference, effects of poor weather and antenna shadowing. The data were then exported in uvfits format ready for imaging.
Further flagging and imaging were conducted in the Common Astronomy Software Applications (casa) (Version 4.7.0 McMullin et al., 2007; CASA Team et al., 2022) using the tasks tfcrop, rflag and clean. AT2022aedm is not detected in any of the final images, with 3 upper limits of Jy at 20, 66, 107 and 110 days after the first optical detection. These correspond to limits on the spectral luminosity of erg s-1 Hz-1. For comparison, Cow-like RETs typically exhibit radio emission at the level of erg s-1 Hz-1 (at GHz) on timescales of months (Coppejans et al., 2020; Ho et al., 2020).
2.5 Spectroscopy
We obtained optical spectra of AT2022aedm using EFOSC2 on the NTT (through ePESSTO+), the LCO 2-m telescopes, the SuperNova Integral Field Spectrograph (SNIFS; Lantz et al., 2004; Tucker et al., 2022) on the University of Hawaii 2.2-m telescope, and Binospec on the 6.5-m MMT (Fabricant et al., 2019). Spectroscopy from ePESSTO+ commenced on 31 Dec 2022 (within one day after the object was flagged by ATLAS) and continued until 20 Feb 2023, by which time the spectrum was indistinguishable from a pre-explosion host galaxy spectrum from SDSS.
Standard reductions of these data, including de-biasing, flat-fielding, spectral extraction, flux and wavelength calibration, were performed using instrument-specific pipelines. The reduced spectra are plotted in Figure 1 and labelled with the instrument and phase with respect to our estimated explosion date. We assume that host galaxy extinction is negligible, supported by the lack of Na ID absorption in these spectra (Poznanski et al., 2012), and the early blue colours in our spectra and photometry. All data will be made publicly available via WISeREP (Yaron & Gal-Yam, 2012).
3 Analysis
3.1 Light curve
The rising light curve of AT2022aedm is well constrained by the early ATLAS -band detections. The discovery point on MJD 59941.1 at mag is a factor below the peak -band flux. Fitting a second-order polynomial to the early flux light curve (Figure 1) indicates the explosion occurred on MJD ( day before the first detection), reaching -band peak on MJD . We take these as the dates of explosion and peak throughout. We note however that the last non-detection is 15 days before detection, so a slightly earlier explosion date cannot be entirely ruled out if the early light curve shape is more complex. The rest-frame rise-time from half the peak flux is days, much shorter than the SLSNe that reach comparable peak luminosities but with days (Nicholl et al., 2015; De Cia et al., 2018; Lunnan et al., 2018).
The fading timescale of AT2022aedm is also much quicker than most other luminous transients. The -band light curve fades by 2 magnitudes in the 15 days after peak, and by 18 days has declined to 10% of peak -band flux. In -band, where we also have the rise, the full-width at half-maximum (i.e. the total time spent within 50% of peak flux) is days. These timescales are well within the distributions measured for RETs discovered in DES (Pursiainen et al., 2018). Although the measured for AT2022aedm is longer than the days defining RETS in PS1 (Drout et al., 2014) and ZTF (Ho et al., 2023), this is attributable to using different photometric filters: we measured in , where the rate of fading in AT2022aedm is slower than in the -band. Correcting by this factor gives an estimated -band of days.
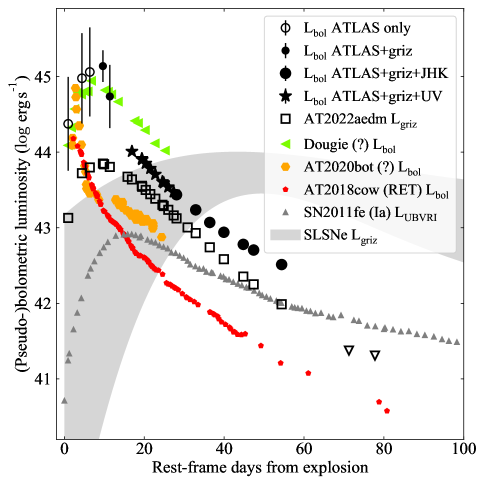
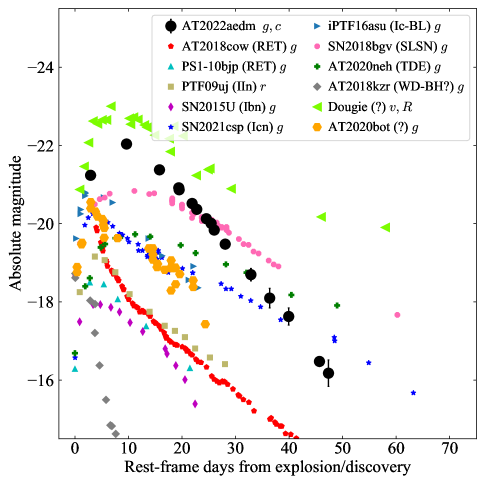
The extinction-corrected -band peak luminosity of AT2022aedm, , makes it one of the brightest RETs discovered to date. It outshines all but one event (DES16E1bir) in the combined PS1+DES+ZTF sample. The closest spectroscopically-classified RETs in terms of luminosity are the Cow-like RETs, typically reaching mag (Ho et al., 2023). To highlight the exceptional luminosity of AT2022aedm, we show a combined - and -band rest-frame light curve in Figure 2, compared to representative examples of different types of fast-fading transients. AT2022aedm is broader and brighter than AT2018cow, but fades faster than the fastest SLSN, SN2018bgv (Chen et al., 2023). It is much more luminous than a typical RET (Drout et al., 2014), the fastest TDE, AT2020neh (Angus et al., 2022), the fastest broad-lined SNe Ic, such as iPTF16asu (Whitesides et al., 2017) (see also SN2018gep and SN2018fcg; Pritchard et al. 2021; Gomez et al. 2022), or any fast interacting transients of Types IIn (Ofek et al., 2010), Ibn (Hosseinzadeh et al., 2017) or Icn (Fraser et al., 2021; Perley et al., 2022).
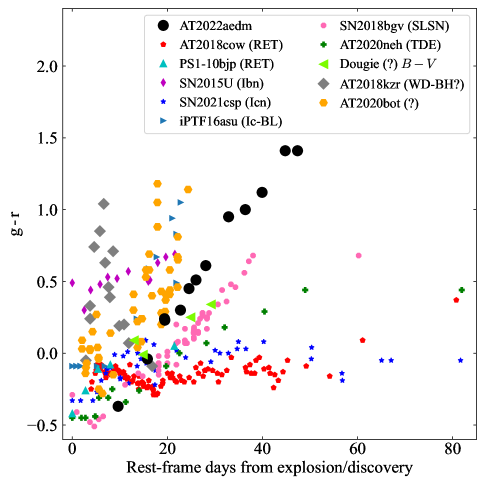
Figure 2 also shows the (or ) colour evolution of AT2022aedm compared to the same sample of objects (where multiple bands are available). From an initial at 10 days after explosion, AT2022aedm dramatically reddens by 1.8 magnitudes in colour index over the next 35 rest-frame days. Cow-like RETs, TDEs, and interacting transients generally show a more gradual or flat colour evolution. The colour change in AT2022aedm is more consistent with events with expanding, cooling photospheres; it lies intermediate between iPTF16asu and SN2018bgv. PS1-10bjp shows a similar colour evolution over the first 10 days.
Two unclassified fast transients show a comparable colour evolution, in combination with a peak absolute magnitude brighter than mag. One is AT2020bot, the only RET in the ZTF sample that did not fit into any of the stripped-envelope, interacting or Cow-like sub-populations (Ho et al., 2023). It is fainter than AT2022aedm, with a faster rise and redder average colour. A stronger similarity is exhibited by ‘Dougie’ (Vinkó et al., 2015), a mysterious transient discovered by ROTSE in 2009. This event peaked at mag after a fast rise of days. The early light curve shape is very similar to AT2022aedm, though the decline may flatten after 30-40 days. However, this flattening could also be due to a host contribution in its UVOT photometry. While the light curve could be plausibly interpreted as a super-Eddington TDE (Vinkó et al., 2015), its position offset from the host nucleus, and lack of distinct spectroscopic features, make this classification far from certain.
3.2 Bolometric light curve
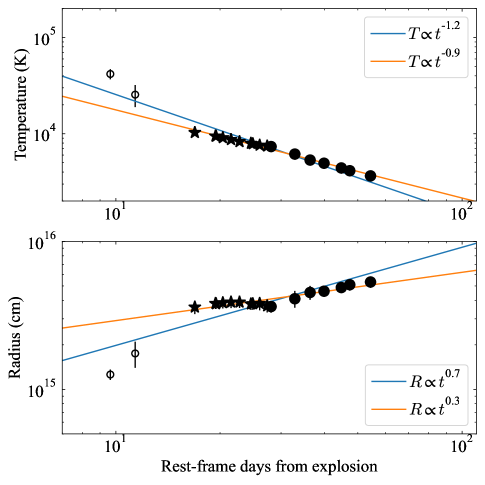
To measure the overall energetics of AT2022aedm, we integrate our multi-band photometry using superbol (Nicholl, 2018). We construct a pseudo-bolometric light curve using the excellent and -band coverage, and estimate the full bolometric light curve by fitting blackbody functions to these bands and to our UV and NIR photometry where available. These light curves are shown in Figure 3.
The peak pseudo-bolometric luminosity is typical of SLSNe, reaching erg s-1, but the light curve rise and decline rates fall well outside the SLSN distribution. The decay rate is comparable to AT2018cow, though the rise is longer than the days exhibited by that event. The estimated full bolometric luminosity of AT2022aedm at peak is exceptionally high, reaching erg s-1. This is due to a high temperature K (shown in the top right panel), suggested by the very blue and colours in the first LCO images. The temperature exhibits a monotonic decline with a scaling of roughly . The blackbody radius increases throughout our observations, suggestive of an expanding photosphere that remains optically thick. The estimated bolometric light curves of Dougie and AT2020bot, also constructed using superbol, peak at similar luminosities to AT2022aedm.
3.3 Spectra
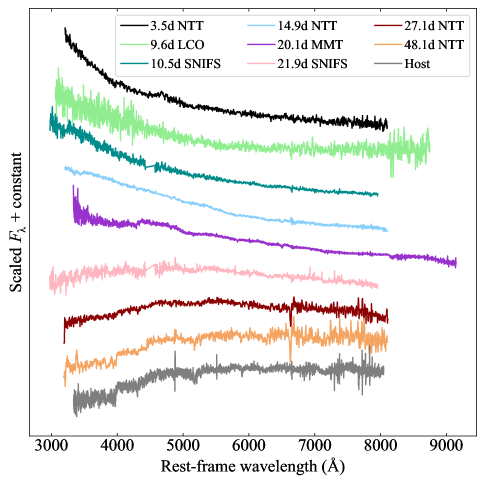
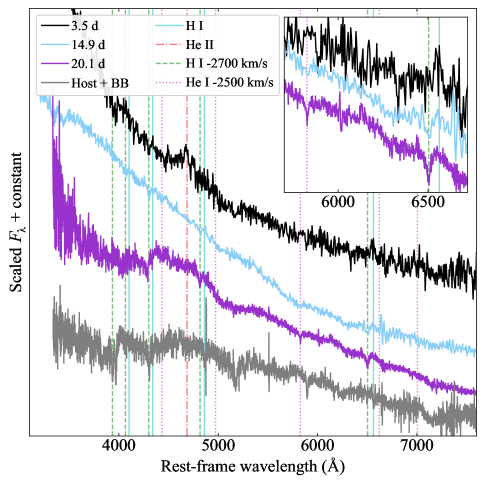
The spectroscopic evolution of AT2022aedm is shown in Figure 1. The cooling observed in the photometry is also evident in its spectra. The first NTT spectrum 3.5 days after explosion shows a strong blue continuum, which weakens and disappears by day 27. By day 48, the spectrum is indistinguishable from an archival SDSS spectrum of the host galaxy.
The spectra mostly lack obvious broad emission, absorption or P Cygni lines typically seen in SNe. The spectra on days 3 and 14 (both from NTT) and 20 (from MMT) with the best signal-to-noise ratios are examined in more detail in Figure 4. Weak broad features may exist at around 4000-5000 Å after day 20, though these could also be caused by contamination from the host galaxy, which is around 2 magnitudes brighter than AT2022aedm at this phase. We show this explicitly by adding an arbitrary K blackbody to the host, finding that this reasonably reproduces the overall shape of the day 20 spectrum.
Figure 4 does show several narrow spectral lines of a clearly transient nature. The day 3 spectrum shows a sharply peaked emission line consistent with He II , possibly with a broader base. This line is often observed in very young SNe (Gal-Yam et al., 2014; Khazov et al., 2016; Bruch et al., 2021) and in TDEs (Gezari et al., 2012; Arcavi et al., 2014), due to the high radiation temperatures capable of ionising helium. We also detect a weak narrow H emission line. Other Balmer lines are not visible at this signal-to-noise. He II is not detected in any later spectra, likely because the temperature has fallen too low to maintain helium ionisation.
The spectra on days 14 and 20 show narrow absorption, rather than emission, from hydrogen and neutral helium. The first three transitions of the Balmer series are clearly visible, but blue-shifted from their rest wavelengths by km s-1. The high-resolution MMT/Binospec data on day 20 also clearly show He I absorption, blue-shifted by km s-1. These lines are not visible in the host spectrum, confirming their association with the transient.
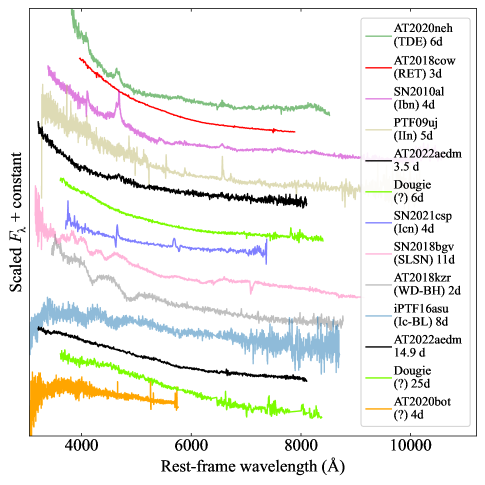
Figure 4 also includes a comparison between the early spectra of AT2022aedm and other fast transients. The initial He II and H emission is reminiscent of some SNe Ibn (Hosseinzadeh et al., 2017), as well as the fast-evolving TDE AT2020neh (Angus et al., 2022). The earliest spectrum is also a reasonable match for young SNe IIn, including the shock-breakout candidate PT09uj (Ofek et al., 2010). However, AT2022aedm never develops the strong emission lines typically seen in these classes at later times. The largely featureless spectrum even at 15 days is a poor match for any fast evolving SN Ic, SLSN, or SN Icn.
Cow-like RETs exhibit quite featureless spectra at peak, but the prototype AT2018cow showed increasingly clear H and He emission lines as it evolved, opposite to the case in AT2022aedm. Interestingly, the spectra of Dougie remained featureless for days (Vinkó et al., 2015), and seemed to cool in a manner similar to AT2022aedm. AT2020bot lacks a full spectroscopic time series, making a detailed comparison difficult. It shows an unusual spectrum at maximum light. Ho et al. (2023) note the presence of possible broad features, weak compared to typical SN lines and without an obvious identification. In section 3.1 we observed that these two events also shared some key photometric properties with AT2022aedm.
3.4 Host galaxy
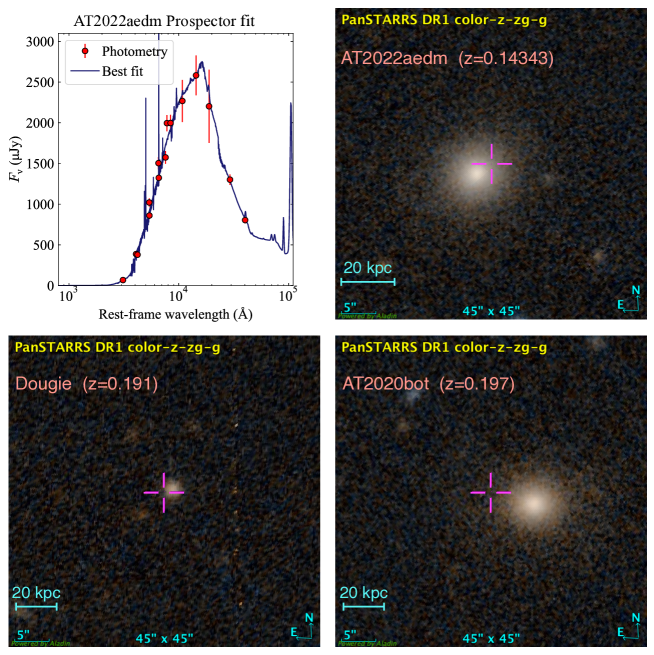
The host galaxy of AT2022aedm is LEDA 1245338 (or SDSS J111927.73+030632.7). This is a bright, red galaxy with mag; Figure 5 illustrates this with a colour image obtained from Pan-STARRS. An SDSS spectrum is also available (shown in Figure 4). Both the SDSS spectral fitting and Galaxy Zoo morphological analysis classify LEDA 1245338 as an elliptical galaxy.
The SDSS data release also includes automated analysis of the SDSS spectrum with the Portsmouth pipeline (using the method of Maraston et al. 2009). The spectral fitting measures a total stellar mass of M⊙, and a star-formation rate (SFR) consistent with zero. They find a mean age of the stellar population of 4.8 Gyr. Given that SED modelling is highly sensitive to the assumed functional form of the star-formation history (Carnall et al., 2019; Leja et al., 2019), we run our own analysis on the host photometry, over a wider wavelength range, using prospector (Johnson et al., 2021). In particular, we use the prospector- model employing a non-parametric star-formation history, with 6 equal-mass star-forming bins of flexible width (see Leja et al., 2017, for details). We include archival host photometry from SDSS, the 2 Micron All-Sky Survey (2MASS; Skrutskie et al., 2006), and the Wide-field Infrared Survey Explorer (WISE; Wright et al., 2010). The fit is shown in Figure 5. We measure M⊙, consistent with SDSS results, and a specific SFR in the last 50 Myr of .
The SDSS analyses and our prospector results confirm that the host of AT2022aedm is a massive, ‘red and dead’ galaxy. This is surprising: recent work by Irani et al. (2022) shows that less than 1% of core-collapse explosions occur in such environments. Moreover, this galaxy is especially unlike the hosts of most transients with comparable luminosity. SLSNe occur almost exclusively in low-mass galaxies with M⊙ (Lunnan et al., 2014; Leloudas et al., 2015; Perley et al., 2016; Chen et al., 2017; Schulze et al., 2018), and their average specific star-formation rate is three orders of magnitude greater than our measurement for AT2022aedm. Bright RETs are also found in relatively low-mass, star-forming host galaxies: the sSFRs of the RET hosts in PS1 and DES span , with only three (out of 73) fitting best to a passive galaxy model, and only two having a stellar mass greater than M⊙. Wiseman et al. (2020) conducted a systematic analysis of RET hosts in DES, finding evidence for star-formation in all of the 49 galaxies for which redshifts were available, and the five RETs from HSC were also found in star-forming galaxies (Tampo et al., 2020).
Notably, two other fast transients from our photometric and spectroscopic comparisons also occurred in elliptical galaxies: Dougie and AT2020bot (Vinkó et al., 2015; Ho et al., 2023). The Pan-STARRS images of their hosts are shown alongside AT2022aedm in Figure 5. We also note that one SN Ibn, PS1-12sk, exploded in a bright elliptical, prompting Hosseinzadeh et al. (2019) to suggest that not all SNe Ibn result from massive stars.
4 Discussion
4.1 A new class of transient?
AT2022aedm is a puzzling event with a very unusual set of properties:
-
•
a high peak luminosity in the optical, with mag
-
•
no luminous radio or X-ray emission
-
•
fast rise and decline rates, fading mag per week in the -band
-
•
rapid cooling from K to K in a few weeks following peak
-
•
a spectrum dominated by a smooth continuum with no high equivalent width absorption or emission lines at any phase
-
•
a massive host galaxy comprised of an old stellar population, with no evidence for current star formation.
This combination is not consistent with any known class of transients. An extensive search of the literature reveals two other objects which share the key properties: mag, rise time days, fast decline and colour evolution, and weak spectroscopic features at all times. Together, these events indicate a new class of fast transients with high optical luminosities and fast cooling after peak. Dougie (Vinkó et al., 2015) in particular shows a strong photometric and spectroscopic similarity, while AT2022bot (Ho et al., 2023) may represent an even faster-evolving member of this class. All three occurred off-centre within passive host galaxies, indicating that – uniquely among RETs – these new ‘Luminous Fast Coolers’ (LFCs) do not require young stellar populations.
4.2 Rates
We estimate the volumetric rate of these events using the ATLAS Survey Simulator (McBrien, 2021; Srivastav et al., 2022). Interpolated absolute light curves of AT2022aedm in and bands are inserted into the simulation at 10,000 random times, positions and redshifts (up to some ), and compared to the cadence, footprint and depth of the true ATLAS survey to determine the number of detections of each injected event.
We define a discovery as those objects detected in more than images (or nights, since ATLAS typically obtains a quad of exposures per night at a given pointing). We then calculate the fraction classified of all real transients brighter in apparent magnitude than the injected transient at and having at least the same number of ATLAS detections, and take this as our spectroscopic completeness. The rate is then
| (1) |
where yr is the duration of the mock survey (with the factor accounting for time dilation over the observed redshift range), is the differential comoving volume between redshift and , and are the fractions discovered and classified, and is the number of observed AT2022aedm-like transients in ATLAS.
We set , covering the redshift range within which LFCs have been discovered, and set . The latter is motivated by the modal number of detections for real ATLAS transients, and with observations on 5 nights should also enable identification of the fast light curve shape. Varying leads to less than a factor two variation in our derived rate, due to a trade-off between and : stricter requirements lead to a smaller discovered sample but with a higher spectroscopic completeness. For these parameters, our survey simulation returns and , giving Gpc-3 yr-1.
We caution that this estimate applies to the brightest LFCs such as AT2022aedm and Dougie, and that fainter and faster events such as AT2020bot are likely more common volumetrically but harder to detect. Nevertheless, our derived rate indicates that these events are very rare, of the core-collapse SN rate. This rate is lower than the SLSN rate of a few Gpc-3 yr-1 (Frohmaier et al., 2021), but may be consistent with the rate of Cow-like events, estimated as Gpc-3 yr-1 (Ho et al., 2023).
4.3 Physical scenarios for LFCs
4.3.1 Tidal disruption events
Vinkó et al. (2015) favoured a TDE as the origin of Dougie. A model with a relatively low-mass BH of M⊙ provided a good match to the fast evolving light curve. Although the host galaxy luminosity was more consistent with a central BH mass of M⊙, Dougie’s location kpc from the nucleus could indicate a disruption around a wandering intermediate-mass BH.
This scenario has difficulties accounting for AT2022aedm. We are unable to find an acceptable fit using the TDE model in mosfit333This is an updated version of the same model used to fit Dougie; see Guillochon et al. (2014). (Guillochon et al., 2018; Mockler et al., 2019), where models cannot reproduce the steep decline from peak or the fast colour evolution. The shallower decay of Dougie at late times may include some host contribution, causing a flattening that mimics the power-law decay of TDE models.
Other circumstantial problems arise in trying to explain LFCs as TDEs. AT2022aedm and AT2020bot have even larger offsets from the nuclei of their hosts. In particular, AT2020bot shows an offset of kpc, in the outskirts of the galaxy where the stellar density is low. This would make a TDE very unlikely (though at available imaging depths we cannot rule out a globular cluster). TDE models would also need to explain why these offset events show such a strong evolution in colour compared to TDEs in their host nuclei, and are so much brighter than other TDEs with fast evolution (Blagorodnova et al., 2017; Nicholl et al., 2020; Charalampopoulos et al., 2022; Angus et al., 2022).
4.3.2 Nickel powering and white dwarf explosions
Most SNe are heated by the decay of radioactive nickel (56Ni) to cobalt and then iron, but this mechanism can be excluded for many of the known RETs (e.g. Drout et al., 2014; Pursiainen et al., 2018; Perley et al., 2021). The problem is that fast light curves require low ejecta masses (), while bright peak luminosities require large nickel masses (). Drout et al. (2014) showed that to produce a peak luminosity of erg and a rise time days, a nickel-powered model would need an ejecta velocity . We can probably rule out a very relativistic explosion in the case of AT2022aedm, due to our radio non-detections, though cannot exclude a mildly relativistic expansion. More problematic is the requirement for M⊙. This would produce a spectrum dominated by iron-group absorption, very different to the blue and largely featureless spectra of LFCs at peak.
Despite the difficulties with a pure nickel-powered model, white dwarf progenitor models (i.e. variants of SNe Ia) would still be appealing to explain transients in old stellar populations. A SN Ia interacting with a dense CSM could produce a peak luminosity well in excess of typical SNe Ia without requiring . However, our NTT observations at 70–80 days after explosion indicate that AT2022aedm had already faded below the luminosity of a SN Ia at the same epoch, making a hidden SN Ia unlikely. Moreover, known interacting SNe Ia produce spectra with strong, broad hydrogen emission and broad metal P Cygni lines (Silverman et al., 2013), very unlike the spectra of LFCs.
4.3.3 Magnetar birth
Rapidly rotating nascent magnetars are suspected to play a role in many luminous and/or rapid transients, such as SLSNe, gamma-ray bursts and fast radio bursts. Central engines are also thought to be required in the Cow-like RETs. Powering short-timescale, luminous events like LFCs would require a combination of rapid rotation to provide a large energy reservoir, a strong magnetic field to extract this energy quickly, and a low ejecta mass (e.g. Kasen & Bildsten, 2010). We find that although the mosfit magnetar model (Nicholl et al., 2017) is able to adequately fit the decline phase of AT2022aedm, it struggles to simultaneously match the fast rise, even with an ejecta mass M⊙.
The environments of known LFCs are also a major problem for this model. SLSNe and long GRBs are thought to prefer low-metallicity, star-forming galaxies because these are favourable for rapidly-rotating core collapse. The massive, elliptical hosts of LFCs are decidedly unfavourable. Less than 1% of core-collapse SNe occur in elliptical galaxies (Irani et al., 2022), and likely not all form magnetars. Kouveliotou et al. (1998) estimate that only of core-collapses form magnetars, though more recent work finds a potentially larger but rather uncertain fraction of (Beniamini et al., 2019). In any case, it appears unlikely that three unusual magnetar-forming explosions would all be found in elliptical galaxies. Moreover, the blue-shifted narrow H and He lines in the later spectra of AT2022aedm may indicate a dense wind pre-explosion, which would strip angular momentum and inhibit magnetar formation.
4.3.4 Shock breakout
Interaction with CSM is another mechanism thought to be responsible for many luminous or unusual transients, including (SL)SNe IIn, and fast events like SNe Ibn/Icn. Models for luminous SNe IIn generally invoke a massive CSM that releases energy slowly via post-shock diffusion (Smith & McCray, 2007). In the case of rapidly evolving transients, the more relevant models are shock breakout from an extended CSM or wind, which have been investigated by Chevalier & Irwin (2011) and Ginzburg & Balberg (2012). This model provided a reasonable explanation for the rapid SN IIn, PTF09uj (Ofek et al., 2010), and other RETs (Drout et al., 2014). The early He II emission in AT2022aedm is often seen during the shock breakout phase in normal Type II SNe (Gal-Yam et al., 2014; Bruch et al., 2022).
We apply the equations of Chevalier & Irwin (2011), following the prescriptions from Margutti et al. (2014), to estimate the ejecta and wind masses required in AT2022aedm. We set the input parameters based on our superbol results: peak time days, total radiated energy erg, and breakout radius cm. The equations are degenerate in , where is the kinetic energy of the explosion. We find M⊙, with a wind density parameter444Defined as , where is the wind density at radius . . For a wind velocity of 2700 km s-1, based on the blue-shifted absorption lines in the spectrum, this corresponds to a pre-explosion mass-loss rate M⊙ yr-1.
Vinkó et al. (2015) noted that Dougie could also be explained by a reasonable shock-powered model, with an estimated erg deposited in M⊙ of CSM, but disfavoured this model based on the lack of shock-excited lines in the spectrum. AT2022aedm shows that emission lines can be very weak and short-lived in these events, perhaps making a CSM interpretation of Dougie more palatable. Nevertheless, the parameters we infer for AT2022aedm (if shock breakout is the dominant power source) are difficult to associate with any specific progenitor. For a standard erg explosion, the low ejecta mass would be indicative of an ultra-stripped SN, yet the wind is H- and He-rich, and the unsustainable high mass-loss rate would require that it is lost in the years immediately before explosion. For a very energetic explosion with erg, the implied ejecta mass is a more reasonable M⊙. But this large energy would likely require a massive progenitor, increasing the tension with the passive host galaxies of the LFCs.
4.4 Stellar mass compact mergers
The old stellar populations hosting AT2022aedm and other LFCs are more compatible with a compact object origin, rather than massive stars. However, we encountered inconsistencies interpreting these objects as white dwarf explosions or TDEs from massive BHs. Fortunately, recent years have seen rapid progress in understanding the diversity of transients resulting from mergers involving neutron stars (NS) and stellar mass BHs, and we compare to such models here.
Kilonovae, transients powered by the decay of heavy elements ejected from NS mergers, have been discovered in targeted follow-up of gravitational waves (Abbott et al., 2017; Margutti & Chornock, 2021) and gamma-ray bursts (Tanvir et al., 2013; Berger et al., 2013; Rastinejad et al., 2022). However, LFCs are much brighter and bluer than any plausible kilonovae, in which low ejecta masses M⊙ and large opacities conspire to produce faint, red transients visible for only a few days in the optical. While no definitive detections exist, kilonovae from NS-BH mergers are expected to be even fainter and redder than those from binary NSs (Gompertz et al., 2023). AT2018kzr was a so-far unique event suggested to be the merger of a NS with a white dwarf (McBrien et al., 2019; Gillanders et al., 2020). It was somewhat brighter and longer lived than known kilonovae, peaking at mag. However, it still faded much faster than LFCs (Figure 2) and showed broad metal absorption lines resembling SNe Ic, inconsistent with our events (Figure 4).
Lyutikov & Toonen (2019) proposed that Cow-like RETs can arise from accretion-induced collapse following the merger of a carbon-oxygen white dwarf with an oxygen-neon-magnesium white dwarf. This model produces a magnetar in combination with a low ejecta mass. If one of the white dwarfs retained a surface hydrogen layer (type DA), a residual pre-collapse wind can help to explain the observed lines in the spectrum of AT2022aedm. This model may be a plausible progenitor channel for LFCs. However, it also predicts Cow-like non-thermal emission, which is ruled out in the case of AT2022aedm. This channel also has a short delay time, such that the host galaxies are likely to still be star-forming, in tension with the elliptical hosts of our objects. Brooks et al. (2017) suggest another channel for RETs from the collapse of a long-lived remnant of a helium white dwarf merging with an oxygen-neon white dwarf, though these models were fainter than our LFCs.
Finally, mergers involving a main sequence or evolved star with a stellar mass BH have also been suggested as progenitors of Cow-like events. Given the older host environments in LFCs, mergers with Wolf-Rayet stars (Metzger, 2022) are probably disfavoured in this case. A merger of a BH with a lower mass He core is more consistent with a long delay time. In this case the accretion rate is expected to be much lower, though additional luminosity could be produced by interaction of disk winds with stellar material lost earlier in the merger (Metzger & Pejcha, 2017).
Kremer et al. (2021, 2023) presented models for tidal disruptions of main sequence stars by stellar mass BHs in dense clusters. Some of their wind-reprocessed models exhibit optical rise times and post-peak temperatures similar to LFCs. However, while bolometric luminosities can reach erg s-1, most of this energy is emitted in the UV and X-ray regime, and none of the models reach the peak optical magnitudes of our objects.
Noting the early similarity of AT2022aedm to some TDE spectra, we encourage a broader exploration of the parameter space for stellar-mass TDEs. Another important test of TDE models (stellar or intermediate mass) will be identifying globular clusters at the positions of LFCs. The James Webb Space Telescope (JWST) can reach the peak of the globular cluster luminosity function ( mag; Harris & Racine 1979) in 10 ks with NIRCam for an event within 200 Mpc. At the distance of AT2022aedm, it is possible to achieve the same constraint in ks. We note however that the angular extent of a typical globular cluster at this distance is comparable to the NIRCam pixel scale, making identification challenging.
5 Conclusions
We have presented a detailed analysis of AT2022aedm, a very unusual, rapidly evolving transient in a massive elliptical galaxy. It has a rise time days, a luminous peak mag, and a fast decline of 2 mag in the subsequent 15 days. The optical colours evolve quickly to the red during the decline phase, while the spectrum remains devoid of identifiable broad features throughout. We do however detect narrow emission lines of H and He II during the first few days, reminiscent of shock cooling in young SNe, and narrow blue-shifted absorption lines at later times.
We identify two previous transients, both with uncertain classifications, that share the key properties of bright peaks, fast declines, strong colour evolution and spectra without high-equivalent width emission or absorption lines. This suggests that AT2022aedm represents a well-observed example of a previously unrecognised class of luminous, fast-cooling events that we term LFCs. All three events occurred in passive galaxies, with offsets of kpc.
Their unique combination of properties poses challenges for any physical scenario. The passive environments disfavour a massive star origin, while the light curves and spectra are inconsistent with thermonuclear SNe interacting with a dense medium. Mergers of compact object binaries are unable to reproduce the peak luminosity. Tidal disruption of a star by an intermediate mass BH, as suggested for Dougie (Vinkó et al., 2015), may struggle to produce the fast colour evolution. Instead we find that these events may be broadly consistent with an extreme shock breakout, though from an as-yet unknown progenitor. Alternatively, models of TDEs from stellar-mass BHs show promise, though current models emit too much of their luminosity in the UV and X-rays. Refinements of stellar-mass TDE models, and searches for dense local environments at the sites of LFCs, should help to confirm or rule out this scenario.
We thank Brian Metzger, Eliot Quataert, and an anonymous referee for helful comments that improved this paper. We thank Anna Ho for sharing the data on AT2020bot. We also thank Joe Bright, Paul Scott and David Titterington for help with the AMI-LA observations. MN, AA and XS are supported by the European Research Council (ERC) under the European Union’s Horizon 2020 research and innovation programme (grant agreement No. 948381) and by UK Space Agency Grant No. ST/Y000692/1. PR is supported by STFC Grant 2742655. SJS acknowledges funding from STFC Grant ST/X006506/1 and ST/T000198/1. TP acknowledges the support by ANID through the Beca Doctorado Nacional 202221222222. JV is supported by NKFIH-OTKA grant K-142534 from the National Research, Development and Innovation Office, Hungary. T-W.C thanks the Max Planck Institute for Astrophysics for hosting her as a guest researcher. MP is supported by a research grant (19054) from VILLUM FONDEN. PC acknowledges support via an Academy of Finland grant (340613; P.I. R. Kotak). PW acknowledges support from the Science and Technology Facilities Council (STFC) grant ST/R000506/1. MF is supported by a Royal Society - Science Foundation Ireland University Research Fellowship. MK is partially supported by the program Unidad de Excelencia María de Maeztu CEX2020-001058-M. LG, CPG, MK and TEMB acknowledge support from Unidad de Excelencia María de Maeztu CEX2020-001058-M, from Centro Superior de Investigaciones Científicas (CSIC) under the PIE project 20215AT016, and from the Spanish Ministerio de Ciencia e Innovación (MCIN) and the Agencia Estatal de Investigación (AEI) 10.13039/501100011033 under the PID2020-115253GA-I00 HOSTFLOWS project. L.G. also acknowledges support from the European Social Fund (ESF) “Investing in your future” under the 2019 Ramón y Cajal program RYC2019-027683-I. CPG also acknowledges financial support from the Secretary of Universities and Research (Government of Catalonia) and by the Horizon 2020 Research and Innovation Programme of the European Union under the Marie Sklodowska-Curie and the Beatriu de Pinós 2021 BP 00168 programme. TEMB also acknowledges financial support from the 2021 Juan de la Cierva program FJC2021-047124-I. GPS acknowledges support from The Royal Society, the Leverhulme Trust, and the Science and Technology Facilities Council (grant numbers ST/N021702/1 and ST/S006141/1). FEB acknowledges support from ANID-Chile BASAL CATA ACE210002 and FB210003, FONDECYT Regular 1200495, and Millennium Science Initiative Program – ICN12_009.
ATLAS is primarily funded through NASA grants NN12AR55G, 80NSSC18K0284, and 80NSSC18K1575. The ATLAS science products are provided by the University of Hawaii, QUB, STScI, SAAO and Millennium Institute of Astrophysics in Chile. The Pan-STARRS telescopes are supported by NASA Grants NNX12AR65G and NNX14AM74G. Based on observations collected at the European Organisation for Astronomical Research in the Southern Hemisphere, Chile, as part of ePESSTO+ (the advanced Public ESO Spectroscopic Survey for Transient Objects Survey). ePESSTO + observations were obtained under ESO programme ID 108.220C (PI:Inserra). This work makes use of data from the Las Cumbres Observatory global network of telescopes. The LCO group is supported by NSF grants AST-1911151 and AST-1911225. The Liverpool Telescope is operated on the island of La Palma by Liverpool John Moores University in the Spanish Observatorio del Roque de los Muchachos of the Instituto de Astrofisica de Canarias with financial support from the UK Science and Technology Facilities Council. We thank the staff of the Mullard Radio Astronomy Observatory for their assistance in the maintenance and operation of AMI, which is supported by the Universities of Cambridge and Oxford. We also acknowledge support from the European Research Council under grant ERC-2012-StG-307215 LODESTONE.
References
- Abbott et al. (2017) Abbott, B. P., Abbott, R., Abbott, T. D., et al. 2017, Phys. Rev. Lett., 119, 161101, doi: 10.1103/PhysRevLett.119.161101
- Albareti et al. (2017) Albareti, F. D., Allende Prieto, C., Almeida, A., et al. 2017, ApJS, 233, 25, doi: 10.3847/1538-4365/aa8992
- Angus et al. (2022) Angus, C. R., Baldassare, V. F., Mockler, B., et al. 2022, Nature Astronomy, 6, 1452, doi: 10.1038/s41550-022-01811-y
- Arcavi et al. (2014) Arcavi, I., Gal-Yam, A., Sullivan, M., et al. 2014, ApJ, 793, 38, doi: 10.1088/0004-637X/793/1/38
- Arcavi et al. (2016) Arcavi, I., Wolf, W. M., Howell, D. A., et al. 2016, ApJ, 819, 35, doi: 10.3847/0004-637X/819/1/35
- Astropy Collaboration et al. (2013) Astropy Collaboration, Robitaille, T. P., Tollerud, E. J., et al. 2013, A&A, 558, A33, doi: 10.1051/0004-6361/201322068
- Astropy Collaboration et al. (2018) Astropy Collaboration, Price-Whelan, A. M., Sipőcz, B. M., et al. 2018, AJ, 156, 123, doi: 10.3847/1538-3881/aabc4f
- Bellm et al. (2019) Bellm, E. C., Kulkarni, S. R., Graham, M. J., et al. 2019, PASP, 131, 018002, doi: 10.1088/1538-3873/aaecbe
- Beniamini et al. (2019) Beniamini, P., Hotokezaka, K., van der Horst, A., & Kouveliotou, C. 2019, MNRAS, 487, 1426, doi: 10.1093/mnras/stz1391
- Berger et al. (2013) Berger, E., Fong, W., & Chornock, R. 2013, ApJ, 774, L23, doi: 10.1088/2041-8205/774/2/L23
- Beroiz et al. (2020) Beroiz, M., Cabral, J. B., & Sanchez, B. 2020, Astronomy and Computing, 32, 100384, doi: 10.1016/j.ascom.2020.100384
- Blagorodnova et al. (2017) Blagorodnova, N., Gezari, S., Hung, T., et al. 2017, ApJ, 844, 46, doi: 10.3847/1538-4357/aa7579
- Bonnarel et al. (2000) Bonnarel, F., Fernique, P., Bienaymé, O., et al. 2000, A&AS, 143, 33, doi: 10.1051/aas:2000331
- Bradley et al. (2020) Bradley, L., Sipőcz, B., Robitaille, T., et al. 2020, astropy/photutils: 1.0.0, 1.0.0, Zenodo, Zenodo, doi: 10.5281/zenodo.4044744
- Breeveld et al. (2011) Breeveld, A. A., Landsman, W., Holland, S. T., et al. 2011, in American Institute of Physics Conference Series, Vol. 1358, Gamma Ray Bursts 2010, ed. J. E. McEnery, J. L. Racusin, & N. Gehrels, 373–376, doi: 10.1063/1.3621807
- Bright et al. (2022) Bright, J. S., Margutti, R., Matthews, D., et al. 2022, ApJ, 926, 112, doi: 10.3847/1538-4357/ac4506
- Brooks et al. (2017) Brooks, J., Schwab, J., Bildsten, L., et al. 2017, ApJ, 850, 127, doi: 10.3847/1538-4357/aa9568
- Bruch et al. (2021) Bruch, R. J., Gal-Yam, A., Schulze, S., et al. 2021, ApJ, 912, 46, doi: 10.3847/1538-4357/abef05
- Bruch et al. (2022) Bruch, R. J., Gal-Yam, A., Yaron, O., et al. 2022, arXiv e-prints, arXiv:2212.03313, doi: 10.48550/arXiv.2212.03313
- Burrows et al. (2005) Burrows, D. N., Hill, J. E., Nousek, J. A., et al. 2005, Space Science Reviews, 120, 165, doi: 10.1007/s11214-005-5097-2
- Carnall et al. (2019) Carnall, A. C., Leja, J., Johnson, B. D., et al. 2019, ApJ, 873, 44, doi: 10.3847/1538-4357/ab04a2
- CASA Team et al. (2022) CASA Team, Bean, B., Bhatnagar, S., et al. 2022, PASP, 134, 114501, doi: 10.1088/1538-3873/ac9642
- Chambers et al. (2016) Chambers, K. C., Magnier, E. A., Metcalfe, N., et al. 2016, arXiv e-prints, arXiv:1612.05560, doi: 10.48550/arXiv.1612.05560
- Charalampopoulos et al. (2022) Charalampopoulos, P., Pursiainen, M., Leloudas, G., et al. 2022, arXiv e-prints, arXiv:2209.12913, doi: 10.48550/arXiv.2209.12913
- Chen et al. (2017) Chen, T.-W., Smartt, S. J., Yates, R. M., et al. 2017, MNRAS, 470, 3566, doi: 10.1093/mnras/stx1428
- Chen et al. (2023) Chen, Z. H., Yan, L., Kangas, T., et al. 2023, ApJ, 943, 41, doi: 10.3847/1538-4357/aca161
- Chevalier & Irwin (2011) Chevalier, R. A., & Irwin, C. M. 2011, ApJ, 729, L6, doi: 10.1088/2041-8205/729/1/L6
- Coppejans et al. (2020) Coppejans, D. L., Margutti, R., Terreran, G., et al. 2020, ApJ, 895, L23, doi: 10.3847/2041-8213/ab8cc7
- De Cia et al. (2018) De Cia, A., Gal-Yam, A., Rubin, A., et al. 2018, ApJ, 860, 100, doi: 10.3847/1538-4357/aab9b6
- Drout et al. (2014) Drout, M. R., Chornock, R., Soderberg, A. M., et al. 2014, ApJ, 794, 23, doi: 10.1088/0004-637X/794/1/23
- Edge et al. (2013) Edge, A., Sutherland, W., Kuijken, K., et al. 2013, The Messenger, 154, 32
- Evans et al. (2007) Evans, P. A., Beardmore, A. P., Page, K. L., et al. 2007, A&A, 469, 379, doi: 10.1051/0004-6361:20077530
- Evans et al. (2009) —. 2009, MNRAS, 397, 1177, doi: 10.1111/j.1365-2966.2009.14913.x
- Fabricant et al. (2019) Fabricant, D., Fata, R., Epps, H., et al. 2019, PASP, 131, 075004, doi: 10.1088/1538-3873/ab1d78
- Flewelling et al. (2020) Flewelling, H. A., Magnier, E. A., Chambers, K. C., et al. 2020, ApJS, 251, 7, doi: 10.3847/1538-4365/abb82d
- Fraser et al. (2021) Fraser, M., Stritzinger, M. D., Brennan, S. J., et al. 2021, arXiv e-prints, arXiv:2108.07278, doi: 10.48550/arXiv.2108.07278
- Frohmaier et al. (2021) Frohmaier, C., Angus, C. R., Vincenzi, M., et al. 2021, MNRAS, 500, 5142, doi: 10.1093/mnras/staa3607
- Gal-Yam (2019) Gal-Yam, A. 2019, ARA&A, 57, 305, doi: 10.1146/annurev-astro-081817-051819
- Gal-Yam et al. (2014) Gal-Yam, A., Arcavi, I., Ofek, E. O., et al. 2014, Nature, 509, 471, doi: 10.1038/nature13304
- Gal-Yam et al. (2022) Gal-Yam, A., Bruch, R., Schulze, S., et al. 2022, Nature, 601, 201, doi: 10.1038/s41586-021-04155-1
- Gehrels et al. (2004) Gehrels, N., Chincarini, G., Giommi, P., et al. 2004, ApJ, 611, 1005, doi: 10.1086/422091
- Gezari et al. (2012) Gezari, S., Chornock, R., Rest, A., et al. 2012, Nature, 485, 217, doi: 10.1038/nature10990
- Gillanders et al. (2020) Gillanders, J. H., Sim, S. A., & Smartt, S. J. 2020, MNRAS, 497, 246, doi: 10.1093/mnras/staa1822
- Ginsburg et al. (2019) Ginsburg, A., Sipőcz, B. M., Brasseur, C. E., et al. 2019, AJ, 157, 98, doi: 10.3847/1538-3881/aafc33
- Ginzburg & Balberg (2012) Ginzburg, S., & Balberg, S. 2012, ApJ, 757, 178, doi: 10.1088/0004-637X/757/2/178
- Gkini et al. (2022) Gkini, A., Pessi, P., Brennan, S., et al. 2022, Transient Name Server Classification Report, 2022-3690, 1
- Gomez et al. (2022) Gomez, S., Berger, E., Nicholl, M., Blanchard, P. K., & Hosseinzadeh, G. 2022, ApJ, 941, 107, doi: 10.3847/1538-4357/ac9842
- Gompertz et al. (2023) Gompertz, B. P., Nicholl, M., Smith, J. C., et al. 2023, arXiv e-prints, arXiv:2305.07582, doi: 10.48550/arXiv.2305.07582
- Gottlieb et al. (2022) Gottlieb, O., Tchekhovskoy, A., & Margutti, R. 2022, MNRAS, 513, 3810, doi: 10.1093/mnras/stac910
- Guevel & Hosseinzadeh (2017) Guevel, D., & Hosseinzadeh, G. 2017, Dguevel/Pyzogy: Initial Release, v0.0.1, Zenodo, Zenodo, doi: 10.5281/zenodo.1043973
- Guillochon et al. (2014) Guillochon, J., Manukian, H., & Ramirez-Ruiz, E. 2014, ApJ, 783, 23, doi: 10.1088/0004-637X/783/1/23
- Guillochon et al. (2018) Guillochon, J., Nicholl, M., Villar, V. A., et al. 2018, ApJS, 236, 6, doi: 10.3847/1538-4365/aab761
- Harris et al. (2020) Harris, C. R., Millman, K. J., van der Walt, S. J., et al. 2020, Nature, 585, 357, doi: 10.1038/s41586-020-2649-2
- Harris & Racine (1979) Harris, W. E., & Racine, R. 1979, ARA&A, 17, 241, doi: 10.1146/annurev.aa.17.090179.001325
- HI4PI Collaboration et al. (2016) HI4PI Collaboration, Ben Bekhti, N., Flöer, L., et al. 2016, A&A, 594, A116, doi: 10.1051/0004-6361/201629178
- Hickish et al. (2018) Hickish, J., Razavi-Ghods, N., Perrott, Y. C., et al. 2018, MNRAS, 475, 5677, doi: 10.1093/mnras/sty074
- Ho et al. (2020) Ho, A. Y. Q., Perley, D. A., Kulkarni, S. R., et al. 2020, ApJ, 895, 49, doi: 10.3847/1538-4357/ab8bcf
- Ho et al. (2022) Ho, A. Y. Q., Margalit, B., Bremer, M., et al. 2022, ApJ, 932, 116, doi: 10.3847/1538-4357/ac4e97
- Ho et al. (2023) Ho, A. Y. Q., Perley, D. A., Gal-Yam, A., et al. 2023, ApJ, 949, 120, doi: 10.3847/1538-4357/acc533
- Hosseinzadeh et al. (2017) Hosseinzadeh, G., Arcavi, I., Valenti, S., et al. 2017, ApJ, 836, 158, doi: 10.3847/1538-4357/836/2/158
- Hosseinzadeh et al. (2019) Hosseinzadeh, G., Cowperthwaite, P. S., Gomez, S., et al. 2019, ApJ, 880, L4, doi: 10.3847/2041-8213/ab271c
- Hunter (2007) Hunter, J. D. 2007, Computing in Science and Engineering, 9, 90, doi: 10.1109/MCSE.2007.55
- Irani et al. (2022) Irani, I., Prentice, S. J., Schulze, S., et al. 2022, ApJ, 927, 10, doi: 10.3847/1538-4357/ac4709
- Ivezić et al. (2019) Ivezić, Ž., Kahn, S. M., Tyson, J. A., et al. 2019, ApJ, 873, 111, doi: 10.3847/1538-4357/ab042c
- Jiang et al. (2022) Jiang, J.-a., Yasuda, N., Maeda, K., et al. 2022, ApJ, 933, L36, doi: 10.3847/2041-8213/ac7390
- Johnson et al. (2021) Johnson, B. D., Leja, J., Conroy, C., & Speagle, J. S. 2021, ApJS, 254, 22, doi: 10.3847/1538-4365/abef67
- Kasen & Bildsten (2010) Kasen, D., & Bildsten, L. 2010, ApJ, 717, 245, doi: 10.1088/0004-637X/717/1/245
- Khazov et al. (2016) Khazov, D., Yaron, O., Gal-Yam, A., et al. 2016, ApJ, 818, 3, doi: 10.3847/0004-637X/818/1/3
- Kouveliotou et al. (1998) Kouveliotou, C., Dieters, S., Strohmayer, T., et al. 1998, Nature, 393, 235, doi: 10.1038/30410
- Kremer et al. (2021) Kremer, K., Lu, W., Piro, A. L., et al. 2021, ApJ, 911, 104, doi: 10.3847/1538-4357/abeb14
- Kremer et al. (2023) Kremer, K., Mockler, B., Piro, A. L., & Lombardi Jr, J. C. 2023, arXiv e-prints, arXiv:2305.08905. https://arxiv.org/abs/2305.08905
- Lang et al. (2010) Lang, D., Hogg, D. W., Mierle, K., Blanton, M., & Roweis, S. 2010, AJ, 139, 1782, doi: 10.1088/0004-6256/139/5/1782
- Lantz et al. (2004) Lantz, B., Aldering, G., Antilogus, P., et al. 2004, in Society of Photo-Optical Instrumentation Engineers (SPIE) Conference Series, Vol. 5249, Optical Design and Engineering, ed. L. Mazuray, P. J. Rogers, & R. Wartmann, 146–155, doi: 10.1117/12.512493
- Leja et al. (2019) Leja, J., Carnall, A. C., Johnson, B. D., Conroy, C., & Speagle, J. S. 2019, ApJ, 876, 3, doi: 10.3847/1538-4357/ab133c
- Leja et al. (2017) Leja, J., Johnson, B. D., Conroy, C., van Dokkum, P. G., & Byler, N. 2017, ApJ, 837, 170, doi: 10.3847/1538-4357/aa5ffe
- Leloudas et al. (2015) Leloudas, G., Patat, F., Maund, J. R., et al. 2015, ApJ, 815, L10, doi: 10.1088/2041-8205/815/1/L10
- Lunnan et al. (2014) Lunnan, R., Chornock, R., Berger, E., et al. 2014, ApJ, 787, 138, doi: 10.1088/0004-637X/787/2/138
- Lunnan et al. (2018) —. 2018, ApJ, 852, 81, doi: 10.3847/1538-4357/aa9f1a
- Lyutikov & Toonen (2019) Lyutikov, M., & Toonen, S. 2019, MNRAS, 487, 5618, doi: 10.1093/mnras/stz1640
- Maraston et al. (2009) Maraston, C., Strömbäck, G., Thomas, D., Wake, D. A., & Nichol, R. C. 2009, MNRAS, 394, L107, doi: 10.1111/j.1745-3933.2009.00621.x
- Margutti & Chornock (2021) Margutti, R., & Chornock, R. 2021, ARA&A, 59, 155, doi: 10.1146/annurev-astro-112420-030742
- Margutti et al. (2014) Margutti, R., Milisavljevic, D., Soderberg, A. M., et al. 2014, ApJ, 797, 107, doi: 10.1088/0004-637X/797/2/107
- Margutti et al. (2019) Margutti, R., Metzger, B. D., Chornock, R., et al. 2019, ApJ, 872, 18, doi: 10.3847/1538-4357/aafa01
- Matthews et al. (2023) Matthews, D. J., Margutti, R., Metzger, B. D., et al. 2023, arXiv e-prints, arXiv:2306.01114, doi: 10.48550/arXiv.2306.01114
- McBrien (2021) McBrien, O. 2021, PhD thesis, Queen’s University Belfast
- McBrien et al. (2019) McBrien, O. R., Smartt, S. J., Chen, T.-W., et al. 2019, ApJ, 885, L23, doi: 10.3847/2041-8213/ab4dae
- McMullin et al. (2007) McMullin, J. P., Waters, B., Schiebel, D., Young, W., & Golap, K. 2007, in Astronomical Society of the Pacific Conference Series, Vol. 376, Astronomical Data Analysis Software and Systems XVI, ed. R. A. Shaw, F. Hill, & D. J. Bell, 127
- Metzger (2022) Metzger, B. D. 2022, ApJ, 932, 84, doi: 10.3847/1538-4357/ac6d59
- Metzger & Pejcha (2017) Metzger, B. D., & Pejcha, O. 2017, MNRAS, 471, 3200, doi: 10.1093/mnras/stx1768
- Mockler et al. (2019) Mockler, B., Guillochon, J., & Ramirez-Ruiz, E. 2019, ApJ, 872, 151, doi: 10.3847/1538-4357/ab010f
- Nicholl (2018) Nicholl, M. 2018, Research Notes of the American Astronomical Society, 2, 230, doi: 10.3847/2515-5172/aaf799
- Nicholl (2023) —. 2023, PSF: photometry-sans-frustration, v1.0, Zenodo, doi: 10.5281/zenodo.8205720
- Nicholl et al. (2017) Nicholl, M., Guillochon, J., & Berger, E. 2017, ApJ, 850, 55, doi: 10.3847/1538-4357/aa9334
- Nicholl et al. (2015) Nicholl, M., Smartt, S. J., Jerkstrand, A., et al. 2015, MNRAS, 452, 3869, doi: 10.1093/mnras/stv1522
- Nicholl et al. (2020) Nicholl, M., Wevers, T., Oates, S. R., et al. 2020, MNRAS, 499, 482, doi: 10.1093/mnras/staa2824
- Nugent et al. (2011) Nugent, P. E., Sullivan, M., Cenko, S. B., et al. 2011, Nature, 480, 344, doi: 10.1038/nature10644
- Ofek et al. (2010) Ofek, E. O., Rabinak, I., Neill, J. D., et al. 2010, ApJ, 724, 1396, doi: 10.1088/0004-637X/724/2/1396
- Pastorello et al. (2007) Pastorello, A., Smartt, S. J., Mattila, S., et al. 2007, Nature, 447, 829, doi: 10.1038/nature05825
- Perley et al. (2016) Perley, D. A., Quimby, R. M., Yan, L., et al. 2016, ApJ, 830, 13, doi: 10.3847/0004-637X/830/1/13
- Perley et al. (2019) Perley, D. A., Mazzali, P. A., Yan, L., et al. 2019, MNRAS, 484, 1031, doi: 10.1093/mnras/sty3420
- Perley et al. (2021) Perley, D. A., Ho, A. Y. Q., Yao, Y., et al. 2021, MNRAS, 508, 5138, doi: 10.1093/mnras/stab2785
- Perley et al. (2022) Perley, D. A., Sollerman, J., Schulze, S., et al. 2022, ApJ, 927, 180, doi: 10.3847/1538-4357/ac478e
- Poznanski et al. (2012) Poznanski, D., Prochaska, J. X., & Bloom, J. S. 2012, MNRAS, 426, 1465, doi: 10.1111/j.1365-2966.2012.21796.x
- Prentice et al. (2018) Prentice, S. J., Maguire, K., Smartt, S. J., et al. 2018, ApJ, 865, L3, doi: 10.3847/2041-8213/aadd90
- Prentice et al. (2019) Prentice, S. J., Ashall, C., James, P. A., et al. 2019, MNRAS, 485, 1559, doi: 10.1093/mnras/sty3399
- Pritchard et al. (2021) Pritchard, T. A., Bensch, K., Modjaz, M., et al. 2021, ApJ, 915, 121, doi: 10.3847/1538-4357/ac00bc
- Pursiainen et al. (2018) Pursiainen, M., Childress, M., Smith, M., et al. 2018, MNRAS, 481, 894, doi: 10.1093/mnras/sty2309
- Quimby et al. (2011) Quimby, R. M., Kulkarni, S. R., Kasliwal, M. M., et al. 2011, Nature, 474, 487, doi: 10.1038/nature10095
- Rastinejad et al. (2022) Rastinejad, J. C., Gompertz, B. P., Levan, A. J., et al. 2022, Nature, 612, 223, doi: 10.1038/s41586-022-05390-w
- Rest et al. (2018) Rest, A., Garnavich, P. M., Khatami, D., et al. 2018, Nature Astronomy, 2, 307, doi: 10.1038/s41550-018-0423-2
- Roming et al. (2005) Roming, P. W. A., Kennedy, T. E., Mason, K. O., et al. 2005, Space Science Reviews, 120, 95, doi: 10.1007/s11214-005-5095-4
- Schlafly & Finkbeiner (2011) Schlafly, E. F., & Finkbeiner, D. P. 2011, ApJ, 737, 103, doi: 10.1088/0004-637X/737/2/103
- Schulze et al. (2018) Schulze, S., Krühler, T., Leloudas, G., et al. 2018, MNRAS, 473, 1258, doi: 10.1093/mnras/stx2352
- Shappee et al. (2014) Shappee, B. J., Prieto, J. L., Grupe, D., et al. 2014, ApJ, 788, 48, doi: 10.1088/0004-637X/788/1/48
- Shingles et al. (2021) Shingles, L., Smith, K. W., Young, D. R., et al. 2021, Transient Name Server AstroNote, 7, 1
- Silverman et al. (2013) Silverman, J. M., Nugent, P. E., Gal-Yam, A., et al. 2013, ApJS, 207, 3, doi: 10.1088/0067-0049/207/1/3
- Skrutskie et al. (2006) Skrutskie, M. F., Cutri, R. M., Stiening, R., et al. 2006, AJ, 131, 1163, doi: 10.1086/498708
- Smartt et al. (2015) Smartt, S. J., Valenti, S., Fraser, M., et al. 2015, A&A, 579, A40, doi: 10.1051/0004-6361/201425237
- Smith et al. (2020) Smith, K. W., Smartt, S. J., Young, D. R., et al. 2020, PASP, 132, 085002, doi: 10.1088/1538-3873/ab936e
- Smith & McCray (2007) Smith, N., & McCray, R. 2007, ApJ, 671, L17, doi: 10.1086/524681
- Srivastav et al. (2022) Srivastav, S., Smartt, S. J., Huber, M. E., et al. 2022, MNRAS, 511, 2708, doi: 10.1093/mnras/stac177
- Tampo et al. (2020) Tampo, Y., Tanaka, M., Maeda, K., et al. 2020, ApJ, 894, 27, doi: 10.3847/1538-4357/ab7ccc
- Tanvir et al. (2013) Tanvir, N. R., Levan, A. J., Fruchter, A. S., et al. 2013, Nature, 500, 547, doi: 10.1038/nature12505
- Tonry et al. (2022) Tonry, J., Denneau, L., Weiland, H., et al. 2022, Transient Name Server Discovery Report, 2022-3680, 1
- Tonry et al. (2018) Tonry, J. L., Denneau, L., Heinze, A. N., et al. 2018, PASP, 130, 064505, doi: 10.1088/1538-3873/aabadf
- Tucker et al. (2022) Tucker, M. A., Shappee, B. J., Huber, M. E., et al. 2022, PASP, 134, 124502, doi: 10.1088/1538-3873/aca719
- van Dokkum et al. (2012) van Dokkum, P. G., Bloom, J., & Tewes, M. 2012, L.A.Cosmic: Laplacian Cosmic Ray Identification, Astrophysics Source Code Library, record ascl:1207.005. http://ascl.net/1207.005
- Vinkó et al. (2015) Vinkó, J., Yuan, F., Quimby, R. M., et al. 2015, ApJ, 798, 12, doi: 10.1088/0004-637X/798/1/12
- Virtanen et al. (2020) Virtanen, P., Gommers, R., Oliphant, T. E., et al. 2020, Nature Methods, 17, 261, doi: 10.1038/s41592-019-0686-2
- Whitesides et al. (2017) Whitesides, L., Lunnan, R., Kasliwal, M. M., et al. 2017, ApJ, 851, 107, doi: 10.3847/1538-4357/aa99de
- Wiseman et al. (2020) Wiseman, P., Pursiainen, M., Childress, M., et al. 2020, MNRAS, 498, 2575, doi: 10.1093/mnras/staa2474
- Wright et al. (2010) Wright, E. L., Eisenhardt, P. R. M., Mainzer, A. K., et al. 2010, AJ, 140, 1868, doi: 10.1088/0004-6256/140/6/1868
- Yao et al. (2022) Yao, Y., Ho, A. Y. Q., Medvedev, P., et al. 2022, ApJ, 934, 104, doi: 10.3847/1538-4357/ac7a41
- Yaron & Gal-Yam (2012) Yaron, O., & Gal-Yam, A. 2012, PASP, 124, 668, doi: 10.1086/666656
- Zackay et al. (2016) Zackay, B., Ofek, E. O., & Gal-Yam, A. 2016, ApJ, 830, 27, doi: 10.3847/0004-637X/830/1/27
- Zwart et al. (2008) Zwart, J. T. L., Barker, R. W., Biddulph, P., et al. 2008, MNRAS, 391, 1545, doi: 10.1111/j.1365-2966.2008.13953.x