Discovery of Dipolar Chromospheres in Two White Dwarfs††thanks: Dedicated to Prof. Tom Marsh (1961–2022)
Abstract
This paper reports the ULTRACAM discovery of dipolar surface spots in two cool magnetic white dwarfs with Balmer emission lines, while a third system exhibits a single spot, similar to the prototype GD 356. The light curves are modeled with simple, circular, isothermal dark spots, yielding relatively large regions with minimum angular radii of . For those stars with two light curve minima, the dual spots are likely observed at high inclination (or colatitude), however, identical and antipodal spots cannot simultaneously reproduce both the distinct minima depths and the phases of the light curve maxima. The amplitudes of the multi-band photometric variability reported here are all several times larger than that observed in the prototype GD 356; nevertheless, all DAHe stars with available data appear to have light curve amplitudes that increase toward the blue in correlated ratios. This behavior is consistent with cool spots that produce higher contrasts at shorter wavelengths, with remarkably similar spectral properties given the diversity of magnetic field strengths and rotation rates. These findings support the interpretation that some magnetic white dwarfs generate intrinsic chromospheres as they cool, and that no external source is responsible for the observed temperature inversion. Spectroscopic time-series data for DAHe stars is paramount for further characterization, where it is important to obtain well-sampled data, and consider wavelength shifts, equivalent widths, and spectropolarimetry.
keywords:
stars: evolution— stars: magnetic field— white dwarfs1 Introduction
The origin of magnetism in white dwarf stars is an outstanding astrophysical puzzle more than a half century old, but recent and ongoing developments are now shedding light on this fundamental, and still poorly understood aspect of stellar evolution. The first signatures of white dwarf magnetism resulted from the detection of circular polarization in spectra that were quasi-featureless or with unidentified absorption bands (Kemp et al., 1970; Angel & Landstreet, 1971; Landstreet & Angel, 1971) that were later understood to be shifted hydrogen and (neutral) helium lines, mostly consistent with centered or offset dipole field geometries (Kemic, 1974; Garstang, 1977; Wickramasinghe & Martin, 1979). A summary of magnetic white dwarf research over the first several decades can be found in two published reviews (Wickramasinghe & Ferrario, 2000; Ferrario et al., 2015).
One of the key developments was the recognition that magnetic white dwarfs are nearly exclusively found as isolated stars, or in cataclysmic variables (Liebert et al., 2005). This empirical finding led to the hypothesis that fields are generated during common envelope evolution (Tout et al., 2008; Nordhaus et al., 2011; Belloni & Schreiber, 2020), a process that may function effectively for stars, brown dwarfs, and giant planets that are engulfed during the post-main sequence (Farihi et al., 2011; Kissin & Thompson, 2015; Guidarelli et al., 2019). And while fast-spinning and massive magnetic white dwarfs are known, and thus consistent with a stellar merger origin (Ferrario et al., 1997b; García-Berro et al., 2012; Kilic et al., 2021; Williams et al., 2022), it is also clear that magnetism, high remnant mass, and rapid rotation are far from tightly correlated (Ferrario & Wickramasinghe, 2005; Brinkworth et al., 2013).
It has been suspected for decades that cooler white dwarfs are more often found to be magnetic (Liebert & Sion, 1979; Liebert et al., 2003). However, luminosity and sensitivity biases exist, where the coolest white dwarfs essentially require metal pollution to detect Zeeman splitting (Kawka & Vennes, 2014; Hollands et al., 2015; Bagnulo & Landstreet, 2019). Despite these uncertainties, the possibility that magnetic fields first emerge in cool and isolated white dwarfs is intriguing, as substantial cooling is necessary for core crystallization, which has been hypothesized to be a source of an internal dynamo powered by the liquid-solid phase separation at the core boundary (Isern et al., 2017). In this scenario, magnetic field generation is decoupled from external sources of mass and angular momentum, but nevertheless, all else being equal, more rapidly rotating remnants should have stronger fields.
In a pioneering effort to overcome the aforementioned biases, and determine the actual frequency of magnetism as a function of white dwarf characteristics, Bagnulo &
Landstreet (2021) carried out a nearly complete census of () white dwarfs within 20 pc. This volume-limited survey used sensitive circular spectropolarimetry and resulted in the first unbiased study of white dwarf magnetism, where the principal findings can be summarized as follows.
-
1.
All spectral classes have similar incidences of magnetism, regardless of atmospheric composition.
-
2.
The field strength distribution is uniform over four orders of magnitude from 40 kG to 300 MG.
-
3.
Magnetism is detected more frequently in white dwarfs with higher than average mass.
-
4.
White dwarfs with cooling ages younger than 0.5 Gyr – prior to core crystallization – are rarely magnetic.
-
5.
There is no evidence of field strength decay over time.
It is within this background of recent developments that emerged the relatively new and small class of DAHe white dwarfs (D: degenerate, A: Balmer lines strongest, H: magnetic line splitting, e: emission). The prototype is GD 356, an isolated K star with Balmer emission lines split in a MG field. There are deep, multi-wavelength, non-detections that yield stringent upper limits on an X-ray corona, ongoing accretion, and low-mass companions (Greenstein & McCarthy, 1985; Ferrario et al., 1997a; Weisskopf et al., 2007). This apparently single white dwarf has a 1.927 h rotation period, based on a nearly sinusoidal light curve that is well modeled by single dark spot, whose size is consistent with that of the magnetic and heated region (Ferrario et al., 1997a; Brinkworth et al., 2004). These enigmatic properties led to the hypothesis that, analogous to the Jupiter-Io system, the relatively cool white dwarf surface could be heated by Ohmic dissipation of a current loop set up by the orbital motion of a conducting planet (Li et al., 1998; Wickramasinghe et al., 2010); referred to as the unipolar inductor model.
GD 356111Previously thought to have a helium-rich atmosphere (Bergeron et al., 2001; Limoges et al., 2015). was the only known DAHe white dwarf for 35 years, until 2020 when second and third cases were reported (Reding et al., 2020; Gänsicke et al., 2020). In addition to their shared spectral morphology and strong magnetism implied from Zeeman splitting, these three cool white dwarfs with emission lines all share commonalities with some magnetic white dwarfs: relatively rapid rotation, masses only slightly above average, and no evidence for low-mass stellar or substellar (detached) companions. A detailed time-series study of the prototype has shown that (i) the spin period is stable over two decades, with no other independent frequency signals as would be expected from a unipolar inductor, (ii) the emission line strength oscillates in anti-phase with the broad-band stellar brightness, and (iii) so far, DAHe stars share a tightly correlated set of effective temperatures and luminosities (Gänsicke et al., 2020; Walters et al., 2021). This clustering is potentially related to core crystallization and magnetic field diffusion toward the stellar surface (Ginzburg et al., 2022).
This paper reports detailed light curves for three DAHe white dwarfs: the second known example, SDSS J125230.93023417.7 (Reding et al. 2020; hereafter SDSS J1252), and two recently identified members of this class, LP 705-64 and WD J143019.29562358.3 (Reding et al. 2023; hereafter WD J1430). Two of the three stars reveal light curves with asymmetric dimming events that are out-of-phase, and thus consistent with dipolar star spots. These data are inconsistent with a unipolar inductor model, and instead support the generation of intrinsic chromospheres in some isolated, magnetic white dwarfs. The observations and data are discussed in Section 2, the time-series analysis is presented in Section 3, followed by a summary and discussion.
2 Observations
This study focuses on light curves and the resulting periodicities of three DAHe white dwarfs, using both ground- and space-based photometric monitoring as described below.
2.1 Target properties and selection
SDSS J1252 is the second discovered example of a DAHe white dwarf, reported to have emission lines split in a MG field, and with a sinusoidal light curve dominated by a period of 317.3 s (Reding et al., 2020). The fast rotation of this star makes it an attractive target for high-cadence photometric monitoring from the ground, with a goal to obtain a detailed light curve. LP 705-64 and WD J1430 are two newer members of the DAHe spectral class with indications from TESS data that their full spin cycles could each be readily covered in a single night of ground-based photometry (Reding et al., 2023). The initial observational goals were similar to those achieved by Walters et al. (2021), to establish robust ephemerides against which future period changes might be investigated (e.g. within a unipolar inductor and orbiting planet model), and to constrain the nature of the emitting and magnetic regions.
| Target | Observing | Coverage | Filters | |
|---|---|---|---|---|
| Dates | (s) | (min) | ||
| SDSS J1252 | 2021 Apr 06 | 10.05 | 57 | |
| 2021 Apr 08 | 10.35 | 86 | ||
| 2021 Aug 20 | 10.05 | 24 | ||
| LP 705-64 | 2021 Aug 17 | 8.05 | 73 | |
| 2021 Aug 19 | 8.05 | 77 | ||
| 2021 Aug 20 | 8.05 | 146 | ||
| WD J1430 | 2022 Apr 26 | 6.06 | 277 | |
| 2022 Jun 05 | 6.33 | 176 |
2.2 ULTRACAM observations
All three stars were observed with ULTRACAM, a frame-transfer CCD imaging camera (24 ms dead time between exposures; Dhillon et al. 2007) that is permanently mounted on the 3.6 m NTT telescope at the La Silla Observatory in Chile. The instrument has three independent channels that enable the use of independent filters simultaneously, and data were taken with filters similar to standard , , and one of or bandpasses, but with higher throughput. In each case, the blue channel was co-added every three frames to improve the effective signal-to-noise on the target. The observation details, including exposure times (same as the cadences for ULTRACAM), and durations of the resulting light curve segments, are summarized in Table 1.
Images were corrected for bias and flat fielded with normalized sky images obtained during evening twilight (taken in a continuous spiral to remove stars). Differential brightnesses were measured relative to field stars with dedicated software222https://github.com/HiPERCAM/hipercam. using photometric apertures that were typically scaled to the mean full width at half maximum of the stellar profiles for each exposure. The sky annuli were fixed to span the region 8.75–15.75 arcsec from the stars, where a clipped mean was used to determine the background. For all stars in all observations, the same sets of comparison stars were used to generate light curves, consisting of two or three stars in the frames, and one to two stars in the -band images.
Light curves were constructed by dividing the science target flux by the sum of the comparison star fluxes, and normalizing the result. Measurement errors were propagated from the aperture photometry, by summing in quadrature the fractional flux errors of all stars measured for a given light curve. All ULTRACAM times were converted to Barycentric Julian Day (BJD) using Barycentric Dynamical Time (TDB), following Eastman et al. (2010).
2.3 TESS data
Data for each of the three DAHe targets are available from TESS (Ricker et al., 2015), and were downloaded from the MAST archive, where the pdcsap processed light curves were retained for analysis. Time stamps were were corrected to BJD = TESS_BJD + 2457000.
LP 705-64 (= TIC 136884288) was observed in Sector 30, while data were collected for WD J1430 (= TIC 1039012860) within Sector 38, and for SDSS J1252 (= TIC 953086708) during Sector 46. All three stars have 120 s cadence observations. These data were further cleaned of NaN flux entries, but with no other processing based on data quality flags, yielding light curves that retained between 80 and 90 per cent of their pdcsap array values. Lastly, outliers beyond of the local time average (or phase average) flux were removed, which were fewer than five points in total for each source.
It is worth noting that these data are not all equally useful in subsequent analysis. The following TESS benchmarks summarize their relative quality: SDSS J1252 has mag, a mean flux of e- s-1 (28 per cent scatter); LP 705-64 has mag, a mean flux of e- s-1 (15 per cent scatter), while WD J1430 has mag, a mean flux of e- s-1 (73 per cent scatter), and lies within the Galactic plane.
3 Time-series analysis and results
All light curves were analyzed using period04 (Lenz & Breger, 2005), where a Lomb-Scargle periodogram was constructed using ULTRACAM data, TESS pdcsap light curves, or a combination of the two datasets, with a goal to identify that which produces the most precise ephemerides for each target. Monte Carlo simulations, run within period04, were used to determine errors in frequency and phase for the strongest periodogram peak for each star and set of light curves, then propagated to determine the error in corresponding to photometric minimum. The frequency and phase were allowed to vary independently during the simulations to determine errors, which were typically repeated 1000 times.
3.1 SDSS J1252
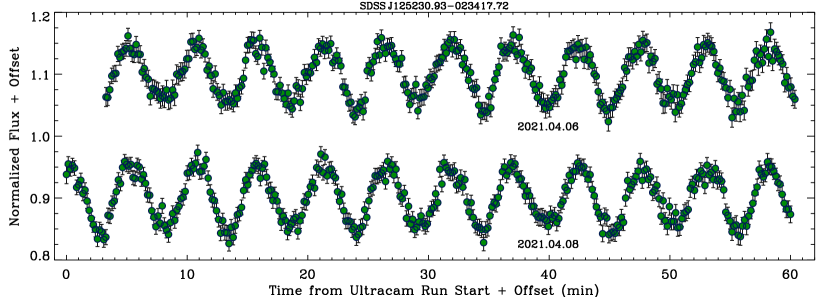
For SDSS J1252, there are sufficient ULTRACAM data to uniquely determine the photometric period and provide an improved ephemeris. Light curves cover more than 30 epochs of its previously reported 317.3 s periodicity (frequency 272.3 d-1, Reding et al. 2020), with an observational baseline of 136 d, spanning several cycles at this frequency. In Figure 1 are shown the first and second -band light curves obtained for this white dwarf, from which can be discerned that there are two distinct set of minima (and maxima), each manifesting every 317.3 s, and thus revealing an actual photometric period of 634.6 s.
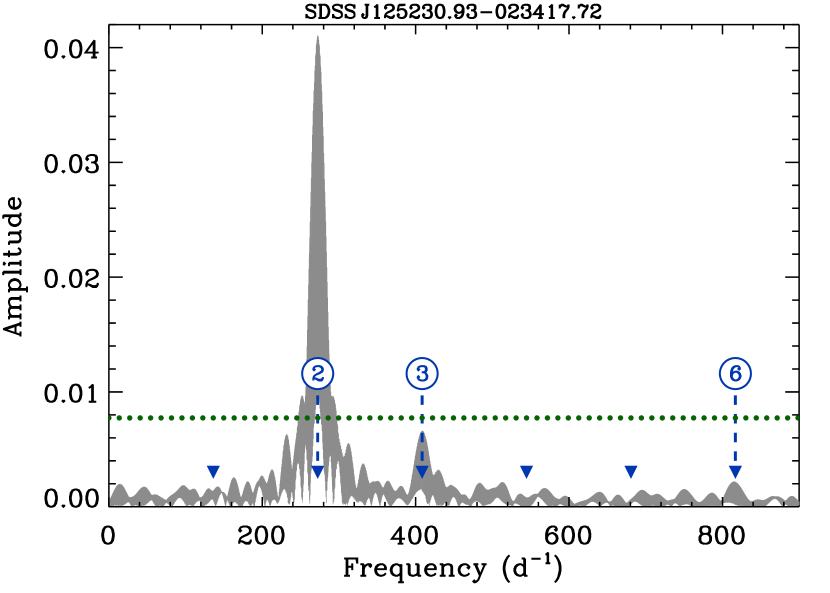
The ULTRACAM co-added light curves were analyzed using data from all three observing runs. The resulting best periodogram is plotted in Figure 2, where the strongest peak is identical to the frequency reported in the discovery paper; however, there is a second outstanding signal near 408 d-1. This secondary peak is not as well-determined as the 272.3 d-1 signal, but these two frequencies appear to have a near an exact ratio of 3:2. Additionally, the periodogram also reveals a weak-amplitude peak at roughly 816 d-1, and the ratio of these three frequencies is 6:3:2.
These periodicities are far shorter than any possible range of orbital signals originating from non-degenerate companions, as the lowest-frequency periodogram signal, at 272.3 d-1, corresponds to a Keplerian orbit near (seven white dwarf radii), deep within the nominal Roche limit. Only a compact object could survive at this orbital distance, such as those in close but detached, double white dwarf binaries. And while there are a few such systems known to have orbital periods comparable to the frequencies exhibited by SDSS J1252, their light curves reveal ellipsoidal modulation owing to tidal distortions in the primary white dwarfs (Kilic et al., 2011; Brown et al., 2011; Burdge et al., 2019). Furthermore, these rare, deformed degenerates are all helium-core white dwarfs less massive than 0.3 M⊙, and thus significantly more prone to tidal distortion than SDSS J1252 and the DAHe stars, which are considerably more compact (Walters et al., 2021; Reding et al., 2020; Gänsicke et al., 2020).
Therefore, the light curve and resulting periodogram of SDSS J1252 are interpreted as arising from a single star. It is reasonable to assume the K white dwarf has a fixed spin period (no differential rotation), and no stellar pulsations, as it is far from the hydrogen atmosphere instability strip (Romero et al., 2022). The observed signals are then interpreted as the 2nd, 3rd, and 6th harmonics of the stellar rotation frequency. The periodogram signals and their amplitudes reflect the fitting of sinusoids to the light curve, where the two highest have a 3:2 ratio in order to generate both the principal flux variation at 272.3 d-1, and the alternating minima via the interference with the 408 d-1 frequency.
The revised stellar rotation period and associated uncertainty were determined by dividing the 2nd harmonic frequency by two, yielding 136.15032(2) d-1 (equivalent to a period of 634.59273(9) s). Although essentially no amplitude (or power) is seen in the periodogram at the frequency inferred to be the fundamental, this is an expected consequence of the light curve morphology and sinusoidal fitting (VanderPlas, 2018).
A similar analysis was attempted using the TESS light curve, both on its own and in combination with ULTRACAM data. While the TESS 120 s cadence is faster than the peak periodogram frequency for SDSS J1252, and thus above the Nyquist rate, the data quality are relatively poor (Section 2.3). No time-series analysis utilizing TESS led to any improvement in frequency or phase precision, and therefore all calculations for SDSS J1252 are based solely on the ULTRACAM observations.
3.2 LP 705-64 and WD J1430
TESS data were the initial means of identifying the stellar rotation rates in these two DAHe white dwarfs (Reding et al., 2023). However, similar to as observed in SDSS J1252, the ULTRACAM light curve of LP 705-64 exhibits two unequal minima in a single cycle, and thus the period determined by TESS represents one half its spin period (see Figure 3). For this source, the ULTRACAM data alone do not span a sufficient number of cycles to determine the photometric period with precision comparable to TESS. A significant improvement in the TESS ephemeris is achieved using the combination of ULTRACAM co-added light curves and TESS, resulting in a periodogram with a single peak at 39.65325(3) d-1 [cf. 39.653(2) d-1; Reding et al. 2023], and a corresponding higher precision in phase. However, the true spin period must be calculated from this frequency by recognizing it is the 2nd harmonic of the fundamental, which is 19.82662(1) d-1.
For WD J1430, the ULTRACAM light curves reveal a single maximum and minimum with one of the largest amplitudes observed to date for a DAHe white dwarf (5.8 per cent in the band). Similar to LP 705-64, there are insufficient ULTRACAM data from which to derive a precise ephemeris for this source, and thus the combination of ULTRACAM and TESS Sector 38 pdcsap data were utilized for this goal. Initially, the analysis of these combined datasets improved the precision of the periodogram frequency, but resulted in phase errors that were larger than those based on TESS alone. Subsequently, these TESS data were re-scaled (see Section 3.4) to more closely match those of the co-added -band ULTRACAM data, and the resulting analysis marginally improved the uncertainty in phase. Ultimately for this star, the best constraints were achieved by adding a third set of light curves into the periodogram analysis, using full-frame data from TESS Sector 11, where fluxes were extracted based on PSF-subtracted images following Han & Brandt (2023).
3.3 Light curve morphologies, ephemerides, spectral phases
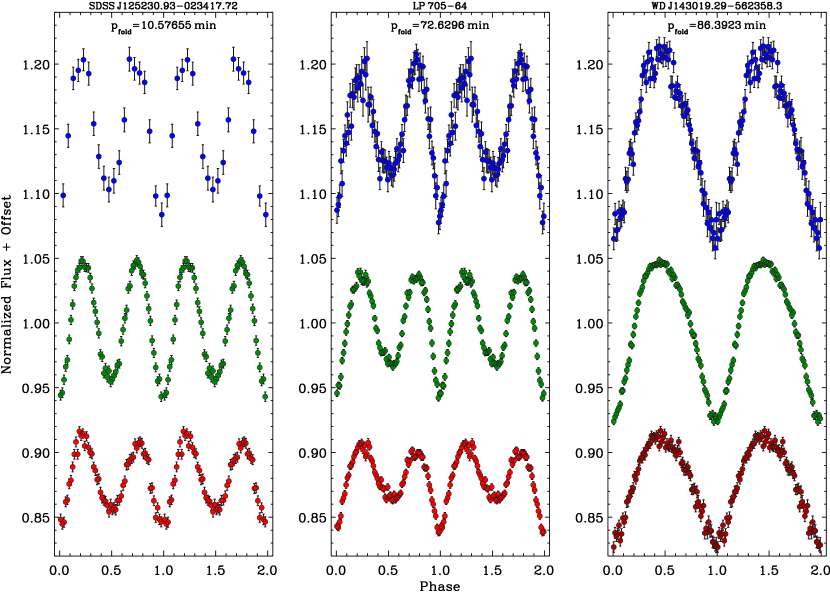
Based on the preceding analysis, and to reveal light curve structures more precisely as a function of phase, the ULTRACAM multi-band data were phase-folded and binned using a weighted average onto regular grids. The resulting light curves are shown in Figure 3, where there are 80 phase bins for LP 705-64 and WD J1430 in all three channels. In the case of SDSS J1252, the short spin period indicates that a single ULTRACAM frame has a phase width of 0.016 in the green and red channels, but 0.048 in the blue channel (owing to three co-adds). For this reason, the light curves of SDSS J1252 were re-sampled into 60 phase bins in and , but only 20 bins in band.
The folded light curves for SDSS J1252 and LP 705-64 both exhibit alternating minima that are indicative of two distinct star spots out-of-phase during rotation. While this behavior is not novel among magnetic white dwarfs, there appear to be only a few documented examples of white dwarf light curves where dipolar spots are suggested or required (Hermes et al., 2017; Kilic et al., 2019; Pshirkov et al., 2020). In contrast, the majority of magnetic white dwarf light curves seem to be broadly consistent with sinusoidal (single spot) morphologies (Brinkworth et al., 2013), including the prototype DAHe star GD 356 (Walters et al., 2021). However, it should be noted that incomplete phase coverage and modest photometric precision can inhibit the detection of subtle light curve features (e.g. the discovery light curve of SDSS J1252, and the TESS light curve of LP 705-64; Reding et al. 2020, 2023).
To calculate accurate ephemerides based on the best precision achieved here, was chosen from an ULTRACAM light curve located nearest to the middle of the temporal coverage for each star, and where a feature could be unambiguously identified as a true photometric minimum. The periodogram analysis of the preceding sections then results in the following best ephemerides for all three DAHe white dwarfs, where zero phase corresponds to actual photometric minimum, and the periods are accurate and precise determinations of their spins:
| BJDTDB (SDSS J1252) | = 2459313.809921(6) | + 0.007344823(1) |
| BJDTDB (LP 705-64) | = 2459444.92339(6) | + 0.05043723(3) |
| BJDTDB (WD J1430) | = 2459696.8239(3) | + 0.05999529(3) |
As mentioned earlier, the ephemeris of SDSS J1252 is based solely on ULTRACAM, whereas those of LP 705-64 and WD J1430 are based on the combination of TESS and ULTRACAM. From these ephemerides, forward and backward extrapolations can be made and compared with published, time-varying spectra of LP 705-64 and WD J1430, but in the case of SDSS J1252 there is insufficient time resolution to compare its spectroscopic variations in phase with photometry (Reding et al., 2020, 2023).
Starting with the more straightforward case of WD J1430 which exhibits a single spot, the photometric minimum (phase 0) occurred at BJD nearest the two epochs of the published spectroscopy. This notably falls close to halfway in time between the two spectra plotted and described by Reding et al. (2023) as ’emission’ and ’absorption’. Specifically, and taking the reported epochs of observation at face value, these spectra correspond to photometric phases and , respectively, and thus both occur close to the average stellar flux. While these two spectral phases are reported as potentially representing a maximum and minimum magnetic field strength, this interpretation seems uncertain, especially if other spectral phases exhibit weaker emission or absorption, where Zeeman splitting is not a robust diagnostic.
Superficially interpreting these spectral phases of WD J1430 as the highest and lowest field strength would be somewhat inverse to that observed for the prototype DAHe GD 356, where there are multiple, full-phase coverage observations using both spectroscopy and spectropolarimetry. For this well-studied case, the magnetic field variations, both from the observed parallel component and using Zeeman splitting, display a peak and trough near phases 0.3 and 0.8, respectively, from photometric minimum (Walters et al., 2021). For WD J1430, existing data may not probe the magnetic field with sufficient sensitivity or phase coverage, and hence these comparative results should be considered preliminary at best.
In the case of LP 705-64, the situation is more complex. Depending on the spot sizes, one might expect two minima and maxima in both equivalent width and magnetic field variations, one pair associated with each spot. However, there are only two epochs of spectroscopy plotted and described by Reding et al. (2023), and here again a comparison must be considered not only preliminary, but possibly inapt for the aforementioned reasons. Again taking the published epochs at face value, and where the the deeper of the two light curve minima is zero phase, the spectrum shown with the broader Zeeman splitting corresponds to photometric phase . The two reported spectral epochs were chosen as to be separated by exactly one half spin cycle (Reding et al., 2023), so that further interpretation would reflect the selection.
While the updated photometric ephemeris is sufficient to predict precise spin phases for spectroscopic observations of LP 705-64, their potential correlation is not yet straightforward. It has not yet been demonstrated that high and low Zeeman splitting might be in-phase with photometric extrema (cf. GD 356 Walters et al. 2021). The two published spectra may not represent precise peak behavior, and there may be some uncertainty in the epoch dates reported. Measurements of both equivalent width and magnetic field strength at all rotational phases would eliminate these ambiguities. The sparse set of published spectroscopic measurements of DAHe white dwarfs, currently prevents a more robust correlation of photometric and spectroscopic phases.
| SDSS J1252 | LP 705-64 | WD J1430 | GD 356 |
|---|---|---|---|
| : | : | : | : |
| : | : | : | : |
| : | : | … | +: |
| … | … | : | … |
| : | : | … | : |
Note. The -band amplitude for GD 356 was obtained from a light curve taken at the WHT using PF-QHY on 2020 Jun 21. is the flux variation amplitude in the TESS band, where is no corresponding entry for WD J1430. While both SDSS J1252 and WD J1430 are similarly faint ( mag) and thus near the limit of what TESS can observe, the latter source has a target-to-total aperture flux of only 0.03 (cf. 0.89 for SDSS J1252, 0.56 for LP 705-64, and 0.87 for GD 356; Walters et al. 2021). Thus the TESS amplitude for WD J1430 is likely unreliable.
3.4 Multi-band light curve amplitudes
To better understand the nature of the spots and their associated magnetic regions, multi-band light curves for DAHe white dwarfs were used to calculate the photometric amplitude for each star in each observed bandpass. For the three stars observed by ULTRACAM as well as GD 356, this was done by taking only the strongest signal in the best periodogram for each star (Figures 2 and 3), and determining the sinusoidal amplitude for each light curve in each bandpass at that frequency. In this way, all light curve amplitudes are evaluated by their strongest sinusoidal components, including those stars with little or no periodogram power at their true rotation frequency. Light curve amplitudes and uncertainties were determined using period04, using fixed frequencies and Monte Carlo simulations.
Table 2 lists the multi-band, photometric amplitudes for the four DAHe white dwarfs with available data, the three stars reported here and the prototype GD 356 (Walters et al., 2021). It is interesting to note that the amplitude of photometric variation is relatively small in GD 356 (on the order of 1 per cent; Brinkworth et al. 2004), compared to the newer DAHe stars with several percent variations in their light curves. Although there is not yet any published multi-band photometry of SDSS J1219, its light curve amplitude is around 3 per cent in the band (Gänsicke et al. 2020; roughly halfway between the and filters), and thus at least double that of GD 356 at similar wavelengths. It is also possible that WD J161634.36+541011.51 (Manser et al. 2023; hereafter WD J1616) has a photometric amplitude comparable to the strongest found here. These are likely the results of observational bias, which enhances their detection as variables in surveys such as Gaia and ZTF (e.g. Guidry et al. 2021).
It should be noted that WD J1430 is positioned in a crowded field at Galactic latitude degr, and the TESS fluxes are dominated by other sources in the photometric aperture (pipeline keyword crowdsap = 0.032). This pipeline metric implies that only 3.2 per cent of the flux in the extracted aperture is likely from the white dwarf, and subsequently the extracted flux has been dramatically reduced to recover a more accurate stellar brightness in the pdcsap light curve (Stumpe et al., 2012). While the ULTRACAM observations independently confirm the stellar spin frequency identified by periodogram analysis of the TESS light curve, the pipeline fluxes are simply too noisy (see Section 2.3) and likely offset significantly from the true mean flux. Thus, no reliable variability amplitude can be deduced for the TESS bandpass (see footnote to Table 2).
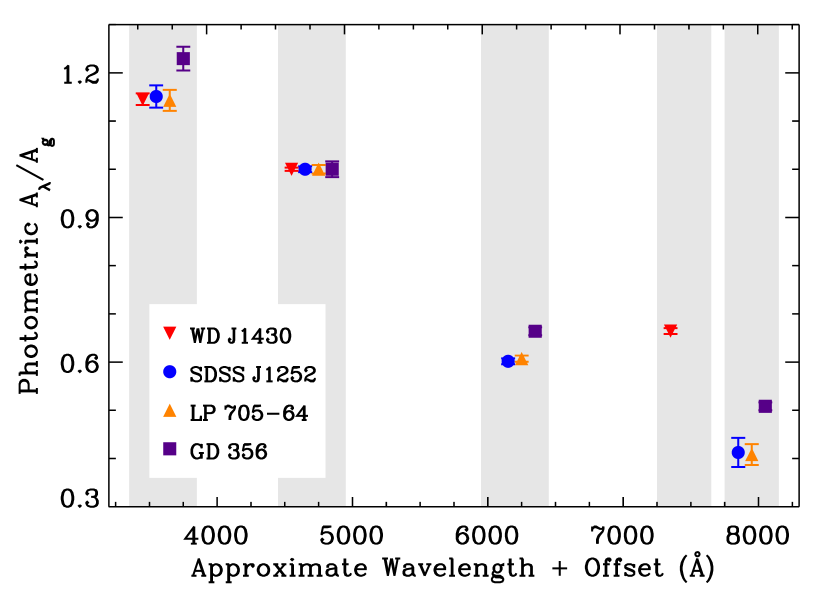
The relative strengths of the photometric variations in DAHe stars appear to follow a trend as a function of wavelength, with increasing amplitudes towards the blue. Figure 4 plots the strengths of the multi-band variability for the four white dwarfs, where the photometric amplitude for each bandpass is plotted relative to the band for each star. Three of the four stars have data in (or similar) bandpasses, and all three exhibit a relatively tight correlation in their amplitude ratios as a function of these three wavelength ranges. Three stars have reliable TESS amplitudes where again the same behavior is evident, and suggesting a phenomenon associated with this emerging spectral family. Based on the narrow range of among DAHe white dwarfs, Figure 4 implies their spots have similar spectral properties. This indication is remarkable given the range of DAHe rotation periods and especially magnetic field strengths.
To date, only relatively weak Balmer features have been detected blueward of H in any DAHe star, and yet the photometric variability remains strongest at shorter wavelengths. This is consistent with the previous finding that the photometric variability arises from changes in the stellar continuum, and not from fluctuations in the Balmer emission lines (Walters et al., 2021).
In , the -band (5500 Å) light curve amplitude of the GD 356 was recorded as 0.2 per cent (Brinkworth et al., 2004). But in 2020 the photometric variations observed using an SDSS -band filter (4700 Å), and a filter (6200 Å) were found to be higher (Table 2). It thus seems possible that the starspot has evolved during this time frame; however, all six emission features within H and H seem consistent over at least 35 years (Greenstein & McCarthy, 1985; Ferrario et al., 1997a; Walters et al., 2021).
3.5 Simple spot modeling
| Parameter | Range | Step size |
|---|---|---|
| 0.99-0.48 | 0.01 | |
| 0.99-0.10 | 0.01 |
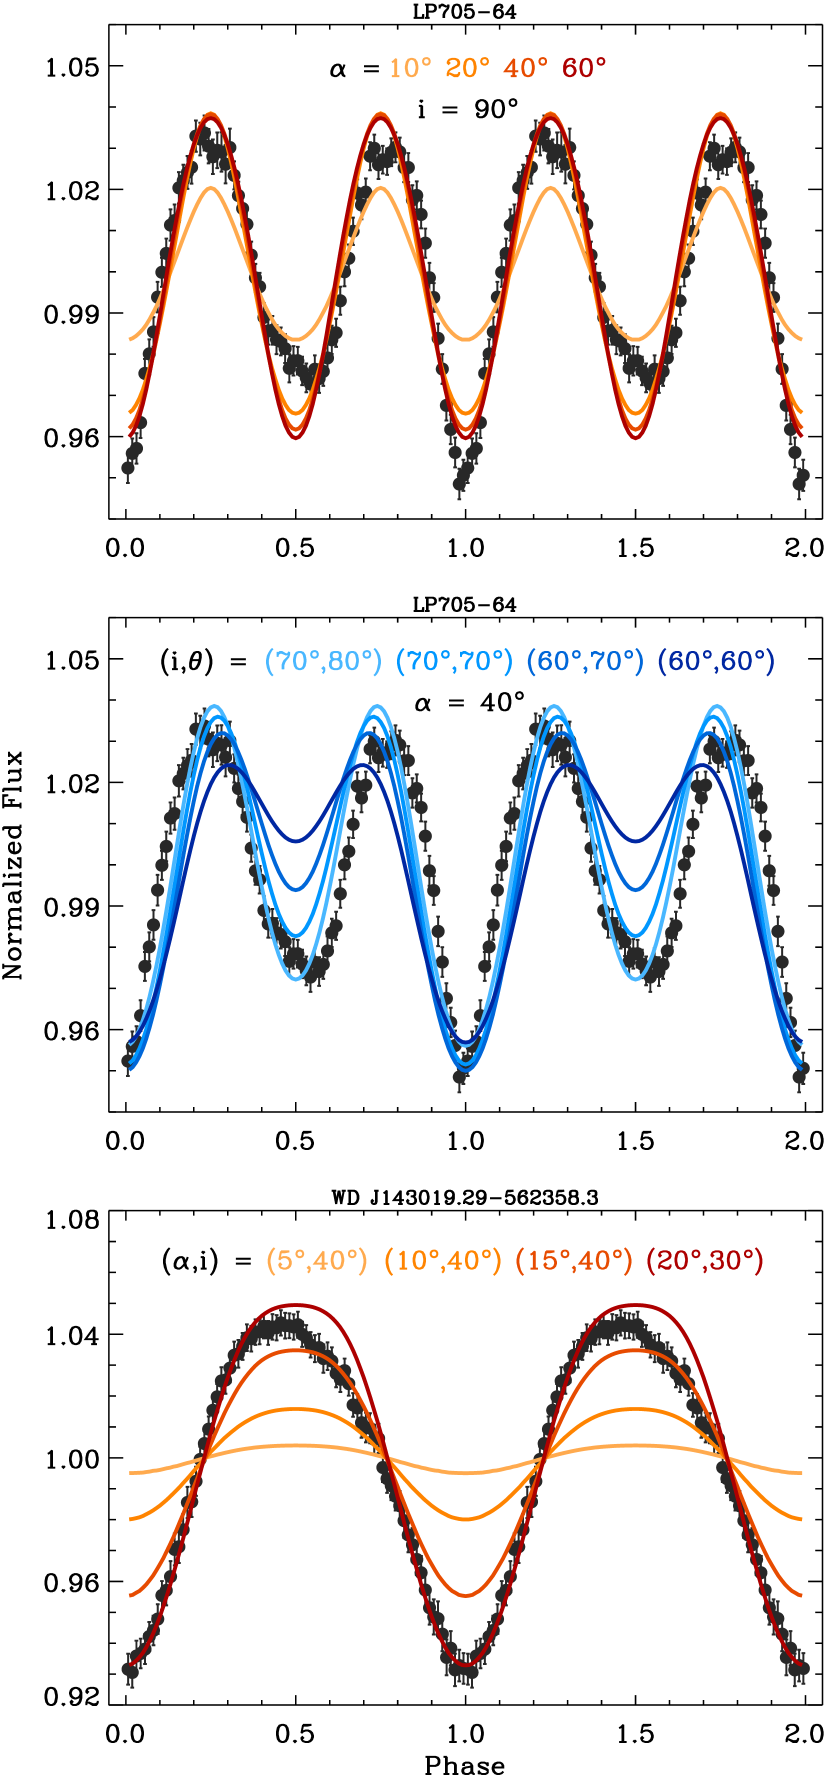
A basic set of spot models and corresponding light curves were constructed to better constrain the observed stellar surfaces as a function of rotation, with a particular motivation towards those stars where two spots appear to be necessary. Each white dwarf was treated as a K blackbody, with one or two circular, isothermal spots whose single temperature is controlled by a scaling factor . Where required by the light curve morphology, two identical spots were placed on the surface at antipodal points. The other model parameters are the inclination () of the stellar rotation axis to the observer, the spot colatitude (), and the spot angular radius (). It is commonly acknowledged that such models are potentially degenerate when the values of and are interchanged (e.g. Wynn & King 1992).
For each star, a grid of models was generated with the following parameter ranges and step sizes as given in Table 3. For small angular radii () the spot temperature range was expanded because in order to reproduce a fixed photometric amplitude, the smallest spots must be darkest. The root mean square (RMS) difference between the model and observed fluxes in a given bandpass as a function of spin phase was computed and used to identify a best-fit model for each , although in practice there is nearly always a range of models that yield similarly satisfactory results.
While the modeling is relatively simple, a few basic results emerge. Small spots with cannot generate a sufficiently large photometric amplitude for any of the three white dwarfs with ULTRACAM data, but otherwise the spot size is mostly unconstrained. Beyond this small angular size threshold, the combination of adjustable geometry and spot temperature permits sufficient model flexibility to achieve comparably good fits within a range of the other three parameters. Nevertheless, the spots must be at least modestly large; in terms of solid angle, covering several per cent or more of one hemisphere. In the case of WD J1430, which has the largest photometric variability amplitude, only spots with can reproduce the observed flux changes.
However, the models with the smallest RMS differences for the light curves with two minima exhibit clear shortcomings. The resulting inclinations (or colatitudes) tend toward , and consequently the model fits have equally deep, light curve minima. These fitted parameters are driven in the direction of maximum inclination (or colatitude) because, while the lower (or ) solutions can reproduce a more shallow secondary minimum as observed, this particular shape exhibits light curve maxima whose phase positions are shifted towards the secondary minimum. Examples of these modeling outcomes are illustrated in Figure 5.
Despite these limitations, the modeling demonstrates that the basic geometry of antipodal spots is essentially correct. However, in the context of the simple model assumptions, it is unlikely that there is a centered but tilted, symmetric dipolar arrangement for the dual-spotted stars. Instead, the spots may not be circular, and where two opposing spots are necessary each may be distinct in size, shape, or temperature; alternatively, the spots may be in a dipolar configuration that is offset from the rotational center of the star.
4 Discussion and Summary
The discovery of DAHe white dwarfs whose light curves require two spots in a basic dipolar configuration, now totaling at least three systems (Manser et al., 2023), is a modest breakthrough in their characterization. It raises the immediate question of whether all DAHe stars have dual spots, which manifest as light curves with either one or two minima, depending on the viewing angle and spot orientation. As of this publication, there are now just over two dozen known DAHe stars, but where only six have robustly measured light curves (Reding et al., 2020; Gänsicke et al., 2020; Reding et al., 2023; Manser et al., 2023). There is a seventh DAHe candidate with a well-measured TESS light curve, SDSS J041246.85+754942.26, but which currently lacks any type of magnetic field indication or upper limit (Tremblay et al., 2020; Walters et al., 2021).
Of these seven objects, three of their light curves exhibit two photometric minima, and four are consistent with a single minimum. With such small numbers and weak constraints on spot properties, a statistical assessment of the inferred viewing geometry is not possible, but the data to date are likely consistent with all class members having dipolar magnetic and spotted regions. If the simple modeling performed here is any indication, it may be that magnetic (spot) axes must be highly inclined towards the viewer (or equivalently have similar colatitudes) for both spots to transit, i.e. have ingress and egress as opposed to being partly visible at all times.
The detection of photometric variability in GD 356 yielded limited results on its spot properties, where the size of the temperature-contrast surface was assumed to be identical to that of the magnetic region inferred from modeling of spectropolarimetry, around (Brinkworth et al., 2004). Otherwise the modeling followed the same assumptions as those described in Section 3.5, and the mostly sinusoidal light curve was ultimately fitted to two sets of models, one with a dark spot near the rotational pole (low ) viewed at high inclination, and a second viewed near the axis of rotation (low ), but with high colatitude; an example of the degeneracy between and . In the case that GD 356 has antipodal spots, in the former scenario the secondary spot can remain hidden from the observer at all spin phases, and in the latter scenario, it is possible for both spots to be partly visible at all times. If the prototype does indeed have two spots, the previous photometric modeling would disfavor the latter orientation, as it would result in some light curve impact on from both spots.
As with the DAHe prototype, it is tempting to co-identify the sizable spots with their magnetic and chromospherically active regions (Ferrario et al., 1997a; Brinkworth et al., 2004). In one such picture, the spots are dark and magnetic regions underlying the chromospheric activity, so that the Balmer emission lines are at maximum brightness when the stellar continuum yields photometric minimum (Walters et al., 2021). This behavior may also be seen in SDSS J1212 and SDSS 1219 (Reding et al., 2020; Gänsicke et al., 2020), but insufficient phase coverage and sampling prevent any certainty at present, and equivalent widths have not been determined for those stars. The results here for LP 705-64 and WD J1430 are currently ambiguous for similar reasons, and owing to additional complications.
Interestingly, time-series spectroscopy for SDSS J1252, WD J1430, and WD J1616 suggest that their emission lines may effectively disappear at some phases (Reding et al., 2020, 2023; Manser et al., 2023), presumably when a spot or spots (and associated magnetic region) are out of view or have minimum visibility. However, as discussed in Section 3.3, this is likely an oversimplified picture; with the exception of GD 356, there is a distinct lack of magnetic field determinations across the entire spin phases of DAHe white dwarfs, and Zeeman splitting may be an ineffective tool for weak or transient emission features.
At present, empirical metrics associated with published, DAHe time-series spectroscopy are sparse, and it would be ideal for observers to provide both equivalent widths and central wavelengths for emission features over at least one full cycle with sufficient sampling. In contrast to magnetic field strength estimates, which may not be possible to measure at all spin phases via Zeeman splitting if magnetic regions rotate in and out of view, only the phase behavior of equivalent width has been robustly characterized, and only in the prototype (Walters et al., 2021). It is thus essential that full spectroscopic phase coverage of DAHe white dwarfs is carried out with these measurements in mind, and where spectropolarimetry will be more sensitive to magnetic field strength, particularly when emission or absorption features are weak.
The dual-spotted nature of at least three DAHe white dwarfs has direct bearing on the hypothesis that a heated region can be caused by star-planet interactions such that a current loop is dissipated in one region of the star (e.g. the unipolar inductor Li et al. 1998; Wickramasinghe et al. 2010). If such planetary interactions are in fact taking place within the strong magnetospheres of DAHe white dwarfs, they are unlike the interactions that lead to unipolar, Jupiter-Io footprint mechanisms (Goldreich & Lynden-Bell, 1969). Going forward, models that require the presence of closely orbiting and interacting planets, which at present lack no empirical support in observations of DAHe stars, should require strong evidence to be re-considered. Given the lack of additional periodic signals and the compelling evidence of DAHe white dwarf clustering in the HR diagram (Walters et al., 2021; Reding et al., 2023; Manser et al., 2023), an intrinsic mechanism is the most likely source for the spotted regions and chromospheric activity.
Acknowledgements
J. Farihi is grateful to the Laboratory for Atmospheric and Space Physics at the University of Colorado Boulder, and the Kavli Institute for Theoretical Physics at the University of California, Santa Barbara, for hosting during extended visits, and to J. S. Pineda for an illuminating discussion on the nature of chromospheres in sun-like and low-mass stars. The authors acknowledge the European Southern Observatory for the award of telescope time via program 105.209J. J. Farihi acknowledges support from STFC grant ST/R000476/1 and National Science Foundation Grant No. NSF PHY-1748958. S. P. Littlefair acknowledges the support of the STFC grant ST/V000853/1. N. Walters has been supported by a UK STFC studentship hosted by the UCL Centre for Doctoral Training in Data Intensive Science. S. G. Parsons acknowledges the support of a STFC Ernest Rutherford Fellowship. For the purpose of open access, the authors have applied a creative commons attribution (CC BY) license to any author accepted manuscript version arising. This paper includes data collected by the TESS mission, which is funded by the NASA Explorer Program.
Data Availability
ULTRACAM data are available on reasonable request to the instrument team, while TESS data are available through the Mikulski Archive for Space Telescopes.
References
- Angel & Landstreet (1971) Angel J. R. P., Landstreet J. D., 1971, ApJ, 164, L15
- Bagnulo & Landstreet (2019) Bagnulo S., Landstreet J. D., 2019, A&A, 630, A65
- Bagnulo & Landstreet (2021) Bagnulo S., Landstreet J. D., 2021, MNRAS, 507, 5902
- Belloni & Schreiber (2020) Belloni D., Schreiber M. R., 2020, MNRAS, 492, 1523
- Bergeron et al. (2001) Bergeron P., Leggett S. K., Ruiz M. T., 2001, ApJS, 133, 413
- Brinkworth et al. (2004) Brinkworth C. S., Burleigh M. R., Wynn G. A., Marsh T. R., 2004, MNRAS, 348, L33
- Brinkworth et al. (2013) Brinkworth C. S., Burleigh M. R., Lawrie K., Marsh T. R., Knigge C., 2013, ApJ, 773, 47
- Brown et al. (2011) Brown W. R., Kilic M., Hermes J. J., Allende Prieto C., Kenyon S. J., Winget D. E., 2011, ApJ, 737, L23
- Burdge et al. (2019) Burdge K. B., et al., 2019, Nature, 571, 528
- Dhillon et al. (2007) Dhillon V. S., et al., 2007, MNRAS, 378, 825
- Eastman et al. (2010) Eastman J., Siverd R., Gaudi B. S., 2010, PASP, 122, 935
- Farihi et al. (2011) Farihi J., Dufour P., Napiwotzki R., Koester D., 2011, MNRAS, 413, 2559
- Ferrario & Wickramasinghe (2005) Ferrario L., Wickramasinghe D. T., 2005, MNRAS, 356, 615
- Ferrario et al. (1997a) Ferrario L., Wickramasinghe D. T., Liebert J., Schmidt G. D., Bieging J. H., 1997a, MNRAS, 289, 105
- Ferrario et al. (1997b) Ferrario L., Vennes S., Wickramasinghe D. T., Bailey J. A., Christian D. J., 1997b, MNRAS, 292, 205
- Ferrario et al. (2015) Ferrario L., de Martino D., Gänsicke B. T., 2015, Space Sci. Rev., 191, 111
- Fukugita et al. (1996) Fukugita M., Ichikawa T., Gunn J. E., Doi M., Shimasaku K., Schneider D. P., 1996, AJ, 111, 1748
- Gänsicke et al. (2020) Gänsicke B. T., Rodríguez-Gil P., Gentile Fusillo N. P., Inight K., Schreiber M. R., Pala A. F., Tremblay P.-E., 2020, MNRAS, 499, 2564
- García-Berro et al. (2012) García-Berro E., et al., 2012, ApJ, 749, 25
- Garstang (1977) Garstang R. H., 1977, Reports on Progress in Physics, 40, 105
- Ginzburg et al. (2022) Ginzburg S., Fuller J., Kawka A., Caiazzo I., 2022, MNRAS, 514, 4111
- Goldreich & Lynden-Bell (1969) Goldreich P., Lynden-Bell D., 1969, ApJ, 156, 59
- Greenstein & McCarthy (1985) Greenstein J. L., McCarthy J. K., 1985, ApJ, 289, 732
- Guidarelli et al. (2019) Guidarelli G., Nordhaus J., Chamandy L., Chen Z., Blackman E. G., Frank A., Carroll-Nellenback J., Liu B., 2019, MNRAS, 490, 1179
- Guidry et al. (2021) Guidry J. A., et al., 2021, ApJ, 912, 125
- Gunn et al. (2006) Gunn J. E., et al., 2006, AJ, 131, 2332
- Han & Brandt (2023) Han T., Brandt T. D., 2023, AJ, 165, 71
- Hermes et al. (2017) Hermes J. J., et al., 2017, ApJS, 232, 23
- Hollands et al. (2015) Hollands M. A., Gänsicke B. T., Koester D., 2015, MNRAS, 450, 681
- Isern et al. (2017) Isern J., García-Berro E., Külebi B., Lorén-Aguilar P., 2017, ApJ, 836, L28
- Kawka & Vennes (2014) Kawka A., Vennes S., 2014, MNRAS, 439, L90
- Kemic (1974) Kemic S. B., 1974, ApJ, 193, 213
- Kemp et al. (1970) Kemp J. C., Swedlund J. B., Landstreet J. D., Angel J. R. P., 1970, ApJ, 161, L77
- Kilic et al. (2011) Kilic M., et al., 2011, MNRAS, 413, L101
- Kilic et al. (2019) Kilic M., Rolland B., Bergeron P., Vanderbosch Z., Benni P., Garlitz J., 2019, MNRAS, 489, 3648
- Kilic et al. (2021) Kilic M., Kosakowski A., Moss A. G., Bergeron P., Conly A. A., 2021, ApJ, 923, L6
- Kissin & Thompson (2015) Kissin Y., Thompson C., 2015, ApJ, 809, 108
- Landstreet & Angel (1971) Landstreet J. D., Angel J. R. P., 1971, ApJ, 165, L67
- Lenz & Breger (2005) Lenz P., Breger M., 2005, Communications in Asteroseismology, 146, 53
- Li et al. (1998) Li J., Ferrario L., Wickramasinghe D., 1998, ApJ, 503, L151
- Liebert & Sion (1979) Liebert J., Sion E. M., 1979, Astrophys. Lett., 20, 53
- Liebert et al. (2003) Liebert J., Bergeron P., Holberg J. B., 2003, AJ, 125, 348
- Liebert et al. (2005) Liebert J., et al., 2005, AJ, 129, 2376
- Limoges et al. (2015) Limoges M. M., Bergeron P., Lépine S., 2015, ApJS, 219, 19
- Manser et al. (2023) Manser C. J., et al., 2023, MNRAS,
- Nordhaus et al. (2011) Nordhaus J., Wellons S., Spiegel D. S., Metzger B. D., Blackman E. G., 2011, Proceedings of the National Academy of Science, 108, 3135
- Pshirkov et al. (2020) Pshirkov M. S., et al., 2020, MNRAS, 499, L21
- Reding et al. (2020) Reding J. S., Hermes J. J., Vanderbosch Z., Dennihy E., Kaiser B. C., Mace C. B., Dunlap B. H., Clemens J. C., 2020, ApJ, 894, 19
- Reding et al. (2023) Reding J. S., Hermes J. J., Clemens J. C., Hegedus R. J., Kaiser B. C., 2023, MNRAS,
- Ricker et al. (2015) Ricker G. R., et al., 2015, Journal of Astronomical Telescopes, Instruments, and Systems, 1, 014003
- Romero et al. (2022) Romero A. D., et al., 2022, MNRAS, 511, 1574
- Stumpe et al. (2012) Stumpe M. C., et al., 2012, PASP, 124, 985
- Tout et al. (2008) Tout C. A., Wickramasinghe D. T., Liebert J., Ferrario L., Pringle J. E., 2008, MNRAS, 387, 897
- Tremblay et al. (2020) Tremblay P. E., et al., 2020, MNRAS, 497, 130
- VanderPlas (2018) VanderPlas J. T., 2018, ApJS, 236, 16
- Walters et al. (2021) Walters N., et al., 2021, MNRAS, 503, 3743
- Weisskopf et al. (2007) Weisskopf M. C., Wu K., Trimble V., O’Dell S. L., Elsner R. F., Zavlin V. E., Kouveliotou C., 2007, ApJ, 657, 1026
- Wickramasinghe & Ferrario (2000) Wickramasinghe D. T., Ferrario L., 2000, PASP, 112, 873
- Wickramasinghe & Martin (1979) Wickramasinghe D. T., Martin B., 1979, MNRAS, 188, 165
- Wickramasinghe et al. (2010) Wickramasinghe D. T., Farihi J., Tout C. A., Ferrario L., Stancliffe R. J., 2010, MNRAS, 404, 1984
- Williams et al. (2022) Williams K. A., Hermes J. J., Vanderbosch Z. P., 2022, AJ, 164, 131
- Wynn & King (1992) Wynn G. A., King A. R., 1992, MNRAS, 255, 83