Interactive Image Segmentation with Cross-Modality Vision Transformers
Abstract
Interactive image segmentation aims to segment the target from the background with the manual guidance, which takes as input multimodal data such as images, clicks, scribbles, and bounding boxes. Recently, vision transformers have achieved a great success in several downstream visual tasks, and a few efforts have been made to bring this powerful architecture to interactive segmentation task. However, the previous works neglect the relations between two modalities and directly mock the way of processing purely visual information with self-attentions. In this paper, we propose a simple yet effective network for click-based interactive segmentation with cross-modality vision transformers. Cross-modality transformers exploits mutual information to better guide the learning process. The experiments on several benchmarks show that the proposed method achieves superior performance in comparison to the previous state-of-the-art models. The stability of our method in term of avoiding failure cases shows its potential to be a practical annotation tool. The code and pretrained models will be released under https://github.com/lik1996/iCMFormer.
1 Introduction
Instance segmentation networks take a RGB-channel image as input and predict the segmentation mask in one single inference. Differently, interactive image segmentation is fed with not only the image but the interactions to identify the target of interest with sequential human-in-the-loops. This mechanism transforms interactive segmentation into a progressive coarse-to-fine dense prediction task, which has garnered significant interests of researchers working on related visual tasks such as image editing [16], object selection [2], medical image analysis [36]. Moreover, due to its class-agnostic predictions, interactive segmentation has the potential to serve as an annotation tool that generates large-scale labeled data for mask-level tasks such as semantic segmentation [27], instance segmentation [25] and autonomous driving [37]. Therefore, more and more efforts are put into this field from both academic and industrial communities.
Click-based interactive segmentation stands out by the advantage of simplicity and convenience. In the standard pipeline for interactive image segmentation, users first put a positive click on the target, and further add positive or negative clicks on the foreground or background, respectively, based on the current segmentation result. This iterative prediction process will not end until the segmentation meets the requirements.
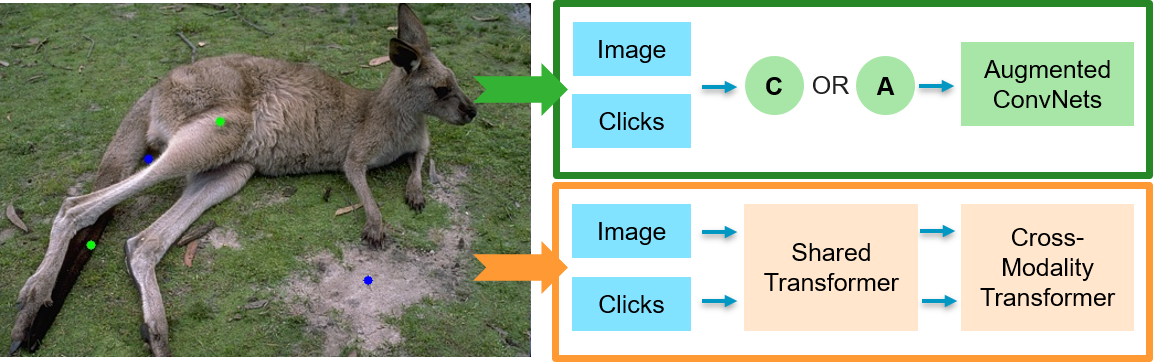
Over the last few years, click-based interactive segmentation has made great strides in various directions such as sampling strategy [47], click encoding [29], powerful backbones [5], local refinements [22, 44], and computational optimization [6]. The green box of Fig. 1 shows the architecture of most existing methods. The positive and negative clicks are represented as 2D masks by the same size as the input image. To make use of the pretrained models for robust feature extraction, these methods augment the weights of certain layers for the concatenated or element-size summarized image and click masks [41]. However, they utilize two-modality input indiscriminately with purely visual information processing. In practical, the discrete clicks (either distance maps or disk maps) should be seen as a guidance signal in the process of image segmentation. Meanwhile, the value ranges between images and click masks do not match well if directly concatenating or adding them together in the early stages. Based on the above concerns in mind, a better incorporation method between image and clicks is in high demand for interactive segmentation.
In this paper, we propose interactive Cross-Modality TransFormer (iCMFormer), a vision transformer based method with cross-modality attentions between image and clicks (shown in the orange box of Fig. 1). To alleviate the mismatching problem in the early stage, we use a parallel structure for both modalities with shared vision transformer blocks. We propose cross-modality transformers to extract guidance signals, which can help improve focus on the target locations. By incorporating another group of vision transformers for high-level semantic information extraction, the fused features from both branches can be finely tuned before going through the segmentation head. Inspired by the progressive downsampling operations in ConvNets [14, 23] for larger receptive fields, hierarchical vision transformers address multi-scale problem with similar stages. Our proposed cross-modality transformers are flexible to be added into the hierarchical structure such as Swin-Transformer [26] to improve the results. We evaluate our method on four datasets through a series of experiments, and the results show the superior performance of iCMFormer compared with the existing methods. Our main contributions of this paper are summarized as follows:
-
•
Our iCMFormer is the first network that takes the modality issue into account with vision transformers for interactive segmentation. The proposed simple yet effective cross-modality transformers utilize the guidance information to generate robust results.
-
•
The proposed cross-modality transformers are flexibly integrated into a hierarchical architecture to address the multi-scale problem.
-
•
Our method achieves the state-of-the-art performance on four benchmarks, which can be explored as a practical annotation tool for other visual tasks.
2 Related Work
Interactive Segmentation Methods. Interactive segmentation (IS) is a quite active research field, which involves progressive interactions between humans and machines. Early works [11, 18, 35] address this problem from the perspective of optimization. However, these works fail to handle complex surroundings by only relying on the low-level features. Since ConvNets show their power on extracting robust features from images, some IS methods adopt the successful backbones [14, 27, 38] to improve the segmentation results. DIOS [47] is the first work to bring deep learning techniques to IS, and proposes a classical sampling strategy to simulate positive and negative clicks for training. Not restricted in clicks, more interaction formats (e.g., scribbles [4], polygons [1], bounding boxes [46]) have also been explored. DEXTR [30] makes use of four extreme points: the left-most, right-most, top-most, and bottom-most pixels to specify the target from the background. ITIS [28] proposes a new online iterative sampling strategy based on the regions from the current incorrect predictions, which has been improved in RITM [41] with less computational resources. Not only the global segmentation, but further refinements are beneficial to obtain high-quality results. Backpropagating refinement scheme [15, 40] minimizes a discrepancy between the input map and predicted mask for optimization. FocalClick [6], FocusCut [22] and FCF [44] try to modify the segmentation results from the local perspective. From other aspects for IS, EMC [9] reduces the computational cost via a lightweight mask correction network. GPCIS [52] formulates IS as a Gaussian process classification model on each image. However, these methods neglect the modality issue but attempt to improve the results through complex attention modules or local refinements. Differently, we explore simple vision transformer backbones equipped with cross-modality transformers for IS.
Vision Transformers. Attention-based transformers [42] have achieved great performance in the field of natural language processing (NLP), which has attracted lots of interests in computer vision community. The original ViT [8] brings the self-attention transformers to image classification task with sequentially processing for smaller image patches. However, the plain transformers with encoder-decoder architecture are insufficient for the dense prediction tasks such as semantic segmentation. Various hierarchical vision transformers [7, 43, 45, 49] have been proposed to solve the problem with different network designs. These methods are inspired by the ideas from successful ConvNets such as hierarchical structure, multi-scale and multi-path designs, pooling and down-sampling operations. For instance, Swin-Transformer [26] handles the reduced resolution feature maps with high-level semantic information, and captures multi-stage features to obtain good results. Correspondingly, the hierarchical structure can be used with our proposed cross-modality transformers to address the multi-scale problem.
Multimodal Learning. In the last decade, we have witnessed the rising and fast pace developments of deep learning models for multimodal streams such as vision&text[3, 51], video&audio [32] and RGB&Lidar [34]. Normally, these tasks need a shared representation approach between modalities, as well as the cross-modality learning for the feature fusion. The previous interactive segmentation methods [23, 29, 47] only take the interactions as another format of image mask (e.g., binary disk map, Gaussian map, or distance map) and seldom study the relations between modalities. In our work, the multimodal information is learnt with the proposed cross-attention transformers.
3 Method
We propose an interactive image segmentation method on the basis of vision transformers. In this section, we first introduce the network with plain and hierarchical structure, respectively. Then we elaborate the cross-modality attentions for learning relationships between images and clicks. Finally, we explain the iterative training scheme and details about click simulations.
3.1 Effective Network
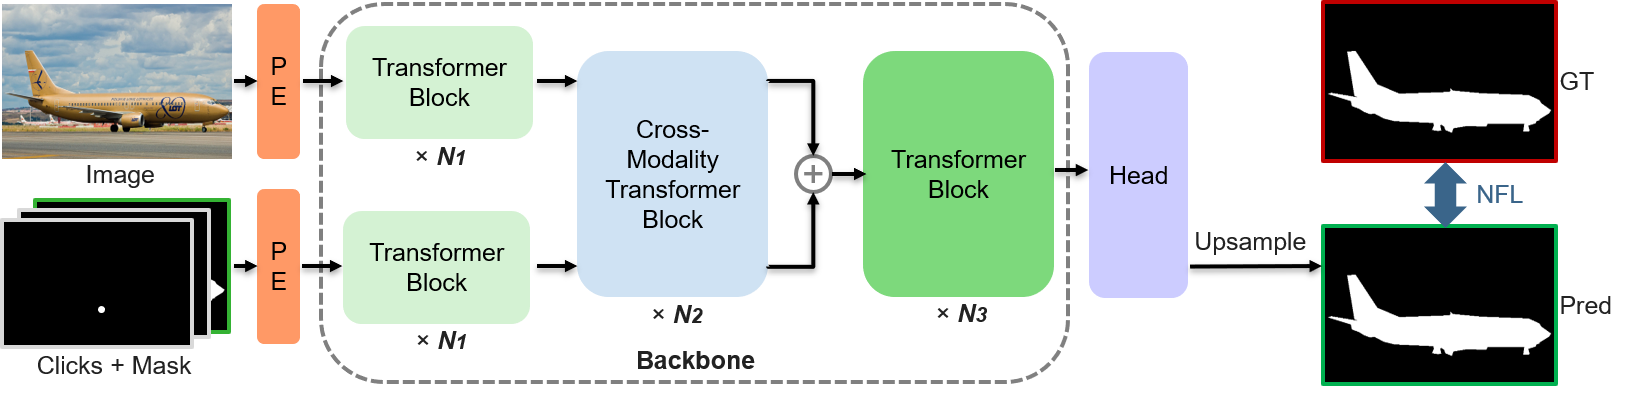
The architecture of the proposed network for interactive segmentation is shown in Fig. 2. We retain the original blocks and corresponding hyper-parameters for both plain and hierarchical transformers. Instead, we add the cross-modality attention blocks (introduced in Sec. 3.2) in the middle stage of these transformers. On the basis of the backbones, a segmentation head is adopted to obtain dense predictions. More details can be found in the supplementary material.
Backbones. To extract the features from images and clicks, we employ two powerful vision transformers as our backbones: plain vision transformer [8] and Swin Transformer [26]. Plain vision transformer (ViT) is a classical self-attention network by splitting the images into smaller patches with positional embeddings, which is inspired by the original transformer [42] for sequential text processing. Then these patches are further flattened and projected into a linear space as a vector that serves as the input for transformers. We divide the 12 transformer blocks from the base version of vision transformer (ViT-B) into 2 groups, and add 3 blocks of the proposed cross-modality transformer between them. The other backbone is Swin-Transformer, which has a hierarchical architecture with linear computational complexity through window and shifted-window self-attentions. Similarly, we divide the base Swin-Transformer (Swin-B) into 2 groups and add 4 proposed blocks. Note that the first 2 stages (2 plus 2 transformers) of Swin-B are grouped while the others (18 plus 2 transformers) as the second group. For both ViT-B and Swin-B backbones, the input is fed into a shared network consisting of the first group of transformers, which processes the data for different branches, including images and clicks. After the followed cross-modality transformers, the image features and click features are combined with an element-wise addition, as the input for the next group of transformers. About the click encoding for networks, RITM [41] has concluded that the disk maps perform better than others (distance maps and Gaussian maps). We directly employ the disk maps (radius equals 5) in our work.
Segmentation Head. As the hierarchical transformer Swin-B has a large receptive field, it is unnecessary to design complex hand-crafted components like original segmentation follow-ups. We employ the simple segmentation head from Segformer [45] in our work. Specifically, it consists of 4 MLP steps: unification on the channel dimension for the multi-scale features from the backbones, upsampling the features to the same resolution, fusion based on the concatenated features, and prediction with a sigmoid for the final segmentation result. To unify the framework for different backbones, we add 4 convolution layers (inspired by ViTDet [17]) for the last output from the ViT-B, and adopt the same segmentation head. After upsamlping operations to obtain the same resolution of the original image, the probability map for the foreground prediction is generated.
3.2 Cross-Modality Attention
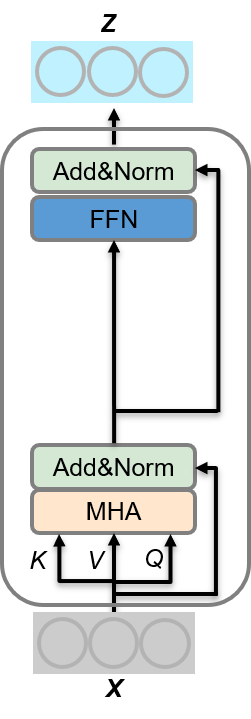
Multi-head attention (MHA) is the basic function in the original transformer blocks, which takes in the query, key, and value to capture different focuses. The function outputs the summation over the values with weighted attentions obtained from the scaled dot products between queries and keys. Note that the indicating the queries, keys, and values, respectively, are obtained from the same input features (shown in Fig. 3(a), which is also called self-attention [42]). Take one head as an example for the self-attention:
| (1) |
where represents the dimension of keys and values.
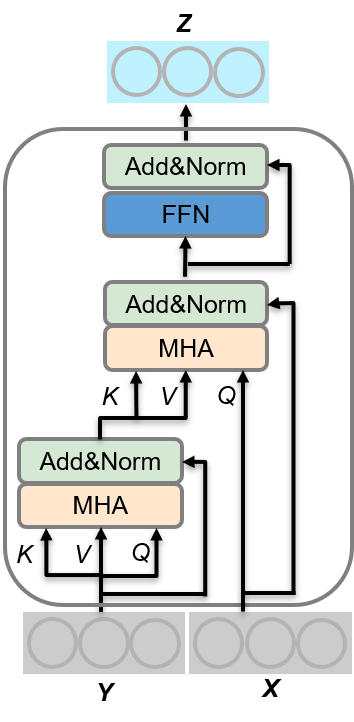
Inspired by some vision-language works [48, 50], we propose a cross-modality transformer block (see in Fig. 3(b)) for interactive segmentation. A cross-modality block takes two groups of features and from images and clicks, where one modality guides the learning for the other one . Specifically, the block consists of 2 steps of multi-head attentions (MHA): self-attentions on the from , and the cross-attentions on the (from ) with and (both from ), where it learns to capture the cross-modal relationships. The cross-attention is given by:
| (2) |
where represents the queries from while , and denote the keys, values and dimension of keys from . Then it follows a feed-forward network (FFN) with ReLU activation and Dropout like a standard transformer block.
3.3 Iterative Training Scheme
Before introducing the training scheme for deep interactive segmentation networks, we take a deep dive into the interactions involved in a human-in-the-loop mechanism. Normally, the first click (always positive one) should be put into the centre of the target while every new click is placed in the regions where the model has made incorrect predictions. Whether a new click is positive or negative is decided by humans based on the analysis on the current segmentation result. Therefore, interactive segmentation is a progressive refinement method based on a set of sequential clicks.
However, previous methods [19, 23, 29] ignore the sequential information by adopting random sampling strategy [47] in the training stage. RITM [41] propose a novel iterative sampling strategy, which generates the next click in the cluster centre of the largest incorrect prediction region after morphological erosion operation. To reduce computation in the training, the maximum number of iterative clicks is set to 3. We employ the similar click simulation strategy with RITM, and make a small change on the selection of iterative click’s position. Specifically, we combine the centre point and random point near the borders of the mislabeled regions to fit humans’ behaviors better.
In addition, we incorporate the segmentation mask from the last iterative step as an additional channel for the click branch, which has been proved as prior information [28] to improve the results. Note that we feed an empty mask for the first iteration. We also take the Normalized Focal Loss [39] (NFL) as the loss function for the training following recent works [6, 41], which converges faster and more robustly.
| Method | Year | Backbone | GrabCut | Berkeley | SBD | DAVIS | ||||
|---|---|---|---|---|---|---|---|---|---|---|
| NoC85 | NoC90 | NoC85 | NoC90 | NoC85 | NoC90 | NoC85 | NoC90 | |||
| DIOS[47] | CVPR16 | FCN | - | 6.04 | - | 8.65 | - | - | - | 12.58 |
| RIS-Net[20] | ICCV17 | FCN | - | 5.00 | - | - | 6.03 | - | - | - |
| FCA-Net[23] | CVPR20 | ResNet-101 | - | 2.08 | - | 3.92 | - | - | - | 7.57 |
| LD[19] | CVPR18 | VGG-19 | 3.20 | 4.79 | - | - | 7.41 | 10.78 | 5.05 | 9.57 |
| BRS[15] | CVPR19 | DenseNet | 2.60 | 3.60 | - | 5.08 | 6.59 | 9.78 | 5.58 | 8.24 |
| f-BRS[40] | CVPR20 | ResNet-101 | 2.30 | 2.72 | - | 4.57 | 4.81 | 7.73 | 5.04 | 7.41 |
| CDNet[5] | ICCV21 | ResNet-50 | 2.22 | 2.64 | - | 3.69 | 4.37 | 7.87 | 5.17 | 6.66 |
| RITM[41] | ICIP22 | HRNet-18 | 1.76 | 2.04 | - | 3.22 | 3.39 | 5.43 | 4.94 | 6.71 |
| FocalClick[6] | CVPR22 | HRNet-18s-S2 | 1.86 | 2.06 | - | 3.14 | 4.30 | 6.52 | 4.92 | 6.48 |
| FocalClick[6] | CVPR22 | SegF-B0-S2 | 1.66 | 1.90 | - | 3.14 | 4.34 | 6.51 | 5.02 | 7.06 |
| FocusCut[22] | CVPR22 | ResNet-101 | 1.46 | 1.64 | - | 3.01 | 3.40 | 5.31 | 4.85 | 6.22 |
| PseudoClick[24] | ECCV22 | HRNet-18 | - | 2.04 | - | 3.23 | - | 5.40 | 4.81 | 6.57 |
| GPCIS[52] | CVPR23 | HRNet-18s-S2 | 1.74 | 1.94 | 1.83 | 2.65 | 4.28 | 6.25 | 4.62 | 6.16 |
| GPCIS[52] | CVPR23 | SegF-B0-S2 | 1.60 | 1.76 | 1.84 | 2.70 | 4.16 | 6.28 | 4.45 | 6.04 |
| EMC[9] | CVPR23 | HRNet-18 | 1.74 | 1.84 | - | 3.03 | 3.38 | 5.51 | 5.05 | 6.71 |
| FCF[44] | CVPR23 | ResNet-101 | 1.64 | 1.80 | - | 2.84 | 3.26 | 5.35 | 4.75 | 6.48 |
| Ours | 2023 | ViT-B | 1.36 | 1.42 | 1.42 | 2.52 | 3.33 | 5.31 | 4.05 | 5.58 |
| Ours | 2023 | Swin-B | 1.46 | 1.50 | 1.52 | 2.32 | 3.21 | 5.16 | 4.25 | 5.55 |
| RITM[41] | ICIP22 | HRNet-18 | 1.42 | 1.54 | - | 2.26 | 3.80 | 6.06 | 4.36 | 5.74 |
| RITM[41] | ICIP22 | HRNet-32 | 1.46 | 1.56 | - | 2.10 | 3.59 | 5.71 | 4.11 | 5.34 |
| FocalClick[6] | CVPR22 | HRNet-32-S2 | 1.64 | 1.80 | - | 2.36 | 4.24 | 6.51 | 4.01 | 5.39 |
| FocalClick[6] | CVPR22 | SegF-B0-S2 | 1.40 | 1.66 | - | 2.27 | 4.56 | 6.86 | 4.04 | 5.49 |
| PseudoClick[24] | ECCV22 | HRNet-32 | - | 1.50 | - | 2.08 | - | 5.54 | 3.79 | 5.11 |
| EMC[9] | CVPR23 | SegF-B3 | 1.42 | 1.48 | - | 2.35 | 3.44 | 5.57 | 4.49 | 5.69 |
| FCF[44] | CVPR23 | HRNet-18 | 1.38 | 1.46 | - | 1.96 | 3.63 | 5.83 | 3.97 | 5.16 |
| Ours | 2023 | ViT-B | 1.42 | 1.52 | 1.40 | 1.86 | 3.29 | 5.30 | 3.40 | 5.06 |
| Ours | 2023 | Swin-S | 1.46 | 1.60 | 1.49 | 1.93 | 3.34 | 5.35 | 3.46 | 5.07 |
| Ours | 2023 | Swin-B | 1.42 | 1.54 | 1.42 | 2.03 | 3.12 | 5.11 | 3.48 | 5.03 |
4 Experiments
4.1 Experiment Setup
Datasets. We evaluate our proposed interactive segmentation method on four widely used datasets, and employ one combination dataset for large-scale training:
Evaluation Protocol. To evaluate the proposed method, two kinds of inference ways are employed in this paper: manual evaluation to qualitatively access the real interactive segmentation results and automatic evaluation based on the simulated clicks to make a quantitative comparison with the others. As for the automatic evaluation, the first click (compulsively positive one to indicate the target) is sampled in the centre of the target object, while the next click is always selected from the largest error region by comparing the current prediction mask with the ground truth.
For the metrics, mean Intersection over Union (mIoU) is adopted in our work as a common image segmentation evaluation metric. In addition, Number of Clicks (NoC) is used to evaluate the interaction efforts for reaching a certain IoU threshold within the maximum clicks. Number of Failures (NoF) means the number of instances that the model fails to obtain a corresponding IoU after the maximum round of clicks, which reflects the stability of the method. We set two IoU thresholds (85% and 90%) and 20 clicks as the upper bound for interactions, which are consistent with the previous works [6, 19, 22, 23, 47].
Implementation Details. All the experiments are implemented on the PyTorch platform with 2 A40 GPUs. For different transformer backbones including ViT [8] and Swin [26], we use the pretrained models from the official repositories. During training, we employ several data augmentation strategies: random flipping, rotation, cropping as well as random resizing with the scale from 0.75 to 1.25. We apply Adam optimizer with and . Our models are trained on SBD [13] and COCO [21] + LVIS [12] with 55 and 85 epochs, respectively. We set batch size to 24, the initial learning rate as 0.00005 and decrease it 10 times after the epoch of 50.
4.2 Comparison with State-of-the-Art
We compare our results on four benchmarks with previous click-based interactive segmentation methods in terms of the mentioned evaluation metrics. Note that the maximum number of clicks is set as 20 for NoC@85 and NoC@90 even when the results cannot reach the target IoU, which is consistent with the other works [5, 23, 47].
| Method | Berkeley | SBD | DAVIS |
|---|---|---|---|
| 20@90 | 20@90 | 20@90 | |
| BRS[15] | 10 | - | 77 |
| f-BRS[40] | 2 | 1466 | 78 |
| CDNet[5] | - | - | 65 |
| FocusCut[22] | - | - | 57 |
| FCF[44] | 3 | - | 59 |
| Ours-ViT-B | 2 | 693 | 53 |
| Ours-Swin-B | 1 | 698 | 53 |
| Model | Size | # Params | # FLOPs | SPC |
|---|---|---|---|---|
| ResNet-101[22] | 384 | 59.35M | 102.02G | 384ms |
| HRNet-18s[41] | 400 | 4.22M | 17.84G | 64ms |
| HRNet-18[41] | 400 | 10.03M | 30.80G | 70ms |
| HRNet-32[41] | 400 | 30.95M | 82.84G | 84ms |
| SegF-B0-S2[6] | 256 | 3.72M | 3.54G | 42ms |
| SegF-B3-S2[6] | 256 | 45.66M | 25.34G | 76ms |
| Ours-ViT-B | 448 | 124.81M | 297.54G | 78ms |
| Ours-Swin-S | 224 | 68.14M | 106.74G | 74ms |
| Ours-Swin-B | 384 | 104.25M | 153.78G | 86ms |


Performance on Benchmarks. The comparison results on GrabCut [35], Berkeley [31], SBD [13], and DAVIS [33] with respect to the number of clicks (NoC) are demonstrated in Tab. 1. As some of the methods are trained in different datasets (early on PASCAL [10], popularly on SBD, and recently on COCO [21] + LVIS [12]), we split the table into 3 sections. We also report the backbones of different methods to indicate the importance of feature extraction. Our proposed iCMFormer reaches the state-of-the-art on 4 datasets when trained on SBD. For instance, on DAVIS (a high-quality gold standard of ground truths), it succeeds in reducing almost one click required to reach the higher IoU threshold. Additionally, our iCMFormer achieves competitive results when trained on COCO + LVIS. It significantly improves the results on Berkeley, achieving 90% IoU with less than 2 clicks, and sets the new state-of-the-arts on highly competitive benchmarks such as SBD and DAVIS. The results surpass previous methods and demonstrate the effectiveness of our proposed method.
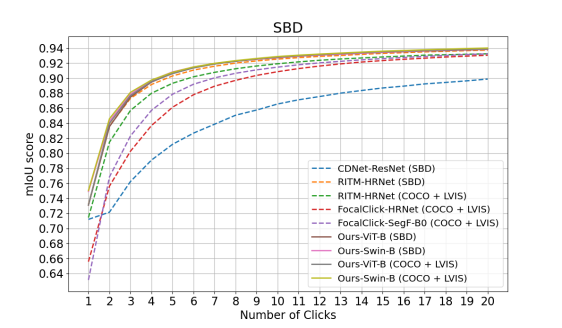
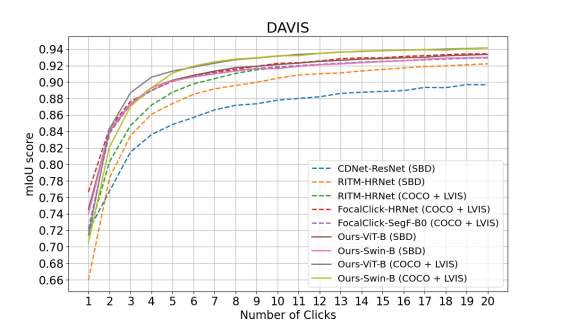
To visually compare the segmentation performance with other methods, Fig. 4 illustrates the mean IoU curves with progressively added clicks on SBD and DAVIS datasets. Due to the limited space, the curves of the other two datasets are shown in the supplementary material. We can observe that our methods achieve better mean IoU scores with the same number of clicks, and require fewer clicks to reach the same target IoU. For instance, ours-Swin-B improves the mIoU performance to around 75% with only one click on SBD. The figures also proves the superiority of our method to others shown in Tab. 1 when analysing the first 5 clicks.
As a practical annotation tool, it is extremely necessary and vital to obtain high-quality segmentation masks of targets if provided with sufficient clicks. Then we report the number of failures (NoF20@90) for 3 datasets on Tab. 2 (more complex compared to GrabCut). The proposed iCMFormer improves the results on the 3 datasets compared with the others. Remarkably, it reduces the failure cases below 700 on SBD, which outperforms the previous refinement method f-BRS [40] by 52.7%. Note that we only report the numbers that are provided by the original papers and their released pre-trained models. Limited by the space, we provide more details in the supplementary material.
Computation Analysis. We perform the computation analysis in terms of parameters, FLOPs, and inference speed. In Tab. 3, we report the corresponding models to represent various methods. To make a fair comparison, we set the same computing environment (NVIDIA A40 GPU and Intel Silver 4216 CPU). However, some methods process input images with different sizes (e.g., FocalClick [6] dealing with smaller size 256 while most methods with around 400). To address this issue, we also report the image size to complement the comparison. The numbers of parameters are collected from the original works [6, 22, 41]. Although both proposed backbones require more parameters, their inference speeds (e.g., 78ms, 86ms) still meet the requirements for real-time interactive segmentation. We also provide the numbers for a smaller variant based on Swin-S in Tab. 1 and Tab. 3. Our proposed end-to-end method still beats the current SOTAs with a comparable backbone.
| Cross-M | Hierarchy | Berkeley | SBD | DAVIS |
|---|---|---|---|---|
| NoC@90 | NoC@90 | NoC@90 | ||
| w/o | w/o | 2.55 | 6.05 | 5.76 |
| w/o | w | 2.58 | 5.57 | 5.63 |
| w | w/o | 2.52 | 5.31 | 5.58 |
| w | w | 2.32 | 5.16 | 5.55 |
| Variants | GrabCut | Berkeley | SBD | DAVIS |
|---|---|---|---|---|
| NoC@90 | NoC@90 | NoC@90 | NoC@90 | |
| 2.76 | 4.82 | 8.11 | 8.40 | |
| 1.74 | 2.47 | 5.81 | 5.60 | |
| 1.72 | 2.60 | 5.53 | 5.80 | |
| 1.42 | 2.52 | 5.31 | 5.58 |
4.3 Ablation Studies
To verify the effectiveness of the proposed method, we ablate the different components and the variants of the backbones for interactive image segmentation (number of cross-modality blocks is reported in the supplementary material). Simply, we train the models on SBD [13] and automatically evaluate the NoC@90 metric on the 4 datasets.
Effectiveness of Components. We set the original plain vision transformers [8] with two shared branches for the first group of self-attention blocks (see in Sec. 3.1) as the base model. The proposed cross-modality transformers aim for learning the guidance signal between two branches while the hierarchical architecture addresses the multi-scale problem in the dense prediction. We then evaluate the impact of these two components individually through the ablation study, and show the results in Tab. 4. The third row highlights the efficacy of cross-modality transformers. With hierarchy, the combined version (last row) further reduces the number of clicks, especially almost one click drop compared with base model for various instances from SBD.
Holistic Analysis. To investigate the optimal usage of the proposed cross-modality transformers, we run the holistic analysis on the backbone variants. We keep the second group of transformer the same fed by the element-wise addition input, and focus solely on the first group and the way of guidance. The results on 4 datasets are shown in Tab. 5. The first row shows that directly guiding the image feature learning with original clicks hugely hurts the performance because of the mismatched value ranges, and the third row verifies the significance of self-attentions on the click branch. Moreover, we see that outperforms , which reveals the key role of image features for segmentation. Due to the similar group allocation, we adopt as our default backbone architecture for both plain and hierarchical vision transformers.
4.4 Qualitative Results
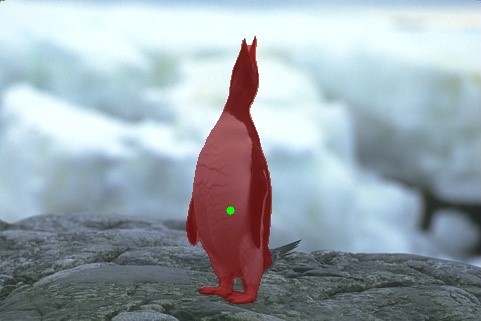
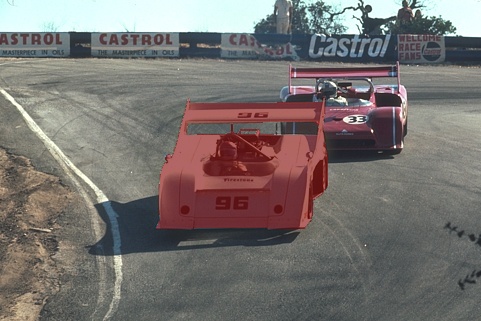
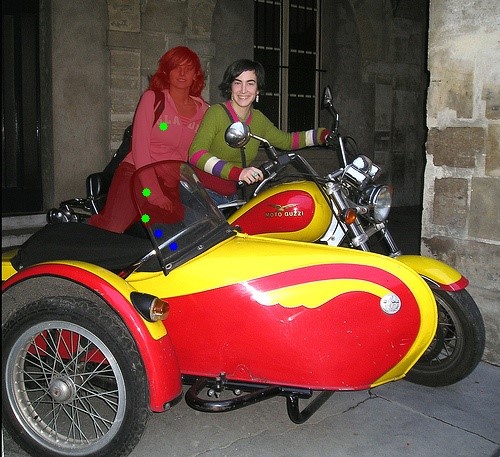
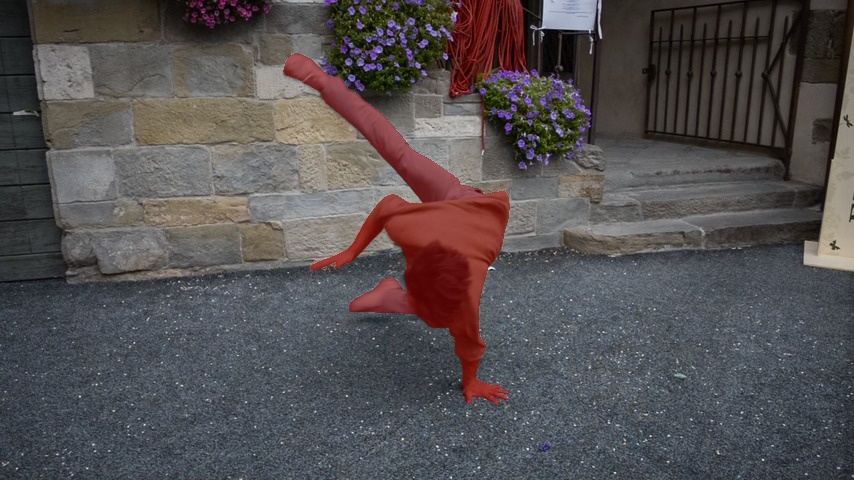
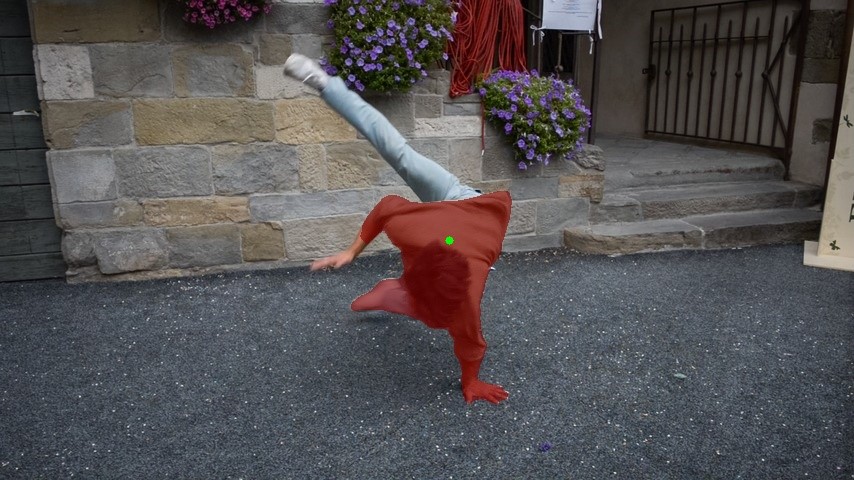
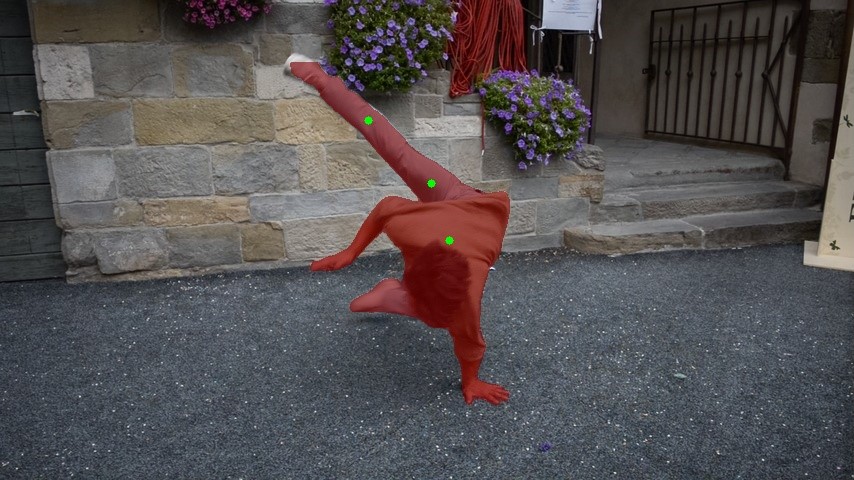
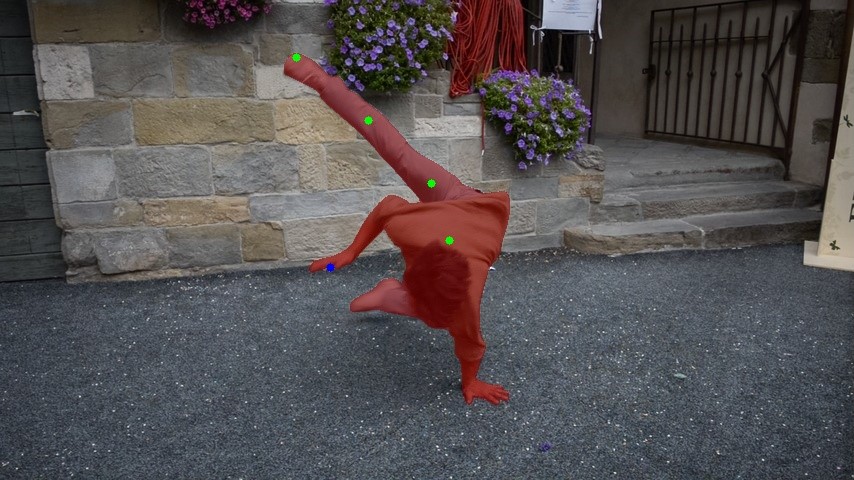
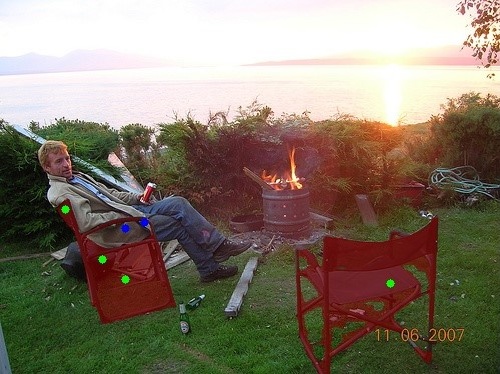
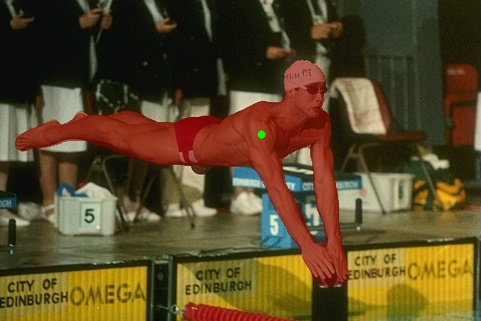
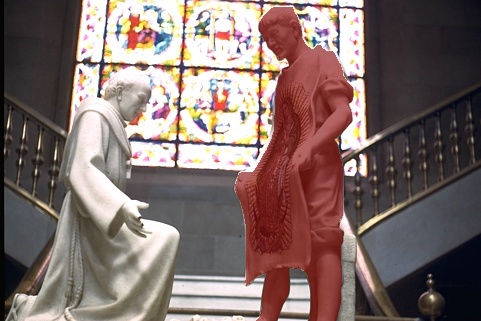
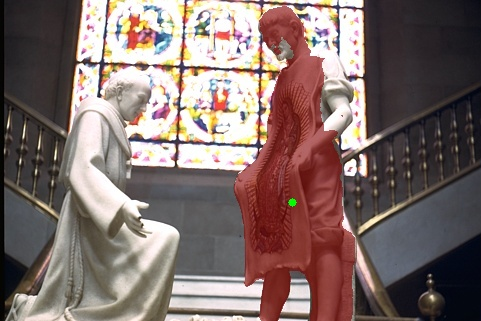
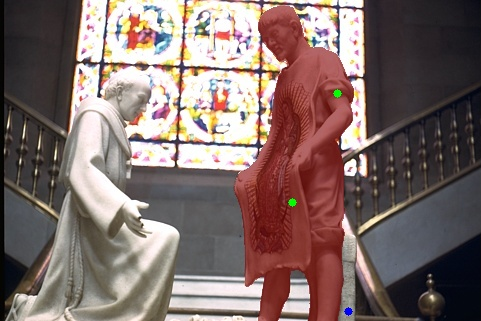
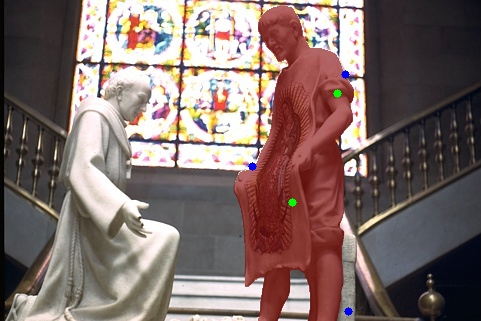
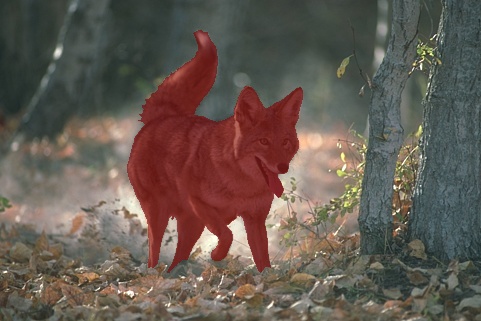
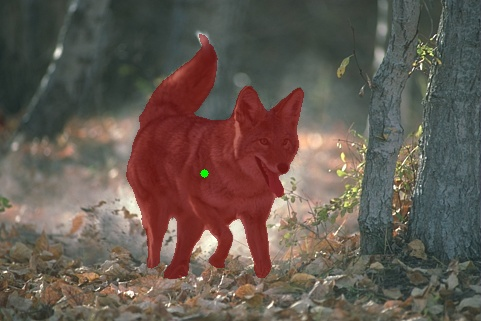
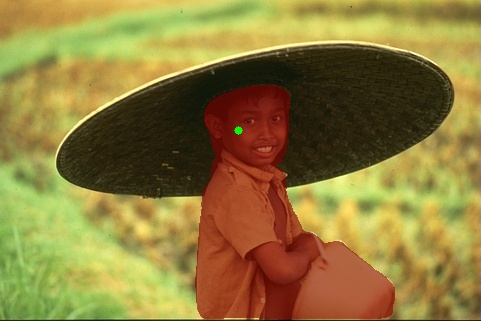
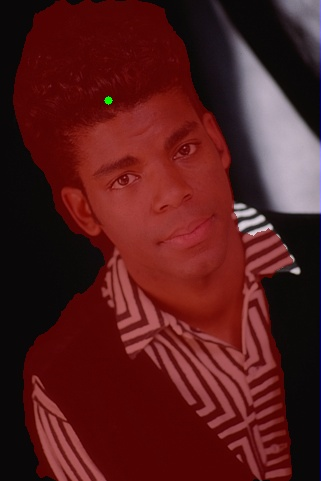
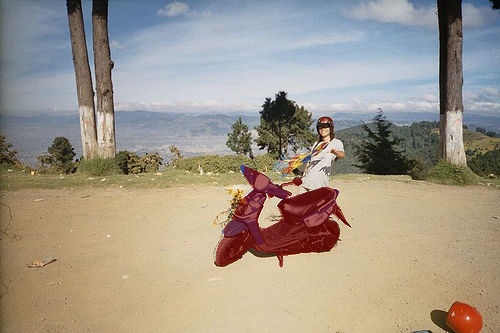
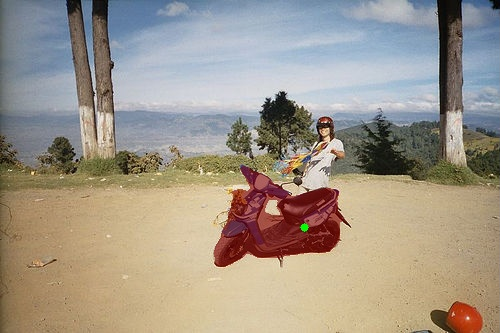
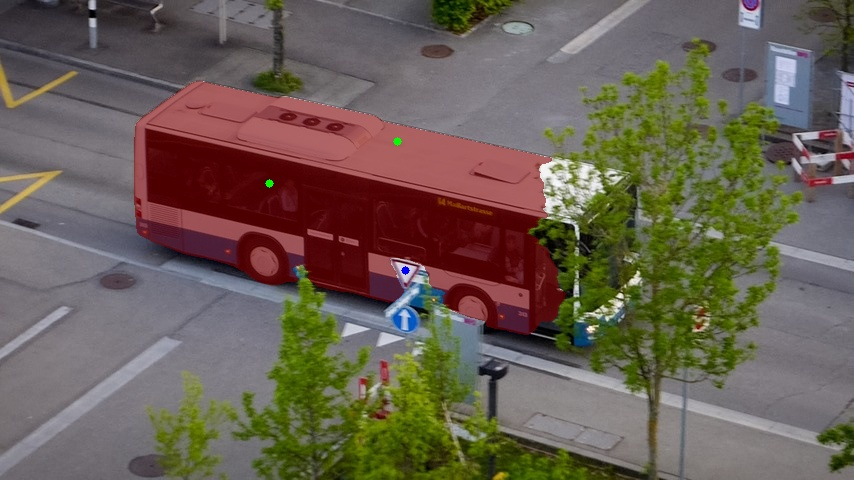
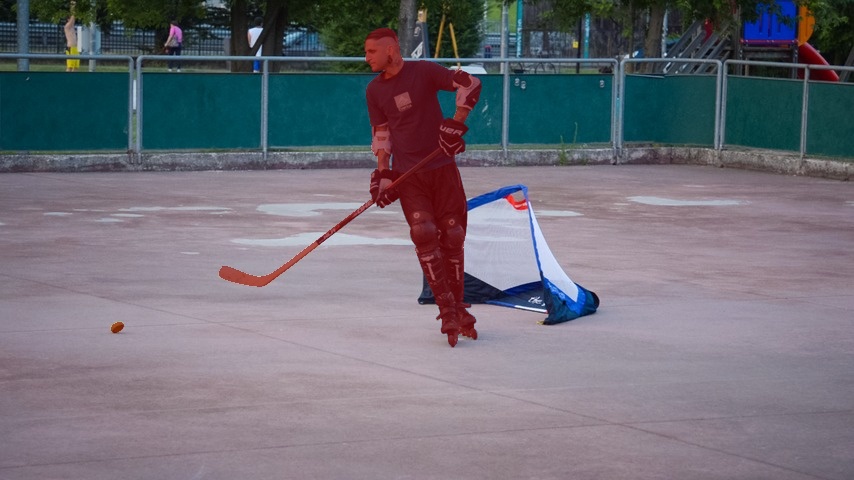
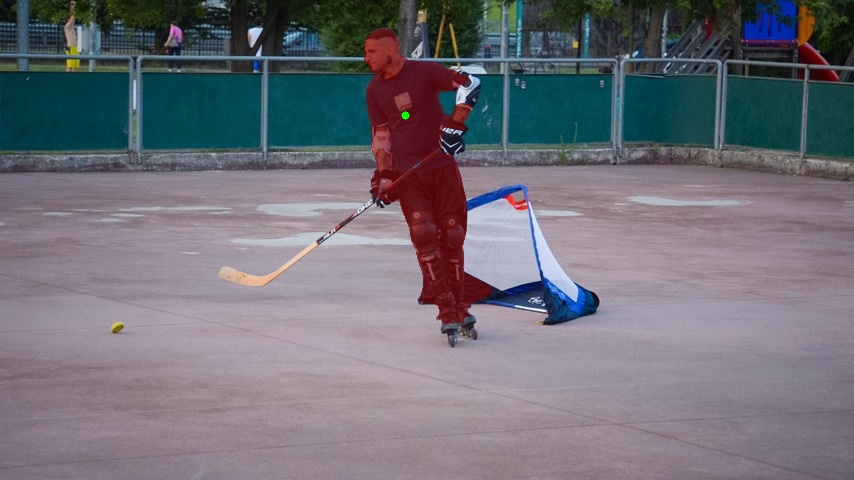
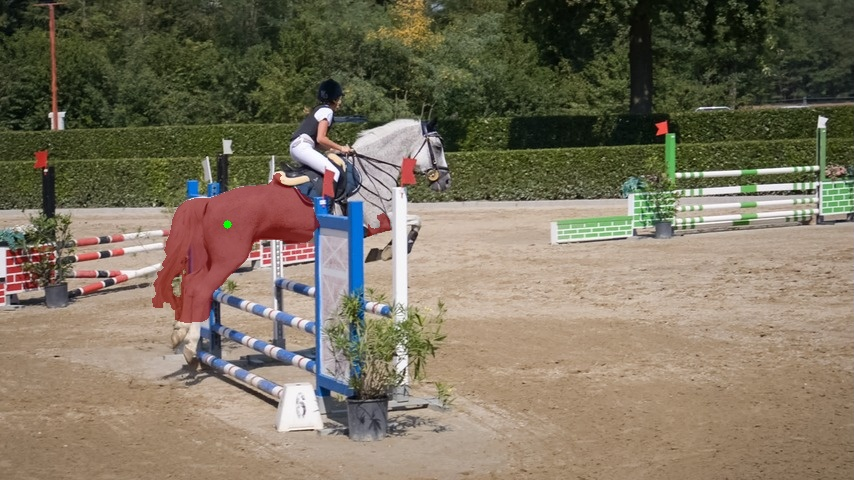
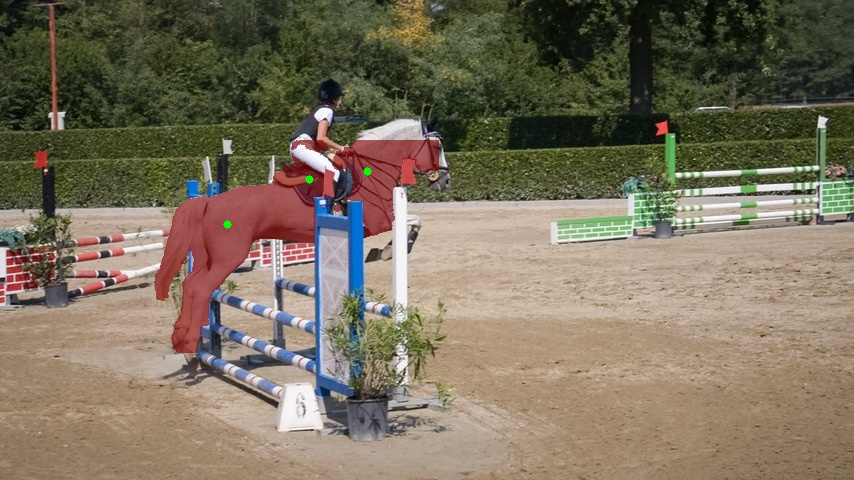
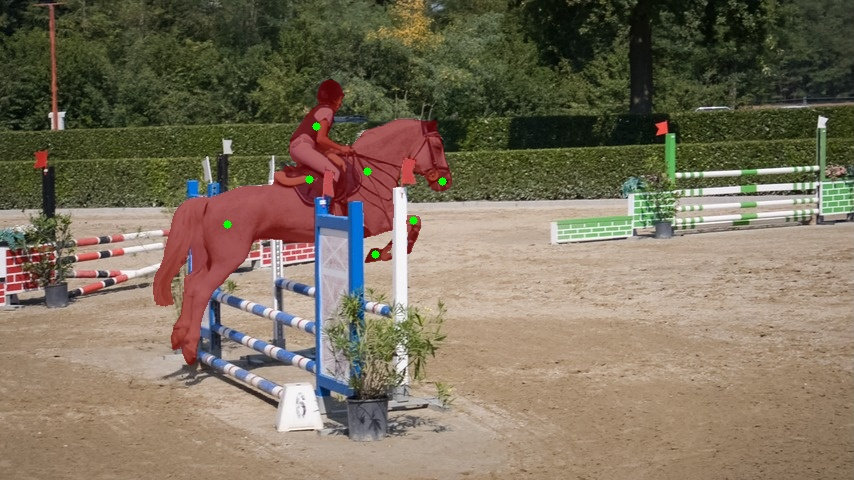
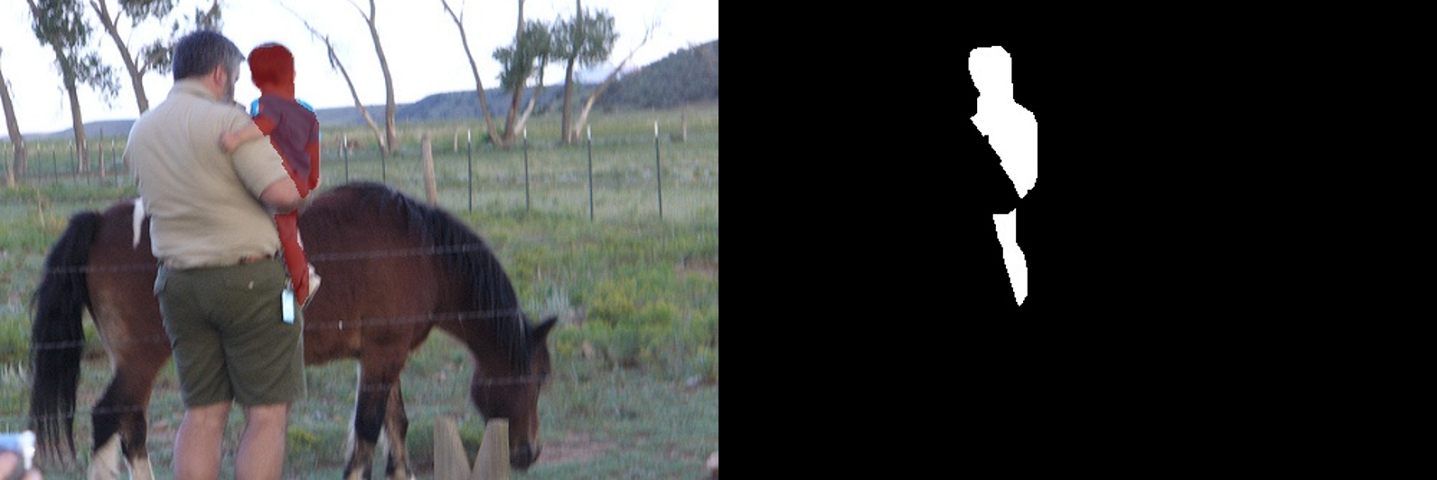
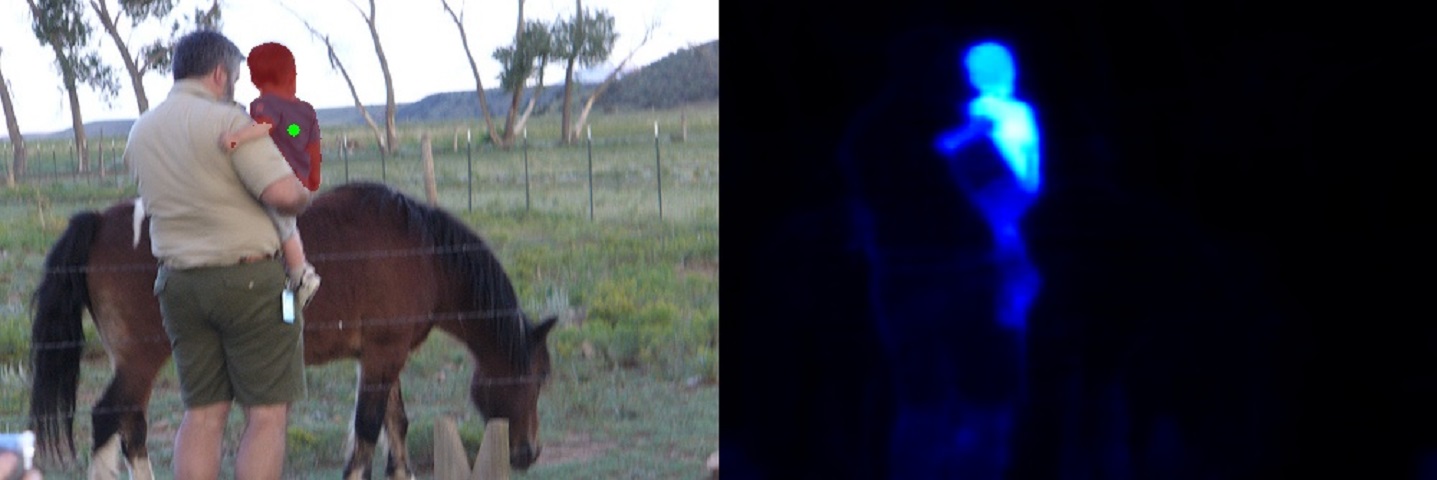
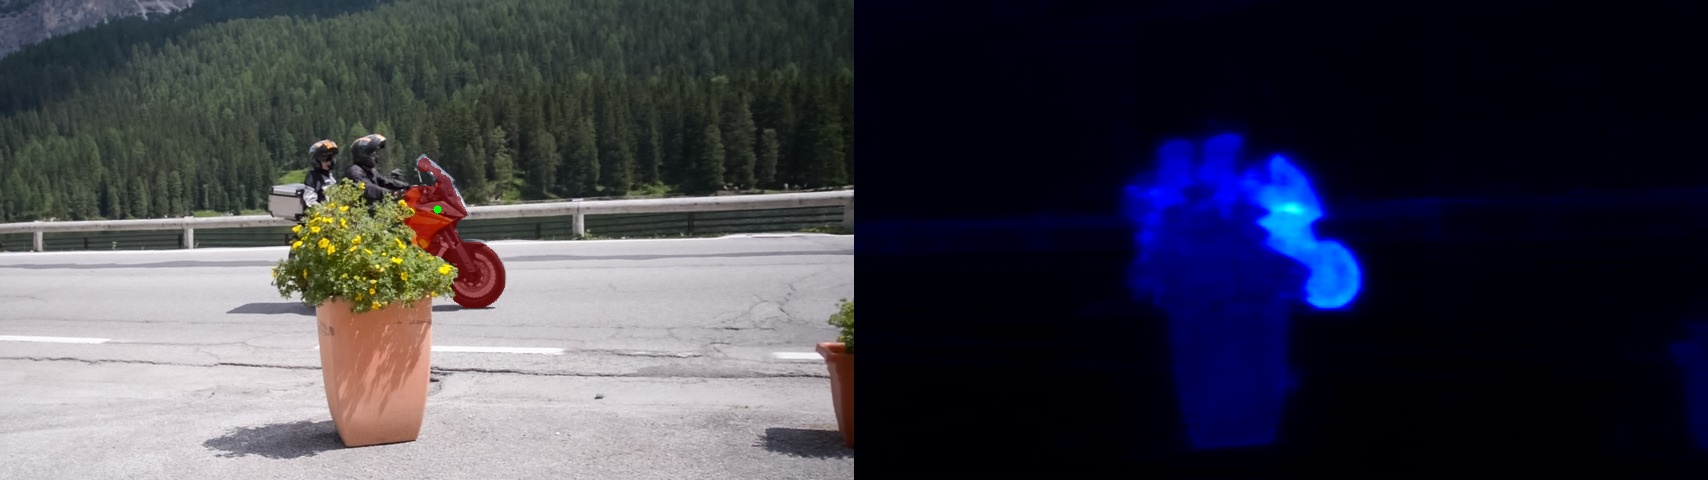
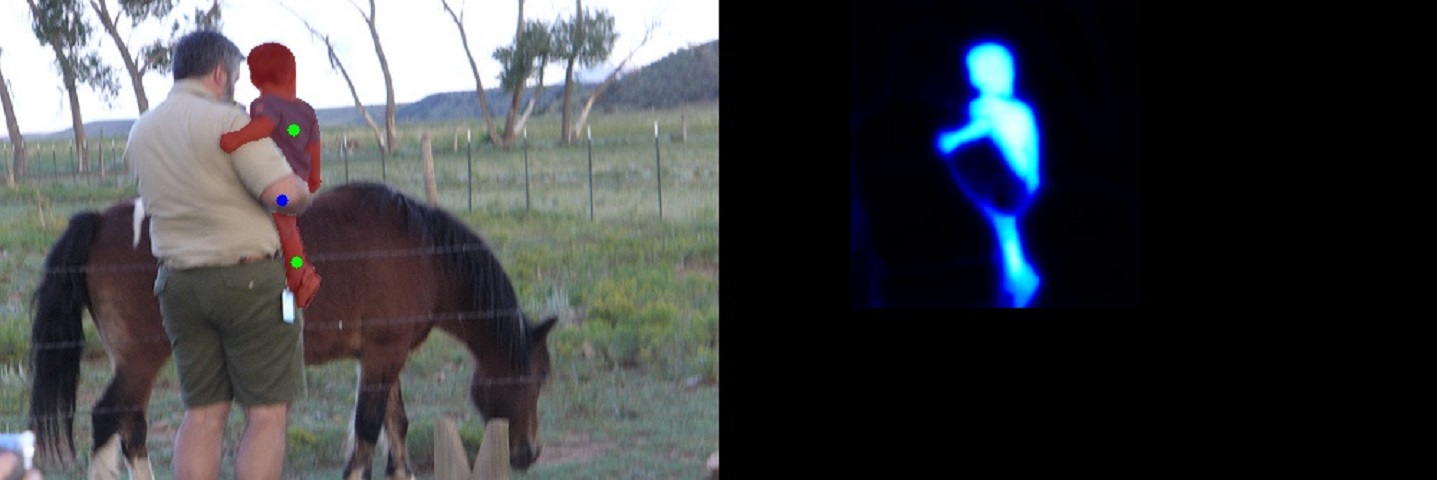
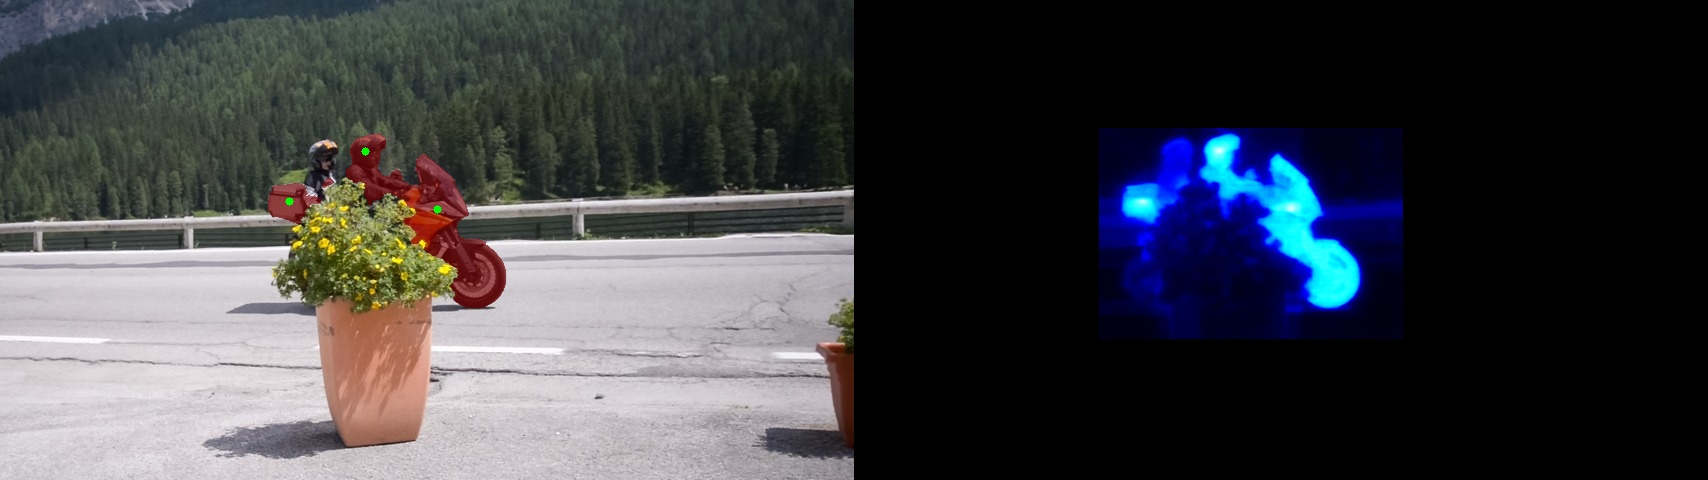
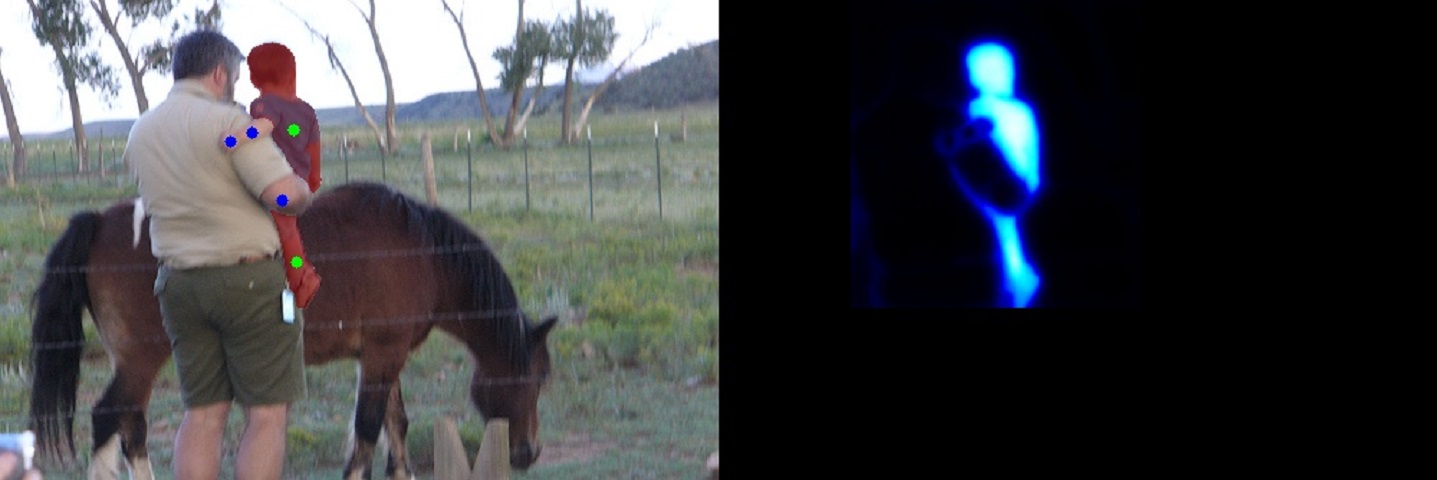
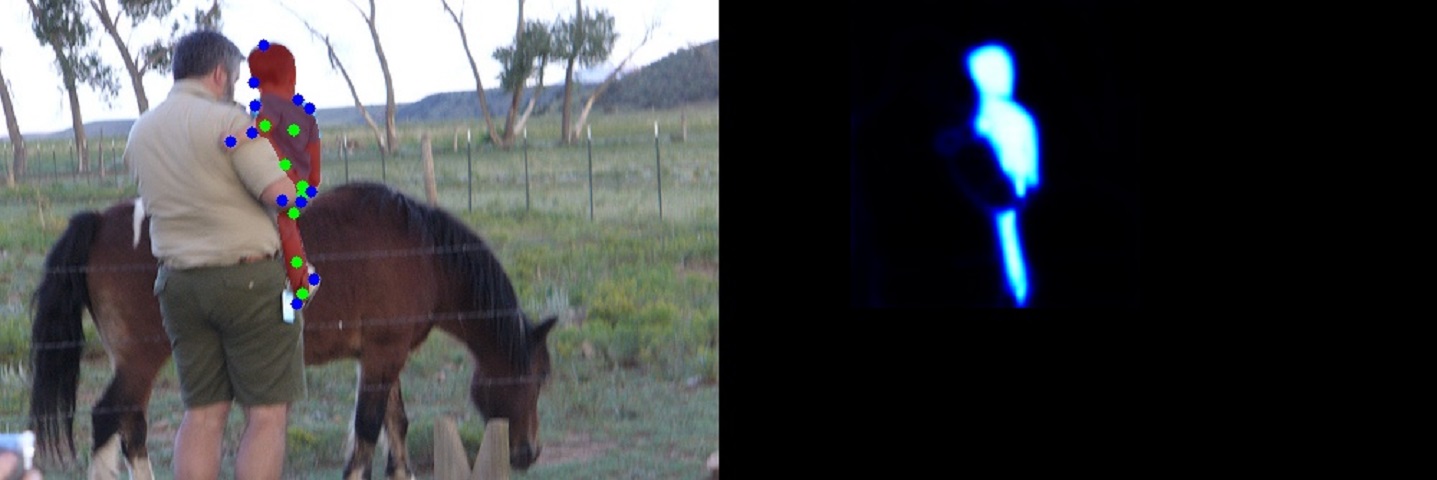
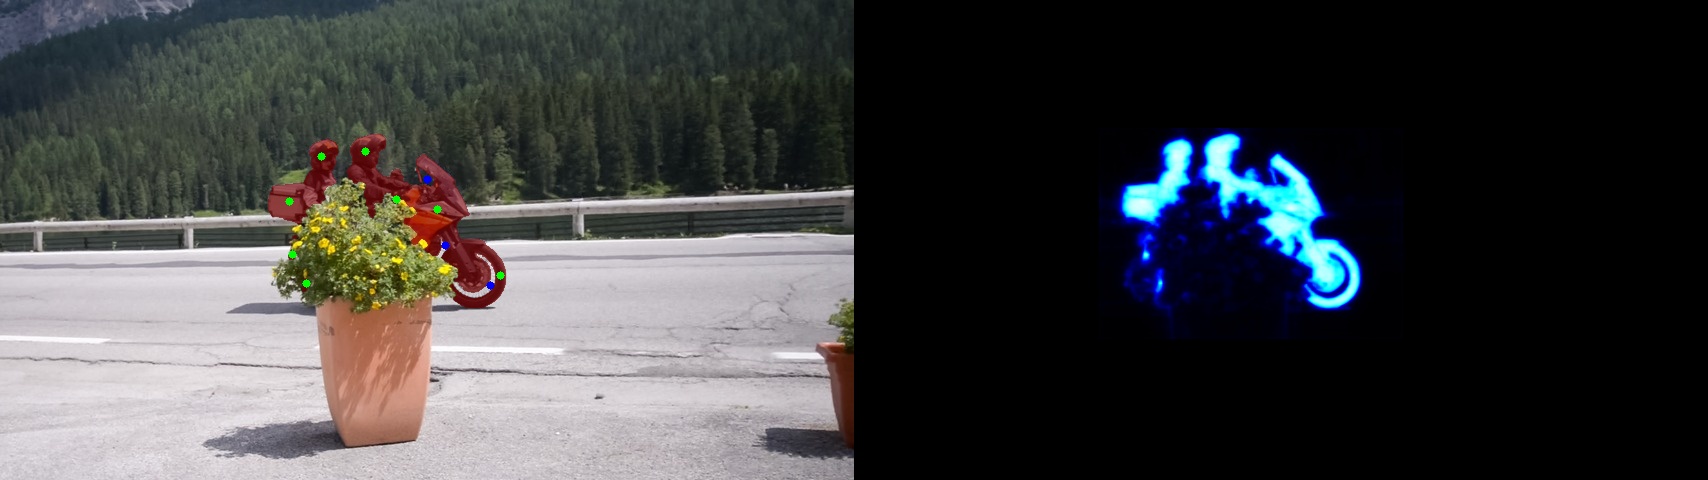
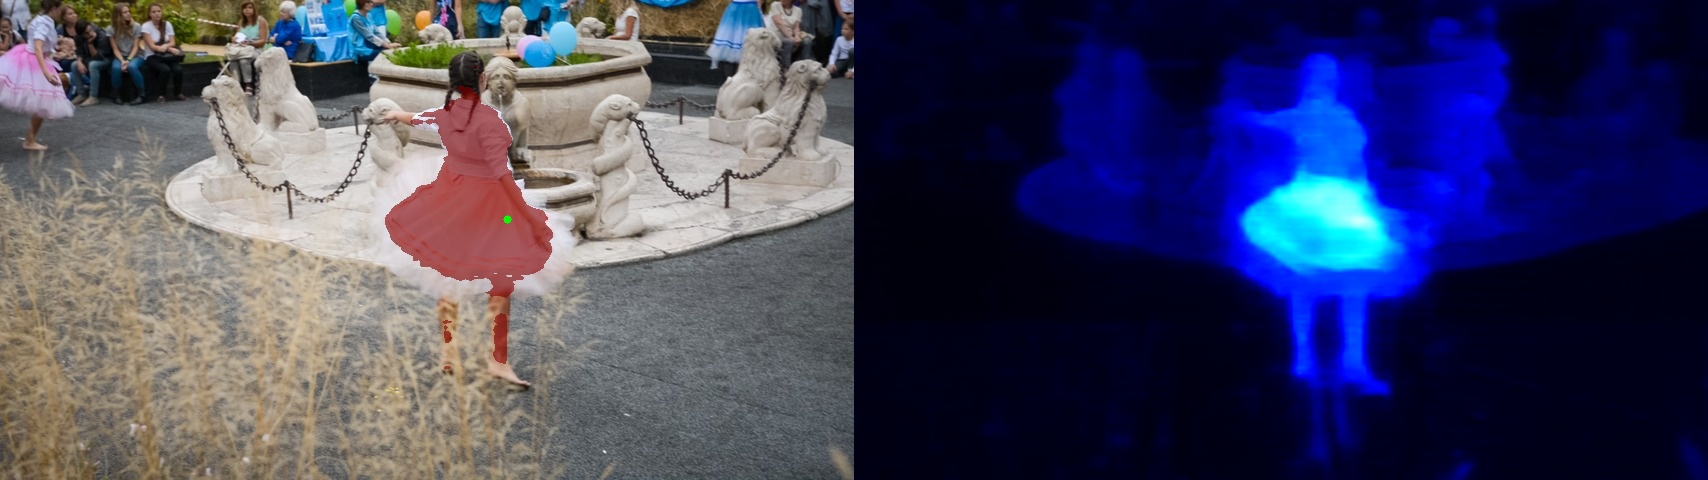
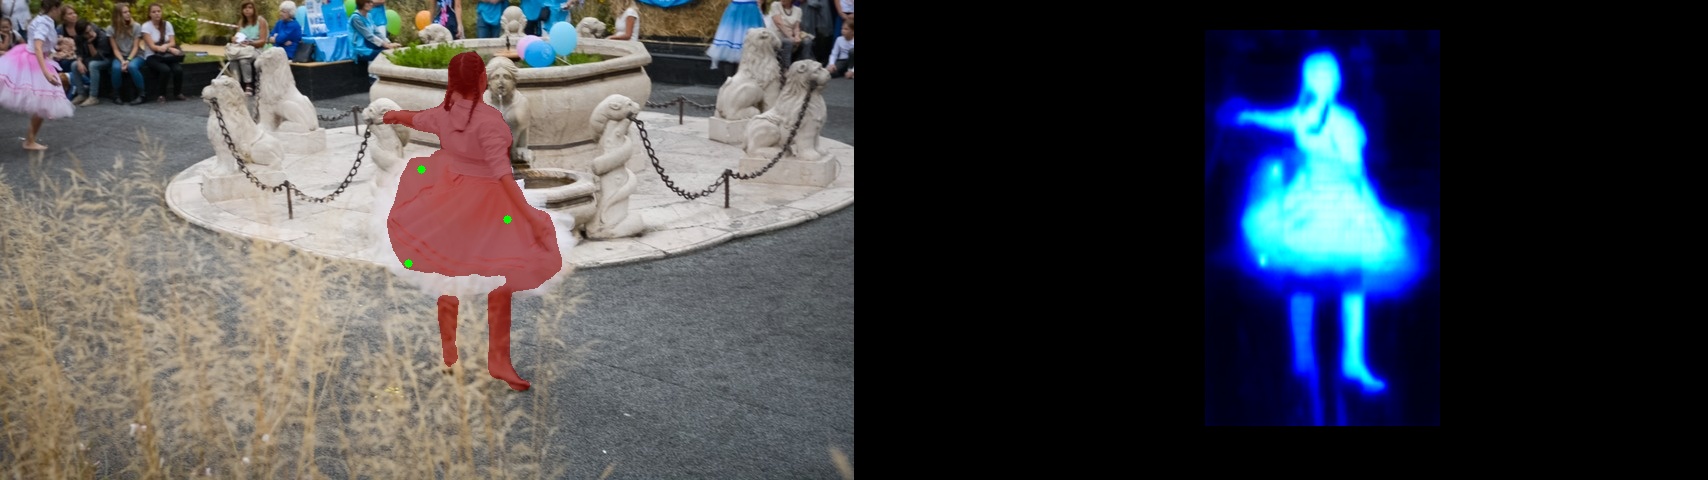
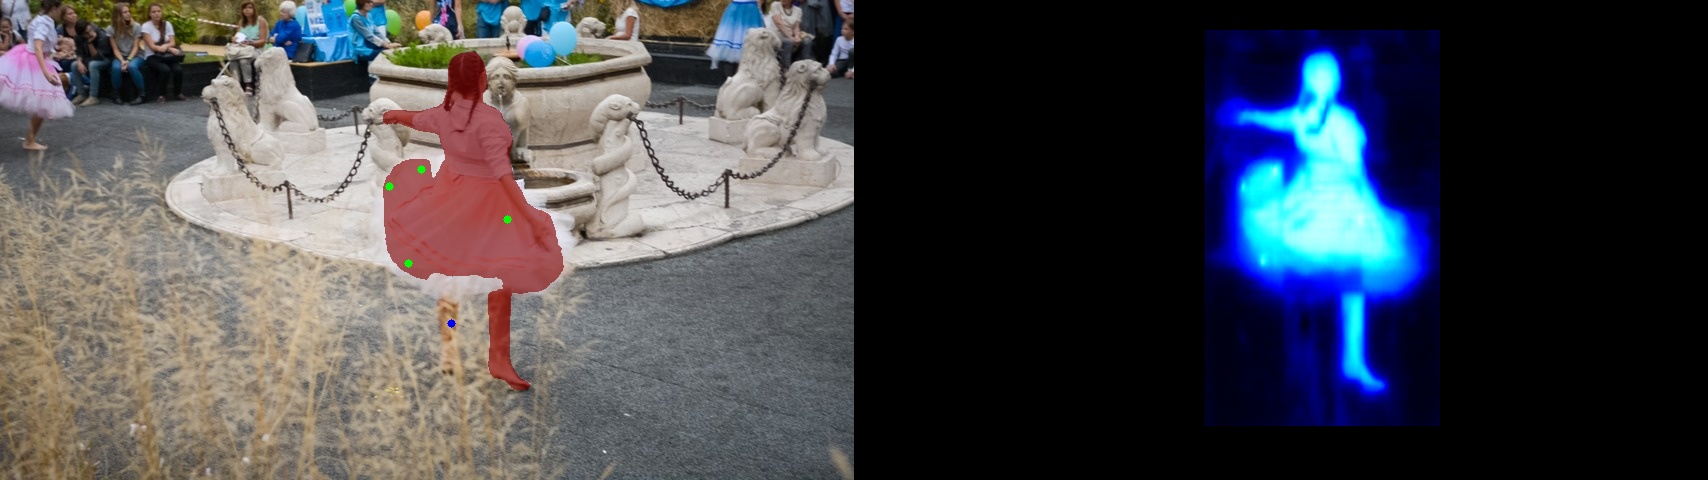
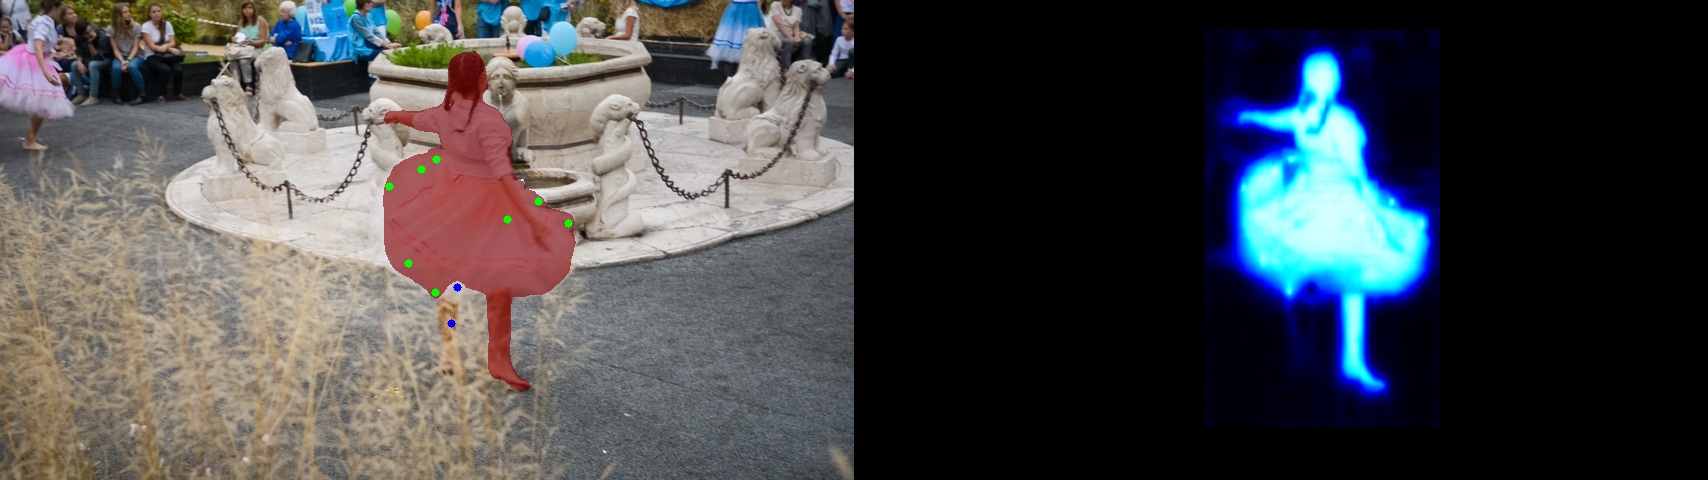
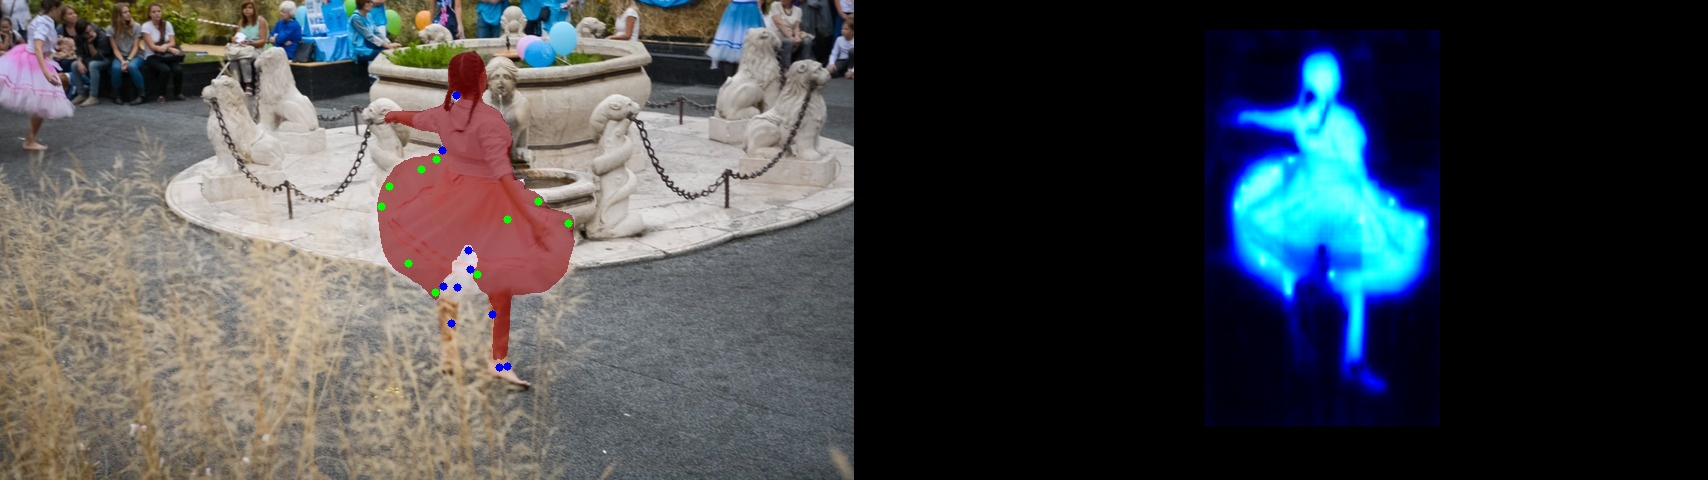
Visualisations of the manual evaluation process with the proposed method are shown in Fig. 5. The first three rows display the examples from GrabCut [35], Berkeley [31], SBD [13] and DAVIS [33], respectively. These examples show that the segmentation results get better with progressive interactions on the incorrect prediction regions. The last row gives a failure case from SBD, indicating that our method cannot address the occlusion problem when the target is only partly visible. We provide more segmentation results in the supplementary material.
4.5 Discussion
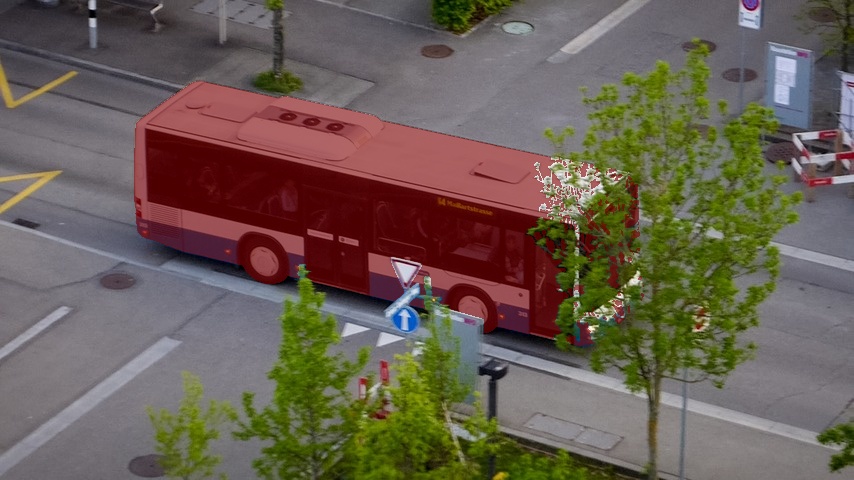
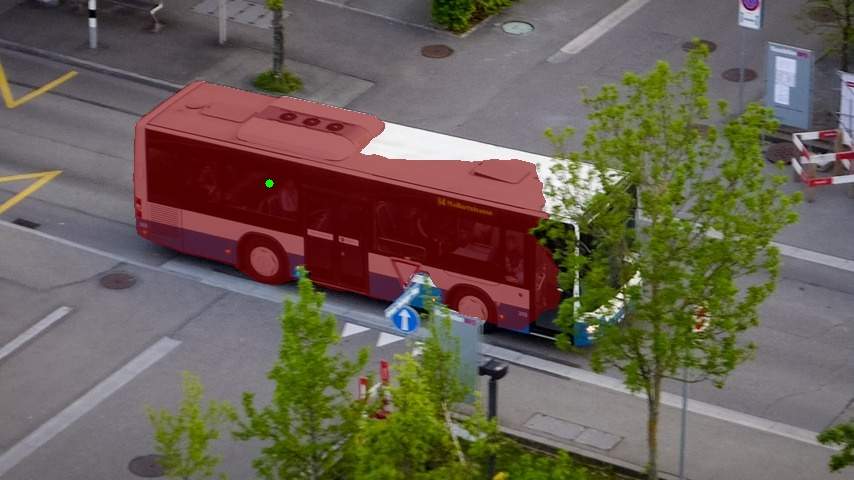
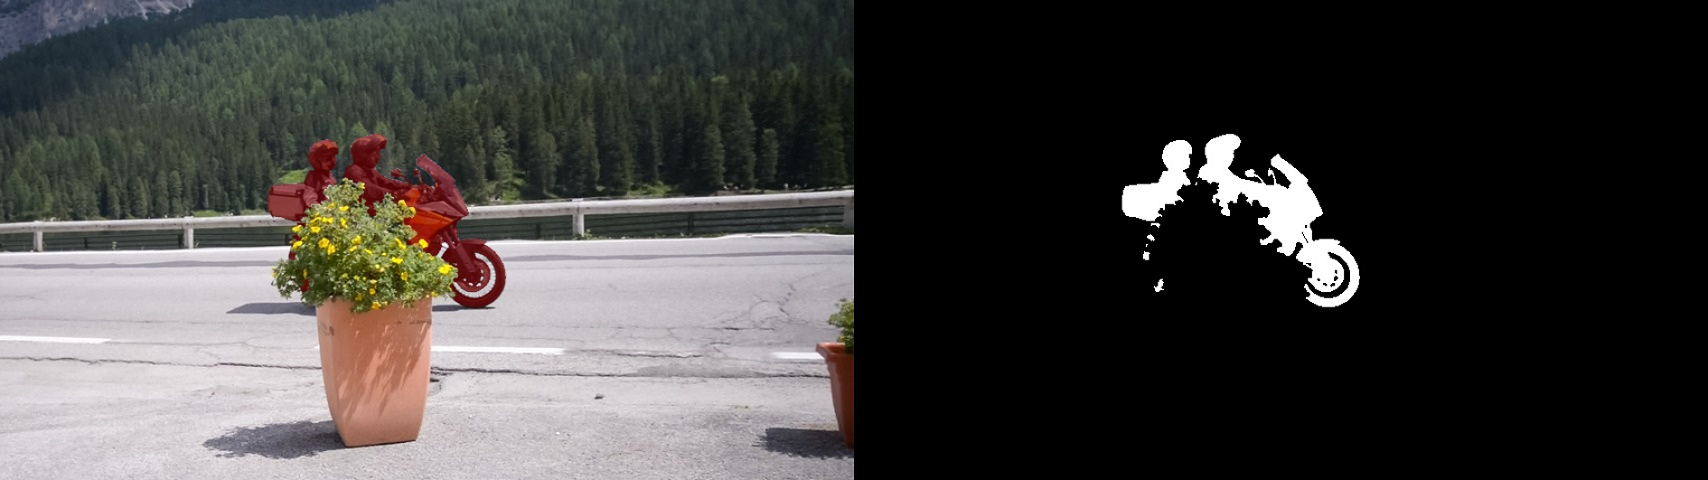
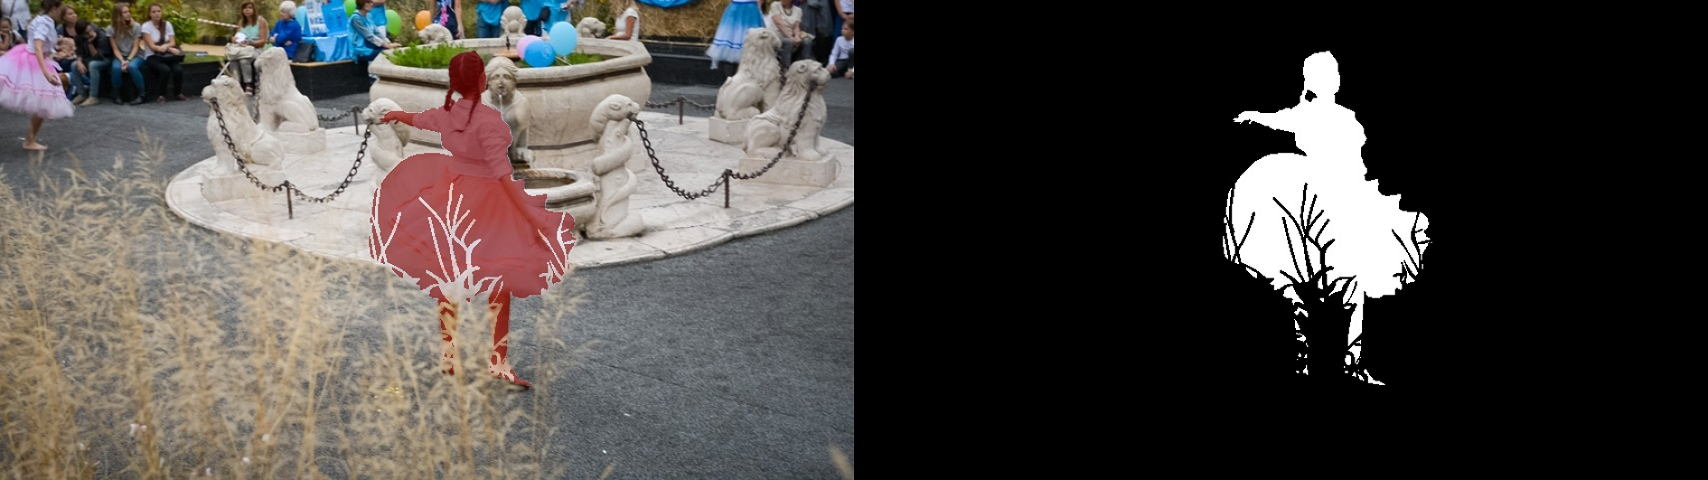
In this section, we discuss the limitations of our method and an interesting finding that emerged during the evaluation stage. As shown in the last row of Fig. 5, the segmentation result is not sufficient when the target is cluttered. Fortunately, local refinements [22, 47] coupled with post-processing optimizations [46] would enhance the accuracy. Given that SBD [13] contains some training samples with disconnected regions, we discover that the proposed iCMFormer even learns to adapt to the interactions for different instances of the same category (in Fig. 6). This finding can be further explored for more efficient interactive annotations in certain cases involving multiple instances.
5 Conclusion
In this paper, we propose a simple yet effective interactive segmentation method that leverages vision transformers. To explore the modality guidance between images and clicks for improving the accuracy of dense predictions, we raise cross-modality attentions by embedding them into both plain and hierarchical vision transformers, yielding high-quality and robust masks. The experiments demonstrate that our method achieves the best performances over four mainstream interactive segmentation datasets.
Appendix
In this supplementary document, we provide detailed explanation on the architecture of the proposed iCMFormer in Sec. A. Additional quantitative results in terms of the mIoU curves and number of failures are provided in Sec. B, together with an ablation study on the number of cross-modality blocks in Sec C. Moreover, we also provide more qualitative results evaluated on the 4 datasets in Sec. D.
Appendix A Implementation Details
In the main paper, we explain the overall pipeline of the proposed iCMFormer for 2 different backbones. For better readability and reproducibility, we present the architecture in detail. As the transformer technique is quite popular, we do not expand the multi-head attentions for each block, and only report the dimension as well as the number of corresponding heads. Our iCMFormer for ViT-B and Swin-B backbones are showsn in Tab. 6.
| Layer Name | Ours-ViT-B | Ours-Swin-B | ||
|---|---|---|---|---|
| Patch-Embed | (3, 768) | (3, 128) | ||
| Shared Group | [768, 2304] + (768, 3072, 768) | x6 | [128, 384] + (128, 512, 128) | x2 |
| [256, 768] + (256, 1024, 256) | x2 | |||
| Cross-Attention | [768, 2304] + [768, 2304] + (768, 3072, 768) | x3 | [512, 1536] + [512, 1536] + (512, 2048, 512) | x4 |
| Self-Attention | [768, 2304] + (768, 3072, 768) | x6 | [512, 1536] + (512, 2048, 512) | x18 |
| [1024, 3072] + (1024, 4096, 1024) | x2 | |||
| Neck | (768, 384, 192, 128) | - | ||
| (768, 384, 256) | ||||
| (768, 512) | ||||
| (768, 1536, 1024) | ||||
| Head | (128, 256) | (128, 256) | ||
| (256, 256) | (256, 256) | |||
| (512, 256) | (512, 256) | |||
| (1024, 256) | (1024, 256) | |||
| (2564, 256, 1) | (2564, 256, 1) | |||
Appendix B Additional Quantitative Results
In the main paper, we report the complete comparison results with respect to the Number of Clicks (NoC). Due to the limited space, here we further provide the evaluation results in terms of mean IoU curves and Number of Failures (NoF) to make the comparison consistent with the employed evaluation protocol.
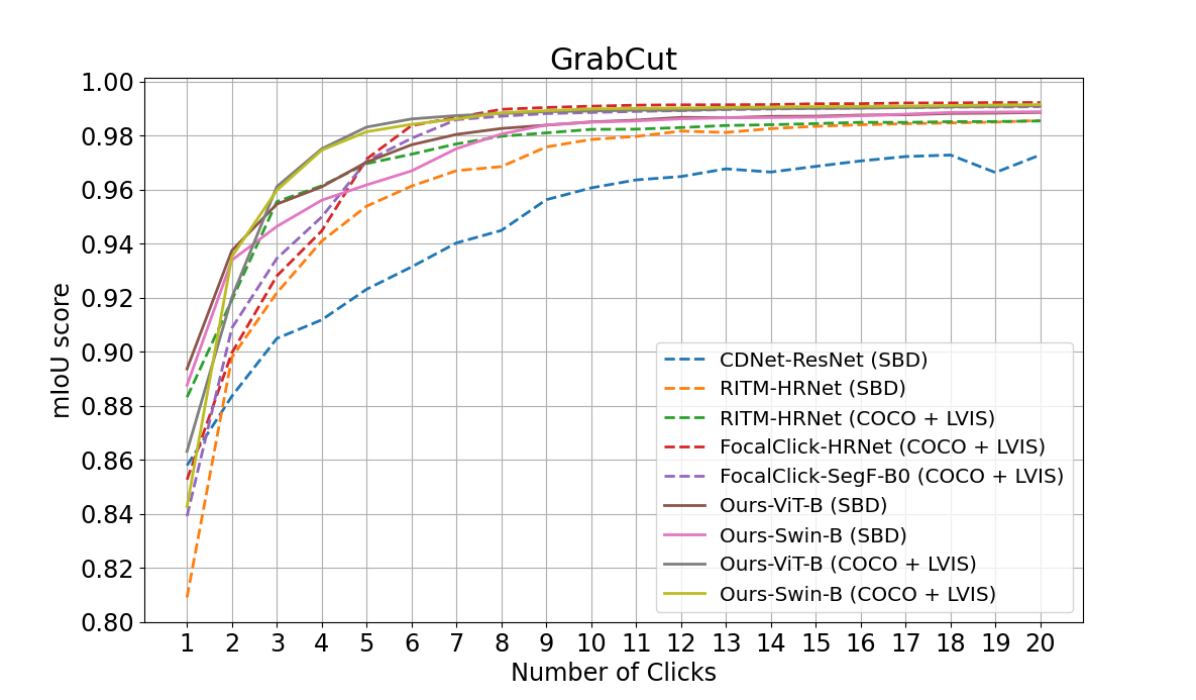
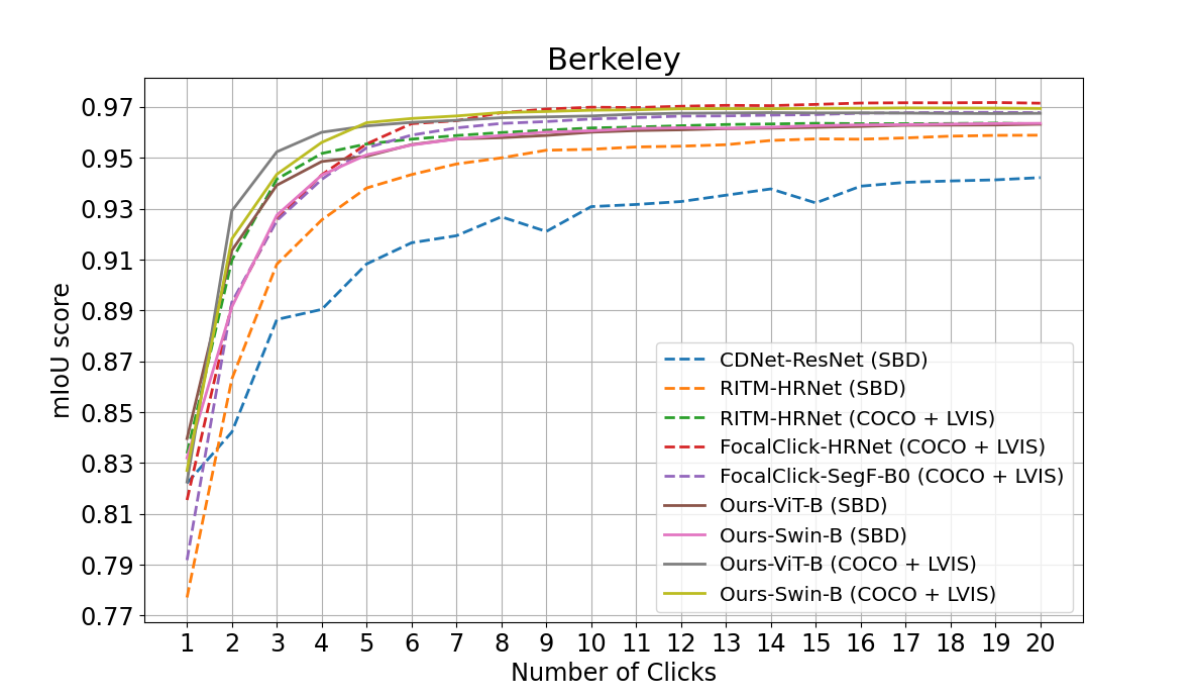
We report the automatically evaluation results on GrabCut [35] and Berkeley [31] in Fig. 7 for demonstrating the segmentation performance with progressively added clicks. We can see that the proposed methods achieve higher mIoU values within the same number of clicks compared with other models. However, restricted in the sizes of evaluation samples in GrabCut (50) and Berkeley (100), different variants of our methods do not make a huge difference especially when only providing 2 clicks (already above 90% mIoU).
In addition, we compared the stability of our method with that of others in Tab. 7 using 20 clicks for 2 thresholds: 85% and 90%. As the previous methods did not report the numbers for GrabCut and Berkeley, we do not add the values in the table (Ours-Swin-B only gets both 0 failure on GrabCut and 0, 1 failure on Berkeley for 85% and 90% IoU, respectively). The models trained in SBD [13] and COCO [21] + LVIS [12] are divided into 2 parts for fair comparison. As shown in the table, our method reduces the numbers of failure cases for both thresholds, which show the potential to be a practical annotation tool with robust predictions.
Appendix C Number of Cross-Modality Blocks
We further evaluate the impact of different number of the proposed cross-modality blocks on the performance of our backbones. Simply, we train all the models on SBD [13] and evaluate the results on 4 datasets with the NoC metric. Tab. 8 shows the corresponding results. As the number of layers increases, the trend of the number of clicks (NoC) shows an initial rise followed by a subsequent decline. Due to the better overall performance, we set 3 and 4 as the default numbers for ViT-B and Swin-B backbones, respectively.
Appendix D More Qualitative Results
We also provide more segmentation results of our iCMFormer on the 4 datasets. Fig. 8 shows the common cases from GrabCut [35] and Berkeley [31], and Fig. 9 represents common cases from SBD [13] and DAVIS [33]. As shown in Fig. 10, we display some challenging cases where it requires more than the average number of clicks to get the target IoU. We report the segmentation results in the middle stages until reaching 90% IoU. However, there still exist some bad cases due to the limitations of our method, and Fig. 11 shows 2 examples from DAVIS.
| Method | SBD | DAVIS | ||
| 20@85 | 20@90 | 20@85 | 20@90 | |
| BRS[15] | - | - | - | 77 |
| f-BRS[40] | - | 1466 | - | 78 |
| CDNet[5] | - | - | 46 | 65 |
| FocusCut[22] | - | - | - | 57 |
| Ours-ViT-B | 236 | 693 | 30 | 53 |
| Ours-Swin-B | 242 | 698 | 36 | 53 |
| RITM-HRNet-18[41] | - | - | 52 | 91 |
| FocalClick-HRNet-18[6] | - | - | 49 | 77 |
| FocalClick-SegF-B0-S2[6] | - | - | 50 | 86 |
| Ours-ViT-B | 225 | 695 | 20 | 49 |
| Ours-Swin-B | 237 | 667 | 20 | 48 |
| Method | Layer | Params/M | GrabCut | Berkeley | SBD | DAVIS | ||||
|---|---|---|---|---|---|---|---|---|---|---|
| NoC85 | NoC90 | NoC85 | NoC90 | NoC85 | NoC90 | NoC85 | NoC90 | |||
| Ours-ViT-B | 1 | 105.90 | 1.46 | 1.68 | 1.50 | 2.56 | 3.28 | 5.25 | 4.20 | 5.60 |
| Ours-ViT-B | 2 | 115.36 | 1.44 | 1.52 | 1.46 | 2.55 | 3.32 | 5.31 | 4.09 | 5.62 |
| Ours-ViT-B | 3 | 124.81 | 1.36 | 1.42 | 1.42 | 2.52 | 3.33 | 5.31 | 4.05 | 5.58 |
| Ours-ViT-B | 6 | 153.16 | 1.52 | 1.58 | 1.47 | 2.54 | 3.37 | 5.36 | 4.17 | 5.75 |
| Ours-ViT-B | 8 | 172.07 | 1.54 | 1.66 | 1.59 | 2.45 | 3.32 | 5.30 | 4.10 | 5.54 |
| Ours-Swin-B | 1 | 91.64 | 1.48 | 1.56 | 1.56 | 2.57 | 3.31 | 5.41 | 4.38 | 6.07 |
| Ours-Swin-B | 2 | 95.84 | 1.42 | 1.62 | 1.56 | 2.58 | 3.28 | 5.25 | 4.18 | 5.70 |
| Ours-Swin-B | 4 | 104.25 | 1.46 | 1.50 | 1.52 | 2.32 | 3.21 | 5.16 | 4.25 | 5.55 |
| Ours-Swin-B | 6 | 112.66 | 1.46 | 1.62 | 1.55 | 2.64 | 3.24 | 5.29 | 4.34 | 5.68 |
| Ours-Swin-B | 8 | 121.06 | 1.40 | 1.62 | 1.55 | 2.50 | 3.28 | 5.34 | 4.25 | 5.67 |


References
- [1] David Acuna, Huan Ling, Amlan Kar, and Sanja Fidler. Efficient interactive annotation of segmentation datasets with polygon-rnn++. In Proceedings of the IEEE Conference on Computer Vision and Pattern Recognition, pages 859–868, 2018.
- [2] Ejaz Ahmed, Scott Cohen, and Brian Price. Semantic object selection. In Proceedings of the IEEE Conference on Computer Vision and Pattern Recognition, pages 3150–3157, 2014.
- [3] Stanislaw Antol, Aishwarya Agrawal, Jiasen Lu, Margaret Mitchell, Dhruv Batra, C Lawrence Zitnick, and Devi Parikh. Vqa: Visual question answering. In Proceedings of the IEEE International Conference on Computer Vision, pages 2425–2433, 2015.
- [4] Muhammad Asad, Lucas Fidon, and Tom Vercauteren. Econet: Efficient convolutional online likelihood network for scribble-based interactive segmentation. In International Conference on Medical Imaging with Deep Learning, pages 35–47, 2022.
- [5] Xi Chen, Zhiyan Zhao, Feiwu Yu, Yilei Zhang, and Manni Duan. Conditional diffusion for interactive segmentation. In Proceedings of the IEEE International Conference on Computer Vision, pages 7345–7354, 2021.
- [6] Xi Chen, Zhiyan Zhao, Yilei Zhang, Manni Duan, Donglian Qi, and Hengshuang Zhao. Focalclick: towards practical interactive image segmentation. In Proceedings of the IEEE Conference on Computer Vision and Pattern Recognition, pages 1300–1309, 2022.
- [7] Xiangxiang Chu, Zhi Tian, Yuqing Wang, Bo Zhang, Haibing Ren, Xiaolin Wei, Huaxia Xia, and Chunhua Shen. Twins: Revisiting the design of spatial attention in vision transformers. Advances in Neural Information Processing Systems, pages 9355–9366, 2021.
- [8] Alexey Dosovitskiy, Lucas Beyer, Alexander Kolesnikov, Dirk Weissenborn, Xiaohua Zhai, Thomas Unterthiner, Mostafa Dehghani, Matthias Minderer, Georg Heigold, Sylvain Gelly, et al. An image is worth 16x16 words: Transformers for image recognition at scale. arXiv preprint arXiv:2010.11929, 2020.
- [9] Fei Du, Jianlong Yuan, Zhibin Wang, and Fan Wang. Efficient mask correction for click-based interactive image segmentation. In Proceedings of the IEEE/CVF Conference on Computer Vision and Pattern Recognition, pages 22773–22782, 2023.
- [10] Mark Everingham, Luc Van Gool, Christopher KI Williams, John Winn, and Andrew Zisserman. The pascal visual object classes (voc) challenge. International Journal of Computer Vision, 88:303–308, 2009.
- [11] Leo Grady. Random walks for image segmentation. IEEE Transactions on Pattern Analysis and Machine Intelligence, 28(11):1768–1783, 2006.
- [12] Agrim Gupta, Piotr Dollar, and Ross Girshick. Lvis: A dataset for large vocabulary instance segmentation. In Proceedings of the IEEE Conference on Computer Vision and Pattern Recognition, pages 5356–5364, 2019.
- [13] Bharath Hariharan, Pablo Arbeláez, Lubomir Bourdev, Subhransu Maji, and Jitendra Malik. Semantic contours from inverse detectors. In Proceedings of the IEEE International Conference on Computer Vision, pages 991–998, 2011.
- [14] Kaiming He, Xiangyu Zhang, Shaoqing Ren, and Jian Sun. Deep residual learning for image recognition. In Proceedings of the IEEE Conference on Computer Vision and Pattern Recognition, pages 770–778, 2016.
- [15] Won-Dong Jang and Chang-Su Kim. Interactive image segmentation via backpropagating refinement scheme. In Proceedings of the IEEE Conference on Computer Vision and Pattern Recognition, pages 5297–5306, 2019.
- [16] Cheng-Han Lee, Ziwei Liu, Lingyun Wu, and Ping Luo. Maskgan: Towards diverse and interactive facial image manipulation. In Proceedings of the IEEE Conference on Computer Vision and Pattern Recognition, pages 5549–5558, 2020.
- [17] Yanghao Li, Hanzi Mao, Ross Girshick, and Kaiming He. Exploring plain vision transformer backbones for object detection. In European Conference on Computer Vision, pages 280–296. Springer, 2022.
- [18] Yin Li, Jian Sun, Chi-Keung Tang, and Heung-Yeung Shum. Lazy snapping. ACM Transactions on Graphics (ToG), 23(3):303–308, 2004.
- [19] Zhuwen Li, Qifeng Chen, and Vladlen Koltun. Interactive image segmentation with latent diversity. In Proceedings of the IEEE Conference on Computer Vision and Pattern Recognition, pages 577–585, 2018.
- [20] JunHao Liew, Yunchao Wei, Wei Xiong, Sim-Heng Ong, and Jiashi Feng. Regional interactive image segmentation networks. In Proceedings of the IEEE International Conference on Computer Vision, pages 2746–2754, 2017.
- [21] Tsung-Yi Lin, Michael Maire, Serge Belongie, James Hays, Pietro Perona, Deva Ramanan, Piotr Dollár, and C Lawrence Zitnick. Microsoft coco: Common objects in context. In European Conference on Computer Vision, pages 740–755. Springer, 2014.
- [22] Zheng Lin, Zheng-Peng Duan, Zhao Zhang, Chun-Le Guo, and Ming-Ming Cheng. Focuscut: Diving into a focus view in interactive segmentation. In Proceedings of the IEEE Conference on Computer Vision and Pattern Recognition, pages 2637–2646, 2022.
- [23] Zheng Lin, Zhao Zhang, Lin-Zhuo Chen, Ming-Ming Cheng, and Shao-Ping Lu. Interactive image segmentation with first click attention. In Proceedings of the IEEE Conference on Computer Vision and Pattern Recognition, pages 13339–13348, 2020.
- [24] Qin Liu, Meng Zheng, Benjamin Planche, Srikrishna Karanam, Terrence Chen, Marc Niethammer, and Ziyan Wu. Pseudoclick: Interactive image segmentation with click imitation. In European Conference on Computer Vision, pages 728–745. Springer, 2022.
- [25] Shu Liu, Lu Qi, Haifang Qin, Jianping Shi, and Jiaya Jia. Path aggregation network for instance segmentation. In Proceedings of the IEEE Conference on Computer Vision and Pattern Recognition, pages 8759–8768, 2018.
- [26] Ze Liu, Yutong Lin, Yue Cao, Han Hu, Yixuan Wei, Zheng Zhang, Stephen Lin, and Baining Guo. Swin transformer: Hierarchical vision transformer using shifted windows. In Proceedings of the IEEE International Conference on Computer Vision, pages 10012–10022, 2021.
- [27] Jonathan Long, Evan Shelhamer, and Trevor Darrell. Fully convolutional networks for semantic segmentation. In Proceedings of the IEEE Conference on Computer Vision and Pattern Recognition, pages 3431–3440, 2015.
- [28] Sabarinath Mahadevan, Paul Voigtlaender, and Bastian Leibe. Iteratively trained interactive segmentation. arXiv preprint arXiv:1805.04398, 2018.
- [29] Soumajit Majumder and Angela Yao. Content-aware multi-level guidance for interactive instance segmentation. In Proceedings of the IEEE Conference on Computer Vision and Pattern Recognition, pages 11602–11611, 2019.
- [30] Kevis-Kokitsi Maninis, Sergi Caelles, Jordi Pont-Tuset, and Luc Van Gool. Deep extreme cut: From extreme points to object segmentation. In Proceedings of the IEEE Conference on Computer Vision and Pattern Recognition, pages 616–625, 2018.
- [31] David Martin, Charless Fowlkes, Doron Tal, and Jitendra Malik. A database of human segmented natural images and its application to evaluating segmentation algorithms and measuring ecological statistics. In Proceedings of the IEEE International Conference on Computer Vision, pages 416–423, 2001.
- [32] Jiquan Ngiam, Aditya Khosla, Mingyu Kim, Juhan Nam, Honglak Lee, and Andrew Y Ng. Multimodal deep learning. In Proceedings of the International Conference on Machine Learning, pages 689–696, 2011.
- [33] Federico Perazzi, Jordi Pont-Tuset, Brian McWilliams, Luc Van Gool, Markus Gross, and Alexander Sorkine-Hornung. A benchmark dataset and evaluation methodology for video object segmentation. In Proceedings of the IEEE Conference on Computer Vision and Pattern Recognition, pages 724–732, 2016.
- [34] Rui Qian, Divyansh Garg, Yan Wang, Yurong You, Serge Belongie, Bharath Hariharan, Mark Campbell, Kilian Q Weinberger, and Wei-Lun Chao. End-to-end pseudo-lidar for image-based 3d object detection. In Proceedings of the IEEE Conference on Computer Vision and Pattern Recognition, pages 5881–5890, 2020.
- [35] Carsten Rother, Vladimir Kolmogorov, and Andrew Blake. ”grabcut” interactive foreground extraction using iterated graph cuts. ACM Transactions on Graphics (TOG), 23(3):309–314, 2004.
- [36] Dinggang Shen, Guorong Wu, and Heung-Il Suk. Deep learning in medical image analysis. Annual Review of Biomedical Engineering, 19:221–248, 2017.
- [37] Mennatullah Siam, Mostafa Gamal, Moemen Abdel-Razek, Senthil Yogamani, Martin Jagersand, and Hong Zhang. A comparative study of real-time semantic segmentation for autonomous driving. In Proceedings of the IEEE Conference on Computer Vision and Pattern Recognition Workshops, pages 587–597, 2018.
- [38] Karen Simonyan and Andrew Zisserman. Very deep convolutional networks for large-scale image recognition. arXiv preprint arXiv:1409.1556, 2014.
- [39] Konstantin Sofiiuk, Olga Barinova, and Anton Konushin. Adaptis: Adaptive instance selection network. In Proceedings of the IEEE International Conference on Computer Vision, pages 7355–7363, 2019.
- [40] Konstantin Sofiiuk, Ilia Petrov, Olga Barinova, and Anton Konushin. f-brs: Rethinking backpropagating refinement for interactive segmentation. In Proceedings of the IEEE Conference on Computer Vision and Pattern Recognition, pages 8623–8632, 2020.
- [41] Konstantin Sofiiuk, Ilya A Petrov, and Anton Konushin. Reviving iterative training with mask guidance for interactive segmentation. In IEEE International Conference on Image Processing (ICIP), pages 3141–3145, 2022.
- [42] Ashish Vaswani, Noam Shazeer, Niki Parmar, Jakob Uszkoreit, Llion Jones, Aidan N Gomez, Łukasz Kaiser, and Illia Polosukhin. Attention is all you need. Advances in Neural Information Processing Systems, 30, 2017.
- [43] Wenhai Wang, Enze Xie, Xiang Li, Deng-Ping Fan, Kaitao Song, Ding Liang, Tong Lu, Ping Luo, and Ling Shao. Pyramid vision transformer: A versatile backbone for dense prediction without convolutions. In Proceedings of the IEEE International Conference on Computer Vision, pages 568–578, 2021.
- [44] Qiaoqiao Wei, Hui Zhang, and Jun-Hai Yong. Focused and collaborative feedback integration for interactive image segmentation. In Proceedings of the IEEE/CVF Conference on Computer Vision and Pattern Recognition, pages 18643–18652, 2023.
- [45] Enze Xie, Wenhai Wang, Zhiding Yu, Anima Anandkumar, Jose M Alvarez, and Ping Luo. Segformer: Simple and efficient design for semantic segmentation with transformers. Advances in Neural Information Processing Systems, pages 12077–12090, 2021.
- [46] Ning Xu, Brian Price, Scott Cohen, Jimei Yang, and Thomas Huang. Deep grabcut for object selection. arXiv preprint arXiv:1707.00243, 2017.
- [47] Ning Xu, Brian Price, Scott Cohen, Jimei Yang, and Thomas S Huang. Deep interactive object selection. In Proceedings of the IEEE Conference on Computer Vision and Pattern Recognition, pages 373–381, 2016.
- [48] Zhou Yu, Jun Yu, Yuhao Cui, Dacheng Tao, and Qi Tian. Deep modular co-attention networks for visual question answering. In Proceedings of the IEEE Conference on Computer Vision and Pattern Recognition, pages 6281–6290, 2019.
- [49] Yuhui Yuan, Rao Fu, Lang Huang, Weihong Lin, Chao Zhang, Xilin Chen, and Jingdong Wang. Hrformer: High-resolution vision transformer for dense predict. Advances in Neural Information Processing Systems, pages 7281–7293, 2021.
- [50] Zhihao Yuan, Xu Yan, Yinghong Liao, Yao Guo, Guanbin Li, Shuguang Cui, and Zhen Li. X-trans2cap: Cross-modal knowledge transfer using transformer for 3d dense captioning. In Proceedings of the IEEE Conference on Computer Vision and Pattern Recognition, pages 8563–8573, 2022.
- [51] Luowei Zhou, Hamid Palangi, Lei Zhang, Houdong Hu, Jason Corso, and Jianfeng Gao. Unified vision-language pre-training for image captioning and vqa. In Proceedings of the AAAI Conference on Artificial Intelligence, volume 34, pages 13041–13049, 2020.
- [52] Minghao Zhou, Hong Wang, Qian Zhao, Yuexiang Li, Yawen Huang, Deyu Meng, and Yefeng Zheng. Interactive segmentation as gaussion process classification. In Proceedings of the IEEE/CVF Conference on Computer Vision and Pattern Recognition, pages 19488–19497, 2023.