Chimera states in neural networks and power systems
Abstract
Partial, frustrated synchronization and chimera states are expected to occur in Kuramoto-like models if the spectral dimension of the underlying graph is low: . We provide numerical evidence that this really happens in case of the high-voltage power grid of Europe () and in case of the largest, exactly known brain network corresponding to the fruit-fly (FF) connectome (), even though their graph dimensions are much higher, i.e.: and , . We provide local synchronization results of the first- and second-order (Shinomoto) Kuramoto models by numerical solutions on the the FF and the European power-grid graphs, respectively, and show the emergence of chimera-like patterns on the graph community level as well as by the local order parameters.
We show that Kuramoto oscillator models on large neural connectome graph of the fruit-fly, a human brain, as well as on the power-grid of Europe produce chimera states. This is in agreement with the low spectral dimensions that we calculated by the eigenvalue spectra of the Laplacian of these networks. We compare these results with the topological dimension measurements and previous simulations, strengthening that frustrated synchronization should occur, which can generate slow relaxations, obtained in previous studies within the neighborhood of the synchronization transition point.
I Introduction
Synchronization phenomena are very widespread in nature and the understanding of their behavior is in the focus of interest. In neural systems, like the brain oscillatory behavior of building elements has been measured by different techniques, while in case of power grids, the alternating currents can also be described by coupled oscillators. Both systems are expected to operate close to the synchronization transition point. In case of the normal brain, self-tuning to the critical point is hypothesed Chialvo and Bak (1999) and confirmed by experiments Beggs and Plenz (2003) and theoretical considerations Muñoz (2018). The advantage of criticality is the optimal computational performance, sensitivity as well as dynamically generated long-range memory and interactions Larremore, Shew, and Restrepo (2011). In case of power grids the competition of supply and demands tune the system close to the synchronization transition point Carreras et al. (2004).
Synchronization models described by the first Kuramoto equation Kuramoto (2012) have recently been investigated on complex networks and partial synchronization was found if the spectral dimension is below even if generalizations of the Euclidean dimension, the graph and the Hausdorff dimension are high or diverge Millán, Torres, and Bianconi (2019). Partial synchronization is more probable in strongly connected modules or communities, which also happens both in biological and technical structures. Modular and most often hierarchical organization is known in general brain networks Sporns (2010), among others in case of the fruit-fly (FF) connectome Scheffer and Meinertzhagen (2019); Ódor, Deco, and Kelling (2022), as well as in power grids Ódor and Hartmann (2018). Thus synchronization occurs in the strongly coupled modules first, while in the loosely coupled parts, nodes may remain desynchronized for the same conditions, which was called frustrated synchronization Villegas, Moretti, and Muñoz (2014), reminiscent of the semi-critical Griffiths Phases (GP) of condensed matters Griffiths (1969). Besides, in these phenomena, fluctuations of the global order parameters diverge in an extended control parameter space. Recently this was shown in case of Kuramoto models on brain connectomes Villegas, Moretti, and Muñoz (2014); Ódor and Kelling (2019); Ódor, Kelling, and Deco (2021); Ódor, Deco, and Kelling (2022); Ódor et al. (2023) as well as in case of power-grids Ódor and Hartmann (2018, 2020); Ódor et al. (2022).
One can also relate such structures, emerging in these heterogeneous systems, to chimera states, in which subsets of an ensemble of identical, interacting oscillators exhibit distinct dynamical states, such as one group of synchronized oscillators and one group of desynchronized oscillators Abrams and Strogatz (2004). Firstly chimeras were defined in systems of identical oscillators Abrams and Strogatz (2004); Abrams et al. (2008). In such a case, a non-zero phase lag term is essential for partial synchronization to occur. Realistic models, however, require oscillators to be heterogeneous and chimeras have been detected on complex Schöll (2016); Zakharova (2021), brain-like networks Chouzouris et al. (2018). The purpose of the present study is to provide numerical evidences of such structures by solving Kuramoto equations in seemingly different areas of complex systems, on the largest available brain connectome and on the European high voltage power-grid network. We show they are characterized by a low spectral dimension: . In these models quenched heterogeneity is present structurally, by the topology of the graphs as well as by the different self-frequencies of nodes.
II Methods
In this section, we detail the models and the methods we applied to describe synchronization on different networks.
II.1 The first-order Kuramoto model
Several oscillator models have been used in biology, the simplest possible one is the Hopf model Freyer et al. (2011), which has been used frequently in neuroscience, as it can describe a critical point with scale-free avalanches, with sharpened frequency response and enhanced input sensitivity. The local dynamics of each brain area (node) is described by the normal form of a supercritical Hopf bifurcation, also called a Landau-Stuart oscillator, which is the canonical model for studying the transition from noisy to oscillatory dynamics.
Another complex model, describing more non-linearity111 In the weak coupling limit an equivalence with the integrate-and-fire models Politi and Rosenblum (2015) was shown. is the Kuramoto model Kuramoto (2012); Acebrón et al. (2005), with phases , located at the nodes of a network, according to the dynamical equation
| (1) |
The global coupling is the control parameter of this model, by which we can tune the system between asynchronous and synchronous states. The summation is performed over the nearest neighboring nodes, with connections described by the weighted/unweighted adjacency matrix and denotes the intrinsic frequency of the -th oscillator. For simplicity, we used the Gaussian distribution with zero mean and unit variance for the self-frequency distribution with respect to a rotating frame Ódor and Kelling (2019). Using this model the resting state critical behavior on large human connectomes Ódor and Kelling (2019); Ódor, Kelling, and Deco (2021) was compared with that of the FF Ódor, Deco, and Kelling (2022) on the global order parameter level and the topology dependence has been pointed out, which suggested extended fluctuation region and GP-like behavior in case of the human connectomes in contrast with the FF network.
Very recently we have also investigated an extension of Eq. (1) to the Shinomoto–Kuramoto (SK) model, with periodically driven forces Sakaguchi (1988) to describe task phase of the brain models Ódor et al. (2023)
Here describes an excitation, with a zero centered, Gaussian random annealed noise and a site-dependent periodic force term, proportional to a coupling , was also added. But in fact, a small proved to be irrelevant, for the synchronization transition, caused by , in the presence of the chaotic noise. One of the main conclusions of Ref. Ódor et al. (2023) was that community dependent values of the Hurst exponent and the exponent, measuring self-similarity of time series, varied more with , than in the resting state of the brain, corresponding to . Now we shall test this community dependence of and in the steady state.
II.2 The second-order Kuramoto model
The time evolution of power-grid synchronization is described by the swing equations Grainger and Stevenson (1994), set up for mechanical elements (e.g. rotors in generators and motors) with inertia. It is formally equivalent to the second-order Kuramoto equation Filatrella, Nielsen, and Pedersen (2008), for a network of oscillators with phases :
| (3) | |||||
Here is the damping parameter, which describes the power dissipation, or an instantaneous feedback Ódor and Hartmann (2020), is the global coupling, related to the maximum transmitted power between nodes; and , which is the adjacency matrix of the network, contains admittance elements. The quenched external drive, denoted by , which is proportional to the self-frequency of the -th oscillator and carries a dimension of inverse squared time , describes the power in/out of a given node when Eq. (3) is considered to be the swing equation of a coupled AC circuit, but here, similar to the first-order Kuramoto model, we have chosen it zero centered Gaussian random variable as rescaling invariance of the equation allows to transform it out within a rotating frame. For simplicity, one can assume that is drawn from the same distribution as and numerically set , amounting to taking =1. In our present study the following parameter settings were used: the dissipation factor , is chosen to be equal to to meet expectations for power grids, with the inverse time physical dimension assumption.
To characterize the phase transition properties the phase order parameter has been studied for both the first- and second-order Kuramoto models. To ensure the relaxation to the steady states, we measured the Kuramoto phase order parameter
| (4) |
where gauges the overall coherence and is the average phase at discrete sampling times , which was chosen to follow an exponential growth: to spare memory space. The calculation of derivatives was done adaptively at small time steps via the Bulirsch-Stoer stepper Ahnert and Mulansky (2012). The sets of equations (1), (II.1) and (3) were solved numerically for independent initial conditions in Ódor et al. (2022), initialized by different -s and different -s if disordered initial phases were invoked. Then sample averages for the phases and the frequencies give rise to the Kuramoto order parameter
| (5) |
and the variance of the frequencies
| (6) |
We don’t discuss the time-dependent behavior of the global order parameters as this has been investigated in detail in Ódor et al. (2022); Ódor and Deng (2023). In the steady state, which we determined by visual inspection of and , we measured their half values and the standard deviations and in order to locate the transition points. In the paper we used the , values, obtained by sample and time averages in the steady state.
II.3 Topological and spectral dimensions
The effective graph (topological) dimension is defined by
| (7) |
where we counted the number of nodes with chemical distance or less from randomly selected seeds and calculated averages over many trials Shanker (2007); Deng et al. (2015). In most cases, as obtained from this cluster growing method can be served as an estimation for the more rigorously defined Hausdorff dimension Feder (1988). In Ref. Ódor, Deco, and Kelling (2022) the graph dimension of the FF was estimated to be , while in Ódor et al. (2022) we provided a value for the unweighted European power-grid .
For regular Euclidean lattices, it has been shown that a true transition to global synchronization under the thermodynamics limit is only possible for in both the first- and the second-order Kuramoto models Hong, Park, and Choi (2005); Ódor and Deng (2023), while for , there is only a crossover from the asynchronous phase to a partial synchronous phase characterized by an increasingly broadened variance of and a shifting crossover point as the system size increases Millán, Torres, and Bianconi (2018); Ódor and Deng (2023). The natural question is then if it is the topological dimension defined in Eq. (7), or equivalently the Hausdorff dimension , that dictates the synchronization properties for general networks which may assume non-integer dimensions. Refs. Millán, Torres, and Bianconi (2018, 2019) suggested that the synchronization properties of a general network should be related to the spectral dimension derived from the eigenvalue spectrum of the graph Laplacian matrix, and even more so for the so-called complex network manifolds studied therein, which are constructed out of finite-dimensional simplicies but are characterized by an infinite Hausdorff dimension due to their small-world properties Song, Havlin, and Makse (2005); Millán, Torres, and Bianconi (2018).
Graph spectral properties of complex networks have been shown to be particularly relevant to the structures of networks Chung (1997). Following Refs. Millán, Torres, and Bianconi (2018, 2019), we adopt the normalized Laplacian with elements
| (8) |
for unweighted networks, where denotes the degree of node . Similarly, for weighted networks, the elements of the normalized Laplacian are given by
| (9) |
where denotes the weighted in-degree of node . The normalized Laplacian has real eigenvalues , the density of which scales as Burioni and Cassi (1996); Millán, Torres, and Bianconi (2018)
| (10) |
for , where is the spectral dimension. The cumulative density is then given by
| (11) |
Since Eqs. (10) and (11) hold for small values, for the fruit-fly connectome and the European high-voltage power grid network that are going to be studied in Sec. III, with which , we will only extract the densities for the first 200 smallest eigenvalues for ease of eigenvalue computation without loss of generality.
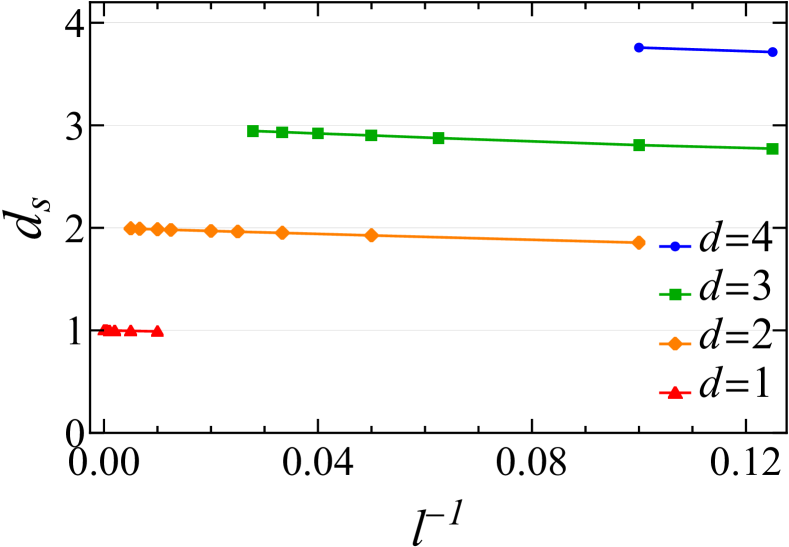
As illustrated in Fig. 1, Euclidean lattices in dimension have spectral dimension . Therefore in this case the spectral dimension is also equal to the Hausdorff dimension of the lattice, . However, in general, networks can have non-integer spectral dimension not equal to their Hausdorff dimension. Ref. Millán, Torres, and Bianconi (2018) demonstrated that in lower spectral dimensions , there is a parameter regime that exhibits frustrated synchronization with spatio-temporal fluctuations even in the stationary state. Then, similar to the emergence of rare regions in Griffiths phases Griffiths (1969), one should expect to observe states with rare regions–usually called “chimera states”–in such frustrated synchronization as well, as we will demonstrate in what follows with the aid of the local order parameter of Kuramoto models.
II.4 Local order parameters of the first- and second-order Kuramoto models
To investigate the heterogeneity further, we measured the local Kuramoto order parameter, defined as the partial sum of phases for the neighbors of node
| (12) |
This local Kuramoto measure was firstly suggested by Restrepo et al. Restrepo, Ott, and Hunt (2005); Schröder, Timme, and Witthaut (2017) to quantify the local synchronization of nodes, which allows us to visualize regions of synchronized/unsynchronized chimera-like behavior and which will be the main quantity of interest of this paper.
III Chimera states
III.1 Chimera states in the fruit-fly (FF) and in a human connectome
First, we examine chimera states in the first-order Kuramoto model on the FF connectome. Connectomes are defined as structural networks of neural connections of the brain Sporns (2010). For the fruit fly, we used the hemibrain dataset (v1.0.1) from dow (2020), which has nodes and edges, out of which the largest single connected component contains and directed and weighted edges, with weights being the number of connections between a pair of nodes. The number of incoming edges varies between and . The weights are integer numbers, varying between and . The average node degree is (for the in-degrees it is: ), while the average weighted degree is . The adjacency matrix, visualized in Ódor, Deco, and Kelling (2022), shows a weak hierarchical modular structure, however, it is not random. For example, the degree distribution is much wider than that of a random graph and exhibits a fat tail. The analysis in Ódor, Deco, and Kelling (2022) found a weight distribution with a heavy tail, and assuming a power-law (PL) form, a decay exponent could be fitted for the region. The modularity quotient of a network is defined by Newman (2006)
| (13) |
The maximum of this value corresponds to the optimal community structure characterizes how modular a network is, where is when nodes and were found to be in the same community , or otherwise. Community detection algorithms based on modularity optimization get the closest to the actual modular properties of the network. The modularity was calculated using community structures detected by the Louvain method Blondel et al. (2008), from which we obtained Ódor et al. (2023). The effective graph (topological) dimension, obtained by the breadth-first search algorithm is .
| Fruit-fly conn. | European grid | |
|---|---|---|
| 5.4(1) Ódor, Deco, and Kelling (2022) | 2.6(1) Ódor et al. (2022) | |
| (unwei.) | 3.375 | 1.717 |
| (wei.) | 2.342 | 1.507 |
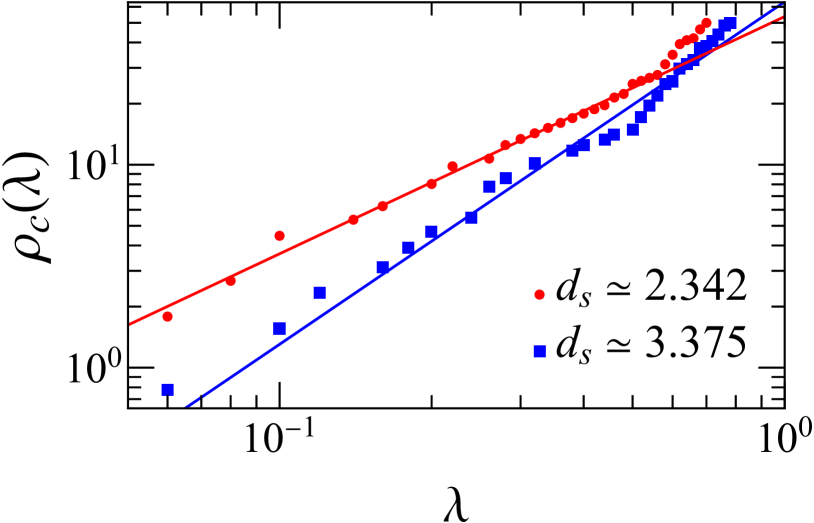
To compute the spectra dimensions, we extracted the cumulative density distributions of the first 200 eigenvalues of both the Laplacian matrices of the unweighted and weighted FF connectomes and plot them in a log-log scale as shown in Fig. 2. For small enough values, the distributions indeed display a scaling regime, permitting estimation of spectral dimensions by Eq. (11), as listed in the plot legend and Table 1. Now, even though , since , one should expect frustrated synchronization in some parameter regime where chimera states may be observed.
 |
 |
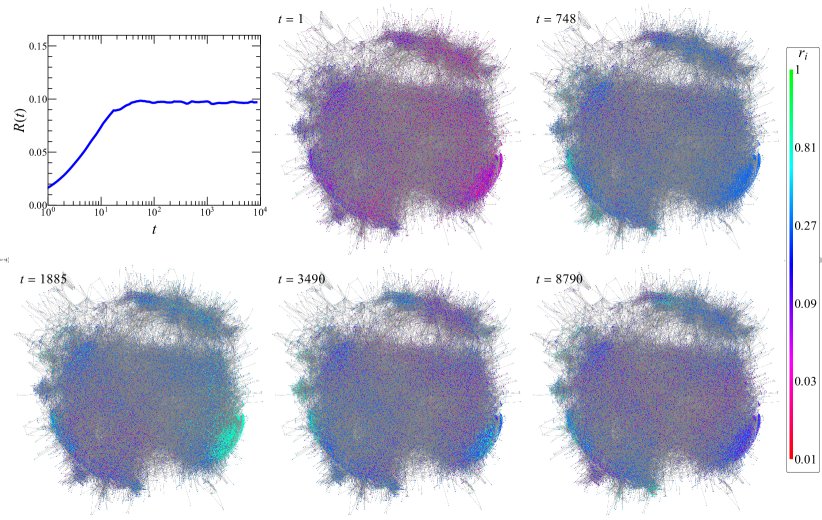
To that end, we solved Eq. (1) and Eq. (II.1) numerically with respect to different coupling strengths and on the weighted FF connectome and observed the respective global phase order parameter in the stationary state. The stationary state is typically reached after a few hundred time steps; see, for example, the first panel of Fig. 3. Practically, we followed the dynamics up to to ensure stationarity. In Ref. Ódor, Deco, and Kelling (2022), we had estimated the critical coupling from the peak of the variance of with respect to . By using this critical coupling, we further calculated the local order parameter Eq. (12) for each node, averaged over 20 independent simulation runs. In Fig. 3, the local order parameters for three representative time steps are displayed by encoding the respective values to a color map. Since the simulations were started from a fully asynchronous state, we see that the system gradually evolves into a more synchronous state at larger times. However, even in the globally stationary state characterized by a constant value, the local order parameters show rather inhomogeneous patterns, with some parts of the connectome are more synchronized (greener regions) while some other parts are less synchronized (redder regions), indicating the emergence of chimera states Restrepo, Ott, and Hunt (2005); Schröder, Timme, and Witthaut (2017). Note the disparity of the synchronization levels between different regions is quite large in this case, with greener regions almost fully synchronized and red regions fully unsynchronized. What is more, as partially shown by the second and the third panels at and , the distribution of the local order parameters can still evolve in the globally stationary state. Simulation results seemed to suggest quite random temporal behavior for the local order parameters (not shown here), but more careful studies for the long-time behavior are still needed to examine if it is periodic with a very long period. These results are thus suggestive of strong spatio-temporal fluctuations in chimera states, as it is typical for frustrated synchronization Millán, Torres, and Bianconi (2018).
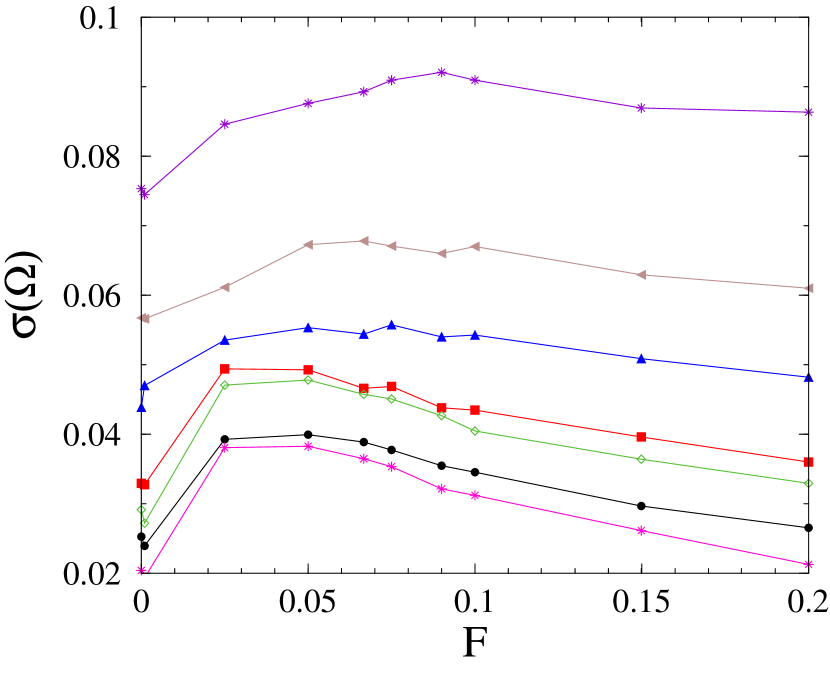
To provide more evidence of the Chimera states, we have calculated the order parameters in the steady state at in the nine largest communities, determined by the Louvain method Ódor et al. (2023). However, the community dependence is rather weak in case of the Kuramoto model. So we enhanced the local synchronization by adding periodic forces within the framework of the SK model. The transition point shifts in the range . Even more evident community dependence could be found in the frequency synchronization points estimated by the peaks of the variances of the order parameter . As one can see in Fig. 6, frequency entrainment occurs in the range in different communities. That means that for certain forces some communities are in the super-, while others are in the sub-critical states locally, suggesting Chimeras.
As it has already been shown in Refs. Ódor, Deco, and Kelling (2022); Ódor et al. (2023) the FF graph exhibits a weak modular structure. Much higher level of modularity can be observed in human connectomes, albeit on a coarse grained scale, describing the white matter. The large human connectomes obtained by DTI of MRI Gray Roncal et al. (2013); Gastner and Ódor (2016); Ódor, Deco, and Kelling (2022); Ódor et al. (2023) has node numbers of order of a million. We have not been able to calculate the local order parameters and the spectral dimensions for such large systems. In Gastner and Ódor (2016) we calculated their graph dimensions, which proved to be above 3 of the embedding space, but lower than 4, due to the long fiber tracts, connecting distant regions. We show here, that synchronization of communities of the KKI-113 graph exhibits much more visible differences than that of the FF, suggesting strong Chimeras in case of the Kuramoto model running on them. This small-world graph contains nodes, connected via undirected and weighted edges and exhibit a hierarchical modular structure, because it was constructed from cerebral regions of the Desikan–Killany–Tourville parcellations, which is standard in neuroimaging Desikan et al. (2006). The modularity quotient is much higher, than that of the FF: and the topological dimension is just Ódor et al. (2023).
As one can see on Fig. 7 in certain communities the synchronization is high at , while others are still practically unsynchronized at this coupling, suggesting Chimera states.
III.2 Chimera states in the European high-voltage power grid network
Unlike neural networks on which the oscillators are massless a power-grid network are massive and should be described by the second-order Kuramoto model. In this subsection, we attempt to show if chimera states can emerge in such systems. Power-grid networks are genuinely hierarchical modular networks if the detailed information for the medium- and low-voltage parts of the grids are also incorporated. Practically, it is almost impossible to infer the entire structure of large power-grid networks, but it is feasible to mimic it by adding medium- and low-voltage parts to the high-voltage (HV) skeleton, according to the empirical hierarchical distribution, as it was done in Ref. Ódor and Hartmann (2018) We downloaded the European HV power grid from the “SciGRID Dataset” EUg (2016) encoding the 2016 status, deduced via processing google street-map. We have not supplemented this graph with lower-voltage parts, but it already contains kV, kV, … links, which belong to the middle-voltage category, according to the definition of the kV threshold for HV lines.
This graph contains nodes, interconnected via links. After symmetrizing it, an average degree was obtained. In Fig. 1 of Ref. Ódor et al. (2022) the degree distribution is shown. The tail of the degree distribution for could be well fitted by a stretched exponential function, which renders this network at the threshold of robust/fragile: , as according to the definition in Rosas Casals and Corominas Murtra (2009), networks with a cumulative degree distribution and are robust, based on a mean-field percolation theory under random node removals. The adjacency matrix, visualized on Fig. 2 of Ref. Ódor et al. (2022) proves that this is a highly modular graph, characterized by . Furthermore, it is a small-world network according to the definition of the small-worldness coefficient Humphries and Gurney (2008); Ódor et al. (2022). By calculating the graph dimension using the breadth-first search algorithm as shown in the inset of Fig. 3 of Ref. Ódor et al. (2022), was obtained. Since the coupling between a pair of nodes of a power grid is proportional to the maximal power transmitted between them and inverse to the imaginary part of the impedance of the transmission line, weights computed from the normalized values of had also been considered to construct the weighted network.
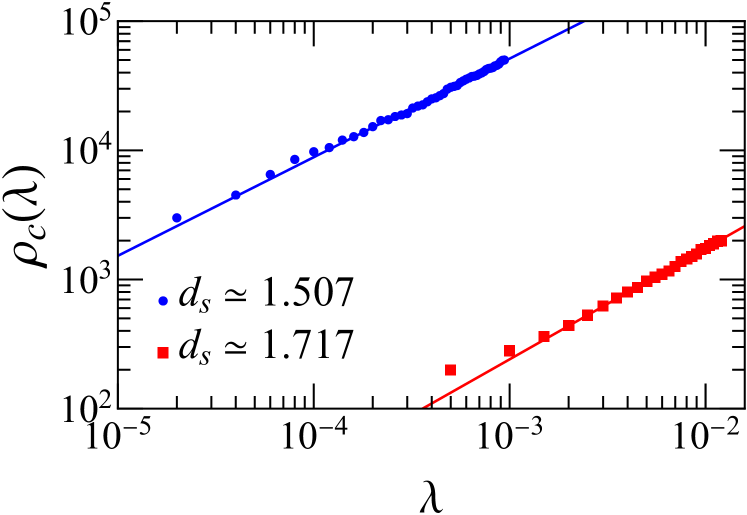
By again extracting the cumulative density distributions of the first 200 eigenvalues of both the Laplacian matrices of the unweighted and weighted European power-grid networks, Fig. 4 shows quite clean power laws. As listed in the plot legend and Table 1, the estimated spectral dimensions are both well below the critical dimension . Hence, one can again expect to observe chimera states, although instead, the second-order Kuramoto model (3) is going to be inspected in this case.
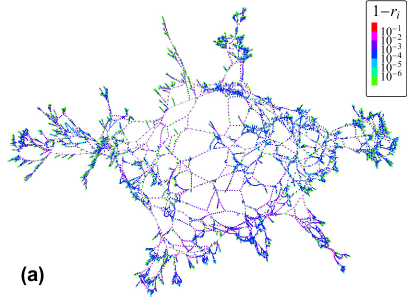
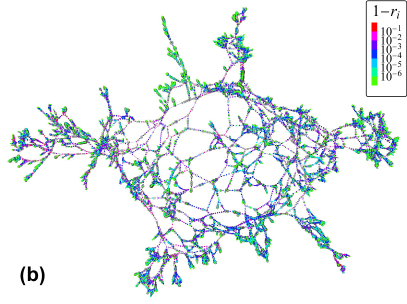
We again tune the system to the verge of criticality. By solving Eq. (3) to obtain the peak of the variance of , the critical couplings had been estimated to for the unweighted network Ódor et al. (2022) and for the weighted network. The stationary states are typically reached after a few hundred time steps (see Ref. Ódor et al. (2022)), but we solved them up to to ensure the stationarity of the system. The local order parameters, calculated in the stationary states after averaging over 100 samples, are then obtained with respect to these critical couplings. Fig. 5 shows that inhomogeneous patterns, encoded again in a color map, indeed overwhelm the system. Due to the higher levels of synchronization, there are quite some proportions of oscillators with their local order parameters relatively closer to 1 as compared to the FF connectome case. Hence the color map shows the quantity instead. Since the differences in the local parameters in greener regions and redder regions are still quite apparent, we see that as suggested by the low spectral dimension, chimera states indeed can be observed in this case. Note that even though the weighted network is a bit less synchronous globally at [] than the unweighted network at [], the weighted network still seems to be more synchronized locally in many parts of the network. This emphasizes the importance of incorporating edge weights to take into account more realistic couplings between the nodes.
Comparing the local order parameter patterns in Fig. 3 and Fig. 5, it is also interesting to note that less synchronous regions are typically also less clustered as compared to regions with higher levels of synchronization. This is in some sense in reminiscence of the analysis in Ref. Villegas, Moretti, and Muñoz (2014), in which it had been shown that chimera states can also be characterized by the order parameters of different moduli.
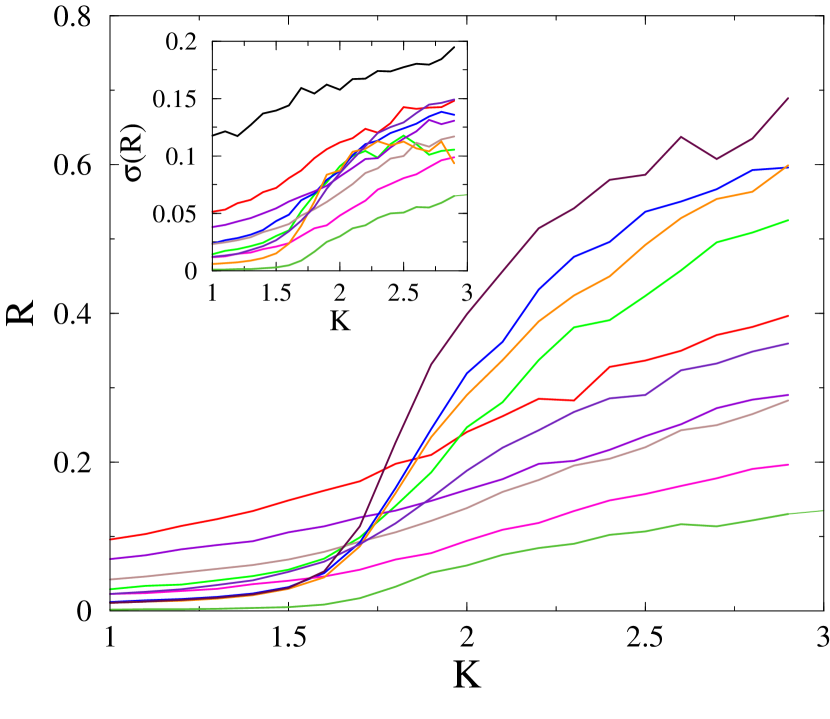
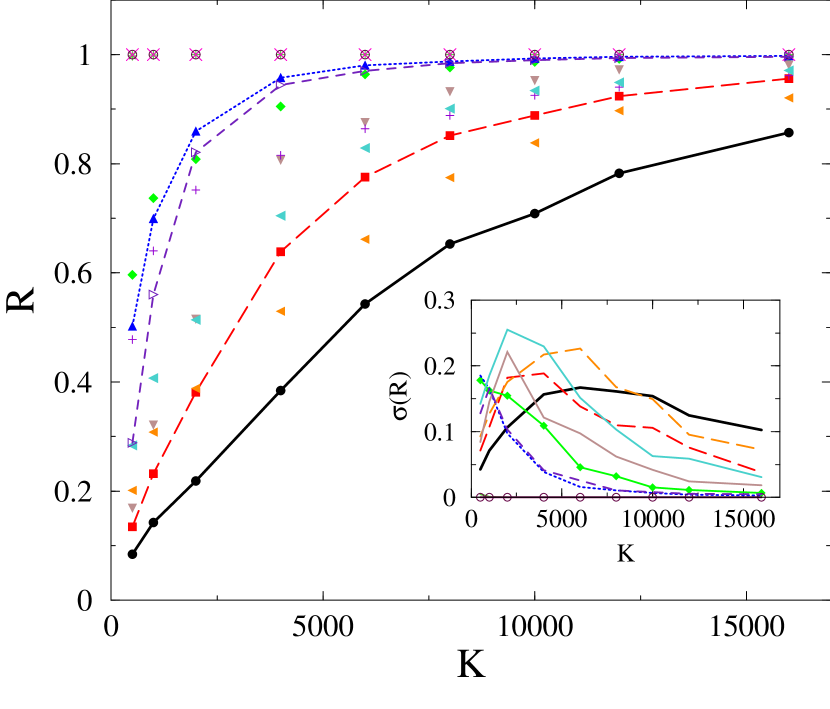
To provide more evidence of the Chimera states, we have also calculated the steady-state in the twelve largest communities, determined via the Louvain method with a modularity score close to the maximum , in the same way as in case of the FF Hartmann and et. al. (2023). As one can see in Fig.8, synchronization occurs at different couplings in different communities, such that for small -s the small communities are fully ordered, while the larger ones are still desynchronized. This is related to the size dependence of in case of crossover, however here the the communities are not independent. Note, that the fully ordered communities have less than 100 nodes.
IV Summary
In this paper, we have demonstrated that chimera states can occur in Kuramoto-type models on large networks if the spectral dimension is low, i.e. , even if the graph dimension is not necessarily like that. That happened in case of the graph of the FF connectome, which exhibits . This is in agreement with the hypothesis, advanced for the first-order Kuramoto model in Millán, Torres, and Bianconi (2019). But as modularity is weak for FF, so do the Chimeras. We can show them by a community-level analysis with an applied periodic external field. In contrast, for a large human connectome possessing high modularity, we show strong community dependence of the local synchronization.
Power grids can be described by the second-order Kuramoto model, which possesses inertia. We found that the European HV power grid has a graph dimension , but the spectral dimensions seem to be below . Still, the occurrence of chimera-like patterns can be observed via order parameters and confirmed by a community-level synchronization study. We demonstrated the level of local synchronization by showing the local Kuramoto order parameter, but similar results have been found by calculating the local frequency spreads.
Acknowledgements.
We thank Kristóf Benedek and Bálint Hartmann for providing weight calculations of the European network, István Papp for exploring the communities, Jeffrey Kelling for developing the GPU solver code, and Róbert Juhász for the helpful discussions. This research was funded by ELKH grant SA-44/2021, and the Hungarian National Research, Development, and Innovation Office NKFIH grant K128989. Most of the numerical work was done on KIFÜ supercomputers of Hungary.Data Availability Statement
Data are available on request from the corresponding author.
References
- Chialvo and Bak (1999) D. Chialvo and P. Bak, “Learning from mistakes,” Neuroscience 90, 1137–1148 (1999).
- Beggs and Plenz (2003) J. Beggs and D. Plenz, “Neuronal avalanches in neocortical circuits,” J. Neuroscience 23, 11167 (2003).
- Muñoz (2018) M. A. Muñoz, “Colloquium: Criticality and dynamical scaling in living systems,” Rev. Mod. Phys. 90, 031001 (2018).
- Larremore, Shew, and Restrepo (2011) D. B. Larremore, W. L. Shew, and J. G. Restrepo, “Predicting criticality and dynamic range in complex networks: Effects of topology,” Phys. Rev. Lett. 106, 058101 (2011).
- Carreras et al. (2004) B. A. Carreras, D. E. Newman, I. Dobson, and A. B. Poole, “Evidence for self-organized criticality in a time series of electric power system blackouts,” IEEE Transactions on Circuits and Systems I: Regular Papers 51, 1733–1740 (2004).
- Kuramoto (2012) Y. Kuramoto, Chemical Oscillations, Waves, and Turbulence, Springer Series in Synergetics (Springer Berlin Heidelberg, 2012).
- Millán, Torres, and Bianconi (2019) A. P. Millán, J. J. Torres, and G. Bianconi, “Synchronization in network geometries with finite spectral dimension,” Physical Review E 99, 022307 (2019).
- Sporns (2010) O. Sporns, Networks of the Brain (MIT Press, 2010).
- Scheffer and Meinertzhagen (2019) L. K. Scheffer and I. A. Meinertzhagen, “The fly brain atlas,” Annual Review of Cell and Developmental Biology 35, 637–653 (2019), pMID: 31283380.
- Ódor, Deco, and Kelling (2022) G. Ódor, G. Deco, and J. Kelling, “Differences in the critical dynamics underlying the human and fruit-fly connectome,” Phys. Rev. Research 4, 023057 (2022).
- Ódor and Hartmann (2018) G. Ódor and B. Hartmann, “Heterogeneity effects in power grid network models,” Physical Review E 98 (2018), 10.1103/PhysRevE.98.022305.
- Villegas, Moretti, and Muñoz (2014) P. Villegas, P. Moretti, and M. A. Muñoz, “Frustrated hierarchical synchronization and emergent complexity in the human connectome network,” Scientific Reports 4 (2014), 10.1038/srep05990.
- Griffiths (1969) R. B. Griffiths, “Nonanalytic Behavior Above the Critical Point in a Random Ising Ferromagnet,” Phys. Rev. Lett. 23, 17–19 (1969).
- Ódor and Kelling (2019) G. Ódor and J. Kelling, “Critical synchronization dynamics of the kuramoto model on connectome and small world graphs,” Scientific Reports 9, 19621 (2019).
- Ódor, Kelling, and Deco (2021) G. Ódor, J. Kelling, and G. Deco, “The effect of noise on the synchronization dynamics of the kuramoto model on a large human connectome graph,” Neurocomputing 461, 696–704 (2021).
- Ódor et al. (2023) G. Ódor, I. Papp, S. Deng, and J. Kelling, “Synchronization transitions on connectome graphs with external force,” Frontiers in Physics 11 (2023), 10.3389/fphy.2023.1150246.
- Ódor and Hartmann (2020) G. Ódor and B. Hartmann, “Power-law distributions of dynamic cascade failures in power-grid models,” Entropy 22, 666 (2020).
- Ódor et al. (2022) G. Ódor, S. Deng, B. Hartmann, and J. Kelling, “Synchronization dynamics on power grids in europe and the united states,” Phys. Rev. E 106, 034311 (2022).
- Abrams and Strogatz (2004) D. M. Abrams and S. H. Strogatz, “Chimera states for coupled oscillators,” Phys. Rev. Lett. 93, 174102 (2004).
- Abrams et al. (2008) D. M. Abrams, R. Mirollo, S. H. Strogatz, and D. A. Wiley, “Solvable model for chimera states of coupled oscillators,” Phys. Rev. Lett. 101, 084103 (2008).
- Schöll (2016) E. Schöll, “Synchronization patterns and chimera states in complex networks: Interplay of topology and dynamics,” The European Physical Journal Special Topics 225, 891–919 (2016).
- Zakharova (2021) A. Zakharova, Chimera Patterns in Networks: Interplay between Dynamics, Structure, Noise, and Delay, Understanding Complex Systems (Springer International Publishing, 2021).
- Chouzouris et al. (2018) T. Chouzouris, I. Omelchenko, A. Zakharova, J. Hlinka, P. Jiruska, and E. Schöll, “Chimera states in brain networks: Empirical neural vs. modular fractal connectivity,” Chaos: An Interdisciplinary Journal of Nonlinear Science 28, 045112 (2018).
- Freyer et al. (2011) F. Freyer, J. A. Roberts, R. Becker, P. A. Robinson, P. Ritter, and M. Breakspear, “Biophysical mechanisms of multistability in resting-state cortical rhythms,” Journal of Neuroscience 31, 6353–6361 (2011).
- Note (1) In the weak coupling limit an equivalence with the integrate-and-fire models Politi and Rosenblum (2015) was shown.
- Acebrón et al. (2005) J. Acebrón, L. Bonilla, C. Vicente, F. Ritort, and R. Spigler, “The kuramoto model: A simple paradigm for synchronization phenomena,” Reviews of Modern Physics 77, 137–185 (2005).
- Sakaguchi (1988) H. Sakaguchi, “Cooperative phenomena in coupled oscillator systems under external fields,” Progress of theoretical physics 79, 39–46 (1988).
- Grainger and Stevenson (1994) J. Grainger, J. and D. Stevenson, W., Power system analysis (McGraw-Hill, 1994).
- Filatrella, Nielsen, and Pedersen (2008) G. Filatrella, A. H. Nielsen, and N. F. Pedersen, “Analysis of a power grid using a kuramoto-like model,” Eur. Phys. J. B 61, 485–491 (2008).
- Ahnert and Mulansky (2012) K. Ahnert and M. Mulansky, “Boost::odeint,” (2009-2012).
- Ódor and Deng (2023) G. Ódor and S. Deng, “Synchronization transition of the second-order kuramoto model on lattices,” Entropy 25 (2023).
- Shanker (2007) O. Shanker, “Defining dimension of a complex network,” Modern Physics Letters B 21, 321–326 (2007).
- Deng et al. (2015) S. Deng, W. Li, J. Gu, Y. Zhu, L. Zhao, and J. Han, “Measuring fractal dimension of metro systems,” in Journal of Physics: Conference Series, Vol. 604 (IOP Publishing, 2015) p. 012005.
- Feder (1988) J. Feder, Fractals (Springer Science & Business Media, 1988).
- Hong, Park, and Choi (2005) H. Hong, H. Park, and M. Choi, “Collective synchronization in spatially extended systems of coupled oscillators with random frequencies,” Physical Review E 72, 036217 (2005).
- Ódor and Deng (2023) G. Ódor and S. Deng, “Synchronization transition of the second-order kuramoto model on lattices,” Entropy 25, 164 (2023).
- Millán, Torres, and Bianconi (2018) A. P. Millán, J. J. Torres, and G. Bianconi, “Complex network geometry and frustrated synchronization,” Scientific reports 8, 1–10 (2018).
- Song, Havlin, and Makse (2005) C. Song, S. Havlin, and H. A. Makse, “Self-similarity of complex networks,” Nature 433, 392–395 (2005).
- Chung (1997) F. R. Chung, Spectral graph theory, Vol. 92 (American Mathematical Soc., 1997).
- Burioni and Cassi (1996) R. Burioni and D. Cassi, “Universal properties of spectral dimension,” Physical review letters 76, 1091 (1996).
- Restrepo, Ott, and Hunt (2005) J. G. Restrepo, E. Ott, and B. R. Hunt, “Onset of synchronization in large networks of coupled oscillators,” Phys. Rev. E 71, 036151 (2005).
- Schröder, Timme, and Witthaut (2017) M. Schröder, M. Timme, and D. Witthaut, “A universal order parameter for synchrony in networks of limit cycle oscillators,” Chaos 27, 073119 (2017).
- dow (2020) “The hemibrain dataset (v1.0.1),” (2020).
- Newman (2006) M. E. J. Newman, “Modularity and community structure in networks,” Proc Natl Acad Sci U S A 103, 8577–8582 (2006).
- Blondel et al. (2008) V. D. Blondel, J.-L. Guillaume, R. Lambiotte, and E. Lefebvre, “Fast unfolding of communities in large networks,” Journal of Statistical Mechanics: Theory and Experiment 2008, P10008 (2008).
- Gray Roncal et al. (2013) W. Gray Roncal, Z. H. Koterba, D. Mhembere, D. M. Kleissas, J. T. Vogelstein, R. Burns, A. R. Bowles, D. K. Donavos, S. Ryman, R. E. Jung, L. Wu, V. Calhoun, and R. J. Vogelstein, “Migraine: Mri graph reliability analysis and inference for connectomics,” in 2013 IEEE Global Conference on Signal and Information Processing (2013) pp. 313–316.
- Gastner and Ódor (2016) M. T. Gastner and G. Ódor, “The topology of large Open Connectome networks for the human brain,” Scientific Reports 6, 27249 (2016).
- Desikan et al. (2006) R. S. Desikan, F. Ségonne, B. Fischl, B. T. Quinn, B. C. Dickerson, D. Blacker, R. L. Buckner, A. M. Dale, R. P. Maguire, B. T. Hyman, M. S. Albert, and R. J. Killiany, “An automated labeling system for subdividing the human cerebral cortex on mri scans into gyral based regions of interest,” NeuroImage 31, 968–980 (2006).
- EUg (2016) “EU-HV power grid,” https://www.power.scigrid.de/pages/downloads.html (2016).
- Rosas Casals and Corominas Murtra (2009) M. Rosas Casals and B. Corominas Murtra, “Assessing european power grid reliability by means of topological measures,” WIT Trans. Ecol. Environ. 121, 527–537 (2009).
- Humphries and Gurney (2008) M. D. Humphries and K. Gurney, “Network ‘small-world-ness’: a quantitative method for determining canonical network equivalence,” PloS One 3, e0002051 (2008).
- Hartmann and et. al. (2023) B. Hartmann and et. al., “In preparation,” (2023).
- Politi and Rosenblum (2015) A. Politi and M. Rosenblum, “Equivalence of phase-oscillator and integrate-and-fire models,” Physical Review E - Statistical, Nonlinear, and Soft Matter Physics 91 (2015), 10.1103/PhysRevE.91.042916.