Optical spectral observations of three binary millisecond pulsars
Abstract
We present the results of optical spectroscopy of stellar companions to three binary millisecond pulsars, PSRs J06212514, J23171439 and J23024442, obtained with the Gran Telescopio Canarias. The spectrum of the J06212514 companion shows a blue continuum and prominent Balmer absorption lines. The latter are also resolved in the spectrum of the J23171439 companion, showing that both are DA-type white dwarfs. No spectral features are detected for the J23024442 companion, however, its broadband magnitudes and the spectral shape of the continuum emission imply that this is also a DA-type white dwarf. Based on the spectral analyses, we conclude that the companions of J06212514 and J23171439 are relatively hot, with effective temperatures 8600200 and 96002000 K, respectively, while the J23024442 companion is significantly cooler, 6000 K. We also estimated the distance to J06212514 of 1.10.3 kpc and argue that its companion and the companion of J23171439 are He-core white dwarfs providing constraints on their cooling ages of 2 Gyr.
keywords:
binaries: general – pulsars: individual: PSR J0621+2514 – pulsars: individual: PSR J2302+4442 – pulsars: individual: PSR J2317+1439 – stars: white dwarfs1 Introduction
Millisecond pulsars (MSPs) represent a subclass of neutron stars (NSs) with extremely short spin periods. The first MSP was discovered about 40 years ago (Backer et al., 1982), and nowadays more than 550 MSPs are known111According to the ATNF catalogue (Manchester et al., 2005); https://www.atnf.csiro.au/people/pulsar/psrcat/. Most of them are found in binary systems confirming the most accepted theory that MSPs are old pulsars spun up by accretion of matter and angular momentum from donor stars during the low- and intermediate-mass X-ray binary stages (Bisnovatyi-Kogan & Komberg, 1974; Alpar et al., 1982). As a result, a system consisting of a rapidly rotating (with a spin period ms) pulsar and a ‘peeled’ companion is formed. The latter often is a low-mass He-core white dwarf (WD; Tauris 2011).
Studies of binary MSPs are important since they allow one to measure NSs masses and thus to constrain the fundamental properties of supra-nuclear density matter inside them (Lattimer, 2012; Antoniadis et al., 2013). For some MSPs, this was done via measurements of post-Keplerian parameters from radio timing observations (e.g. Arzoumanian et al., 2018; Shamohammadi et al., 2023; Fonseca et al., 2021; Freire et al., 2011). For other binaries, multiwavelength, especially optical, observations are required. They provide the parameters of the companion star, such as spectral type, temperature, surface gravity, mass ratio of the system, etc., from which one can infer the pulsar mass (e.g. Antoniadis et al., 2012, 2013; Mata Sánchez et al., 2020).
The optical companions of the binary MSPs J0621+2514, J2302+4442, and J2317+1439 were recently detected at a 22–23 visual magnitude level using photometric observations (Dai et al., 2017; Karpova et al., 2018; Kirichenko et al., 2018). The authors proposed that they are likely WDs based on their magnitudes and colour indices. To confirm that and to get additional constraints on the parameters of the companions and binary systems, we have performed the optical spectroscopy of the objects with the Gran Telescopio Canarias (GTC). The results of the observations are presented in this paper. In Section 2 we describe the previous studies of the targets and their parameters. Section 3 presents the observations and data reduction. The results are described and discussed in Section 4 and Section 5, respectively.
2 Targets
The parameters of the three binary MSPs are reported in Table 1. Below we briefly describe the previous studies of these systems.
PSR J0621+2514 (hereafter J0621) is a -ray MSP discovered in the radialsoo with the Green Bank Telescope during pulsar searches among unassociated Fermi Large Area Telescope -ray sources (Ray et al., 2012; Sanpa-arsa, 2016). Using the Sloan Digital Sky Survey (SDSS) and Panoramic Survey Telescope and Rapid Response System Survey (Pan-STARRS) data, Karpova et al. (2018) identified its possible companion with a magnitude of mag in the band. Comparing the photometric data with WD cooling tracks they found that it is likely a He-core WD with a temperature of about 10 0002 000 K and a mass of M⊙. If it has a thin hydrogen envelope, its cooling age is significantly smaller than the J0621 characteristic age ( Gyr vs 1.8 Gyr) which indicates that the pulsar can be younger. On the other hand, the cooling age can be consistent with the characteristic one if the WD has a thick hydrogen envelope or its progenitor is a low metallicity star (Karpova et al., 2018).
PSR J2302+4442 (hereafter J2302) was discovered in a search for periodic radio pulsations from Fermi -ray sources using the Nançay Radio Telescope (Cognard et al., 2011). Further studies also revealed the pulsations in -rays. The pulsar X-ray counterpart was detected with XMM-Newton. Using the GTC, Kirichenko et al. (2018) identified the J2302 companion with the brightness mag, which is likely a He- or CO-core WD. Comparison with WD cooling tracks allowed them to estimate the companion’s temperature K, a mass of M⊙ and a cooling age of 1–2 Gyr. Combining the estimation on the companion mass with the radio timing measurements, they also obtained constraints on the binary system inclination angle of degrees.
PSR J2317+1439 (hereafter J2317) was discovered in the radio with the Arecibo telescope (Camilo et al., 1993). It was also detected as a -ray pulsar (Smith et al., 2017). Its flux in the 0.1–100 GeV range is erg s-1 cm-2 (Abdollahi et al., 2022). Optical identification of its companion with was obtained by Dai et al. (2017) with the Canada–France–Hawaii Telescope. Using the approach similar to the one described above for J0621 and J2302, they found that the companion is likely a He-core WD with a temperature of K, a mass of M⊙ and an age of Gyr.
| Object | J0621 | J2302 | J2317 |
|---|---|---|---|
| Right ascension (J2000) | 06h21m108542(1) | 23h02m46978387(1) | 23h17m09236381(5) |
| Declination (J2000) | +25∘14′0383(3) | +44∘42′2208051(2) | +14∘39′3126102(1) |
| Spin period (ms) | 2.7217879391872(4) | 5.19232464875420(3) | 3.4452510723611(5) |
| Period derivative (s s-1) | |||
| Reference epoch (MJD) | 56300 | 56947.00 | 55644 |
| Dispersion measure DM (pc cm-3) | 83.629(6) | 13.788120(1) | 21.8989(2) |
| Orbital period (days) | 1.256356677(3) | 125.93529692(3) | 2.459331465164(2) |
| Time of ascending node (MJD) | 56185.7806471(4) | – | 55643.088185856(1) |
| Mass function , M⊙ | 0.001416077(9) | 0.009210 | 0.002199 |
| Minimum companion mass (M⊙) a | 0.15 | 0.29 | 0.17 |
| Characteristic age (Gyr) | 1.8 | 5.93 | 22.5 |
| Spin-down luminosity (erg s-1) | |||
| Distance (kpc) b | 1.64 | 0.86 | 2.16 |
| Distance (kpc) b | 2.33 | 1.18 | 0.83 |
| Distance (kpc) c | – | ||
| Optical magnitudes d | , | , | , |
| of the companion | , | , | , |
| = value (mag) | , | , | |
-
•
Hereafter numbers in parentheses denote 1 uncertainties relating to the last significant digit quoted.
-
•
a The minimum companion mass is calculated assuming the system inclination ∘ and the pulsar mass M⊙.
- •
-
•
c is the distance measured through the timing parallax (taken from Arzoumanian et al. 2018).
- •


3 Observations and data reduction
| OB | Date | Exposure (s) | MJDmid a | Phase a | Radial velocitya (km s-1) | Airmass | Seeing (arcsec) | Grism |
|---|---|---|---|---|---|---|---|---|
| J0621 | ||||||||
| 1 | 2019-09-26 | 31070 | 58766.16 | 0.75 | 8919 | 1.13–1.23 | 0.8 | |
| 2 | 2019-10-10 | 31070 | 58752.20 | 0.87 | 32624 | 1.12–1.21 | 1.0 | R1000B |
| 3 | 2019-11-20 | 31070 | 58807.21 | 0.54 | – | 1.05–1.11 | 0.9 | |
| J2302 | ||||||||
| 1 | 2019-07-29 | 5600 | 58693.55 | – | – | 1.04–1.05 | 0.9 | |
| 2 | 2019-07-29 | 5600 | 58693.59 | – | – | 1.04–1.07 | 0.9 | R300B |
| 3 | 2019-08-29 | 5600 | 58725.45 | – | – | 1.04–1.07 | 0.8 | |
| 4 | 2019-08-29 | 5600 | 58725.49 | – | – | 1.04–1.05 | 0.9 | |
| J2317 | ||||||||
| 1 | 2019-07-26 | 5545 | 58691.49 | 0.52 | – | 1.15–1.26 | 0.9 | |
| 2 | 2019-07-27 | 5545 | 58691.54 | 0.54 | – | 1.05–1.09 | 0.9 | R300B |
| 3 | 2019-07-27 | 5545 | 58691.6 | 0.56 | – | 1.03–1.05 | 0.9 | |
| 4 | 2019-08-02 | 5545 | 58697.65 | 0.03 | – | 1.07–1.14 | 0.7 | |
-
•
a MJDmid is the barycentric mid-exposure time and is the orbital phase calculated relative to the time of ascending node using the pulsar radio ephemeris (see Table 1). Radial velocities are corrected to the Solar system barycenter.
3.1 J0621
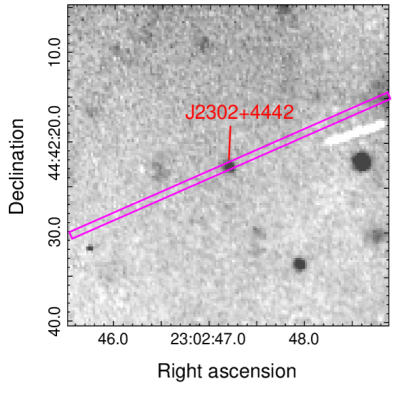
The spectroscopic long slit observations222Program GTC10-19BMEX, PI S. Zharikov of J0621 were performed in September and October 2019 using the Optical System for Imaging and low-intermediate Resolution Integrated Spectroscopy333http://www.gtc.iac.es/instruments/osiris/ (OSIRIS) instrument at the GTC, which at that time included two CCDs. We used the R1000B grism that covers the range 3630–7500 Å and a slit width of 0.8 arcsec. The resulting spectral resolution was 5.4 Å. The target spectrum was exposed on the CCD2, and three observational blocks (OBs) with total integration times of 3210 s were obtained. The slit position is shown in the top panel of Fig. 1 and the log of the observations is presented in Table 2.
The standard data reduction was performed, including the bias subtraction and flat-fielding, using the gtcmos tool (Gómez-González et al., 2016) based on the Image Reduction and Analysis Facility (iraf) package. We extracted the companion 1D spectra from the 2D images with the apall procedure.
We performed the wavelength calibration using the HgAr and Ne lamp frames. Positions of each emission line of the lamps were measured and then the resulting values were fitted with a cubic polynomial to calculate the dispersion relation along the dispersion direction. This calibration was stable during the different nights of observations resulting in the root-mean-square (rms) residuals scattered closely to Åwhich corresponds to km s-1 at 5455 Å.
To implement the flux calibration, the spectrophotometric standards Ross 640 (OB 1) from Oke (1974), G24-9 (OB 2) from Oke (1990) and G158-100 (OB 3) from Oke (1990) were observed during the same nights as the target, with a slit width of 2.52 arcsec. The standards were exposed on the same CCD position as the target. The spectra of the standards were reduced in a similar way as described above. Using their 1D spectra, and the atmospheric extinction curve provided by the GTC team,444https://www.ing.iac.es//Astronomy/observing/manuals/ps/tech_notes/tn031.pdf we found the CCD response functions. The latter were applied to the target spectra for the preliminary flux calibration. As the slit width used for the target was significantly narrower than that for the standards, we additionally corrected the derived spectral flux densities of the target for the light losses at the narrow slit. To do that, we calculated the fluxes in the broad bands from the SDSS DR17 (Abdurro’uf et al., 2022) and Pan-STARRS DR2 (Flewelling et al., 2020) catalogues which overlap with the observed spectral range. We used the preliminary flux calibrated target spectra obtained above and the transmission curves of the bands. Then we fitted the calculated fluxes with the tabulated ones (Table 1) using an additive constant as the single fit parameter.
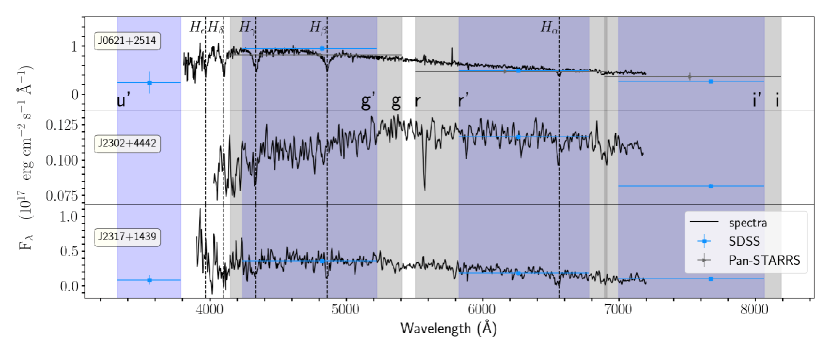
As a result, we obtained the calibrated spectra of the companion with the continuum signal-to-noise ratio (SNR) of for the first and second OBs and for the third OB. The low SNR in the third OB is caused by the weather conditions such as clouds and moon illumination, so we excluded it from further consideration. To increase the SNR, we shifted the spectra in OB1 and OB2 to the zero velocity position using the radial velocity estimates km s-1 and km s-1 derived from the spectral line cross-correlation analysis. We then combined the spectra to get the averaged one. This resulted in the continuum SNR . The spectrum and the photometric data points are shown in Fig. 2.
3.2 J2302 and J2317
J2302 and J2317 were observed555Program GTC2-19AMEX, PI A. Kirichenko in summer 2019 with the OSIRIS instrument using the R300B grism, in the wavelength range 3600–7200 Å and with a slit width of 0.8 arcsec. The resulting spectral resolution was 15 Å at 5400 Å. As compared to J0621, the low resolution was selected to get a reasonable SNR since these two objects are by a magnitude fainter than J0621 (cf. Table 1). The target spectra were exposed on CCD2. The slit positions are presented in the middle and bottom panels of Fig. 1 and the log of observations – in Table 2. For each of the objects, the observations were distributed over four OBs with five exposures of about 10 min. The sky was clear during all observing runs.
The standard data reduction, wavelength, and flux calibration were performed in the same way as for J0621. We used HgAr and Ne calibration lamp frames for the wavelength calibration and Feige 110 (Oke, 1990) spectrophotometric standard for the flux calibration. SNRs of calibrated spectra for various OBs varied from 2.5 to 3.0 and from 6.5 to 7 for J2302 and J2317 respectively.
Low spectral resolution and SNRs, and poor line profiles in the case of J2302 and J2317 do not allow us to confidently measure the radial velocities at different OBs. However, the difference between the velocities can be neglected as their orbital periods are significantly longer than the duration of observations (cf. Tables 1 and 2). To increase the SNRs, we thus simply combined the spectra of the respective OBs and obtained averaged spectra with the resulting SNRs and for J2302 and J2317, respectively.
The spectra and the photometric points are shown in the middle and bottom panels of Fig. 2.

4 Spectral analysis and parameters of the companions
As seen from Fig. 2, Balmer absorption lines are prominent in the spectrum of the J0621 companion and marginally resolved for J2317, indicating that they are DA WDs. No lines are seen for J2302, likely due to a low effective temperature. We estimated the parameters of the companions by fitting the resulting spectra with the theoretical spectral models of DA WD atmospheres calculated for a grid of values of the effective temperature and the surface gravity (Koester, 2008). To do this, we expressed the model spectral flux density as , where is the companion radius, is the distance to the source, and is the tabulated atmospheric flux calculated by Koester (2010)666The models can be found at the Theoretical spectra web server http://svo2.cab.inta-csic.es/theory/newov2/ for and . A linear interpolation was applied to get between the – grid nodes. The model spectra were convolved with a Gaussian kernel of 5 Å to decrease their spectral resolution to that of the observed spectra. We also included in the model the interstellar extinction using the extinction–distance relations along the line of sight for each of the objects taken from the 3D dust Galaxy map of Green et al. (2019). The distance in the relations was linked with that in the expression for presented above, and the extinction curve model from Fitzpatrick et al. (2019) was applied. The fitting parameters were , log, , and the interstellar reddening .

4.1 J0621
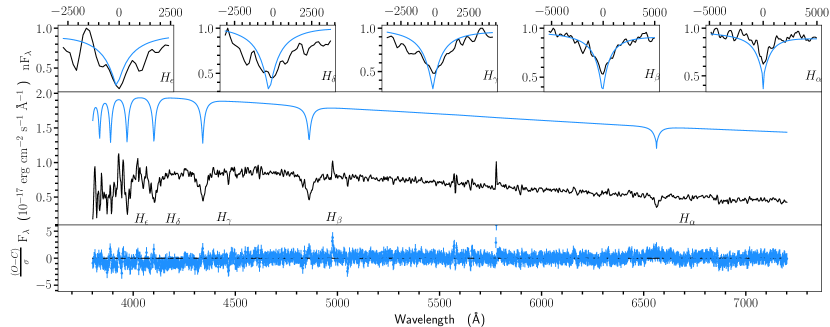
At an initial step of finding the spectral parameters, we normalised the model and the observed spectra using a low-order polynomial continuum fit. Normalised spectra depend mostly on and parameters, and we derived the latter from the spectral fit. This resulted in , K at per 1379 degrees of freedom (dof). The best-fitting results are shown in Fig. 3. The derived and are in a good agreement with the estimates obtained using the photometric data (Karpova et al., 2018). Their large uncertainties are related to the low SNRs within the observed spectral lines.
At the next step, given and , we estimated the companion radius and mass using the relativistic mass-radius relation for DA WDs (Carvalho et al., 2018) and the surface gravity definition , where is the gravitational constant. This leads to or R⊙. The mass is very uncertain, lying in the range of 0.03–0.26 M⊙. Formally, the best-fitting M⊙.
Finally, we returned to the non-normalised spectra. Fixing , , and at the values obtained at previous steps, we fitted the observed spectrum using only the distance as a free parameter and accounting for the reddening based on the distance-extinction relation. The resulting distance is pc and . The final fit results are demonstrated in Fig. 4 ( ) and the best-fitting parameters are presented in Table 3.
| (M⊙) | (R⊙) | ||||
|---|---|---|---|---|---|
| J0621 | |||||
| 1.10.3 | |||||
| J2302 a | |||||
| 0.5 | |||||
| 0.9 | |||||
| 1.2 | |||||
| J2317 a | |||||
| 0.8 | |||||
| 2.0 | |||||
| 2.2 | |||||
-
•
a Parameters are derived at distances fixed at their three possible values (see Table 1).
4.2 J2302 and J2317
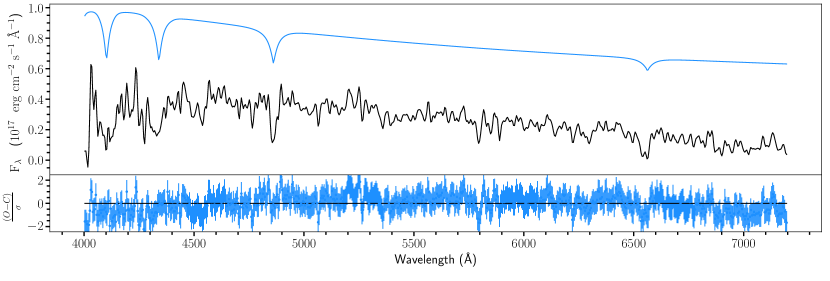
As seen from Fig. 2, the Balmer lines are weak and poorly resolved for both objects. In contrast to the J0621 case, this makes the normalised spectra useless for convincing estimates of and . Therefore, to fit the spectra of these objects, we fixed in the factor of the model at the values provided by the radio data presented in Table 1. was taken from the extinction-distance relations. To get the rest of the parameters, was linked with through the mass–radius relation. As a result, for each of the objects, we found temperatures and surface gravities for their three possible distance values (Table 3). Examples of the best-fitting results are demonstrated in Fig. 5 and 6. Using the fitting results we can constrain the masses of the WDs. For the J2317 distance range, the mass = 0.12–0.55 M⊙, and for J2302 the mass is M⊙. For J2302 the resulting temperature reaches the lower bound of the available atmospheric models, and thus we set only an upper limit for this object.

5 Discussion and conclusions
Balmer absorption lines detected in the spectra of J0621 and J2317 companions clearly show that they are DA WDs. The spectrum of the J2302 companion is apparently featureless though it also can be described by the coldest available hydrogen atmosphere model, and thus the companion likely belongs to the DA family as well.
The companions of J0621 and J2317 are relatively hot, with in the ranges 8400–8800 and 7400–12500 K, respectively, while the J2302 companion is significantly cooler, with K (see Table 3). The temperature of J0621 is in agreement with the rough estimates obtained by Karpova et al. (2018) using photometry data alone, while its uncertainty is now much smaller. The spectral data for the J2302 companion completely exclude temperatures above 6000 K which were allowed by the estimates based only on its photometry (Kirichenko et al., 2018). The spectral temperature of J2317 is consistent with the photometric one (Dai et al., 2017) while its uncertainty remains pretty large.
The better quality of the J0621 companion spectrum enabled us to independently estimate the distance to the system of 1.1 kpc. At 2 level it is consistent with the dispersion measure distance of 1.6 kpc based on the NE2001 (Cordes & Lazio, 2002) model for the distribution of free electrons in the Galaxy and it disagrees with that of 2.3 kpc following from the YMW16 distribution (Yao, Manchester & Wang, 2017). Using this new spectroscopic distance, the respective from Table 3, and the stellar magnitudes from Table 1, we calculated an updated companion position at the dereddened colour-magnitude diagram (CMD) presented in Fig. 7 (c.f., Karpova et al., 2018). To understand its core composition and evolution stage, we also show the cooling tracks for DA WDs with He-777http://evolgroup.fcaglp.unlp.edu.ar/TRACKS/tracks_heliumcore.html (Althaus et al., 2013) and CO-cores888http://astro.umontreal.ca/~bergeron/coolingModels/ (Holberg & Bergeron, 2006; Kowalski & Saumon, 2006; Tremblay et al., 2011). As seen from the CMD, the position of J0621 is consistent with the tracks of He-core WDs for the mass range from 0.16 to 0.44 M⊙. The mass of this companion is poorly constrained from the spectral data while its upper bound of 0.35 M⊙ (see Table 3) is compatible with the above mass range supporting the He-core WD origin. From the coincidence with the tracks, the corresponding WD cooling age is Gyr.
The CMD positions of the rest of the companions remain very uncertain mainly due to the distance uncertainties. As seen from Fig. 7, they can be either He or CO core WDs depending on the distance.
Nevertheless, for the J2317 companion, the – relation (Tauris & Savonije, 1999) predicts the mass M⊙, which lies within the mass range derived from the spectroscopy (Table 3). This value is in an excellent agreement with the J2317 position in the CMD (Fig. 7) at the distance upper bound of kpc when it lies at the respective DA∗ cooling track. The WD cooling age, in this case, is Gyr. A twice larger mass estimate obtained by Dai et al. (2017) from the photometry for kpc is incompatible with the theoretical predictions indicating that the larger distance may be more reasonable. We note that even for this , the conservative constraint on the WD cooling age is Gyr, while Dai et al. (2017) provided Gyr. The latter seems to be unreasonably large for a WD with K. This discrepancy is likely related to the fact that the ages in the models of Althaus et al. (2013) are counted from the zero-age main sequence and certain corrections are needed to obtain the real cooling ages.
Large uncertainty of the J2302 companion mass obtained from the spectroscopy does not allow us to derive its core chemical composition. At this stage, both the He- and CO-core are allowed for this WD.
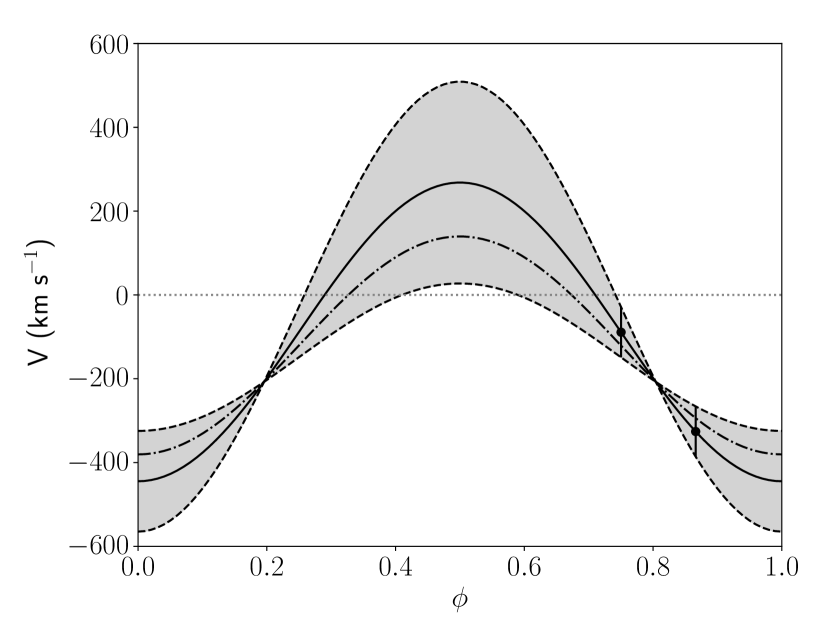
It is instructive to consider what information can be extracted from the two radial velocity measurements of J0621 taken at its different orbital phases (see Table 2). To estimate possible ranges of the radial velocity semi-amplitude of the companion and the systemic velocity of the system , we fitted the measurements with the model of the radial velocity curve
| (1) |
where is the orbital phase. The results are presented in Fig. 8. The derived 2 uncertainty ranges for and are 175–536 km s-1 and 27–148 km s-1, respectively. Such large uncertainties are mainly caused by the presence of only two observational points. Nevertheless, the range is in agreement with the observed velocity distribution for binary pulsars (Hobbs et al., 2005). Given the binary period and the mass-function provided by the radio observations (Table 1), the pulsar radial velocity semi-amplitude can be estimated as
| (2) |
where is the gravitational constant. This results in the mass ratio =7.9–24.2.
Alternatively, can be expressed trough , , and
| (3) |
where is the orbital inclination. Using from our spectroscopy (Table 3), this results in km s-1 at deg. The radial velocity curve corresponding to this upper bound is shown by the dash-dotted line in Fig. 8. As can be seen, this line is compatible with the radial velocity fit within 2 uncertainties. However, the corresponding upper bound of the mass ratio is 11.7, about twice lower than that obtained from the fit. For our estimates, higher values of the mass ratio are inconsistent with for any . This strongly constraints the expected radial velocity curve and leads to a conservative upper limit of the NS mass in the system M⊙.
These estimates based only on two measurements are highly uncertain but useful for future determination of the companion and pulsar masses. Our observations showed that the measurements of the companion radial velocity variation with the orbital phase with a large telescope using the medium resolution spectroscopy, as applied in this work, are feasible for this object.
Such data could significantly improve our knowledge on the system parameters including reliable constraints on the companion and NS masses. Deeper photometry would help to better localise the companion at the CDM and establish its evolution stage. Improved distance measurements would be also useful for this and the other two companions for which higher resolution spectroscopy is necessary to get more convincing constraints on their parameters.
Acknowledgements
We thank the anonymous referee for useful comments. The work is based on observations made with the Gran Telescopio Canarias (GTC), installed at the Spanish Observatorio del Roque de los Muchachos of the Instituto de Astrofísica de Canarias, in the island of La Palma. iraf is distributed by the National Optical Astronomy Observatory, which is operated by the Association of Universities for Research in Astronomy (AURA) under a cooperative agreement with the National Science Foundation. Funding for the Sloan Digital Sky Survey IV has been provided by the Alfred P. Sloan Foundation, the U.S. Department of Energy Office of Science, and the Participating Institutions. SDSS-IV acknowledges support and resources from the Center for High Performance Computing at the University of Utah. The SDSS website is www.sdss.org. SDSS-IV is managed by the Astrophysical Research Consortium for the Participating Institutions of the SDSS Collaboration including the Brazilian Participation Group, the Carnegie Institution for Science, Carnegie Mellon University, Center for Astrophysics | Harvard & Smithsonian, the Chilean Participation Group, the French Participation Group, Instituto de Astrofísica de Canarias, The Johns Hopkins University, Kavli Institute for the Physics and Mathematics of the Universe (IPMU) / University of Tokyo, the Korean Participation Group, Lawrence Berkeley National Laboratory, Leibniz Institut für Astrophysik Potsdam (AIP), Max-Planck-Institut für Astronomie (MPIA Heidelberg), Max-Planck-Institut für Astrophysik (MPA Garching), Max-Planck-Institut für Extraterrestrische Physik (MPE), National Astronomical Observatories of China, New Mexico State University, New York University, University of Notre Dame, Observatário Nacional / MCTI, The Ohio State University, Pennsylvania State University, Shanghai Astronomical Observatory, United Kingdom Participation Group, Universidad Nacional Autónoma de México, University of Arizona, University of Colorado Boulder, University of Oxford, University of Portsmouth, University of Utah, University of Virginia, University of Washington, University of Wisconsin, Vanderbilt University, and Yale University. The work of AVB, DAZ and AVK was supported by the Russian Science Foundation, grant number 22-22-00921, https://rscf.ru/project/22-22-00921/. DAZ thanks Pirinem School of Theoretical Physics for hospitality. SVZ acknowledges PAPIIT grant IN119323.
Data Availability
The data are available through the GTC archive https://gtc.sdc.cab.inta-csic.es/gtc/.
References
- Abdollahi et al. (2022) Abdollahi S., et al., 2022, ApJS, 260, 53
- Abdurro’uf et al. (2022) Abdurro’uf et al., 2022, ApJS, 259, 35
- Alpar et al. (1982) Alpar M. A., Cheng A. F., Ruderman M. A., Shaham J., 1982, Nature, 300, 728
- Althaus et al. (2013) Althaus L. G., Miller Bertolami M. M., Córsico A. H., 2013, A&A, 557, A19
- Antoniadis et al. (2012) Antoniadis J., van Kerkwijk M. H., Koester D., Freire P. C. C., Wex N., Tauris T. M., Kramer M., Bassa C. G., 2012, MNRAS, 423, 3316
- Antoniadis et al. (2013) Antoniadis J., et al., 2013, Science, 340, 448
- Arzoumanian et al. (2018) Arzoumanian Z., et al., 2018, ApJS, 235, 37
- Backer et al. (1982) Backer D. C., Kulkarni S. R., Heiles C., Davis M. M., Goss W. M., 1982, Nature, 300, 615
- Bisnovatyi-Kogan & Komberg (1974) Bisnovatyi-Kogan G. S., Komberg B. V., 1974, Soviet Astronomy, 18, 217
- Camilo et al. (1993) Camilo F., Nice D. J., Taylor J. H., 1993, ApJ, 412, L37
- Carvalho et al. (2018) Carvalho G. A., Marinho R. M., Malheiro M., 2018, General Relativity and Gravitation, 50, 38
- Cognard et al. (2011) Cognard I., et al., 2011, ApJ, 732, 47
- Cordes & Lazio (2002) Cordes J. M., Lazio T. J. W., 2002, preprint, (arXiv:astro-ph/0207156)
- Dai et al. (2017) Dai S., Smith M. C., Wang S., Okamoto S., Xu R. X., Yue Y. L., Liu J. F., 2017, ApJ, 842, 105
- Fitzpatrick et al. (2019) Fitzpatrick E. L., Massa D., Gordon K. D., Bohlin R., Clayton G. C., 2019, ApJ, 886, 108
- Flewelling et al. (2020) Flewelling H. A., et al., 2020, ApJS, 251, 7
- Fonseca et al. (2021) Fonseca E., et al., 2021, ApJ, 915, L12
- Freire et al. (2011) Freire P. C. C., et al., 2011, MNRAS, 412, 2763
- Gómez-González et al. (2016) Gómez-González V. M. A., Mayya Y. D., Rosa-González D., 2016, MNRAS, 460, 1555
- Green et al. (2019) Green G. M., Schlafly E., Zucker C., Speagle J. S., Finkbeiner D., 2019, ApJ, 887, 93
- Hobbs et al. (2005) Hobbs G., Lorimer D. R., Lyne A. G., Kramer M., 2005, MNRAS, 360, 974
- Holberg & Bergeron (2006) Holberg J. B., Bergeron P., 2006, AJ, 132, 1221
- Karpova et al. (2018) Karpova A. V., Zyuzin D. A., Shibanov Y. A., Kirichenko A. Y., Zharikov S. V., 2018, Publ. Astron. Soc. Australia, 35, e028
- Kirichenko et al. (2018) Kirichenko A. Y., Zharikov S. V., Zyuzin D. A., Shibanov Y. A., Karpova A. V., Dai S., Cabrera Lavers A., 2018, MNRAS, 480, 1950
- Koester (2008) Koester D., 2008, arXiv e-prints, p. arXiv:0812.0482
- Koester (2010) Koester D., 2010, Mem. Soc. Astron. Italiana, 81, 921
- Kowalski & Saumon (2006) Kowalski P. M., Saumon D., 2006, ApJ, 651, L137
- Lattimer (2012) Lattimer J. M., 2012, Annual Review of Nuclear and Particle Science, 62, 485
- Manchester et al. (2005) Manchester R. N., Hobbs G. B., Teoh A., Hobbs M., 2005, AJ, 129, 1993
- Mata Sánchez et al. (2020) Mata Sánchez D., Istrate A. G., van Kerkwijk M. H., Breton R. P., Kaplan D. L., 2020, MNRAS, 494, 4031
- Oke (1974) Oke J. B., 1974, ApJS, 27, 21
- Oke (1990) Oke J. B., 1990, AJ, 99, 1621
- Ray et al. (2012) Ray P. S., et al., 2012, arXiv e-prints, p. arXiv:1205.3089
- Sanpa-arsa (2016) Sanpa-arsa S., 2016, PhD thesis, University of Virginia, https://libraetd.lib.virginia.edu/public_view/0k225b07h
- Shamohammadi et al. (2023) Shamohammadi M., et al., 2023, MNRAS, 520, 1789
- Smith et al. (2017) Smith D. A., Guillemot L., Kerr M., Ng C., Barr E., 2017, arXiv e-prints, p. arXiv:1706.03592
- Tauris (2011) Tauris T. M., 2011, in Schmidtobreick L., Schreiber M. R., Tappert C., eds, Astronomical Society of the Pacific Conference Series Vol. 447, Evolution of Compact Binaries. p. 285 (arXiv:1106.0897)
- Tauris & Savonije (1999) Tauris T. M., Savonije G. J., 1999, A&A, 350, 928
- Tremblay et al. (2011) Tremblay P.-E., Bergeron P., Gianninas A., 2011, ApJ, 730, 128
- Yao et al. (2017) Yao J. M., Manchester R. N., Wang N., 2017, ApJ, 835, 29