Probing quantum phases in ultra-high-mobility two-dimensional electron systems using surface acoustic waves
Abstract
Transport measurement, which applies an electric field and studies the migration of charged particles, i.e. the current, is the most widely used technique in condensed matter studies. It is generally assumed that the quantum phase remains unchanged when it hosts a sufficiently small probing current, which is, surprisingly, rarely examined experimentally. In this work, we study the ultra-high mobility two-dimensional electron system using a propagating surface acoustic wave, whose traveling speed is affected by the electrons’ compressibility. The acoustic power used in our study is several orders of magnitude lower than previous reports, and its induced perturbation to the system is smaller than the transport current. Therefore we are able to observe the quantum phases become more incompressible when hosting a perturbative current.
Two-dimensional electron systems (2DES) with extremely low disorder host a plethora of exotic quantum many-body states Tsui et al. (1982); Prange and Girvin (1987); Jain (2007). The quantum Hall state (QHS) is incompressible signaled by vanishing longitudinal resistance and quantized Hall resistance Jain (2007). At high Landau level fillings factors , various charge density waves are stabilized by the large extent of the electron wavefunction Lilly et al. (1999); Du et al. (1999); Koulakov et al. (1996). The enigmatic 5/2 fractional quantum Hall state (FQHS) attracts tremendous interest Willett et al. (1987); Pan et al. (1999); Dean et al. (2008); Kumar et al. (2010); Rezayi and Haldane (2000); Peterson et al. (2008); Wójs et al. (2010); Willett (2013); Lin et al. (2014); Wan et al. (2008) because its quasi-particles might obey non-Abelian statistics Moore and Read (1991); Kitaev (2003); Stern (2010); Nayak et al. (2008). Varies of experimental studies are employed to study its topological properties and quasi-particle statistics, such as weak tunnelingRoddaro et al. (2003); Miller et al. (2007); Radu et al. (2008); Fu et al. (2016), interferometryWillett et al. (2009); Zhang et al. (2009); Willett et al. (2010); Nakamura et al. (2020), shot noiseSaminadayar et al. (1997); de Picciotto et al. (1997); Bid et al. (2010); Dolev et al. (2010) and thermal transportChickering et al. (2013); Banerjee et al. (2017, 2018). Most of these studies rely upon the hypothesis that a quantum state is unperturbed by the tiny probing current passing through the m size device.
Surface acoustic wave (SAW) is a useful current-free technique to investigate the property of 2DES Wixforth et al. (1986); Paalanen et al. (1992); Willett et al. (1993, 2002); Friess et al. (2018, 2020, 2017); Drichko et al. (2011, 2016). The propagating piezo-electric field accompanying the SAW interacts with the charge carriers, which in turn affects its velocity () and attenuation. Qualitatively, this interaction is related to the compressibility of 2DES: increases when the 2DES becomes incompressible and thus unable to respond to the SAW 111Previous work in Ref. Wixforth et al. (1986) explains the velocity shift with the conductivity. Such an analysis may not be suitable here because our ultra-high mobility 2DES has a very long transport scattering time ns comparable to the SAW frequency.. In this work, we probe the 2DES using a pW-level, continuous-wave SAW and discover that the 100 nA current flowing through the 1 mm size sample causes a 0.1 ppm (parts per million, ) increase of the SAW velocity at very low mK. Such a current-induced SAW velocity shift illustrates that a close and careful examination on the charge transport mechanism is essential and imperative.
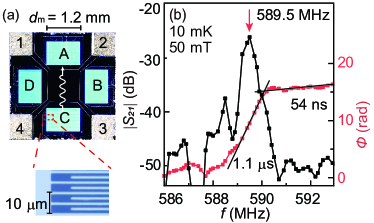
Our sample is made from a GaAs/AlGaAs wafer grown by molecular beam epitaxy. The 2DES is confined in a 30-nm-wide quantum well, whose electron density is cm-2 and low-temperature mobility is about cm2/(Vs). We make a Van der Pauw mesa (length of side = mm) by wet etching, and then evaporate 5--period interdigital transducers (IDTs) on each side of the mesa. 50 resistance is connected in parallel to each IDT for broadband impedance matching. When applied with an AC voltage whose frequency matches the resonance condition, the IDT generates a propagating SAW. The SAW will be captured by the IDT on the opposite side of the sample as a voltage output through the piezoelectric effect White and Voltmer (1965), see Fig. 1(a).
We use a custom-built superheterodyne demodulation system Wu et al. (2023) to analyze the attenuation and phase delay of the output signal 222See supplementary material for a detailed description of our setup, which includes Refs. Sullivan et al. (1990); Durdaut et al. (2019).. From the measured and vs. frequency shown in Fig. 1(b), we can calculate the reference SAW velocity at low field ( m/s) from the IDT period (5 m) and the resonant frequency (589.5 MHz). We can also derive the delay time = 1.1 and 54 ns near and away from the SAW resonance peak, consistent with the mm SAW travel distance and -meter-long coaxial cable (5.5 m each way). The experiment is carried out in a dilution refrigerator whose base temperature is 10 mK.
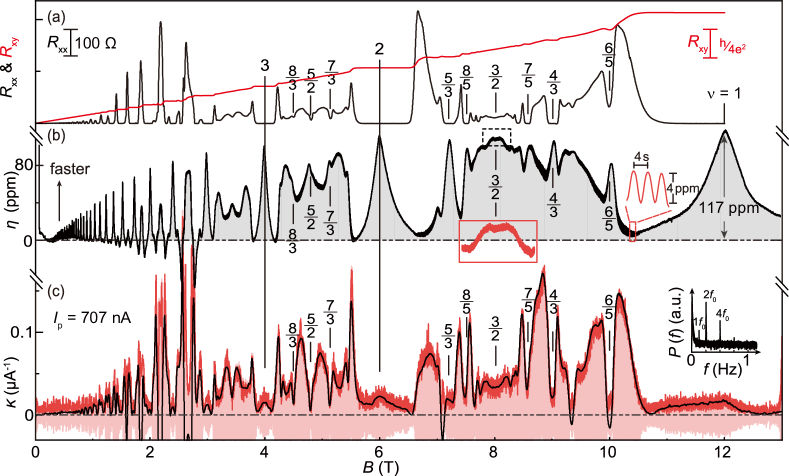
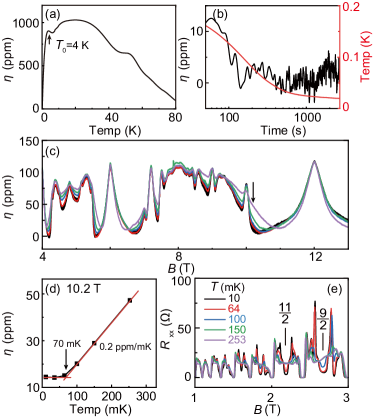
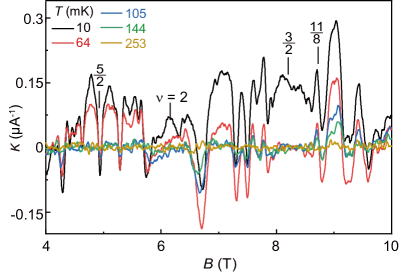
Figure. 2(a) and (b) show the magneto-resistance (, ) and the measured relative SAW velocity increase , where . The positive (negative) velocity shift results in the decrease (increase) in the delay time. We can directly deduce from the measured SAW phase shift through , where ns is the SAW’s traveling time through the 2DES. At high fields, exhibits maxima (corresponding to enhanced SAW velocity) when the 2DES forms an incompressible quantum Hall state and its screening capability vanishes Drichko et al. (2011), see Fig. 2(b). The SAW interacts with 2DES by inducing a screening charge distribution. Therefore is related to the 2DES compressibility 333See supplementary material for more information.. at integer fillings increases monochromatically with decreasing . We linearly fit the data at 10 and define the intercept at as ppm Note (3).
Unlike the vanishing plateau seen in , we observe “V”-shape maxima in . At the vicinity of integer filling factors , is an integer, the 2DES consists of an incompressible quantum Hall liquid and additional quasiparticles/quasiholes whose filling factor . The fact that has a linear dependence on the quasiparticles/quasiholes density suggests that the quantum phase formed by these dilute quasiparticles/quasiholes is compressible Note (3); Chen et al. (2003). The SAW velocity enhancement is also seen as clear “V”-shape maximum at , 5/3, 6/5, etc., as well as developing maxima at , 7/3, and 11/5 where FQHS develop. The SAW velocity enhancement is seen when the SAW propagates along the hard axis of the stripe phase formed at , 11/2, etc., consistent with previous reports Friess et al. (2017). Interestingly, is large near where the 2DES forms compressible composite Fermion Fermi sea, possibly because the composite Fermions with extremely large effective mass are inert to the SAW-induced field 444Such behavior is surprising but not inconsistent with the previous report, since our frequency is much lower than the geometric resonance condition Willett et al. (1993, 2002)..
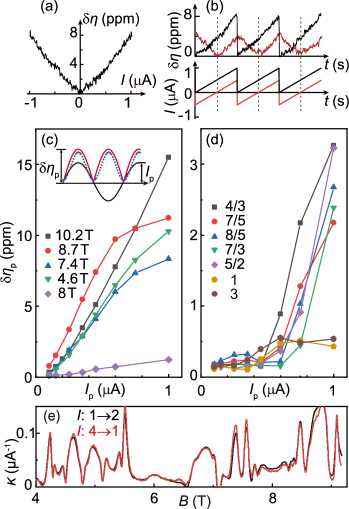
We are able to reach 0.1 ppm resolution in while using excitation that is orders of magnitude smaller than previous reports Friess et al. (2017). The input RF power in Fig. 2(b) is 1 nW (-61 dBmW) and only a tenth of it turns into SAW considering the attenuation of cables and the efficiency of the IDT. The SAW induced potential on the 2DES is only 10 eV, leading to cm-2 electron density fluctuation Note (3). Therefore, we can resolve very delicate response of 2DES while preserving the fragile many-body states. One of the most surprising discovery is a velocity shift induced by a current passing through the 2DES, see Fig. 3(a). increases nearly linearly by 8 ppm when increases from 0 to 1 A. is an even function of , so that if we sweep the current from -0.5 to 0.5 A, displays a triangle waveform, see Fig. 3(b). We define a parameter to describe this current induced velocity shift (CIVS) effect.
We note if the input current is sinusoidal at frequency , the leading component of would be the second harmonic at frequency 2, see the Fig. 3(c) inset. Therefore, we can use lock-in technique to measure amplitude () of the oscillation from its second harmonic Note (3) and deduce even when the CIVS effect is small. We measure at different filling factors as a function of the AC current amplitude in Fig. 3(c) and (d). In the left panel where the 2DES is compressible, increases linearly and then saturates at large current amplitudes. In the right panel, the tiny value does not rise obviously with the increase of current at integer fillings. At fractional fillings, we discover a clear threshold behavior where remains almost zero until reaches about 600 nA.
The Fig 2(b) data is taken when a 0.125 Hz, = 707 nA current passes through the 2DES. In the expanded plot of in Fig. 2(b) and the power spectrum of the in the Fig. 2(c), we can clearly observe a 4-s (2) period oscillation in . We apply a digital band-pass filter to the Fig. 2(b) data to extract this oscillation (pink shade) and deduce from its amplitude (red trace) in Fig. 2(c). Alternatively, we can use a lock-in amplifier to measure this oscillation amplitude (black trace). The Fig. 2(c) data clearly evidences the dependance of CIVS effect on the quantum phases of 2DES. At strong quantum Hall effects, unlike the “V”-shape maxima in the trace and the plateau in the trace, presents a “W”-shape minimum – it has a positive peak at exact integer = 1, 2, 3, etc. and reduces to zero on both sides before increasing. Between and 2, exhibits clear minima at , 5/3, 7/5, 8/5 and 6/5 when FQHS form, similar to the and traces. Surprisingly, clear minimum can be seen in the trace corresponding to the fragile FQHS at , 7/3, 8/3, 11/5 and 14/5 while the trace only shows a glimmer of maxima.
We can rule out the possibility that finite is caused by the heating effect. As discussed in the supplementary, has little temperature dependence when the sample temperature is below 100 mK. Although there’s no reliable approach to detect the electron temperature of the 2DES, we are quite confident that it is well below 100 mK when taking Fig. 2 data. We can see clear features in and in Fig. 2(b) and (c) for several fragile quantum phases such as the FQHS at , 7/3 and 8/3 as well as the unidirectinal charge density waves at and 11/2, which are only stable at temperatures well below 100 mK. The transport measurements taken using 500 nArms current also shows clear difference when temperature raises to 100 mK Note (3). Lastly, dip at a fragile QHS such as is much more obvious than the composite Fermion Fermi sea at , although the former is more sensitive to the temperature.
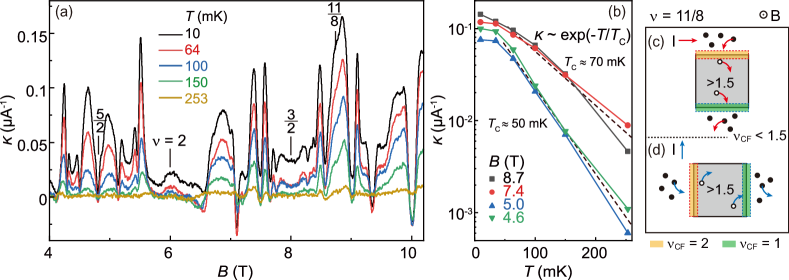
Figure. 4(a) shows that at all fields decreases as increases, and eventually vanishes when 250 mK. The summarized vs. data at different fields in Fig. 4(b) suggests an exponential dependence where the characteristic temperature is about 50 mK at and 70 mK at . More data show that the is insensitive to the probing SAW frequencies/wavelengths Note (3). It is important to mention that the vanishing of is unlikely a direct result of reduced quantum Hall stability, since the QHS around remains quite strong at mK when vanishes.
The measured is almost always positive. The increased SAW velocity suggests that the 2DES becomes more incompressible when carrying current. Intuitively, the current cripples the incompressible phases by introducing more defects/inhomogeneities and broadening the domain walls, so that the 2DES are expected to be more compressible. Also, we observe no changed in when we rotate the current direction to be parallel to SAW, see Fig. 3(e), indicating that the CIVS has no dependence on which direction the current flows. Unfortunately, there’s very little investigation on the morphing of the quantum phase when carrying a non-destructive current. Meanwhile, the large is seen at the transition between two neighboring QHS, where a rigorous description of charge transport mechanism must involve quasiparticle localization and percolation and is particularly hard.
We propose a simple hand-waving mechanism to understand the positive in Fig. 4(c). At and 7/5, the electrons in the partially filled Landau level form and 2/5 fractional qauntum Hall states, respectively, if the 2DES is fully-spin-polarized. These two states can be explained as the and 2 integer quantum Hall states of composite Fermions, and the phase transition happens at when the average composite Fermion filling factor = 1.5. Because of the density fluctuation Chung et al. (2019), the regions with () consist of an incompressible () QHS and additional movable negative-charged quasiparticles (positive-charged quasiholes), see Fig. 4(c). When a current passes through the sample, e.g. from left to right (red arrow), quasiparticles move leftward and quasiholes move rightward. The effective magnetic field poses a Lorentz force, leading to the accumulation and depletion of quasiparticles/quasiholes at the phase boundary. The depletion (accumulation) of quasiholes and accumulation (depletion) of quasiparticles occur at the same boundary, leading to an increase (decrease) in the local density and the formation of incompressible QHS with (). If we rotate the current to the vertical direction (blue arrow), the incompressible regions rotate as well. In short, the current passing through the disordered 2DES induces incompressible phases at domain boundaries which are always parallel to the current direction. This explains why we measure the same in different current directions as shown in Fig. 3(e). Similar discussion can be easily extended to QHS, where the flowing current drives the sparsely distributed, disorder-pinned quasiparticles/quasiholes out of their equilibrium positions and piles them at boundaries of the incompressible liquid phase.
In conclusion, we use the interaction between SAW and electrons to study the morphing of quantum phases in ultra-high mobility 2DES. We discover that the SAW velocity increases, suggesting that the 2DES becomes more incompressible when a non-destructive current flows through the 2DES. This effect is only seen with a revolutionarily enhanced sound velocity resolution at very low temperatures and disappears at 250 mK.
Acknowledgements.
We acknowledge support by the National Key Research and Development Program of China (Grant No. 2021YFA1401900 and 2019YFA0308403) and the National Natural Science Foundation of China (Grant No. 92065104 and 12074010) for sample fabrication and measurement. The Princeton University portion of this research is funded in part by the Gordon and Betty Moore Foundation’s EPiQS Initiative, Grant GBMF9615.01 to Loren Pfeiffer. We thank Xin Wan, Zhao Liu and Bo Yang for valuable discussions.References
- Tsui et al. (1982) D. C. Tsui, H. L. Stormer, and A. C. Gossard, Phys. Rev. Lett. 48, 1559 (1982).
- Prange and Girvin (1987) R. E. Prange and S. M. Girvin, eds., The Quantum Hall Effect (Springer, New York, 1987).
- Jain (2007) J. K. Jain, Composite Fermions (Cambridge University Press, Cambridge, UK, 2007).
- Lilly et al. (1999) M. P. Lilly, K. B. Cooper, J. P. Eisenstein, L. N. Pfeiffer, and K. W. West, Phys. Rev. Lett. 82, 394 (1999).
- Du et al. (1999) R. R. Du, D. C. Tsui, H. L. Stormer, L. N. Pfeiffer, K. W. Baldwin, and K. W. West, Solid State Communications 109, 389 (1999).
- Koulakov et al. (1996) A. A. Koulakov, M. M. Fogler, and B. I. Shklovskii, Phys. Rev. Lett. 76, 499 (1996).
- Willett et al. (1987) R. L. Willett, J. P. Eisenstein, H. L. Störmer, D. C. Tsui, A. C. Gossard, and J. H. English, Phys. Rev. Lett. 59, 1776 (1987).
- Pan et al. (1999) W. Pan, J.-S. Xia, V. Shvarts, D. E. Adams, H. L. Stormer, D. C. Tsui, L. N. Pfeiffer, K. W. Baldwin, and K. W. West, Phys. Rev. Lett. 83, 3530 (1999).
- Dean et al. (2008) C. R. Dean, B. A. Piot, P. Hayden, S. Das Sarma, G. Gervais, L. N. Pfeiffer, and K. W. West, Phys. Rev. Lett. 101, 186806 (2008).
- Kumar et al. (2010) A. Kumar, G. A. Csáthy, M. J. Manfra, L. N. Pfeiffer, and K. W. West, Phys. Rev. Lett. 105, 246808 (2010).
- Rezayi and Haldane (2000) E. H. Rezayi and F. D. M. Haldane, Phys. Rev. Lett. 84, 4685 (2000).
- Peterson et al. (2008) M. R. Peterson, T. Jolicoeur, and S. Das Sarma, Phys. Rev. Lett. 101, 016807 (2008).
- Wójs et al. (2010) A. Wójs, C. Tőke, and J. K. Jain, Phys. Rev. Lett. 105, 096802 (2010).
- Willett (2013) R. L. Willett, Reports on Progress in Physics 76, 076501 (2013).
- Lin et al. (2014) X. Lin, R. Du, and X. Xie, National Science Review 1, 564 (2014).
- Wan et al. (2008) X. Wan, Z.-X. Hu, E. H. Rezayi, and K. Yang, Phys. Rev. B 77, 165316 (2008).
- Moore and Read (1991) G. Moore and N. Read, Nuclear Physics B 360, 362 (1991).
- Kitaev (2003) A. Kitaev, Annals of Physics 303, 2 (2003).
- Stern (2010) A. Stern, Nature 464, 187 (2010).
- Nayak et al. (2008) C. Nayak, S. H. Simon, A. Stern, M. Freedman, and S. Das Sarma, Rev. Mod. Phys. 80, 1083 (2008).
- Roddaro et al. (2003) S. Roddaro, V. Pellegrini, F. Beltram, G. Biasiol, L. Sorba, R. Raimondi, and G. Vignale, Phys. Rev. Lett. 90, 046805 (2003).
- Miller et al. (2007) J. B. Miller, I. P. Radu, D. M. Zumbühl, E. M. Levenson-Falk, M. A. Kastner, C. M. Marcus, L. N. Pfeiffer, and K. W. West, Nature Physics 3, 561 (2007).
- Radu et al. (2008) I. P. Radu, J. B. Miller, C. M. Marcus, M. A. Kastner, L. N. Pfeiffer, and K. W. West, Science 320, 899 (2008).
- Fu et al. (2016) H. Fu, P. Wang, P. Shan, L. Xiong, L. N. Pfeiffer, K. West, M. A. Kastner, and X. Lin, Proc. Natl. Acad. Sci. 113, 12386 (2016).
- Willett et al. (2009) R. L. Willett, L. N. Pfeiffer, and K. W. West, Proc. Natl. Acad. Sci. 106, 8853 (2009).
- Zhang et al. (2009) Y. Zhang, D. T. McClure, E. M. Levenson-Falk, C. M. Marcus, L. N. Pfeiffer, and K. W. West, Phys. Rev. B 79, 241304 (2009).
- Willett et al. (2010) R. L. Willett, L. N. Pfeiffer, and K. W. West, Phys. Rev. B 82, 205301 (2010).
- Nakamura et al. (2020) J. Nakamura, S. Liang, G. C. Gardner, and M. J. Manfra, Nature Physics 16, 931 (2020).
- Saminadayar et al. (1997) L. Saminadayar, D. C. Glattli, Y. Jin, and B. Etienne, Phys. Rev. Lett. 79, 2526 (1997).
- de Picciotto et al. (1997) R. de Picciotto, M. Reznikov, M. Heiblum, V. Umansky, G. Bunin, and D. Mahalu, Nature 389, 162 (1997).
- Bid et al. (2010) A. Bid, N. Ofek, H. Inoue, M. Heiblum, C. L. Kane, V. Umansky, and D. Mahalu, Nature 466, 585 (2010).
- Dolev et al. (2010) M. Dolev, Y. Gross, Y. C. Chung, M. Heiblum, V. Umansky, and D. Mahalu, Phys. Rev. B 81, 161303 (2010).
- Chickering et al. (2013) W. E. Chickering, J. P. Eisenstein, L. N. Pfeiffer, and K. W. West, Phys. Rev. B 87, 075302 (2013).
- Banerjee et al. (2017) M. Banerjee, M. Heiblum, A. Rosenblatt, Y. Oreg, D. E. Feldman, A. Stern, and V. Umansky, Nature 545, 75 (2017).
- Banerjee et al. (2018) M. Banerjee, M. Heiblum, V. Umansky, D. E. Feldman, Y. Oreg, and A. Stern, Nature 559, 205 (2018).
- Wixforth et al. (1986) A. Wixforth, J. P. Kotthaus, and G. Weimann, Phys. Rev. Lett. 56, 2104 (1986).
- Paalanen et al. (1992) M. A. Paalanen, R. L. Willett, P. B. Littlewood, R. R. Ruel, K. W. West, L. N. Pfeiffer, and D. J. Bishop, Phys. Rev. B 45, 11342 (1992).
- Willett et al. (1993) R. L. Willett, R. R. Ruel, K. W. West, and L. N. Pfeiffer, Phys. Rev. Lett. 71, 3846 (1993).
- Willett et al. (2002) R. L. Willett, K. W. West, and L. N. Pfeiffer, Phys Rev Lett 88, 066801 (2002).
- Friess et al. (2018) B. Friess, V. Umansky, K. von Klitzing, and J. H. Smet, Phys Rev Lett 120, 137603 (2018).
- Friess et al. (2020) B. Friess, I. A. Dmitriev, V. Umansky, L. Pfeiffer, K. West, K. von Klitzing, and J. H. Smet, Phys. Rev. Lett. 124, 117601 (2020).
- Friess et al. (2017) B. Friess, Y. Peng, B. Rosenow, F. von Oppen, V. Umansky, K. von Klitzing, and J. H. Smet, Nature Physics 13, 1124 (2017).
- Drichko et al. (2011) I. L. Drichko, I. Y. Smirnov, A. V. Suslov, and D. R. Leadley, Phys. Rev. B 83, 235318 (2011).
- Drichko et al. (2016) I. L. Drichko, I. Y. Smirnov, A. V. Suslov, Y. M. Galperin, L. N. Pfeiffer, and K. W. West, Phys. Rev. B 94, 075420 (2016).
- Note (1) Previous work in Ref. Wixforth et al. (1986) explains the velocity shift with the conductivity. Such an analysis may not be suitable here because our ultra-high mobility 2DES has a very long transport scattering time ns comparable to the SAW frequency.
- White and Voltmer (1965) R. M. White and F. W. Voltmer, Applied physics letters 7, 314 (1965).
- Wu et al. (2023) M. Wu, X. Liu, R. Wang, X. Lin, and Y. Liu, “A high-performance surface acoustic wave sensing technique,” (2023), arXiv:2311.01718 [physics.app-ph] .
- Note (2) See supplementary material for a detailed description of our setup, which includes Refs. Sullivan et al. (1990); Durdaut et al. (2019).
- Note (3) See supplementary material for more information.
- Chen et al. (2003) Y. Chen, R. M. Lewis, L. W. Engel, D. C. Tsui, P. D. Ye, L. N. Pfeiffer, and K. W. West, Phys. Rev. Lett. 91, 016801 (2003).
- Note (4) Such behavior is surprising but not inconsistent with the previous report, since our frequency is much lower than the geometric resonance condition Willett et al. (1993, 2002).
- Chung et al. (2019) Y. J. Chung, K. W. Baldwin, K. W. West, N. Haug, J. van de Wetering, M. Shayegan, and L. N. Pfeiffer, Nano Letters 19, 1908 (2019).
- Sullivan et al. (1990) D. Sullivan, D. Allan, D. Howe, and F. Walls, Inst. Stand. Technol. Technical Note 1337 (1990).
- Durdaut et al. (2019) P. Durdaut, M. Höft, J.-M. Friedt, and E. Rubiola, Sensors 19, 185 (2019).
I Supplementary Materials
I.1 I. Calibrating our SAW measurement
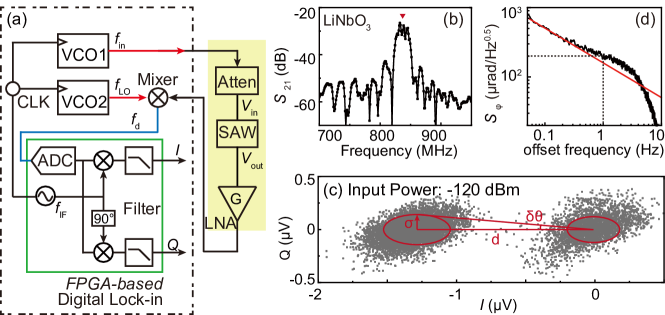
We introduce a superheterodyne-scheme radio frequency lock-in technique which can measure the phaseshift () of the delay-line device. The whole setup is optimized for the best phase noise background and stability; see ref. Wu et al. (2023) for detailed discussion. A schematic diagram of the system is shown in Fig. S1(a). We use fractional phase-locked-loop (PLL) to generate two single-frequency signals and whose frequencies are linked to the reference clock frequency by and respectively; , and are integer values. is attenuated and sent to the SAW device which attenuates the amplitude by and introduce a phase delay . The output signal of the device will be magnified by a broadband low noise amplifier (LNA) and then multiply with at the mixer. We then use a FPGA-based digital lock-in technique to digitize and analyze the differential frequency component . The I/Q component obtained from the quadrature demodulation is able to deduce the amplitude and phase of .
We calibrate the measurement system using a delay-line device made from a LiNbO3 (64∘-Y cut) substrate whose center frequency is 837MHz, see the spectrum in Fig. S1(b). In order to analyze the electronic white noise background, we send a 1 fW (-120 dBm), 837-MHz signal with an on-off modulation using a mechanical switch (10mHz, 70 duty cycle). The demodulation output ( and ) using resolution bandwidth of about 2 Hz is plotted in Fig. S1(c). When the switch is off, no signal is sent into the device and the demodulation output origins from the leaking signal, resulting in the right cluster of points in Fig. S1(c). When the switch is on, the detected signal is expected to be -155 dBm after attenuated by the cables (about -5dB ) and the device (about -30dB), corresponding to the left cluster of points in Fig. S1(c). The two clusters are separated by a distance 1.29 V and their standard deviation is 0.24 V, consistent with a equivalent -170 dBm electronic noise background. The phase resolution limited by such electrical noise background is rad at -120 dBm input power, and becomes better than 0.2 mrad when the input signal is about -60 dBm.
We can increase the signal amplitude to increase the phase resolution. However, this enhance has a limit at large signal amplitude when the phase noise of and dominates over the electronic noise Sullivan et al. (1990); Durdaut et al. (2019). Fig. S1(d) shows the phase noise spectrum at -61 dBm (about 1 nW) input RF power. The measured phase noise spectral density (f) is proportional to at frequencies below 1 Hz (the red solid line), consistent with the frequency jittering of the signal source. It equals about 0.2 mrad/Hz 0.5 at 1 Hz, leading to bounded random phase drift of about 0.3 mrad (i.e. constant Allan deviation).
I.2 II. The temperature response of
In this section, we discuss two different mechanism of temperature induced SAW velocity shift.
Usually, the acoustic velocity increases when temperature reduces, and a relation is expected in regular materials, e.g. see ref. Wu et al. (2023). At very low temperatures 4 K, we observe a surprising decrease of the SAW velocity in a delay-line sample made from an intrinsic GaAs substrate without any 2DES. The temperature dependence of the SAW velocity shift of this sample is shown in Fig. S2(a) and (b). Although we have not figure out the mechanism behind this peculiar behavior, we find that remains basically unchanged at temperatures below 200mK. The electron-phonon coupling becomes extremely weak at temperature below 1 K and the 2DES is believed to be cooled by contacts. It is unlikely that the heat generated by the 500 nA current passing through the high mobility 2DES, which is less than 1 nW, can heat up the lattice to above 50 mK. Furthermore, the heating power of this current is roughly proportional to magnetic field, because the 2-point resistance of these ultra-high mobility 2DES is approximately at magnetic fields T. This is also inconsistent with the oscillating behavior of our measured .
Besides the lattice effect, the quantum phase in 2DES itself is also sensitive to temperature so that can also be influenced. In Fig. S2(c), we show the vs. measured at different temperatures. The traces taken at different temperature are offset so that the peak at strong integer quantum Hall effects such as , 2 and 3 as well as at low magnetic field T, which is assumed to be insensitive to temperatures, are aligned. The Fig. S2(d) shows at T where the largest temperature dependence is seen. has a linear dependence on and is about 0.2 ppm/mK, and saturates below about 70 mK. Therefore, it is only possible to achieve the 10 ppm amplitude of if the 2DES is heated up to about 120 mK. On the other hand, we show measured using 500 nA current in Fig. S2(e). At and , where the spontaneous unidirectional charge density wave phase is stabilized, a clear difference in is seen when the mixing chamber temperature raises from 64 mK to 100 mK, suggesting that the 2DES temperature is below 100 mK if the 500 nA passing through the device at fridge base temperature. Therefore the heating effect of 2DES is unlikely the leading cause of the large current-induced increase in the sound velocity.
I.3 III. Electron density fluctuation
In this section, we provide a rough estimation of the electron density fluctuation of 2DES induced by SAW. The SAW speed m/s is much smaller than the Fermi velocity of charged quasiparticles ( m/s), and the transport scattering time is of the same order as the SAW period. We can assume that the response of 2DES to the SAW-induced electric field is fast enough so that the 2DES is almost always at equilibrium and the problem can be solved statically. The propagating piezoelectric field introduced by SAW at a given time (e. g. ) is
| (1) |
where denotes the wavevector of the SAW. We then have the SAW-induced external potential is
| (2) |
Using Thomas-Fermi screening model, the induced charge is
| (3) |
where is the 2DES’s compressibility, i.e. the density of state at Fermi energy for Fermi sea. And we assume the 2DES as a flat plate of uniform thickness nm and neglect the stray field. The screened potential is the sum of the external potential and the induced potential
| (4) |
can be calculated from using the Gaussian law
| (5) |
Combining the above relations, the induced potential can be deduced by the following equation self-consistently.
| (6) |
It is easy to see that
| (7) |
In GaAs , the density of state in 2DES at zero field is . The induced potential cancels the external potential if . We can deduce the induced electron density.
| (8) |
If the 2DES is incompressible, i.e. , and are both zero and the interaction between 2DES and SAW vanishes. The induced electrons with propagate along with the SAW. The power dissipation and phase delay of SAW occur when induced electrons are scattered by impurities or the quasiparticle velocity is comparable or less than the SAW velocity.
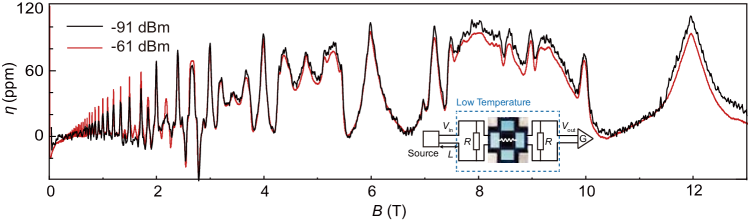
can be estimated from the signal amplitude received by the output IDT. In our experiment as shown by the inset of Fig. S3, the typical input RF power is -61 dBm (about 1 nW) and the output is about -97 dBm. The cable attenuation is about -5 dB at 600 MHz so that the power at the output IDT is -92 dBm. The IDT capacitance 20 pF corresponds to 10 impedance at 600 MHz, sufficiently small to be neglected. We can estimate that the voltage at the receiving IDT is about 10 V, leading to cm-2 electron density fluctuation, orders of magnitude smaller than the density fluctuation of the 2DES itself ( cm-2 even in very high-mobility samples Chung et al. (2019)).
In the experiment, the SAW excitation power (-61 dBm) is a trade-off between the principle of “non-perturbative” measurement and the signal-to-noise ratio (SNR). Namely, the power should be sufficiently low so that is negligible, while it should be large enough to resolve interesting phenomena. The proper input power is chosen by the following rationale. We first measure using the lowest possible power, e.g. -91 dBm which corresponds to cm-2. We then increase the power to -61 dBm. We find that the measured two are almost identical, see Fig. S3, suggesting that -61 dBm is sufficiently low. The power received by our lock-in amplifier is about -92 dBm. Our setup has -170 dBm noise background when using 300 ms time constant (corresponds to about 0.3 Hz effective noise bandwidth). The 80 dB SNR ratio leads to about 0.1 ppm resolution in , sufficiently high for this study.
I.4 IV. near integer fillings
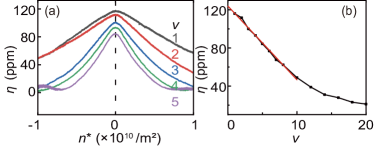
Near the integer Landau level filling factors , we observe “V”-shape maxima instead of plateaus in . This might be related to the finite compressibility of Wigner crystal formed by the dilute quasiparticles/quasiholes whose effective filling factor is small Chen et al. (2003). In Fig. S4(a), we observe a linear dependence between and the effective quasi-particle density .
at exact integer fillings increases when the quantum Hall state becomes stronger. We summarize at different integer filling in Fig. S4(b). has a rather linear dependence on at , whose intercept at is about ppm. marks the maximum effect the 2DES poses on the SAW and can be used to normalization .
I.5 V. The origin of the second harmonics
As shown in Fig. 3 of the manuscript, the SAW velocity shift is proportional to the amplitude of current. Therefore, an AC current passing through the sample
| (9) |
induces a SAW velocity shift
| (10) |
The Fourier series of can be expanded as
| (11) |
where is a non-negative even integer. The dominate component of the signal is second harmonics, whose amplitude is
| (12) |
Therefore, we can measure and deduce . We can also deduce by
| (13) |
I.6 VI. Data using lower SAW frequency
We repeat the acoustic study in another sample. The IDT period is 12 m and the SAW resonance frequency is MHz. The primary feature of in this device (see Fig. S5) is similar to the data reported in the main text. Similarly, decreases with increasing temperature and finally vanishes when 250 mK. We conclude that the phenomena we reported in the manuscript have no dependence on the SAW frequency and wavelength.
I.7 VII. Data from a lower mobility sample
For comparison, we perform similar acoustic study on a lower mobility sample. The electron density of the 2DES is cm-2 and its low-temperature mobility is about cm2/(Vs). 700 ppm at = 1 is larger in this sample, because the 2DES is shallower and the interaction between 2DES and SAW is stronger. Thanks to this large , we can measure directly with DC current, similar to the Fig. 3(a) data in the main text. The threshold current is about 200 nA for both the = 1 QHS and the = 2/3 FQHS, see Fig. S6(a). Therefore, integer and fractional QHS exhibit similar CIVS if the quasiparticles are randomly localized and no Wigner crystal exists.
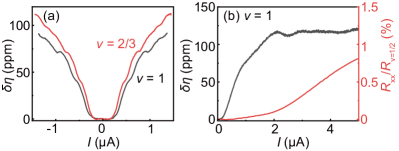
Fig. S6(b) shows as a function of the DC current at = 1. increases when the current increases above the threshold. It saturates at large current 2 A. Meanwhile, the differential longitudinal resistance increases by less than a percent, signaling that the integer QHS is still far below breakdown.
I.8 VIII. Device fabrication
The samples are 5 × 5 mm square cleaved directly from a GaAs/AlGaAs wafer grown via molecular beam epitaxy. The 30-nm-wide quantum well locates at 390 nm below the surface. We use three -doping layers, the deepest one is about 80 nm below the quantum well. The low temperature mobility of the 2DES is about cm-2/(V s).
We make ohmic contacts at the four corners of the sample by depositing Ge/Au/Ni/Au alloy and annealing at 440 °C for 30 minutes. A = 1.2 mm square Van der Pauw mesa is then created by wet etching using a :: solution (240:8:1) for 4 minutes. The etching depth is approximately 800nm. We pattern the interdigital transducers (IDTs) with evaporated 400 ÅAl using a maskless laser lithography system and lift-off process. Each IDT has 170 pairs of fingers with a periodicity of = 5 m. The center-to-center spacing of opposite pair of IDTs is 2450 m.