The Gaia alerted fading of the FUor-type star Gaia21elv
Abstract
FU Orionis objects (FUors) are eruptive young stars, which exhibit outbursts that last from decades to a century. Due to the duration of their outbursts, and to the fact that only about two dozens of such sources are known, information on the end of their outbursts is limited. Here we analyse follow-up photometry and spectroscopy of Gaia21elv, a young stellar object, which had a several decades long outburst. It was reported as a Gaia science alert due to its recent fading by more than a magnitude. To study the fading of the source and look for signatures characteristic of FUors, we have obtained follow-up near infrared (NIR) spectra using Gemini South/IGRINS, and both optical and NIR spectra using VLT/X-SHOOTER. The spectra at both epochs show typical FUor signatures, such as a triangular shaped -band continuum, absorption-line dominated spectrum, and P Cygni profiles. In addition to the typical FUor signatures, [O i], [Fe ii], and [S ii] were detected, suggesting the presence of a jet or disk wind. Fitting the spectral energy distributions with an accretion disc model suggests a decrease of the accretion rate between the brightest and faintest states. The rapid fading of the source in 2021 was most likely dominated by an increase of circumstellar extinction. The spectroscopy presented here confirms that Gaia21elv is a classical FUor, the third such object discovered among the Gaia science alerts.
keywords:
Stars: variables: T Tauri – stars: pre-main sequence1 Introduction
Studying the accretion in young stellar objects (YSOs) is important to understand their formation. Most of what we know about accretion in YSOs is based on the magnetospheric accretion scenario, according to which the material accretes onto the forming star from the infalling envelope through the disk, by following the magnetospheric lines (Hartmann et al., 2016). The accretion rates of YSOs are known to be highly variable, with extreme cases of eruptive YSOs, which experience outburst events, when their luminosity increases up to two orders of magnitude. These events are detected as 2-5 mag brightening in optical and near-infrared (NIR) bands. During the outbursts the mass accretion rate can increase from 10-8 yr-1 in quiescence to 10-4 yr-1 (Audard et al., 2014, Fischer et al., 2022). Studies with large samples of objects indicate that young stars experience these events once every years (e.g. Fischer et al., 2019). Episodic accretion is one of the possible explanations for the observed large luminosity spread of young stellar objects (Fischer et al., 2022). FU Orionis objects (FUors) are well-studied examples of episodic accretion (Hartmann & Kenyon, 1996). FUors are low-mass () eruptive YSOs that exhibit large-amplitude (4 mag) outbursts at optical and infrared wavelengths. These outbursts are expected to last up to a century, suggesting that these events will not only increase the final stellar mass by a significant amount, but also affect the evolution of the circumstellar disc. The representative characteristics of FUors are brightness increase on a time scale of 1-10 yr, P Cygni profile of H, Li i 6707 Å absorption, strong CO absorption features, triangular shape of the -band continuum due to the strong water absorption bands on both sides of the -band window, typical of late M-type stars (Hartmann & Kenyon, 1996; Connelley & Reipurth, 2018). So far the number of confirmed FUors is limited to no more than two dozens (Audard et al., 2014). One of the important, so far unclear points is the end of the FUor outbursts, i.e. their return to quiescence. FUor outbursts are expected to end when the inner disc depletes. However, due to the typically decades-long duration of the outbursts, no bona fide FUor has returned to quiescence yet, apart from cases of short, temporary halt in the accretion, e.g. V899 Mon (Ninan et al., 2015; Park et al., 2021) and V346 Nor (Kraus et al., 2016, Kóspál et al., 2020). Another example is V1647 Ori, an eruptive YSO that has shown some FUor characteristics (Aspin et al., 2009), and returned to quiescence after a ten-years long outburst (Semkov et al., 2018; Giannini et al., 2018). The spectroscopic deviation of V1647 Ori from well-known FUors, however, ruled out its FUor classification (Connelley & Reipurth, 2018).
Therefore, it is not known whether the end of FUor outbursts is an abrupt event when accretion suddenly stops and the brightness drops back to the quiescent level in 1-2 years, or it is a slow gradual decrease of the accretion rate resulting in a slowly decreasing light curve over perhaps decades. The first scenario would indicate some instability, like the thermal instability model proposed by Bell & Lin (1994). To understand how FUors end their outbursts, it is important to increase their sample.
One of the best tools to discover the brightening or fading of eruptive young star candidates is the Gaia Photometric Science Alerts system, due to its large sky coverage and typically monthly cadence (Hodgkin et al., 2021). Several eruptive YSOs have already been discovered based on the Gaia Science Alerts, including the FUors Gaia17bpi (Hillenbrand et al., 2018) and Gaia18dvy (Szegedi-Elek et al., 2020), and the EX Lupi-type eruptive YSOs (EXors) Gaia18dvz (Hodapp et al., 2019), Gaia20eae (Ghosh et al., 2022; Cruz-Sáenz de Miera et al., 2022) and Gaia19fct (Park et al., 2022). Some additional eruptive YSOs were found, which cannot be classified as either a FUor or an EXor, such as Gaia19ajj (Hillenbrand et al., 2019), Gaia19bey (Hodapp et al., 2020), and Gaia21bty (Siwak et al., submitted). Two Gaia alerted sources with light curves similar to eruptive YSOs, Gaia20bwa and Gaia20fgx (Nagy et al., 2022), turned out to be classical T Tauri stars (CTTS), while the brightening of another Gaia alerted YSO, V555 Ori (Gaia17afn), was confirmed to be caused by variable circumstellar extinction, rather than a change in its accretion rate (Nagy et al., 2021). Here we present a study of a previously known YSO, which triggered the Gaia Science Alerts system due to its fading.
Gaia21elv (ESO H-148 or 2MASS J08410676-4052174, = 08h 41m 0675, = -40∘ 52′ 1744) had a Gaia alert on 2021 October 6 due to its quick fading by 1.2 mag over 18 months. Its archival photometry based on photographic plates of the SuperCOSMOS Sky Survey (SSS) showed a long-term brightening (Contreras Peña et al., 2019). It is a known young, Class II type star (Pettersson & Reipurth, 1994, Marton et al., 2019), associated with the Vela Molecular Ridge (Pettersson & Reipurth, 1994), and in particular, with the RCW 27 HII region located at a distance of 1 kpc (Pettersson, 2008). Its Gaia DR3 (Gaia Collaboration et al., 2022) parallax is 1.07270.0397 mas. The Renormalised Unit Weight Error (RUWE) of 1.291 and the astrometric excess noise of 0.437 mas suggest that the astrometry is accurate. We derived a zero-point correction of 0.02513 based on Lindegren et al. (2021) for this parallax. After the zero-point correction, the Gaia DR3 parallax can be converted to a distance of 910.933.7 pc, which we use in this paper. This distance is close to the estimate of pc by Bailer-Jones et al. (2021).
In this paper, we provide spectroscopic evidence that Gaia21elv is a FUor, and discuss the cause of its fading that triggered the Gaia Alerts system. We describe the photometric and spectroscopic observations in Sect. 2 and present their results in Sect. 3. We analyse the FUor signatures in the NIR spectra in Sect. 4, discuss the nature of the fading of the source, and provide a comparison to other similar sources. We summarize our main findings in Sect. 5.
2 Observations
2.1 Optical photometry
In 2022 June, we obtained optical photometric observations of Gaia21elv with the 60-cm Ritchey-Chrétien Rapid Eye Mount (REM) telescope operated by the Italian National Institute for Astrophysics (INAF) at La Silla (Chile) using its ROS2 instrument, an optical imager operating at four simultaneous passbands (Sloan ) with a field of view (FoV) of 9191 and pixel scale of 058. Three images were taken per filter on four nights, 2022 June 5, 6, 8, and 9. After the usual bias and flat field correction, and removal of hot pixels, we obtained aperture photometry for Gaia21elv and about 15 comparison stars in the FoV. We selected the comparison stars from the APASS9 catalog (Henden et al., 2015) making sure that they are sufficiently constant in brightness (mag). We calculated the -band brightness of the comparison stars by plotting their spectral energy distribution (SED) using APASS9 and 2MASS magnitudes (Cutri et al., 2003) and interpolating between these points for the effective wavelength of the filter, 1.05m. We used an aperture radius of 6 pixels (35) and sky annulus between 20 and 40 pixels (1168 and 2336). Because all comparison stars were much bluer than Gaia21elv, in order to avoid introducing large uncertainties by extrapolation, we converted the instrumental magnitudes by averaging the calibration factors of all comparison stars without fitting a colour term. The results can be seen in Table 2.
Further observations of the target have been performed with REM between 2022 Oct 26 and 2023 Jan 4, during 12 nights. These observations, taken in Sloan passbands, were uploaded to the BHTOM service.111BHTOM - Black Hole TOM: www.bhtom.space 40, 38 and 44 images were reduced in Sloan , respectively.
Photometric observations were obtained with the PROMPT6 telescope located at Cerro Tololo Inter-American Observatory in Chile. This telescope is a part of SkyNET robotic network and is supplied with FLI CCD camera with 15.1 15.1 arcmin field-of-view (2048 2048 pixels, 0.44 arcsec/pix). All 42 observations (14 frames per band) were taken in Johnson-Cousins , and bands and uploaded to the BHTOM service, where they were reduced and converted to standard magnitudes (in APASS/V, APASS/r and APASS/i respectively).
We obtained photometric observations with the 1.54m Danish telescope, located at La Silla, Chile. The telescope is equipped with the CCD camera (E2V231-42) in the Cassegrain focus, cooled by liquid nitrogen. The FoV is 13.7 13.7 arcmin (2048 2048 pixels; pixel scale of 0.4 arcsec/pixel). The filters used were Johnson-Cousins . In all cases, the exposure time was 90 seconds.
We collected data using the 50cm CDK telescope equipped with a QHY268M pro camera. This telescope (ROTUZ) is part of the DeepSkyChile222https://www.deepskychile.com/en, and belongs to the Janusz Gil Institute of Astronomy, University of Zielona Gora, Poland. We reduced the data by applying bias, dark, and flat correction using AstroImageJ software (Collins et al., 2017). The photometry was done using the BHTOM server. The photometry done using the BHTOM server is based on the method described in Zieliński et al. (2019) and Zieliński et al. (2020).
2.2 Infrared photometry
In 2022 June, we obtained infrared photometric observations with the REM, using the infrared imaging camera, REMIR. The reduction of the images, performed with our own IDL routines, included the construction and subtraction of a sky image, and flat-fielding. We extracted the instrumental magnitudes for the target as well as for all good-quality 2MASS stars (i.e. with a 2MASS photometric quality flag of AAA) in the field in an aperture with a radius of . No extended nebulosity is visible around the source on the 2MASS images. The final step was the determination of an average constant calibration factor between the instrumental and the 2MASS magnitudes of typically 30–50 stars, and this offset was applied to the target observations. The results can be found in Table 2.
REMIR was used again between October 2022 and January 2023 for -band imaging. Each image came from the five single images jittered along a circle thanks to a dithering wedge from which a median sky was derived. Every image was then sky-subtracted with the median sky. Subsequently, the five images were re-aligned and averaged into a single band exposure. Calibrated images were then uploaded to the BHTOM service, reduced and matched to 2MASS band as described above for the optical data.
We used mid-infrared photometry from the Wide-field Infrared Survey Explorer (WISE) and NEOWISE surveys from the NASA/IPAC Infrared Science Archive. NEOWISE observes the full sky on average twice per year with multiple exposures per epoch. For a comparison with the photometry from other instruments, we computed the average of multiple exposures of a single epoch. NEOWISE and photometry is known to display a photometric bias for saturated sources. We corrected for this bias using the correction curves given in the Explanatory Supplement to the NEOWISE Data Release Products. We derived the average of the uncertainties of the single exposures (err1). We also calculated the standard deviation of the points we averaged per season (err2). For the error of the data points averaged per epoch we used the maximum of err1 and err2.
2.3 Spectroscopy
We obtained high-resolution (R45,000) NIR spectra of Gaia21elv on 2020 November 14 (Program ID: GS-2020B-Q-218, PI: S. Park) using the Immersion GRating INfrared Spectrograph (IGRINS; Yuk et al., 2010; Park et al., 2014; Mace et al., 2016) of Gemini South, in the and bands. The spectrum was obtained with a slit size of 0.34″ 5″. Gaia21elv was observed with two sets of ABBA nodding observations to subtract the sky background better. The total exposure time of Gaia21elv was 192 sec with 24 sec exposure of each frame. The data were reduced using the IGRINS pipeline (Lee & Gullikson, 2017) for flat-fielding, sky subtraction, correcting the distortion of the dispersion direction, wavelength calibration, and combining the spectra. In order to correct for telluric absorption features, a nearby A0 telluric standard star (HIP 21514) was observed right before the target. Then, the telluric correction and flux calibration were applied as done in Park et al. (2018). Finally, barycentric velocity correction using barycorrpy (Kanodia & Wright, 2018) was applied ( = 16.715 km s-1).
A spectrum using the X-SHOOTER instrument of the Very Large Telescope (VLT) at ESO’s Paranal Observatory in Chile (Vernet et al., 2011) was taken on 2021 December 12 (Program ID: 108.23M6, PI: Z. Nagy). X-SHOOTER simultaneously covers a wavelength range from 300 nm to 2480 nm, and the spectra are divided into three arms, the ultraviolet (UVB, 300 – 550 nm), the visible (VIS, 500 – 1020 nm), and the near-infrared (NIR, 1000 – 2480 nm). The observations were performed with the narrow slits of 1′′, 0.9′′, and 0.4′′ in the UVB, VIS, and NIR respectively, leading to spectral resolution of R 5400, 8900, and 11600, respectively. The exposure time was 1800 s in each of the three arms. We obtained additional exposures with the 5′′ slits, which resulted in data without slit losses, which we used for the correct flux calibration of the spectra obtained with the narrower slits. The ABBAAB nodding pattern was used. The observations were processed with the official ESO pipeline. Telluric correction was performed using ESO’s Molecfit program (Kausch et al., 2015; Smette et al., 2015) running in the same EsoReflex environment (Freudling et al., 2013).
3 Results
3.1 Light and colour variations
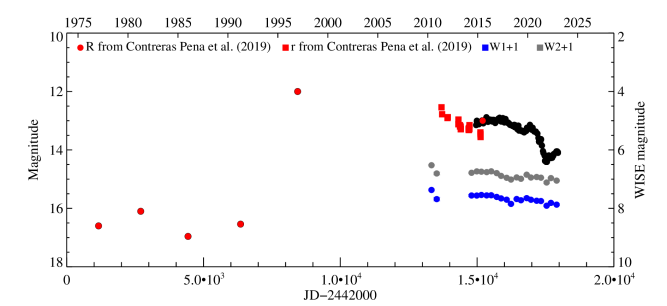
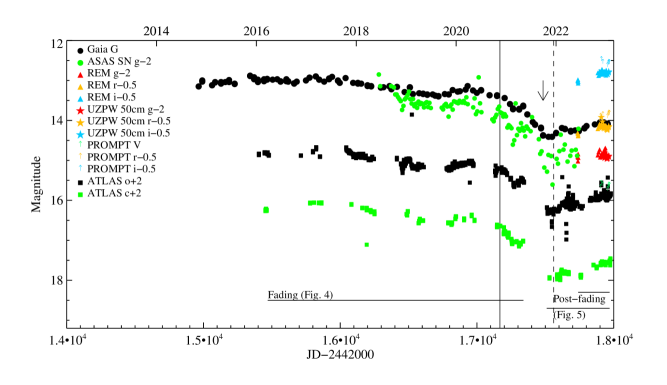
Figure 1 shows the optical and infrared light curves of Gaia21elv, including archival data from 1977 (Contreras Peña et al., 2019 and references therein), the All-Sky Automated Survey for Supernovae (ASAS-SN, Shappee et al., 2014, Kochanek et al., 2017), and the Asteroid Terrestrial-impact Last Alert System (ATLAS, Tonry et al., 2018, Smith et al., 2020, Heinze et al., 2018) survey downloaded from the ATLAS Forced Photometry web service (Shingles et al., 2021). Based on these data, the eruption occurred around between 1991 and 1996. The amplitude of the brightening was 4-4.5 mag from a quiescent 16.5-17 mag to around 12 mag in the -band. A slow fading of the source is already seen after 2010 based on data points from Contreras Peña et al. (2019) (collected from the AAVSO Photometric All Sky Survey (APASS) DR9 (Henden et al., 2015), the VST Photometric Halpha Survey (VPHAS) DR2 (Drew et al., 2014), the Bochum Galactic disc survey (Hackstein et al., 2015)), and the Gaia -band light curve.
In 2021, the source started a more rapid fading, and had a Gaia alert in 2021 October due to its 1.2 mag fading in 18 months. After the Gaia alert, a temporary brightening by about 0.2 mag was seen in early 2022, and after that, the source stayed at the same brightness for several months, around 14.25 mag in Gaia -band. Between 2022 July and November, the source brightened again, by about 0.3 mag as is seen in the lower panel of Fig. 1. A slow long-term fading is also seen in the WISE data points.
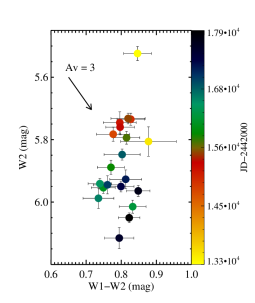
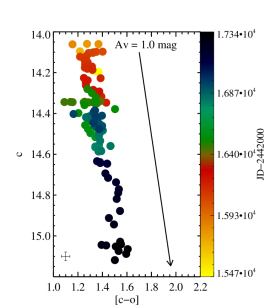
Figure 2 shows a colour-magnitude diagram based on the WISE and bands. As the changes are mostly grey, extinction can be excluded as the physical mechanism between the flux changes observed at the WISE wavelengths.
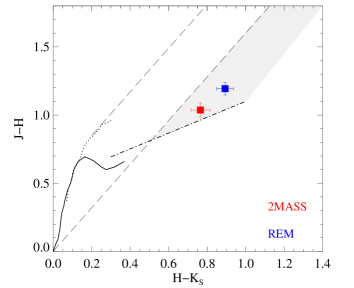
Figure 3 shows the vs diagram for the bright state (2MASS data point from 1999 February) and for the faint state (REM data point from 2022 June). The difference between the two data points in this diagram ( mag, mag, mag) may be consistent with the reddening of the source between 1999 and 2022. In this case, the colour change implies a visual extinction increase by mag. However, the colour change in the vs diagram can also be caused by accretion. Eruptive young stars in the vs plot usually move toward or away from the main sequence (e.g. Szegedi-Elek et al., 2020).
Figure 4 shows a colour-magnitude diagram during the fading, as shown in Fig. 1 based on the and band magnitudes from the ATLAS survey. There is an indication of a long-term increasing trend of the extinction. Since the period of the quick fading in 2021 is not sampled well by these data points (as seen in Fig. 1), it is not clear based on them, whether the increasing extinction also applies for this period.
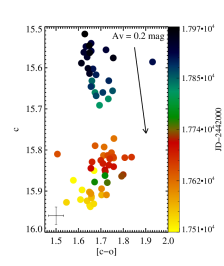
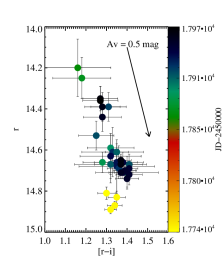
Figure 5 shows colour-magnitude diagrams after the fading of the source, based on the and band magnitudes from the ATLAS survey, versus and versus colour-magnitude diagrams based on our follow-up observations between 2022 June and 2023 January. The periods covered by these figures are also indicated in Fig. 1. These colour-magnitude diagrams show extinction-related variations between 2022 June and 2023 January. The colour-magnitude diagram based on the ATLAS and band also includes data points from a period between 2021 October and 2022 May. These data points do not show an extinction-related trend, indicating, that mechanisms other than the extinction may also play a role in this post-fading phase.
Based on the colour variations alone, it is not possible to make a conclusion on the origin of the brightness variations of Gaia21elv. The and band data from the ATLAS survey as well as the versus and versus colour-magnitude diagrams suggest extinction-related brightness variations both during the fading and the brightening. Such extinction-related variations are not seen in the WISE colour-magnitude diagrams, whereas the vs diagram can be interpreted both as a result of extinction and accretion. Therefore, we do not make a conclusion on the origin of the brightness variations based on the colour variations, and will further investigate it in Sect. 3.3.

3.2 Reddening and spectral features
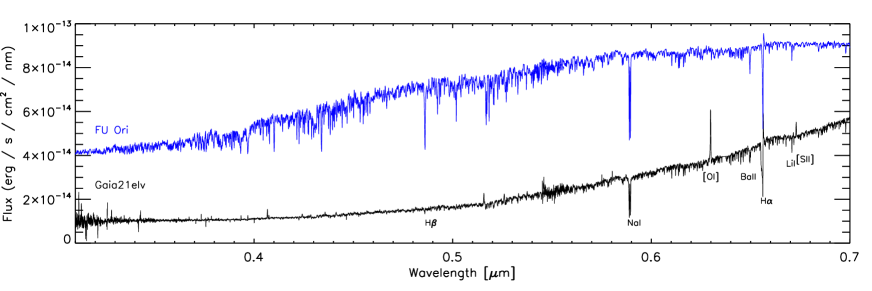
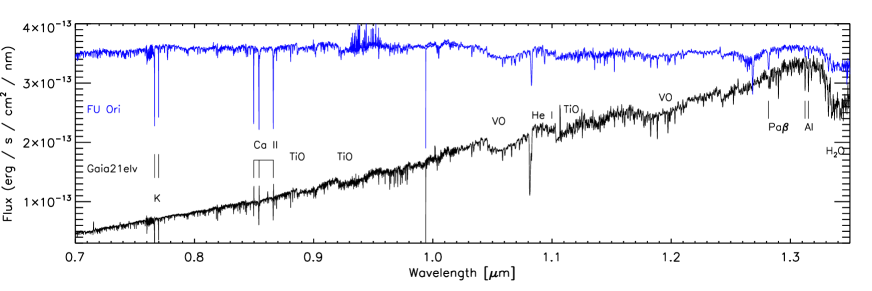

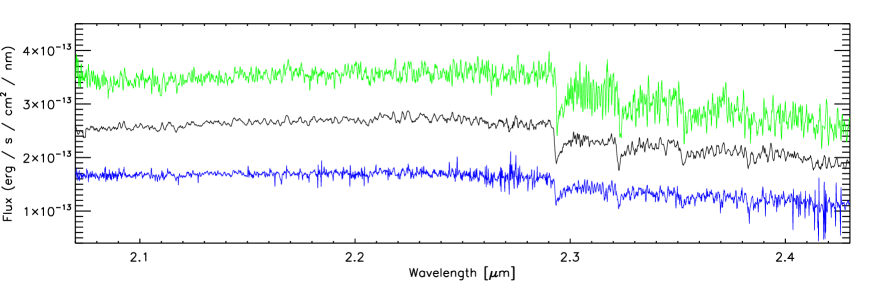
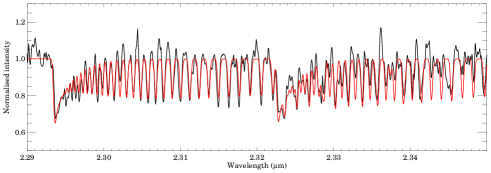
Figure 6 shows the spectra taken at the two epochs in optical and NIR using Gemini South/IGRINS and VLT/X-SHOOTER and their comparison to the VLT/X-SHOOTER spectrum of FU Ori.
Following the method of Connelley & Reipurth (2018), we used the X-SHOOTER spectrum to estimate the visual extinction toward the source by comparing it to the spectrum of FU Ori, which has a low and well known extinction (1.70.1 mag; e.g. Siwak et al., 2018, Lykou et al., 2022). We dereddened the spectrum of Gaia21elv with increasing until it matched the scaled, flux calibrated spectrum of FU Ori. The resulting is 4 mag, which suggests mag for Gaia21elv in its faint state.
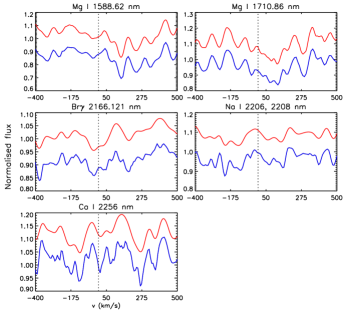
Table 1 lists the lines we identified in the VLT/X-SHOOTER spectrum of Gaia21elv. Most detected lines are seen in absorption, such as Ba ii, Li i, Na D, K i, Al i, He i, Pa, and Mg i (Fig. 7). Some of these absorption lines show two (or more) components, such as the Ba ii, He i, and Pa lines. Some lines show a P Cygni profile, such as H and H (Fig. 8) and the Ca ii triplet (Fig. 9). Forbidden lines of [O i], [Fe ii], and [S ii] were detected in emission (Fig. 10). These lines may indicate the presence of a jet associated with Gaia21elv, similarly to what was seen for the classical FUor V1057 Cyg (e.g. Szabó et al., 2021). Forbidden emission lines in young stars were also suggested to trace disk winds (Paatz & Camenzind, 1996, Iguchi & Itoh, 2016, Ballabio et al., 2020). The and -band spectra were observed at two different epochs: in 2020 November, just before the rapid fading of the source (Gemini South/IGRINS) and in 2021 December, soon after the Gaia alert reporting the fading (VLT/X-SHOOTER). These spectra display very similar features (Fig. 6), including a triangular shaped -band continuum and the CO-bandhead features in absorption, both typical FUor signatures. Fig. 11 shows lines detected at both epochs, such as Mg i, Br, Na i, and Ca i. The line profiles did not change significantly between the two epochs.


| Species | Lab. | Obs. | EW | FWHM | Note |
|---|---|---|---|---|---|
| [nm] | [nm] | [nm] | [nm] | ||
| S ii | 406.860 | 406.702 | 1.010.05 | 0.200.03 | emission |
| H | 410.171 | 410.038 | 0.050.01 | 0.100.01 | absorption |
| H | 434.047 | 433.850 | 0.130.03 | 0.320.01 | absorption |
| H | 486.129 | 485.997 | 0.130.01 | … | P Cygni absorption |
| H | 486.129 | 486.251 | 0.040.01 | 0.160.02 | P Cygni emission |
| Na D | 588.995 | 588.898 | 0.300.01 | 0.270.01 | absorption |
| Na D | 589.592 | 589.508 | 0.250.01 | 0.240.02 | absorption |
| O i | 630.030 | 629.801 | 0.280.02 | 0.290.01 | emission |
| Ba ii | 649.690 | 649.515 | 0.080.01 | 0.380.01 | absorption |
| H | 656.282 | 656.155 | 0.420.01 | … | P Cygni absorption |
| H | 656.282 | 656.377 | 0.090.01 | 0.180.02 | P Cygni emission |
| Li i | 670.776 | 670.785 | 0.030.01 | 0.130.01 | absorption |
| S ii | 673.082 | 672.960 | 0.050.01 | 0.280.01 | emission |
| Fe ii | 715.517 | 715.364 | 0.080.01 | 0.240.01 | emission |
| K i | 766.490 | 766.457 | 0.150.01 | 0.200.02 | absorption |
| K i | 769.896 | 769.851 | 0.100.01 | 0.200.02 | absorption |
| Ca ii | 849.802 | 849.647 | 0.050.01 | 0.190.02 | P Cygni absorption |
| Ca ii | 849.802 | 849.854 | 0.040.01 | 0.120.01 | P Cygni emission |
| Ca ii | 854.209 | 854.028 | 0.100.01 | 0.280.01 | P Cygni absorption |
| Ca ii | 854.209 | 854.276 | 0.060.01 | 0.160.01 | P Cygni emission |
| Ca ii | 866.214 | 866.043 | 0.090.01 | 0.230.01 | P Cygni absorption |
| Ca ii | 866.214 | 866.283 | 0.040.01 | 0.140.01 | P Cygni emission |
| Pa8 | 954.620 | 954.607 | 0.040.01 | 0.210.02 | absorption |
| He i | 1083.025 | 1081.46 | 0.600.10 | 1.200.20 | absorption, two components |
| Pa | 1281.807 | 1281.819 | … | … | absorption, two components |
| Al i | 1312.342 | 1312.382 | 0.060.01 | 0.180.01 | absorption |
| Al i | 1315.075 | 1315.107 | 0.070.01 | 0.220.01 | absorption |
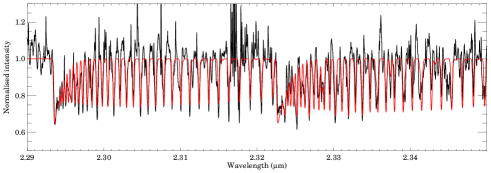
To interpret the CO bandhead features observed at the two epochs, we used an isothermal slab model to find a best-fitting CO column density and excitation temperature of the absorbing material, similarly to Kóspál et al. (2011) and Park et al. (2021). We found the best-fitting CO column density to be 1022 cm-2, and a best-fitting excitation temperature of K at the first epoch (Gemini South/IGRINS) and K at the later epoch (VLT/X-SHOOTER). The results are shown in Figure 12. In Sect. 4.1 we analyse the spectra in more detail and compare the observed features to those seen in FUors.
3.3 Spectral Energy Distribution modeling
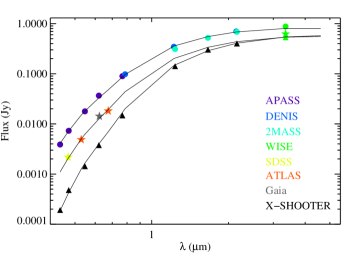
In the following, we analyse the Spectral Energy Distribution (SED) of Gaia21elv at three different epochs. To create a SED for the state of the maximum brightness, we used archival data from APASS9 (Henden et al., 2015), DENIS (Epchtein et al., 1994), 2MASS (Cutri et al., 2003), and the ALLWISE (Cutri et al., 2013) catalogues. A comparison of the DENIS -band flux from 1996 December with the APASS9 -band flux from 2010 December shows that the brightness of the star did not change significantly between these dates, thus the fact that the used archival data correspond to different epochs is not expected to affect the modeling of the SED in the bright state. In addition to the epoch of the bright state, we compiled an SED for 2020 Oct–Nov that is very close to the epoch of the Gemini/IGRINS spectrum, and as such, it is just before the fast fading phase of the source. We used the available ASAS-SN , Gaia and WISE data, as well as photometry in the cyan and orange bands of the ATLAS survey for this epoch. The third epoch we considered is the epoch of the VLT/X-SHOOTER spectrum in 2021 December, as it represents the faint state at the end of the fast fading of the source. We obtained synthetic photometry in the APASS9 and 2MASS bands from the X-SHOOTER spectrum, and also used the NEOWISE data point closest to this epoch. The three SEDs are shown in Fig. 13.
As we will discuss in Sec. 4, the properties of Gaia21elv resemble those of FU Orionis-type stars. In these objects the circumstellar matter is expected to form an accretion disc (Hartmann & Kenyon, 1996). To estimate the properties of the accretion disc in Gaia21elv at the three epochs, we modelled the SEDs using a steady, optically thick and geometrically thin viscous accretion disc, whose mass accretion rate is constant in the radial direction. This method was successfully applied to estimate the accretion rate in several eruptive YSOs including HBC 722 (Kóspál et al., 2016), V582 Aur (Ábrahám et al., 2018), 2MASS 22352345 + 7517076 (Kun et al., 2019), Gaia18dvy (Szegedi-Elek et al., 2020), V1057 Cyg (Szabó et al., 2021), and V1515 Cyg (Szabó et al., 2022). In this model, the temperature profile of the disc is defined based on Hartmann & Kenyon (1996) as:
| (1) |
where is the distance from the star, is the stellar radius, is the stellar mass, is the accretion rate, and are the gravitational and Stefan-Boltzmann constants, respectively. The model SED was calculated by integrating black-body emission in concentric annuli between the inner disc radius and the outer disc radius. The resulting SED was then reddened by different AV values.
One of the input parameters of the model is the inclination, and as it is unknown for Gaia21elv, we used an intermediate value of 45∘. We assumed a distance of pc, as derived above from the Gaia DR3 parallax and its zero-point correction. There is a known degeneracy in the model between the inner disc radius and AV. To break this degeneracy we adopted the AV value of 5.7 mag obtained from the X-SHOOTER spectrum in Sect. 3. This choice fixed the inner disc radius to , a reasonable value, as it is the same as determined for FU Ori by Zhu et al. (2007).
The remaining free parameters of the disc model are , AV, and . Finding the best and AV combinations was performed with minimization over a large grid in both the accretion rate and the extinction, by taking into account all flux values between 0.4 and 4.0 m. The formal uncertainties of the data points were set to a homogeneous 5% of the measured flux values. We ran several models assuming different outer disc radii in the range between 0.2 and 2 au, and found that the WISE data points are reasonably well fitted with au, though this value is less constrained than the other two parameters. The best-fitting visual extinctions and products of the stellar mass and the accretion rate are plotted in Fig. 14. Since the outcome of the model is the product , the true accretion rate depends on the stellar mass. However, FUors are typically low-mass objects (Hartmann & Kenyon, 1996), thus our obtained values provide a good approximation to the accretion rate.
Considering the results for all three epochs, the three data points suggest that the accretion rate followed a monotonic decay in the last 15 years. Our models suggest a slight increase of the extinction toward the source from 3.6 mag to 4.4 mag between the maximum brightness and the Gemini epoch in 2020 November. Remarkably, the quick fading in 2021, corresponding to the Gaia alert, was mostly caused by an increase in extinction. The accretion luminosity of the source also dropped in parallel to the accretion rate between the first and last epoch, from 106 L⊙ to 68 L⊙, although the absolute values depend on the unknown inclination angle, too.

4 Discussion
4.1 Classification of Gaia21elv as a FUor
To investigate, whether Gaia21elv is indeed a FUor, we used the criteria from Connelley & Reipurth (2018), which they list in their Table 3. In the following, we list these defining characteristics and check if Gaia21elv fulfills them.
-
-
The eruption is observed for each bona fide FUor, unlike for FUor-like and peculiar objects. This criterion is fulfilled for Gaia21elv. The date of the eruption can be constrained based on the light curve shown in Contreras Peña et al. (2019) in their figure B2, which includes data points from the literature starting from 1977 (Fig. 1). The outburst of Gaia21elv based on the long term light curve occurred between 1991 and 1996.
-
-
Bona fide FUors have well defined CO absorption features. Strong CO absorption was also observed for Gaia21elv (Fig. 12) at both of our observing epochs.
-
-
Water vapor bands can be identified in the NIR spectra of bona fide FUors, including the feature at 1.33 m and the triangular shaped -band continuum, which is due to water vapor bands on each end of the -band (Fig. 6). Gaia21elv shows these features at both epochs.
-
-
Bona fide FUors show other molecular bands in their -band spectra, such as those from vanadium oxide (at 1.05 m and 1.19 m) and titanium oxide (0.88, 0.92, and 1.11 m). The X-SHOOTER spectrum of Gaia21elv shows all these molecular bands as wide absorption features (Fig. 6).
-
-
Another characteristic of FUors is their hydrogen lines, especially the Pa, , , and lines, are in absorption, Br line is very weak, with the rest of the Brackett series not observed. For Gaia21elv the Pa and Pa lines are indeed seen in absorption, however, the other two Paschen lines are not detected. It was not possible to detect the Pa line due to the poor atmospheric transmission at its wavelength (1.87 m). The Br line shows a weak absorption, while the rest of the Brackett series is not detected, similarly to what was expected for FUors.
-
-
FUors show very few, if any, emission lines, and even those are typically the emission components of P Cygni profiles. Gaia21elv shows a few P Cygni profiles in H, H, and the Ca II triplet, and in addition to those, there are forbidden lines of [O i], [Fe ii], and [S ii] in emission. The absorption lines and P Cygni profiles typically detected in the spectra of FUors are related to the disc, while the forbidden emission lines trace a jet or disk wind. Forbidden emission lines are not always detected in the spectra of known FUors, but were identified for a few examples, including the classical FUors V2494 Cyg (Connelley & Reipurth, 2018 and references therein) and V1057 Cyg (Szabó et al., 2021), therefore, their detection does not rule out a classification as a bona fide FUor.
- -
-
-
Another spectroscopic signature of FUors is the He i line at 1.083 m, which is also present in the spectrum of Gaia21elv (Fig. 6). The He i line detected toward Gaia21elv is double-peaked, where the higher intensity component is largely blueshifted, detected at a velocity of around 400 km s-1, and the lower intensity component is seen at a velocity of around 25 km s-1 (Fig. 7). Most bona fide FUors show blueshifted absorption lines, with a mean velocity of 350 km s-1 (see Fig. 4. in Connelley & Reipurth, 2018).
Another characteristics of FUors is that their spectral type is wavelength-dependent (Hartmann & Kenyon, 1996). To check whether this applies to Gaia21elv, we used the VLT/X-SHOOTER spectrum, and compared it to the synthetic stellar spectra calculated by Coelho et al. (2005) in the 300 nm to 1.8 m wavelength range. These stellar templates are given for effective temperatures in the range between 3500 K and 6000 K in steps of 250 K. We compared the VLT/X-SHOOTER spectrum to these stellar templates at optical and at NIR wavelengths, separately. At optical wavelengths, the best match was found with the stellar template corresponding to an effective temperature of 5500250 K, while at NIR wavelengths, the best fit corresponds to an effective temperature of 3750250 K. This is consistent with the expectation for FUors, that the stellar type is wavelength-dependent.
Based on the above criteria from Connelley & Reipurth (2018) as well as its wavelength-dependent spectral type, we conclude that Gaia21elv can be classified as a bona fide FUor. This classification is consistent with the high accretion luminosity of the source implied by our accretion disc modelling.
4.2 On the recent fading of Gaia21elv
Until now, no bona fide FUor is known to have completely ended its outburst. This is why it is important to monitor their brightness variations, and study their fading episodes. A temporary fading of V346 Nor was reported by Kraus et al. (2016) and Kóspál et al. (2020), which was due to a decrease in the accretion rate, however, after the fading, the star brightened again to nearly reach its outburst brightness. Another eruptive young star, V899 Mon, which shows properties of both FUors and EXors, faded to quiescence for a little less than a year (Ninan et al., 2015; Park et al., 2021). However, this quiescent phase was followed by another outburst. In addition to their fading being temporary, neither V346 Nor, nor V899 Mon is a bona fide FUor. The long-term fading of a classical FUor, V1515 Cyg was recently reported by Szabó et al. (2022): its fading started around 2006 and is approximately consistent with an exponential decay with an e-folding time of 12 years. Another classical FUor, V733 Cep also shows long-term fading (Park et al., in prep.), which was found to be the result of a decrease in the accretion rate.
Brightness variations of young stars are only partly related to changes in the accretion rate (Fischer et al., 2022). The other main process is variable circumstellar extinction. To probe whether the fading of Gaia21elv was the result of a decrease of the accretion rate, we estimated the accretion rate by fitting the SEDs with an accretion disc model in Sec. 3. The accretion rates derived for Gaia21elv are typical of FUors (Fischer et al., 2022 and references therein). The accretion rate between the brightest and faintest states decreased by 36%. However, according to the accretion disc models fitted to the SEDs, the decreasing accretion rate was combined with increasing circumstellar extinction, especially between 2020 and 2022. It is most likely, that the increased circumstellar extinction dominated the rapid fading of the source that triggered the Gaia Alerts system in 2021. After the Gaia alert, the brightness of the source also started a slow increase, though it is still almost a magnitude fainter than in early 2020, before the start of this fading episode. The decrease found between the accretion rates at the brightest and faintest states indicates an e-folding time of about 25 years. Based on our results, the fading of Gaia21elv found by the Gaia alert is likely a temporary event. Future photometric and spectroscopic monitoring of the source is important to provide more information on the evolution of its outburst.
5 Summary
We analysed the photometry and spectroscopy of a young star exhibiting a long-term outburst and a recent fading alerted by the Gaia Science Alerts system.
Optical and NIR spectra confirm that Gaia21elv is a bona fide FUor. This is the third FUor which was found based on the Gaia alerts. In addition to the classical FUor signatures, forbidden emission lines were detected, which are typically tracing a jet or disk winds.
Fitting the SEDs at the maximum brightness and and its faint state using an accretion disc model suggests a decrease in the accretion rate. However, fitting the SED at an epoch close to the onset of the quick fading in late 2020-2021 indicates that this episode was mostly caused by an increase of circumstellar extinction.
In the future, a photometric and spectroscopic monitoring of Gaia21elv is important to characterize its behavior after its fading episode.
Acknowledgements
We thank the referee for comments which helped to improve our paper.
This project has received funding from the European Research Council (ERC) under the European Union’s Horizon 2020 research and innovation programme under grant agreement No 716155 (SACCRED).
We acknowledge support from the ESA PRODEX contract nr. 4000132054.
G.M. and Z.N. were supported by the János Bolyai Research Scholarship of the Hungarian Academy of Sciences.
G.M. has received funding from the European Union’s Horizon 2020 research and innovation programme under grant agreement No. 101004141.
Zs.M.Sz. acknowledges funding from a St Leonards scholarship from the University of St Andrews. For the purpose of open access, the author has applied a Creative Commons Attribution (CC BY) licence to any Author Accepted Manuscript version arising.
E.F. and T.G. acknowledge financial support from the project PRIN-INAF 2019 "Spectroscopically Tracing the Disk Dispersal Evolution (STRADE)".
We acknowledge ESA Gaia, DPAC and the Photometric Science Alerts Team (http://gsaweb.ast.cam.ac.uk/alerts).
This work used the Immersion Grating Infrared Spectrometer (IGRINS) that was developed under a collaboration between the University of Texas at Austin and the Korea Astronomy and Space Science Institute (KASI) with the financial support of the Mt. Cuba Astronomical Foundation, of the US National Science Foundation under grants AST-1229522 and AST-1702267, of the McDonald Observatory of the University of Texas at Austin, of the Korean GMT Project of KASI, and Gemini Observatory.
This work was supported by K-GMT Science Program (PID: GS-2020B-Q-218) of Korea Astronomy and Space Science Institute (KASI).
Based on observations collected at the European Southern Observatory under ESO programme 108.23M6.
This work has made use of data from the Asteroid Terrestrial-impact Last Alert System (ATLAS) project. The Asteroid Terrestrial-impact Last Alert System (ATLAS) project is primarily funded to search for near earth asteroids through NASA grants NN12AR55G, 80NSSC18K0284, and 80NSSC18K1575; byproducts of the NEO search include images and catalogs from the survey area. This work was partially funded by Kepler/K2 grant J1944/80NSSC19K0112 and HST GO-15889, and STFC grants ST/T000198/1 and ST/S006109/1. The ATLAS science products have been made possible through the contributions of the University of Hawaii Institute for Astronomy, the Queen’s University Belfast, the Space Telescope Science Institute, the South African Astronomical Observatory, and The Millennium Institute of Astrophysics (MAS), Chile.
This project used data obtained via BHTOM (https://bhtom.space), which has received funding from the European Union’s Horizon 2020 research and innovation program under grant agreements No. 101004719.
Data availability
The data underlying this article will be shared on reasonable request to the corresponding author.
References
- Ábrahám et al. (2018) Ábrahám P., et al., 2018, ApJ, 853, 28
- Aspin et al. (2009) Aspin C., et al., 2009, ApJ, 692, L67
- Audard et al. (2014) Audard M., et al., 2014, in Beuther H., Klessen R. S., Dullemond C. P., Henning T., eds, Protostars and Planets VI. p. 387 (arXiv:1401.3368), doi:10.2458/azu_uapress_9780816531240-ch017
- Bailer-Jones et al. (2021) Bailer-Jones C. A. L., Rybizki J., Fouesneau M., Demleitner M., Andrae R., 2021, AJ, 161, 147
- Ballabio et al. (2020) Ballabio G., Alexander R. D., Clarke C. J., 2020, MNRAS, 496, 2932
- Bell & Lin (1994) Bell K. R., Lin D. N. C., 1994, ApJ, 427, 987
- Bessell & Brett (1988) Bessell M. S., Brett J. M., 1988, PASP, 100, 1134
- Cardelli et al. (1989) Cardelli J. A., Clayton G. C., Mathis J. S., 1989, ApJ, 345, 245
- Coelho et al. (2005) Coelho P., Barbuy B., Meléndez J., Schiavon R. P., Castilho B. V., 2005, A&A, 443, 735
- Collins et al. (2017) Collins K. A., Kielkopf J. F., Stassun K. G., Hessman F. V., 2017, AJ, 153, 77
- Connelley & Reipurth (2018) Connelley M. S., Reipurth B., 2018, ApJ, 861, 145
- Contreras Peña et al. (2019) Contreras Peña C., Naylor T., Morrell S., 2019, MNRAS, 486, 4590
- Cruz-Sáenz de Miera et al. (2022) Cruz-Sáenz de Miera F., et al., 2022, ApJ, 927, 125
- Cutri et al. (2003) Cutri R. M., et al., 2003, 2MASS All Sky Catalog of point sources.. NASA/IPAC Infrared Science Archive
- Cutri et al. (2013) Cutri R. M., et al., 2013, Explanatory Supplement to the AllWISE Data Release Products, Explanatory Supplement to the AllWISE Data Release Products, by R. M. Cutri et al.
- Drew et al. (2014) Drew J. E., et al., 2014, MNRAS, 440, 2036
- Epchtein et al. (1994) Epchtein N., et al., 1994, Ap&SS, 217, 3
- Fischer et al. (2019) Fischer W. J., Safron E., Megeath S. T., 2019, ApJ, 872, 183
- Fischer et al. (2022) Fischer W. J., Hillenbrand L. A., Herczeg G. J., Johnstone D., Kóspál Á., Dunham M. M., 2022, arXiv e-prints, p. arXiv:2203.11257
- Freudling et al. (2013) Freudling W., Romaniello M., Bramich D. M., Ballester P., Forchi V., García-Dabló C. E., Moehler S., Neeser M. J., 2013, A&A, 559, A96
- Gaia Collaboration et al. (2022) Gaia Collaboration et al., 2022, arXiv e-prints, p. arXiv:2208.00211
- Ghosh et al. (2022) Ghosh A., et al., 2022, ApJ, 926, 68
- Giannini et al. (2018) Giannini T., Lorenzetti D., Antoniucci S., Boschin W., Harutyunyan A., 2018, The Astronomer’s Telegram, 12054, 1
- Hackstein et al. (2015) Hackstein M., et al., 2015, Astronomische Nachrichten, 336, 590
- Hartmann & Kenyon (1996) Hartmann L., Kenyon S. J., 1996, ARA&A, 34, 207
- Hartmann et al. (2016) Hartmann L., Herczeg G., Calvet N., 2016, ARA&A, 54, 135
- Heinze et al. (2018) Heinze A. N., et al., 2018, AJ, 156, 241
- Henden et al. (2015) Henden A. A., Levine S., Terrell D., Welch D. L., 2015, in American Astronomical Society Meeting Abstracts #225. p. 336.16
- Hillenbrand et al. (2018) Hillenbrand L. A., et al., 2018, ApJ, 869, 146
- Hillenbrand et al. (2019) Hillenbrand L. A., Reipurth B., Connelley M., Cutri R. M., Isaacson H., 2019, AJ, 158, 240
- Hodapp et al. (2019) Hodapp K. W., et al., 2019, AJ, 158, 241
- Hodapp et al. (2020) Hodapp K. W., et al., 2020, AJ, 160, 164
- Hodgkin et al. (2021) Hodgkin S. T., et al., 2021, A&A, 652, A76
- Iguchi & Itoh (2016) Iguchi N., Itoh Y., 2016, Research in Astronomy and Astrophysics, 16, 30
- Kanodia & Wright (2018) Kanodia S., Wright J., 2018, Research Notes of the American Astronomical Society, 2, 4
- Kausch et al. (2015) Kausch W., et al., 2015, A&A, 576, A78
- Kochanek et al. (2017) Kochanek C. S., et al., 2017, PASP, 129, 104502
- Kóspál et al. (2011) Kóspál Á., et al., 2011, ApJ, 736, 72
- Kóspál et al. (2016) Kóspál Á., et al., 2016, A&A, 596, A52
- Kóspál et al. (2020) Kóspál Á., Szabó Z. M., Ábrahám P., Kraus S., Takami M., Lucas P. W., Contreras Peña C., Udalski A., 2020, ApJ, 889, 148
- Kraus et al. (2016) Kraus S., Caratti o Garatti A., Garcia-Lopez R., Kreplin A., Aarnio A., Monnier J. D., Naylor T., Weigelt G., 2016, MNRAS, 462, L61
- Kun et al. (2019) Kun M., Ábrahám P., Acosta Pulido J. A., Moór A., Prusti T., 2019, MNRAS, 483, 4424
- Lee & Gullikson (2017) Lee J.-J., Gullikson K., 2017, igrins/plp v2.2.0-alpha.4, doi:10.5281/zenodo.438353, https://doi.org/10.5281/zenodo.438353
- Lindegren et al. (2021) Lindegren L., et al., 2021, A&A, 649, A4
- Lykou et al. (2022) Lykou F., et al., 2022, A&A, 663, A86
- Mace et al. (2016) Mace G., et al., 2016, in Evans C. J., Simard L., Takami H., eds, Society of Photo-Optical Instrumentation Engineers (SPIE) Conference Series Vol. 9908, Ground-based and Airborne Instrumentation for Astronomy VI. p. 99080C, doi:10.1117/12.2232780
- Marton et al. (2019) Marton G., et al., 2019, MNRAS, 487, 2522
- Meyer et al. (1997) Meyer M. R., Calvet N., Hillenbrand L. A., 1997, AJ, 114, 288
- Nagy et al. (2021) Nagy Z., et al., 2021, MNRAS, 504, 185
- Nagy et al. (2022) Nagy Z., et al., 2022, MNRAS, 515, 1774
- Ninan et al. (2015) Ninan J. P., et al., 2015, ApJ, 815, 4
- Paatz & Camenzind (1996) Paatz G., Camenzind M., 1996, Astrophysical Letters and Communications, 34, 315
- Park et al. (2014) Park C., et al., 2014, in Ground-based and Airborne Instrumentation for Astronomy V. p. 91471D, doi:10.1117/12.2056431
- Park et al. (2018) Park S., et al., 2018, ApJS, 238, 29
- Park et al. (2021) Park S., et al., 2021, ApJ, 923, 171
- Park et al. (2022) Park S., et al., 2022, ApJ, 941, 165
- Pettersson (2008) Pettersson B., 2008, in Reipurth B., ed., , Handbook of Star Forming Regions, Volume II
- Pettersson & Reipurth (1994) Pettersson B., Reipurth B., 1994, A&AS, 104, 233
- Semkov et al. (2018) Semkov E., Ibryamov S., Peneva S., Mutafov A., 2018, Communications of the Byurakan Astrophysical Observatory, 65, 240
- Shappee et al. (2014) Shappee B. J., et al., 2014, ApJ, 788, 48
- Shingles et al. (2021) Shingles L., et al., 2021, Transient Name Server AstroNote, 7, 1
- Siwak et al. (2018) Siwak M., et al., 2018, A&A, 618, A79
- Smette et al. (2015) Smette A., et al., 2015, A&A, 576, A77
- Smith et al. (2020) Smith K. W., et al., 2020, PASP, 132, 085002
- Szabó et al. (2021) Szabó Z. M., et al., 2021, ApJ, 917, 80
- Szabó et al. (2022) Szabó Z. M., et al., 2022, ApJ, 936, 64
- Szegedi-Elek et al. (2020) Szegedi-Elek E., et al., 2020, ApJ, 899, 130
- Tonry et al. (2018) Tonry J. L., et al., 2018, PASP, 130, 064505
- Vernet et al. (2011) Vernet J., et al., 2011, A&A, 536, A105
- Yuk et al. (2010) Yuk I.-S., et al., 2010, in Ground-based and Airborne Instrumentation for Astronomy III. p. 77351M, doi:10.1117/12.856864
- Zhu et al. (2007) Zhu Z., Hartmann L., Calvet N., Hernandez J., Muzerolle J., Tannirkulam A.-K., 2007, ApJ, 669, 483
- Zieliński et al. (2019) Zieliński P., Wyrzykowski Ł., Rybicki K., Kołaczkowski Z., Bruś P., Mikołajczyk P., 2019, Contributions of the Astronomical Observatory Skalnate Pleso, 49, 125
- Zieliński et al. (2020) Zieliński P., Wyrzykowski ł., Mikołajczyk P., Rybicki K., Kołaczkowski Z., 2020, in Małek K., Polińska M., Majczyna A., Stachowski G., Poleski R., Wyrzykowski Ł., Różańska A., eds, Vol. 10, XXXIX Polish Astronomical Society Meeting. pp 190–193 (arXiv:2006.05160), doi:10.48550/arXiv.2006.05160
Appendix A Photometry
| JD2 450 000 | |||||||
|---|---|---|---|---|---|---|---|
| 9736.50 | 16.910.10 | 14.810.03 | 13.510.03 | 12.630.05 | … | … | … |
| 9738.50 | 17.020.24 | 14.830.03 | 13.480.03 | 12.610.04 | 9.900.04 | 8.690.05 | 7.790.04 |
| 9739.47 | 16.840.08 | 14.890.02 | 13.570.02 | 12.670.04 | 9.910.06 | 8.710.06 | 7.790.09 |
| 9740.49 | 16.930.11 | 14.870.02 | 13.530.03 | 12.710.03 | 9.850.07 | 8.680.06 | 7.820.02 |
| 9878.86 | … | … | … | … | 9.810.18 | … | … |
| 9883.86 | 16.870.09 | 14.710.08 | 13.310.13 | … | 10.180.43 | … | … |
| 9889.84 | 16.790.21 | 14.660.05 | 13.380.08 | … | … | … | … |
| 9896.75 | 16.730.17 | 14.590.07 | 13.270.09 | … | … | … | … |
| 9901.86 | 16.920.15 | 14.670.09 | 13.350.15 | … | … | … | … |
| 9906.86 | 16.880.17 | 14.660.08 | 13.300.09 | … | 9.700.49 | … | … |
| 9926.72 | 16.790.21 | 14.610.12 | 13.280.09 | … | … | … | … |
| 9933.72 | 16.720.27 | 14.680.13 | 13.330.13 | … | … | … | … |
| 9938.72 | 16.690.20 | 14.630.11 | 13.310.10 | … | … | … | … |
| 9943.75 | 16.820.09 | … | 13.370.02 | … | … | … | … |
| JD2 450 000 | Telescope | |||||
|---|---|---|---|---|---|---|
| 9867.86 | 18.230.11 | 15.640.04 | … | 14.200.14 | 13.040.08 | Danish 1.54-m |
| 9875.86 | 18.280.03 | 15.670.11 | … | 14.250.10 | 13.070.10 | Danish 1.54-m |
| 9904.69 | … | 15.710.05 | … | 14.430.06 | … | PROMPT6 |
| 9908.70 | 17.950.11 | 15.870.08 | … | 14.420.06 | … | UZPW 50cm |
| 9909.68 | … | 15.610.04 | … | … | 13.010.05 | PROMPT6 |
| 9911.68 | … | … | 16.860.03 | 14.610.04 | 13.260.04 | UZPW 50cm |
| 9913.82 | … | … | … | 14.670.05 | 13.350.06 | UZPW 50cm |
| 9916.84 | … | … | … | 14.670.05 | 13.260.04 | UZPW 50cm |
| 9917.84 | … | … | 16.910.04 | 14.530.07 | 13.280.05 | UZPW 50cm |
| 9920.69 | … | 15.650.06 | … | 14.390.07 | 13.080.05 | PROMPT6 |
| 9925.84 | … | … | 16.910.03 | 14.690.04 | 13.330.04 | UZPW 50cm |
| 9932.65 | … | … | 16.940.03 | 14.700.04 | 13.310.04 | UZPW 50cm |
| 9934.59 | … | … | 16.810.09 | 14.660.04 | 13.310.04 | UZPW 50cm |
| 9943.58 | … | … | 16.870.04 | 14.660.05 | 13.280.05 | UZPW 50cm |
| 9946.56 | … | … | 16.860.04 | 14.710.03 | 13.330.03 | UZPW 50cm |
| 9947.57 | … | … | 16.910.03 | 14.690.03 | 13.280.03 | UZPW 50cm |
| 9949.73 | … | … | 16.960.03 | 14.720.05 | 13.310.04 | UZPW 50cm |
| 9950.84 | … | … | 16.930.04 | 14.700.04 | 13.310.03 | UZPW 50cm |
| 9952.71 | … | … | 16.910.04 | 14.740.04 | 13.340.04 | UZPW 50cm |
| 9954.61 | … | 15.760.05 | … | 14.440.07 | 13.160.06 | PROMPT6 |
| 9955.86 | … | … | 16.950.03 | 14.710.03 | 13.340.05 | UZPW 50cm |
| 9959.66 | … | 15.700.06 | … | 14.390.07 | 13.110.05 | PROMPT6 |
| 9962.64 | … | … | 16.910.03 | 14.670.04 | 13.300.04 | UZPW 50cm |
| 9963.73 | … | … | 16.890.02 | 14.650.03 | 13.280.04 | UZPW 50cm |
| 9964.63 | … | 15.650.06 | … | 14.350.06 | 13.080.06 | PROMPT6 |
| 9966.87 | … | … | 16.880.03 | … | … | UZPW 50cm |
| 9969.62 | … | 15.660.05 | … | 14.360.07 | 13.090.05 | PROMPT6 |