A Review of Driver Gaze Estimation and Application in Gaze Behavior Understanding
Abstract
Driver gaze plays an important role in different gaze-based applications such as driver attentiveness detection, visual distraction detection, gaze behavior understanding, and building driver assistance system. The main objective of this study is to perform a comprehensive summary of driver gaze fundamentals, methods to estimate driver gaze, and it’s applications in real world driving scenarios. We first discuss the fundamentals related to driver gaze, involving head-mounted and remote setup based gaze estimation and the terminologies used for each of these data collection methods. Next, we list out the existing benchmark driver gaze datasets, highlighting the collection methodology and the equipment used for such data collection. This is followed by a discussion of the algorithms used for driver gaze estimation, which primarily involves traditional machine learning and deep learning based techniques. The estimated driver gaze is then used for understanding gaze behavior while maneuvering through intersections, on-ramps, off-ramps, lane changing, and determining the effect of roadside advertising structures. Finally, we have discussed the limitations in the existing literature, challenges, and the future scope in driver gaze estimation and gaze-based applications.
keywords:
Driver gaze , gaze estimation , driver gaze datasets , driver gaze understanding1 Introduction
Driver safety is one of the major global concerns due to the increasing number of road crashes yearly. According to the Global status report on road safety 2018 by World Health Organization (WHO), approximately 1.3 million people die every year from road crashes [Organization et al., 2018]. There are several causes of road crashes, out of which distracted driving, drowsiness, and inattentiveness of the driver from their surrounding traffic are also significant. Driver gaze is an important clue to measuring distraction and attentiveness to the surrounding. Although research on driver gaze estimation has been mostly carried out during the last two to three decades, however, the history of human gaze estimation dates back to the nineteenth century. In the early 20th century, it was limited to the medical field with invasive gaze-estimation techniques [Mowrer et al., 1935]. Due to the advancement of technology over the past few decades, gaze estimation has become one of the critical research fields. In addition to driver gaze estimation, estimation of human gaze is used in many other applications, such as human-computer interaction [Drewes, 2010, Majaranta & Bulling, 2014, Shimata et al., 2015, Pathirana et al., 2022], health care and medical field [König & Buffalo, 2014, Harezlak & Kasprowski, 2018], education and e-learning [Rosch & Vogel-Walcutt, 2013, Sun et al., 2017], consumer psychology and marketing [Recarte et al., 2008, Tomas et al., 2021], etc. In the driving context, the gaze is estimated using an intrusive or non-intrusive manner. In intrusive technique, drivers wear a head-mountable eyeglass setup or eye trackers, some of which look like normal eyeglasses. On the contrary, in non-intrusive techniques, remote gaze tracking systems are used, which classify the driver’s gaze in several areas of interest (AOI). In literature, AOI is also known as gaze zones or gaze classes. In this paper, we will primarily use the term gaze zones in the case of remote gaze tracking.
Multiple review studies exist on gaze estimation based on different estimation techniques and applications. Some studies include both traditional machine learning and deep learning-based gaze estimation techniques [Kar & Corcoran, 2017, Khan & Lee, 2019, Klaib et al., 2021, Shehu et al., 2021], while others include only deep learning techniques [Pathirana et al., 2022, Cheng et al., 2021]. A majority of these review studies, except studies by [Khan & Lee, 2019] and [Kotseruba & Tsotsos, 2022], have focused on gaze estimation on screen-based on different consumer platforms, including both constrained (fixed head movement) and non-constrained (head movement are allowed) environments. On the other hand, [Khan & Lee, 2019] and [Kotseruba & Tsotsos, 2022] reviewed different driver eye-tracking techniques and attention models. They discussed different distraction and drowsiness measurement techniques used to measure drivers’ attention and different features used in building advanced driver assistance systems (ADAS) by car manufacturers. Drowsiness and distraction of drivers are measured using eye movement information such as the percentage of times eyes closed, blink amplitude, amplitude velocity ratio, energy of blinking, blink frequency, blink duration, blink amplitude, etc. The study [Kotseruba & Tsotsos, 2022] primarily focused on different models of driver attention measurement for assistive and autonomous driving and also discussed in brief driver face and eye datasets. The above existing reviews do not clearly mention the terminologies used in gaze estimation and gaze behavior understanding based on head-mounted (based on eye tracker) and remote gaze estimation setup (cameras mounted on the dashboard or windshield). Further, these studies have only focused on driver gaze and attention measurement and haven’t discussed different aspects of driver gaze behavior. For example, these review studies have no discussion regarding how the gaze behavior differs among the different driver age groups (younger or older; novice or experienced) at different locations of roads such as signalized intersections (SI), unsignalized intersections (USI), mid-blocks, at road curves, entry and exit from ramps (On-ramp and Off-ramp), etc. To cater this gap, the present review paper primarily contributes to a review of the existing driver gaze estimation highlighting on the key terminologies and driver gaze behavior understanding during maneuvering on intersections, overpassing or overtaking, turning on curves, and entering and exiting from ramps.
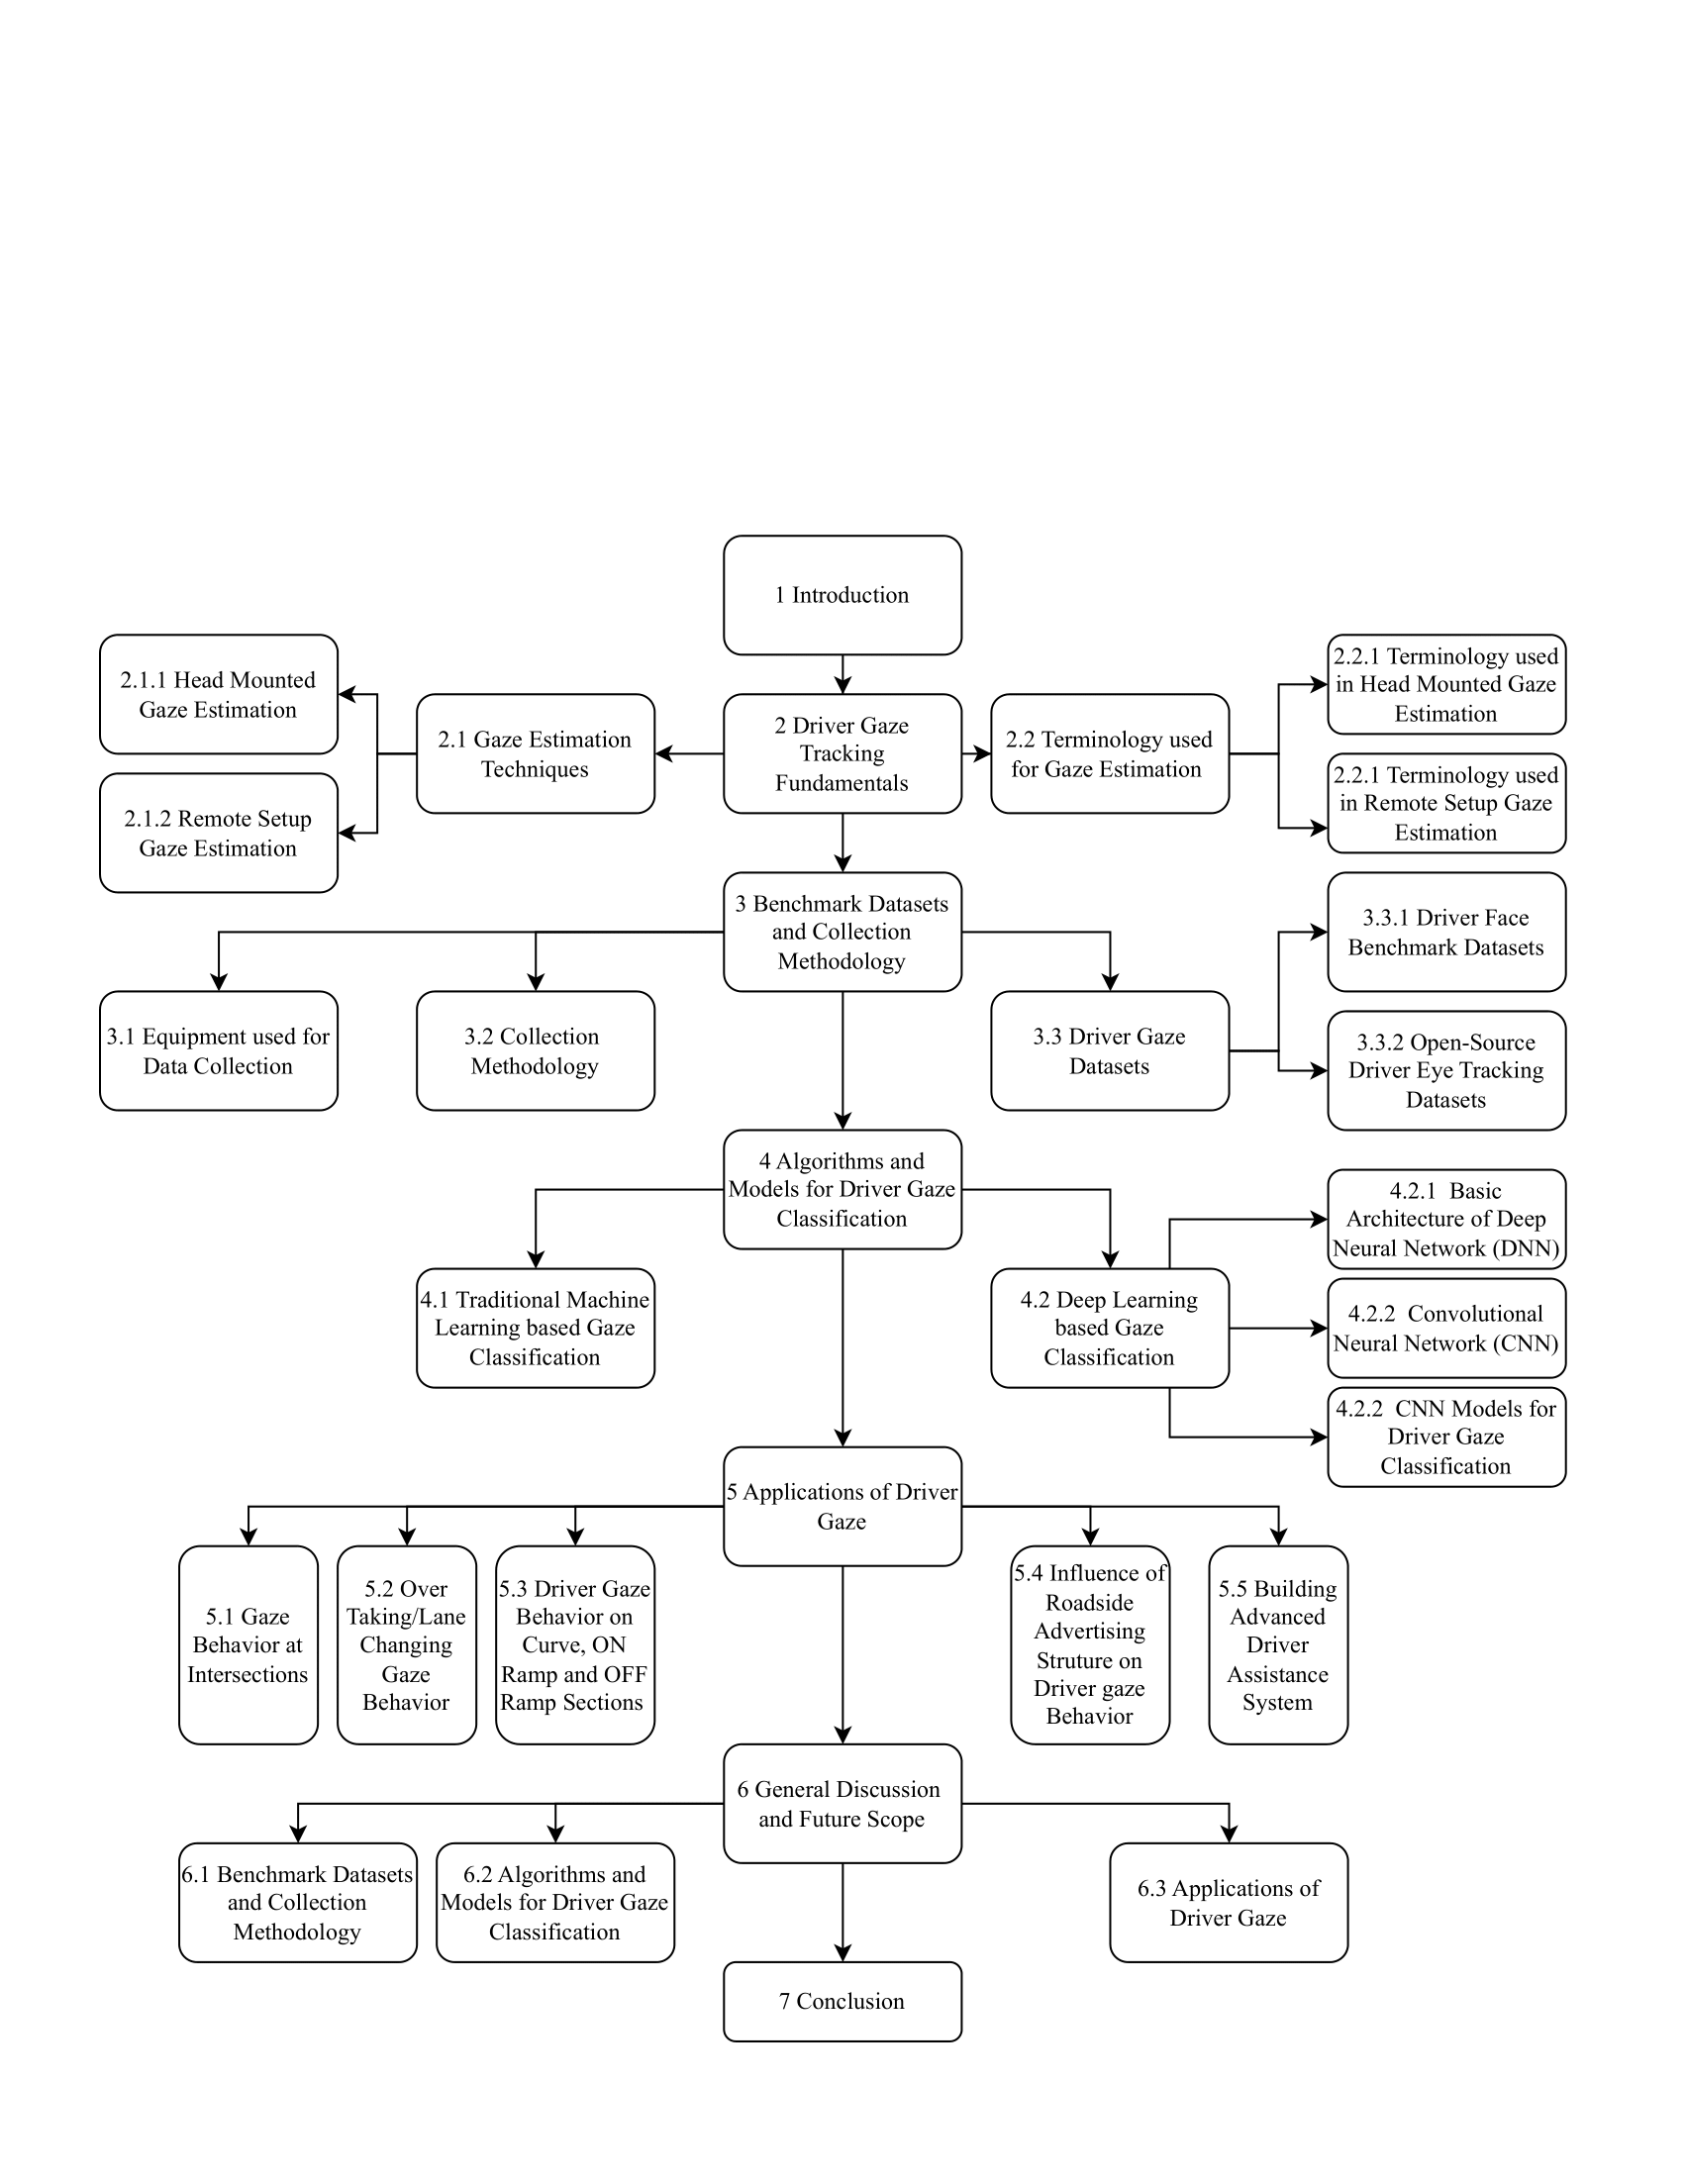
The objective of this review is to understand the several terminologies used in driver gaze estimation and tracking, existing benchmark driver gaze datasets, driver gaze estimation techniques, and their applications in the driving field. The structure of the paper is shown in Fig. 1. Section 2 describes different terminologies used in estimating driver gaze using head-mounted gaze tracking and remote setup gaze tracking, while Section 3 discusses the existing driver gaze benchmark datasets with their pros and cons. Different gaze estimation algorithms and models based on traditional machine learning and deep learning are covered in Section 4. Section 5 covers the various driver gaze-based applications for understanding driver gaze behavior and building advanced driver safety systems. Finally, Section 6 provides a general discussion and future scope, which includes the challenges and limitations of the existing studies, followed by a conclusion at the end of the paper.
To write this review, we passed a thorough search on Google Scholar with the following keywords: gaze estimation, driver gaze estimation, driver head, and eye pose estimation, gaze tracking, driver gaze, eye tracker, driver gaze behavior, driver gaze behavior at intersections, lane changing or over passing gaze behavior, advance driving assistance system, driver gaze distraction, driver inattentiveness. Approximately 1100 research papers were retrieved using the above keywords and scrutinized based on their title and abstract. Finally, 160 relevant research papers reviewed have been included in the present paper. The included research papers are from different reputed journals such as Transactions on Intelligent Transportation Systems, Transactions on Intelligent Vehicles, Transactions on Vehicular Technology, Transactions on Information Theory, Expert Systems with Applications, Pattern Analysis and Machine Intelligence, The Bell System Technical Journal, Open Journal of Signal Processing, Transportation Research Part A: Policy and Practice, Transportation Research Part C: Emerging Technology, Transportation Research Part F: Traffic Psychology and Behavior, Transportation Research Record, Journal of Safety Research, IET Intelligent Transport Systems, Spanish Journal of Psychology, International Journal of Robotics Research, etc. We also include conference papers such as Intelligent Transportation Systems Conference, CVF Computer Vision and Pattern Recognition (CVPR) conference, International Conference on Computer Vision (ICCV), International Conference on Automatic Face and Gesture Recognition, International Conference on Robotics and Biomimetics, Intelligent Vehicles Symposium (IV), European Conference on Computer Vision (ECCV) and W.H.O. global status report on road safety. In this study, we have reviewed driver gaze related to only passenger car transportation modes, and other modes of transportation, such as motorcycles, auto rickshaws, trucks, buses, etc., have been excluded from the study. This paper includes literature that belongs to both simulators and real driving scenarios.
2 Driver Gaze Tracking Fundamentals
In literature, estimation of driver gaze is referred by different terminologies, such as eye pose estimation, eye tracking [Liu et al., 2002], gaze estimation, gaze detection [Naqvi et al., 2018, Yoon et al., 2019, Rangesh et al., 2020], and gaze tracking. However, all these are similar and often used interchangeably in different research papers. Gaze estimation is a technique to estimate the 3D line of sight (direction of gaze) from a given image. Continuous estimation of the gaze direction is known as gaze tracking. Tracking the driver’s gaze is helpful in different applications, such as drowsiness detection, measurement of driver inattentiveness, driver behavior understanding, and building advanced driver assistance system.
2.1 Gaze estimation techniques
Gaze estimation is done using different techniques depending on the application. Initially, sensors attached to the facial skin, such as electrode pairs, were used to record potential differences during eye movements [Mowrer et al., 1935] to understand cognitive behavior. This technique though accurate but is usually uncomfortable to the users. Due to the advancement of computer vision-based technology, gaze estimation has seen widespread application in different fields, including driver assistance and behavior understanding. Head-mounted trackers (wearable sensors) and remote setup (non-wearable)-based sensors are the two standard techniques used in practice for driver gaze estimation, briefly discussed next.
2.1.1 Head mounted gaze estimation
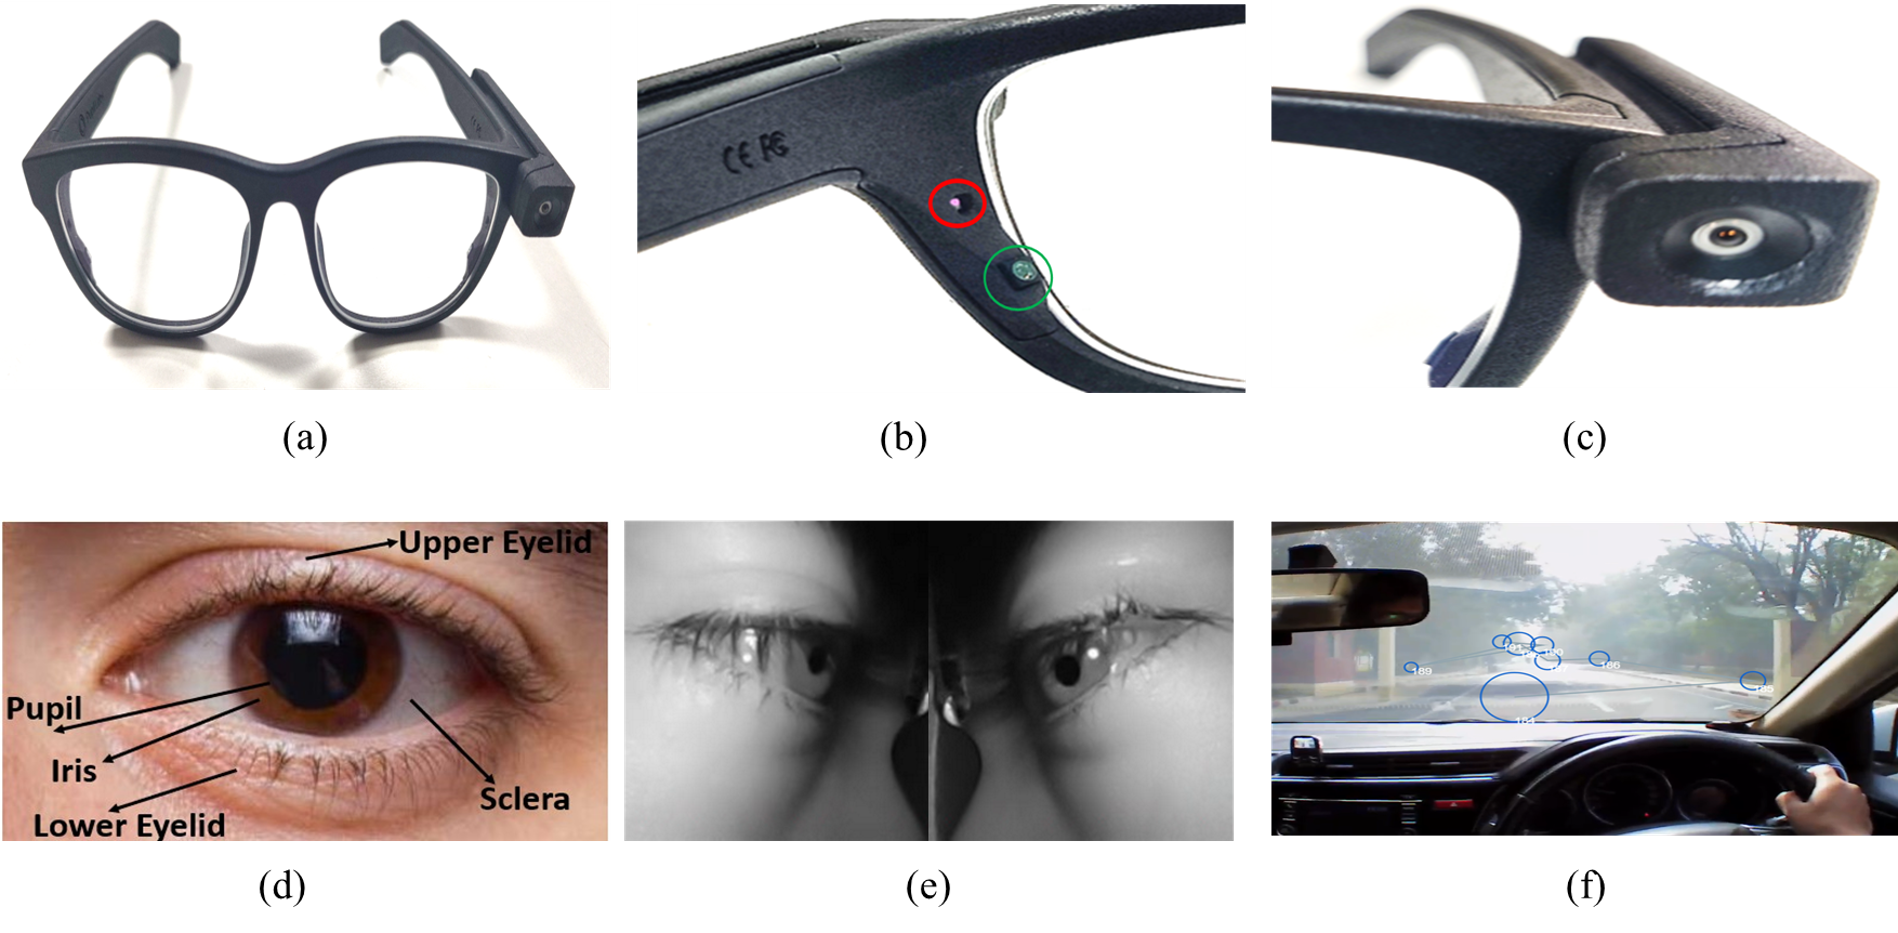
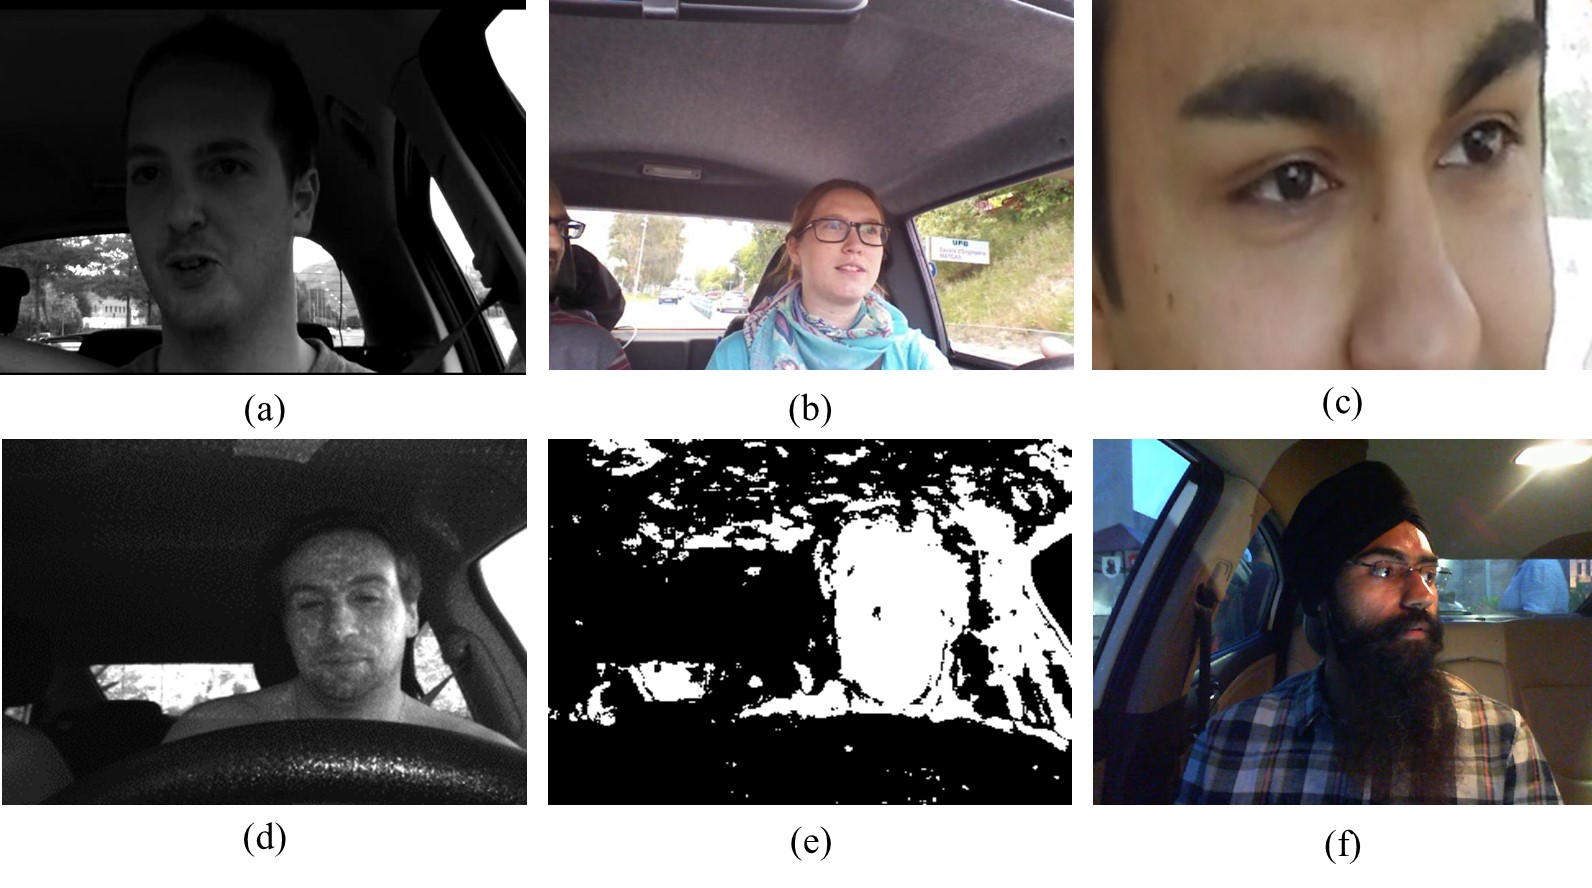
In head-mounted gaze estimation, the driver mounts or wear a device on their head called an eye tracker. Fig. 2a shows a sample eye-tracker glass, which looks exactly similar to regular prescription glasses. Primarily head-mounted system consists of near-eye cameras and infrared LED light for active illumination of the eyes (Fig. 2b) and a scene camera (Fig. 2c). In this system, a near-eye camera is present near each eye, recording the eye movements from close-up, as shown in Fig. 2e. The scene camera records the frontal view, allowing correlation of gaze data to the cues and stimuli present in the scene of the driver (Fig. 2f).
Head-mounted eye trackers rely on detecting image features for the near eye cameras, including the pupil, iris contours (Fig. 2d), and glints, i.e., reflections produced by the Infrared LEDs. Typically, eye trackers require calibration of each driver before estimating the driver gaze [Dukic & Broberg, 2012, Scott et al., 2013, Lemonnier et al., 2015, 2020, Nasrabadi & Alonso, 2022]. However, some latest eye trackers have been developed which are calibration-free [Tonsen et al., 2020]. Head mounted gaze estimation system allows driver head movements without affecting the camera views of the eyes. Several studies have used eye trackers to understand the driver gaze behavior in indoor (simulation-based studies) [Romoser et al., 2013, Scott et al., 2013, Lemonnier et al., 2015] and outdoor traffic environments (real-world driving studies) [Bao & Boyle, 2009, Dukic & Broberg, 2012, Li et al., 2019, Lemonnier et al., 2020].
2.1.2 Remote setup gaze estimation
For remote setup-based gaze estimation, cameras are typically placed on the dashboard [Chuang et al., 2014, Vicente et al., 2015, Naqvi et al., 2018, Yoon et al., 2019, Wang et al., 2019] or sometimes mounted on the windshield [Choi et al., 2016]. Single or multiple cameras can be used, depending on the nature of gaze zone classification. Typically single cameras are preferred when dashboard and windshield areas are divided into coarser gaze zones, while in finer gaze zone classification, multiple cameras are primarily used [Naqvi et al., 2018, Yoon et al., 2019, Guo et al., 2019]. Multiple cameras capture face images from different angles, such as left and right sides of the face and eye [Yoon et al., 2019]. This helps to make gaze estimation robust even for substantial head movement, which is a shortcoming of single camera-based estimation. Cameras are placed in such a way that they do not create an interruption in the driver’s field of view (FOV). The head pose images are used to extract the features in the case of traditional machine learning models, while for deep learning-based models, the images are directly used for end-to-end gaze classification. This system typically does not require driver’s calibration [Naqvi et al., 2018, Yoon et al., 2019]. However, in a similar electronic screen-based remote gaze tracking used to measure users’ cognitive load while using a website, app, or reading text content, etc., typically subject calibration is needed before the gaze estimation on-screen [Brolly & Mulligan, 2004, Hosp et al., 2020].
2.2 Terminology used for gaze estimation
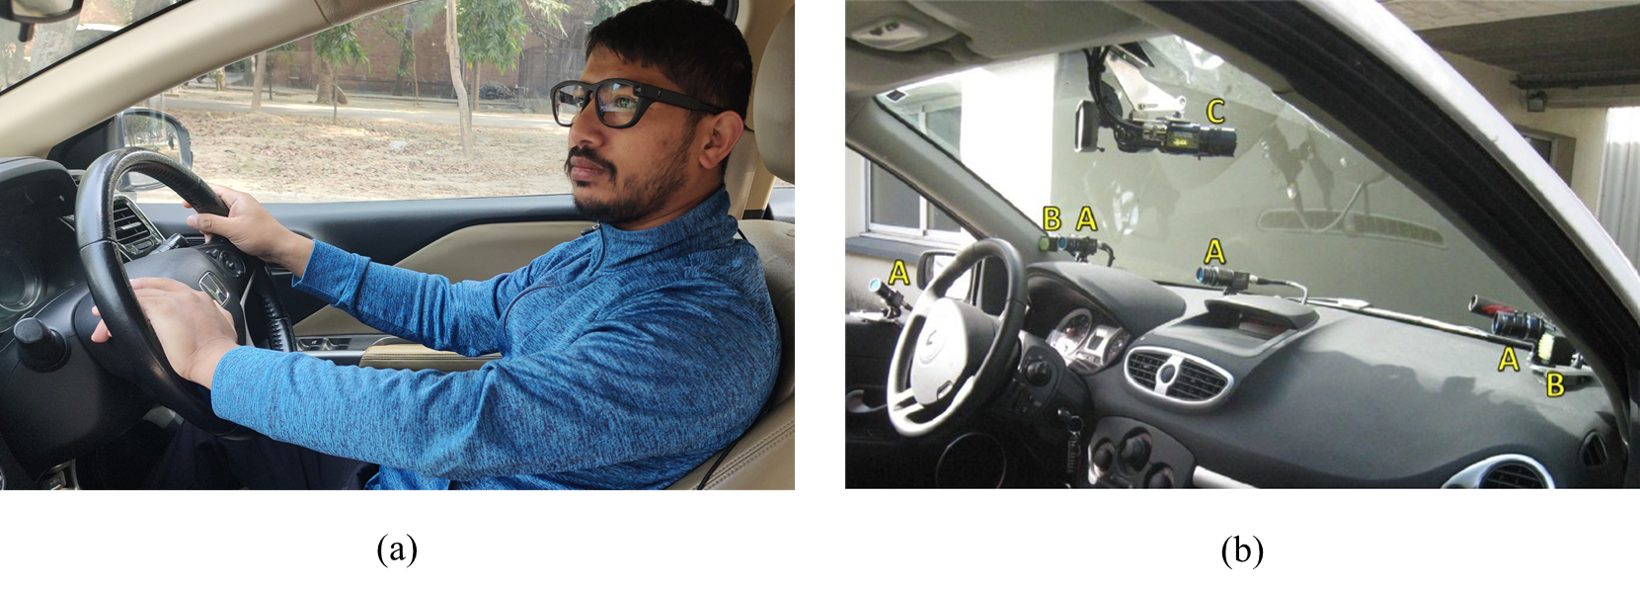
This section will discuss the different terminologies used in head-mounted and remote setup-based gaze estimation. Gaze estimation based on the head-mounted and remote setup is two approaches to driver’s gaze estimation depending on how precisely the gaze is estimated. Head-mounted-based gaze estimation is a finer way of gaze estimation in which driver gaze information is collected using an eye tracker (Fig. 3a). In remote setup, single or multiple cameras mounted on the dashboard and windshield area capture the different driver heads and eye poses, which are classified into different gaze classes based on the predefined gaze zone (Fig. 3b). The term fixation, saccades, dwell time, etc., are used in head-mounted gaze estimation, while in remote setup, the terms glance, glance duration and glance frequency are used to analyze the driver gaze. So to understand the driver’s state and behavior, we must be familiar with several terminologies used in head-mounted and remote setup gaze estimation.
2.2.1 Terminology used in head mounted gaze estimation
This approach considers eye movements as the primary clue for gaze estimation. Eye movement is estimated by detecting the pupil’s relative motion or iris center from a reference point inside the eye image. The reference point can be a glint point produced on the cornea using an LED illuminator, a point of intersection of eyelids and the canthus, etc. Determining pupils in outdoor lighting is often more challenging than in indoor lighting conditions. In an outdoor setting, it suffers from poor illumination, sunlight reflection on glasses or eyeballs, off-axis camera position, etc. [Liu et al., 2002, Chu et al., 2010, Fuhl et al., 2016, Wood et al., 2017, Santini et al., 2018]. The following terminology defines the continuous output of the driver’s gaze in a head-mounted gaze estimation system.
1. Fixation: It is the state of eyes in which a driver maintain their visual gaze in a given gaze zone or area of interest (AOI) for a certain period [Dukic & Broberg, 2012, Kar & Corcoran, 2017]. The ISO 15007-1:2020 standard defines that individual fixations typically last between 100 milliseconds to 2000 milliseconds (ms) [Karsh & Breitenbach, 2021]. Remote eye tracker manufacturers such as Smart Eye Pro and Tobii consider 200 ms should be the minimum gaze period for a valid fixation in driver behavior studies [Holmqvist et al., 2022]. Fixation time typically decreases if a driver is familiar with the road environment [Martens & Fox, 2007]. 2. Dwell Time: It is the sum of the duration of fixations in a given area of interest. In driver behavior studies, dwell time gives the proportion of time spent by drivers gazing at objects in an interval of time. The object can be dynamic objects such as moving vehicles or static objects such as stationary vehicles, traffic lights, traffic signs, road markings, etc. [Lemonnier et al., 2015, Chung et al., 2022]. Higher dwell time in a given gaze zone represents a high level of interest of the driver in that particular gaze zone. Time to first fixation (TTFF): It measures how long a stimulus takes to start looking at a specific gaze zone after the stimulus is presented. TTFF indicates how much an aspect of the scene initially attracted attention. 3. Number of fixations: It represents the total number of time a subject fixate their gaze in a given gaze zone in a given time interval [Chung et al., 2022]. 4. Saccades: Saccades are the rapid movement of the eyes where the gaze sight shifts from one fixation point to another [Imaoka et al., 2020]. The time taken to shift the eyes from one point of fixation to another is called saccadic duration. It shows the dynamics of the driver’s gaze while driving. 5. Scanpath: Scanpath represents the path followed by the driver’s gaze moving from one fixation to another. A continuous segment of fixation and saccade can be a combination of two fixations and one saccade or multiple fixations and multiple saccades. Scanpath is used to find the driver gaze pattern in different traffic maneuvers such as turning, overtaking, merging, etc. 6. Blink rate and pupil size: It is used to quantify the cognitive workload of the drivers. Blink rate decreases for more visually demanding tasks [Marquart et al., 2015], while shorter blink duration for increasing task demand for both (mental and visual) [Kramer, 2020]. In a real-world driving study [Heger, 1998], the amount of a driver’s mental workload is measured based on the blink rate. The findings of this study revealed that as the road curves increased sharper, the eye blink rate reduced. When completing a cognitive task and detecting pupil size simultaneously, pupil size was greater than when merely conducting the cognitive task [Recarte et al., 2008]. 7. Entropy Rate: Entropy rate is one of the critical metrics to measure the driver’s attentiveness from the surrounding traffic, which was inspired by the concept of Information entropy [Shannon, 1948]. In a driving scenario, stationary gaze entropy (SGE) and gaze transition entropy (GTE) are the two commonly used metrics for measuring the driver’s attention level. Stationary gaze entropy [Bao & Boyle, 2009, Chung et al., 2022] describes the information generated by the driver gaze dispersed across the gaze zones. Stationary gaze transition is defined as:
| (1) |
where is the total number of gaze zone and is one of the gaze zones out of number of gaze zones where the driver is looking during driving. The probability of the driver looking towards number of gaze zone is represented by . Since SGE does not reflect how driver control and asses the situation from the surrounding traffic environment. So for overcome these limitations gaze transition entropy [Krejtz et al., 2015, Chung et al., 2022] is used to measure the complexity of the different gaze transition patterns. For instance, where there are multiple stimuli, such as intersection, the gaze pattern is complex compared to the ordinary road; hence the GTE is higher at intersections.
| (2) |
Where is the occurrence of transition probability from gaze zone to gaze zone.
2.2.2 Terminology used in remote setup gaze estimation
The gaze estimation in remote setup-based systems typically gives a coarser gaze measurement than the head mounted. Here driver gaze is defined based on the head and eye pose, or sometimes only the head pose. Traditional machine learning or deep learning-based image classification models are trained to the predefined labeled image by either taking a head pose (face image) or a head and eye pose (eye images). In the coming section, we will explain a detailed discussion of ground truth label images and gaze classification techniques.
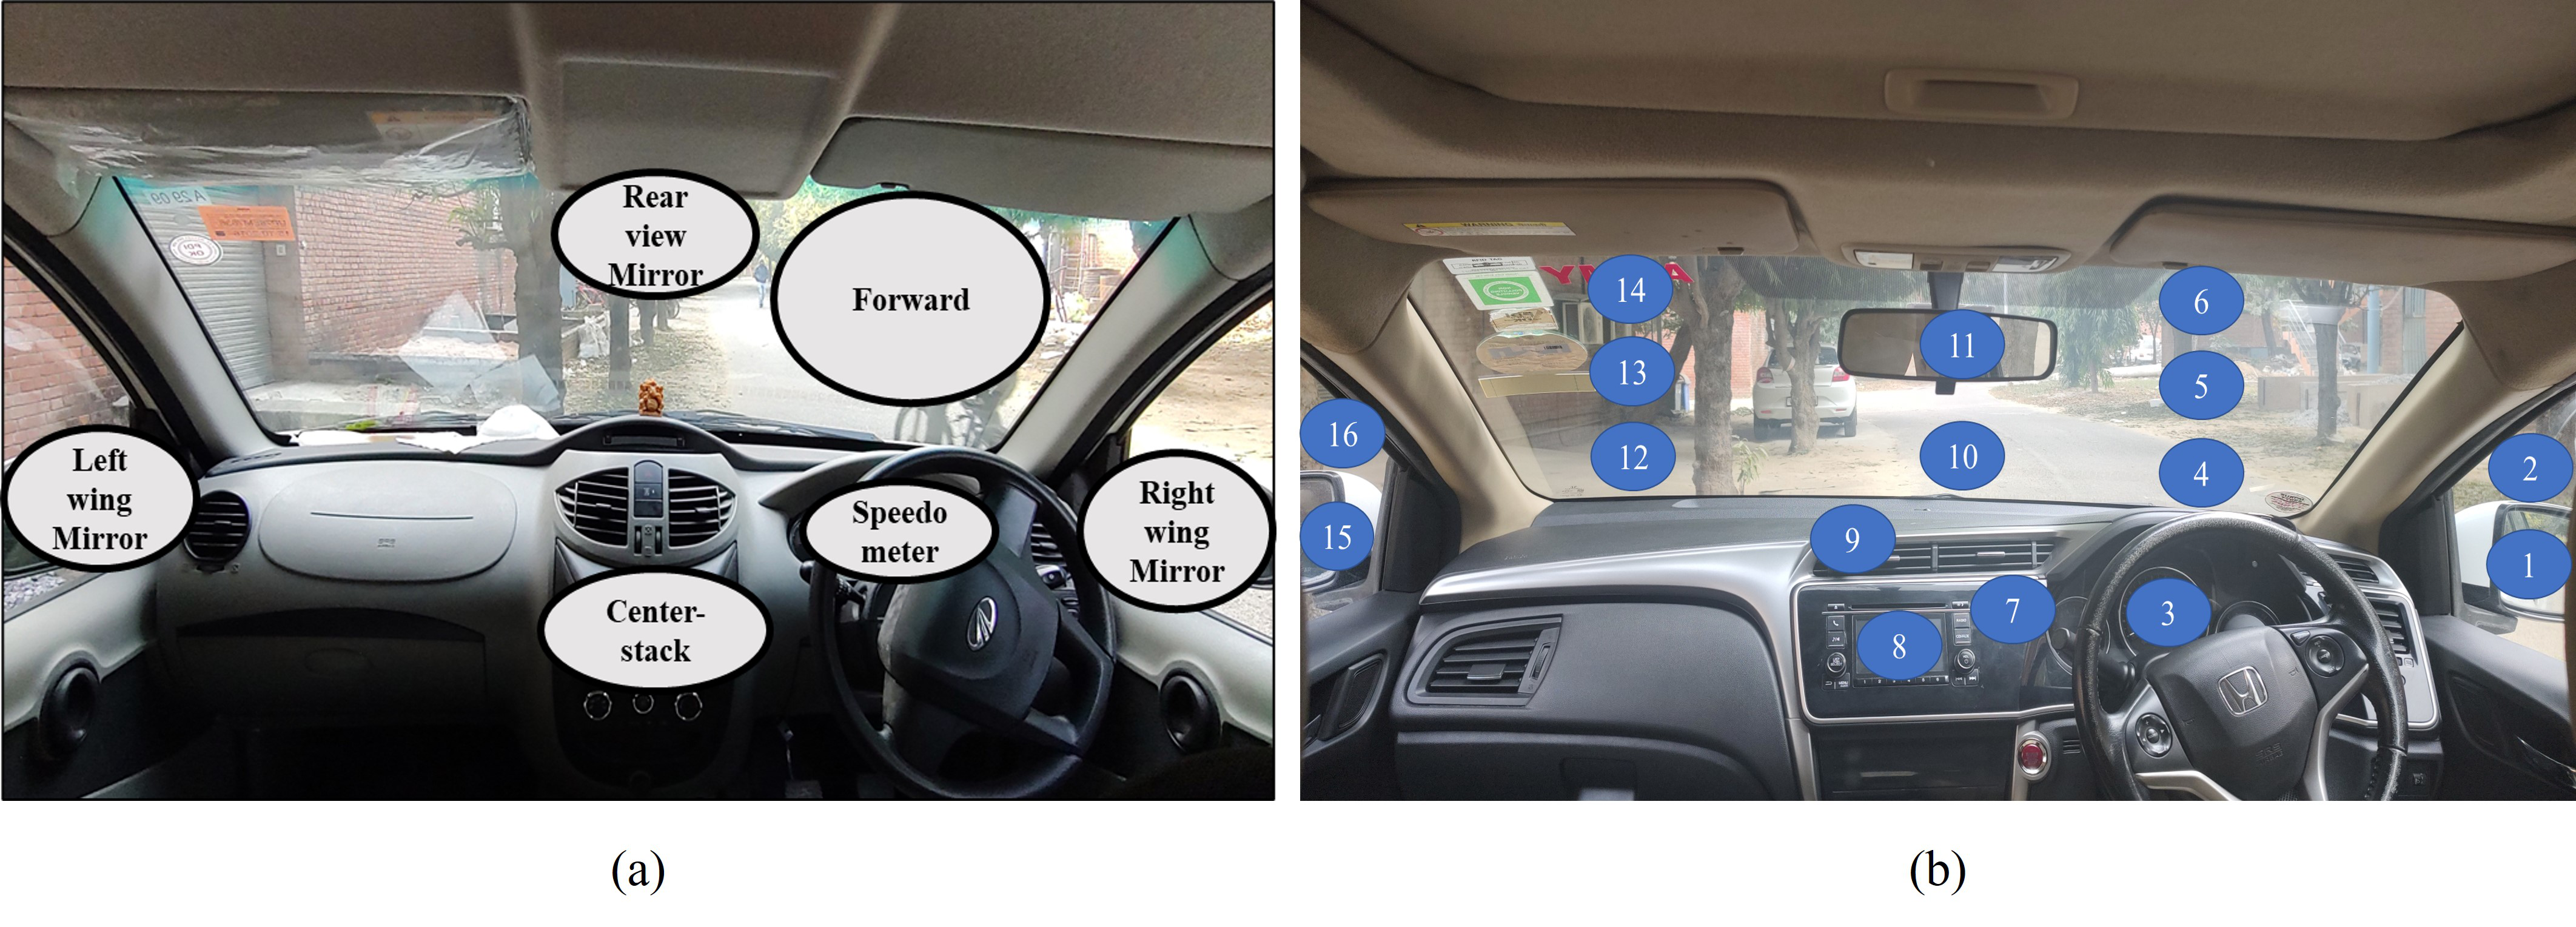
1. Glances: Glances are the coarser measurement of gaze, while fixation is a more refined measurement. It measures the gaze over an area, while fixation is measured at a point. In an interested gaze zone, glances may contain fixation and saccades. Here, gaze zones are pre-defined areas inside the vehicle cabin, such as the speedometer, center stack, left wing mirror, right wing mirror, rearview mirror [Chuang et al., 2014, Fridman et al., 2016a, Tawari et al., 2014, Martin et al., 2018, Rangesh et al., 2020, Schindler & Piccinini, 2021], etc. Glances are measured using glance duration, glance frequency, glance transition, etc. 2. Glance Duration: Time spent in each gaze zone in a given time interval. It is measured using minimum, maximum, and average glances made by drivers in different gaze zones [Birrell & Fowkes, 2014, Martin et al., 2018, Li et al., 2019]. 3. Glance Frequency: The number of glances the drivers make in a given gaze zone in a unit time interval is glance frequency [Birrell & Fowkes, 2014]. Several studies include glance duration and frequency in examining the driver attention level while driving [Muñoz et al., 2016]. Longer glance duration and higher glance frequency signify the higher task demand [Owsley et al., 1991, Wang et al., 2014]. 4. Glance Transition: It denotes shifting of gaze from one gaze zone to another while assessing the situation of the surrounding traffic environment [Scott et al., 2013, Birrell & Fowkes, 2014, Lemonnier et al., 2015, Li et al., 2019]. Glance transitions reveal the flow of attention between different gaze zones while driving [Liang et al., 2012, Muñoz et al., 2016]. A higher correlation exists between the two gaze zone when glance transitions occurring between the two is more frequent [Wong & Huang, 2013, Fridman et al., 2017]. 5. Glance Transition Sequence: The sequence followed by the glances shifting from one gaze zone to another in a given time duration. The occurrence of unusual sequences of gaze patterns while driving contains more rich information than usual. 6. Glance Transition Length: It is the time duration of shifting glances from one specific gaze zone to another. It depends on the position of the former and later class of gaze zone. More glance transition length in the case of former and later classes are forward and leftwing mirror as compared to forward and right wing mirror (Fig. 4a). 7. Number of Glance Transition: It is the sum of glance transitions the drivers make from one gaze zone to another in an observable time interval. A higher number of gaze transitions typically indicate higher driver attentiveness to their traffic surrounding.
As discussed above the terminology entropy rate can be used in both head-mounted and remote setup-based gaze estimation. In head-mounted gaze estimation, eye movement is primarily used for gaze tracking. The collected data from the eye trackers consist of fixation and saccadic information [Martens & Fox, 2007, Dukic & Broberg, 2012, Zahabi et al., 2017]. The gaze estimation accuracy of the eye tracker is measured in angular resolution (in degrees), representing the angular difference between real stimuli positions and measured gaze positions [Kar & Corcoran, 2017, 2018].
Conversely, remote setup gaze estimation is a non-wearable gaze estimation technique. In this method, typically, instead of estimating pinpoint gaze location, we find a comparatively broader region of interest known as the gaze zone. In this system, the head movement is the pre-dominant for gaze region classification, and hence the term glances are often used for driver’s gaze behavior analysis [Bao & Boyle, 2009, Romoser et al., 2013, Martin et al., 2018, Li et al., 2019]. Gaze estimation based on eye trackers is more accurate than remote gaze tracking. Another advantage of using an eye tracker over remote gaze trackers is determining the stimuli in the scene image by producing the heat map on the fixation points. However, sometimes, it creates discomfort for the drivers, who do not have a habit of wearing eyeglasses and influences naturalistic driving gaze behavior.
3 Benchmark Datasets and Collection Methodologies
Good quality data is one of the crucial needs for computer vision-based gaze-tracking applications. The quality of driver gaze datasets depends on the precision and configuration of collection equipment, methodology, and information level. Driver data must include possible driving scenarios and conditions and a sufficiently large number of subjects. This section discusses the different types of equipment used for data collection, the methodology adopted, and different open-source benchmark driver gaze datasets available for gaze estimation model development.
3.1 Equipment used for data collection
Driver face data is generally collected using a remote setup, where cameras are installed in front of the driver (in the dashboard or windshield) to record the driver’s head movement. Different types of cameras have been used to collect driver face data, including traditional RGB, RGB-Depth, and Infrared cameras. Traditional RGB cameras are used to capture driver face in the visible wavelength spectrum [Chuang et al., 2014, Tawari et al., 2014, Diaz-Chito et al., 2016, Vora et al., 2018, Ribeiro & Costa, 2019, Ortega et al., 2020, Ghosh et al., 2021]. However, the image quality sufficiently degrades in low-light conditions, thereby making it difficult to understand the driver’s gaze night-time. To alleviate this problem, Infrared (IR)[Ribeiro & Costa, 2019, Rangesh et al., 2020, Ortega et al., 2020]/Near Infrared (NIR) cameras are also used for driver gaze data collection [Nuevo et al., 2010, Naqvi et al., 2018, Yoon et al., 2019] due to its intrinsic advantage to capture better features in night-time compared to traditional RGB cameras. It provides a grayscale image using infrared/near-infrared light, which is invisible to the naked human eye. Although NIR cameras are robust enough to capture images in low-light conditions, however, prolonged use of the NIR camera may hurt the driver’s eyes [Ou et al., 2021]. The great challenge in driver gaze estimation is the illumination vulnerability under poor environmental conditions where light and shade bring negative effects. Standard RGB cameras have the advantage of color information but missing the depth information. To overcome these challenges, RGB-D cameras [Ribeiro & Costa, 2019, Wang et al., 2019, Ortega et al., 2020] are used to obtain RGB images and depth information using point cloud-based sensors. RGB-D camera has unique features to merge pixel-to-pixel information of depth and RGB information in a single image. Depth, information of the camera is provided by a 3D depth sensor, which can be stereo, time of flight, structured light sensor, etc. In studies [Palazzi et al., 2018], Eye trackers are also used to capture data such as pupil dilation, iris and gaze information, in terms of fixation and saccades.
3.2 Collection methodology
Driver gaze data has been collected using a vehicle in a stationary state (parked vehicle) or moving state. In the stationary state [Ribeiro & Costa, 2019, Ghosh et al., 2021, Chuang et al., 2014, Naqvi et al., 2018, Jha & Busso, 2018, Yoon et al., 2019], dashboard and windshield areas of the vehicle (car) are divided into several zones by sticking stickers or by pointing with a marker. The number of gaze zones selected can be broadly divided into coarser and finer categories, as shown in Fig. 4a and Fig. 4b. In the coarser gaze zone classification, the windshield and dashboard area is divided into fewer gaze zones than the finer. Primarily coarser gaze zone classification includes forward, speedometer, center-stack, left wing mirror, right wing mirror, and rearview mirror [Chuang et al., 2014, Nuevo et al., 2010, Fridman et al., 2016a, Tawari et al., 2014, Martin et al., 2018, Vora et al., 2018, Rangesh et al., 2020]. In finer gaze zone classification, the windshield, wing mirror, and dashboard area are subdivided into different smaller gaze zones, and therefore the number of gaze zones is more. Despite giving the specific class name such as forward, rearview mirror, left-wing mirror, right-wing mirror, etc., they divided each broader gaze zone area into a smaller gaze zone with the name a numerical value such as 1, 2, 3, etc. [Vicente et al., 2015, Naqvi et al., 2018, Yoon et al., 2019, Ghosh et al., 2021, Wang et al., 2022] as shown in Fig. 4b. In this study [Ribeiro & Costa, 2019], instructions are given by the second person to the subjects or drivers to look toward specific gaze zones, while in some other studies, drivers typically look toward the gaze zones by their own choice [Chuang et al., 2014, Ortega et al., 2020]. The frontal face area of the driver is recorded by installing the camera on the dashboard, rearview mirror, or windshield. The captured frames were labeled by one or more human annotators and cross verify. Speek2label [Ghosh et al., 2021] is also one method of annotations in which audio signals (gaze zone names such as 1, 2, 3, etc.) are converted into text. In the moving state, we can not instruct the driver to look towards the specific gaze zones because of driver safety concerns. In this state, the driver drives the vehicle actually on the road, and the labels are given either by the human annotators [Vora et al., 2018, Fridman et al., 2016b, Wang et al., 2019] or using unsupervised machine learning techniques [Chuang et al., 2014].
The advantage of stationary state-based data collection methods is that they are safe since data is collected on parked vehicles; also, the number of subjects is large. Getting the labels speak2label and looking towards the specific gaze zone while the second person is giving the instructions are relatively smooth. The drawback of this method is the gaze zone classifiers built using this data are not generalized satisfactorily from a stationary to a moving vehicle. Also, by giving the labels by the speak2label method, some classes are intermingled, which also affects the classifier results. In the moving state data collection method is more generalized since data is collected in actual road driving, but giving the correct labels is a challenging task.
3.3 Driver gaze datasets
Driver gaze data is in two categories, one contains the driver’s face information, and the other includes the eyes pose information, such as the position of the iris, pupil, and cornea reflection inside the eye. Typically the eye data [Fusek, 2018] are collected using cameras while iris and pupil [Palazzi et al., 2018] are collected using eye trackers.
3.3.1 Driver face benchmark datasets
Driver gaze data is in two categories, one contains the driver’s face information, and the other includes the eyes pose information, such as the position of the iris, pupil, and cornea reflection inside the eye. Typically the eye data [Fusek, 2018] are collected using cameras while iris and pupil [Palazzi et al., 2018] are collected using eye trackers.
3.3.2 Driver Face Benchmark Datasets
Several open-source driver face datasets are available, which are collected either inside parked vehicles or moving vehicles in real-world conditions. These datasets can be downloaded from different open-source repositories or available on request through a source generator. A detailed description of these publicly available driver gaze datasets is discussed next, and a comprehensive summary is provided in Table 1
RS-DMV [Nuevo et al., 2010] contains ten driver face videos on a grayscale (see Fig. 5a) in indoor (simulator) and on-campus outdoor driving. DriveFace [Diaz-Chito et al., 2016] contains three classes right, frontal, and left of the driver’s head pose (see Fig. 5b). Brain4Cars [Jain et al., 2016] consists of multi-sensor synchronized data containing outside and inside views of car video, vehicle speed, and GPS coordinates. The data was recorded using ten drivers in natural driving settings for up to two months. DriveAHEAD [Schwarz et al., 2017] dataset is a wide-range head pose dataset containing depth and IR images. To measure the head position (x, y, z coordinate) and orientation (Yaw, Pitch, Roll), they use a 3D motion capture sensor. The DMD [Ortega et al., 2020] dataset is a multimodal dataset containing images from 3 cameras, face, body, and hands, each captured from three streams (RGB, IR, Depth). This dataset contains head pose, body pose, blink rate, and hand wheel interactions too. DriveMVT [Othman et al., 2022] is a multi-purpose natural driving data consisting of frame-by-frame information on driver health, such as heart rate, mental fatigue, head pose (yaw, pitch roll), drowsiness, etc. Participants have unique features with/without a beard, eyeglasses, and mustache. The data was collected using usb cameras and smartphone cameras for driver face capturing and for heart rate recording; a heart Xiaomi Mi Band 3 sensor was used.
To look at a specific gaze zone by instructing drivers in actual driving is unsafe, so datasets are also recorded in the parked vehicle. One such dataset is a LISA GAZE v2 [Vora et al., 2018], a large-scale driver faces data containing possible driving conditions such as daylight, night light, harsh illumination, and eyeglasses reflections (see Fig. 5c). DG-UNICAMP [Ribeiro & Costa, 2019] is one of the most extensive driver face datasets containing all three types RGB, IR (see Fig. 5d), and depth (see Fig. 5e) images. DGW datasets [Ghosh et al., 2021] is one of the largest subject datasets, which use speak-to-label techniques to label data. It contains all challenging possible lighting conditions day and night, such as low light (see Fig. 5f) , half, full face shadow, sunlight reflection, etc. The drawback of the data is its intermingled gaze classes, which reduced the model’s classification accuracy.
|
|
Resolution |
|
|
Size | Merits | Demerits | ||||||||||||||
|---|---|---|---|---|---|---|---|---|---|---|---|---|---|---|---|---|---|---|---|---|---|
|
Grayscale | 960×240 |
|
- | 21k |
|
|
||||||||||||||
|
RGB | 640×480 |
|
3 | 606 |
|
|
||||||||||||||
|
RGB | - |
|
- | 2M |
|
|
||||||||||||||
|
|
512×424 |
|
- | 1M |
|
|
||||||||||||||
|
RGB | 1280×720 |
|
- | 555k |
|
|
||||||||||||||
|
RGB | 2704×1524 |
|
7 | 47k |
|
Simulator driving | ||||||||||||||
|
|
240×320 |
|
18 | 1M |
|
Stationary vehicle | ||||||||||||||
|
RGB | 179×179 |
|
9 | 50k |
|
Stationary vehicle | ||||||||||||||
|
|
1920×1080 |
|
9 | 41h |
|
|
||||||||||||||
|
RGB | 1920×1080 |
|
- | 100k |
|
Simulator driving |
3.3.3 Open source driver eyes tracking datasets
While the driver face dataset is the most common driver gaze dataset explored in literature, a few studies have also used the driver eye dataset for gaze estimation. Besides gaze estimation tasks, driver eye datasets are also used for detecting drowsiness, pupil dilation, and blink frequency for cognitive workload, etc.
DR(eye)VE [Palazzi et al., 2018], is a real-world driving dataset consisting of 74 videos of different weather (sunny, cloudy, rainy) and light conditions (day, evening, night). Driver’s gaze information and pupil dilation were captured using eye trackers, and the gaze was mapped to the surrounding traffic. Media research lab (MRL) [Fusek, 2018] dataset was recorded on actual road driving using a NIR camera to reduce the low illumination light effect on the eyes during evening and night. IR illuminator is used to create reflection on eyes and eyeglasses to produce a wide range of lighting effects. The benchmark driver face and eye datasets are used to build several state-of-the-art gaze estimation models, which are discussed in the next section.
4 Algorithms and Models for Driver Gaze Classification
This section will discuss different state-of-the-art gaze estimation models based on traditional machine learning and deep learning. Typically, gaze estimation algorithms in computer vision for driver gaze estimation are clubbed into traditional machine learning and deep learning-based method. In traditional machine learning, different features of the face and eyes are extracted using feature extractors algorithms and fed to the classifier (see Fig. LABEL:fig:Driver_gaze_classification_using_Traditional_Machine_Learning_VS_Deep_Learning). On the other hand, deep learning-based models directly learn the mapping function from the face and eye appearance of the driver. These models detect and track faces and eyes based on the image appearance [Wang & Ji, 2005] characterized by pixel intensity (color intensity) statistics.

4.1 Traditional machine learning based gaze classification
A feature in machine learning is a part or pattern of an object in an image that helps to identify it. In image processing and pattern recognition, feature extraction (also known as feature generation or feature construction) is a way of dimensionality reduction, and its primary goal is to find the most relevant information from the original data and represent that information in a lower dimensionality space. In the case of driver’s gaze, classification commonly involves the determination of head pose and eye pose as a first step of feature generation. For head pose estimation, typically used face features are the left and right border, center of the driver’s face, mouth and nose corner, nose tip, eye corner and contours, eyebrow, eyelids, etc. For eye pose estimation, commonly used features are pupil center (dark pupil or bright pupil), iris contour, corneal reflection, etc. Traditional machine learning-based gaze classifiers require hand-crafted feature extractors to extract these features from an image. The color, texture, and local features, such as edges, corners, etc., can be given as input to the classifier model. These individually created elements help to understand and differentiate between different classes. HOG (histogram of gradient) can describe an object’s shape, which is particularly helpful for human detection [Pang et al., 2011]. Local aspects of the image are provided by SIFT (scale invariant feature transform) and SURF (speeded up robust features) descriptors [Valgren & Lilienthal, 2007, Ta et al., 2009], which reflect the target’s specifics. However, because hand-crafted features cannot fully capture the essence of an image’s content, the identification accuracy is only adequate for simple tasks.
Extracted features are fed to different classifiers such as K-nearest neighbors (KNN), Support Vector Machine (SVM) [Lee et al., 2011, Chuang et al., 2014, Vasli et al., 2016], Random Forest (RF) [Tawari et al., 2014, Tawari & Trivedi, 2014, Fridman et al., 2016b, a] for gaze classification. A brief discussion of these models is given next.
For classification driver gaze zone, [Chuang et al., 2014] first detected the face in the input video frames using the Haars cascade classifier, then from the detected face, extracted a 14-dimensional feature vector, including the size and shape of the left iris, right iris, mouth, and nose. A multi-class linear support vector machine is employed on extracted features with a one-versus-one scheme where a binary function is learned between each pair of gaze zone classes. In another study based on head pose cue and iris, [Tawari & Trivedi, 2014] extract features from the face: landmark points on eye corners, nose corners, and nose tip. First, they classified gaze zones by measuring head pose in terms of Euler angles. Since using only the head pose, the trained model was confused between some nearby classes, such as forward and the speedometer, center console, and rearview mirror. Therefore they added eye pose features to improve the accuracy. Gaze zone classification using owl analogy (head movement a lot) and lizard analogy (eye movement a lot), [Fridman et al., 2016b] estimate both head and eye pose. For the head pose, 68 points multi-PIE facial landmark markup includes parts of the nose, the upper edge of the eyebrows, outer and inner lips, the jawline, and parts in and around the eyes, while for the eye pose, the pupil center by extracting points of iso-contour. The extracted features were fed to the RF classifier because of higher accuracy than KNN and linear SVM for the gaze zone classification. Adding an eye pose with a head pose increases 5.4 percent accuracy of the classification system.
-
1.
K-nearest neighbor (KNN or k-NN) is one of the simplest non-parameterized supervised learning algorithms developed in 1967 [Cover & Hart, 1967]. It uses the proximity of data points to classify or predict the grouping of individual data points. Although it can be used in both regression and classification problems, it is commonly used for classification problems, including gaze classification. The basic principle of KNN is that data points of the same class are closer to each other, while data points of different classes are far away. Therefore, the classification of a new test data point can be done by determining the classes of the training data points near the new test data point. In classification, class labels are allotted based on the majority vote, i.e., the labels of data points nearest to the new data point. One major disadvantage of KNN is that the classifier must check every training data point to classify each test data, making the model very slow during inference time.
-
2.
Support Vector Machine: SVM is a supervised learning algorithm that attempts to determine a maximum margin classification boundary between the training data points [Aizerman, 1964]. The objective function formulation is a quadratic optimization problem with linear constraints, which can be solved using QCQP (Quadratically Constrained Quadratic Program) solver. The solver can determine the unique solution if a linear decision boundary exists. The formulation where a linear decision boundary exists is called linear SVM. Even for non-linear decision boundaries, SVM can still work where the low-dimensional input feature space is transformed into a high-dimensional feature vector using a kernel trick. Kernel trick involves the application of kernel functions such as polynomial kernels, radial basis function (RBF) kernels, etc., for feature transformation. This is called non-linear SVM. The optimized objective function in SVM can be defined using a few specific data points only, called support vectors, which lie on the decision boundary. Therefore, SVM’s inference time is significantly faster than k-NN, where all training data points are required during inference. Further, since the feature vectors are transformed into high-dimensional vector space using kernels, SVMs are particularly useful for images with high-dimensional inherent feature space. In a study, Vasli et al. [Vasli et al., 2016] used a linear SVM to classify the six gaze zones, while Vicente et al. [Vicente et al., 2015] used to identify either driver was wearing sunglasses or not to estimate the driver gaze.
-
3.
Random Forest (RF): RF is an ensemble learning algorithm developed by Leo Breiman in 2001 [Breiman, 2001] for both classification and regression problems. It is a machine-learning technique using a group of decision trees. Each tree in the ensemble consists of a data sample drawn out from the training data with replacement, called a bootstrap sample. The determination of prediction will vary based on the type of the problem. For the classification task, a majority vote of the decision trees is used to determine the predicted class. RF model generation involves a selection of three hyperparameters: node size, number of decision trees, and number of feature samples. For gaze zone estimation RF classifier is used for zone classification or probability prediction in conjunction with the different feature sets. In a study [Tawari & Trivedi, 2014] used 60 trees for their experiments. While [Fridman et al., 2016b] generate a set of probabilities for each class from a single feature vector. RF classifier of depth 25 with an ensemble of 2000 trees is used for all the experiments. Driver gaze estimation literature mentioned some reasons why they preferred RF over KNN or SVM. The classification accuracy of random forest is higher than KNN and SVM, as mentioned in Table 2. It also gives the prediction probability over each class, and also a low number of tuning parameters are required.
4.2 Deep learning based gaze classification
This section will discuss deep learning-based gaze estimation, focusing on the convolutional neural network (CNN) based models for image classification. In the beginning, the basic architecture of deep neural networks is described, and then, after the use of different CNN models, for driver gaze estimation is discussed.
4.2.1 Basic architecture of deep neural network(DNN)
Deep learning (DL) is one of the specific branches of machine learning where a number of layers of stacked parameters are used for the learning process [Ketkar & Santana, 2017]. These parameters represent many factors that may impact the network’s outcome. Each layer has several perceptrons, also called neurons or hidden units, and carries the parameter weights. These parameters multiply the input of each layer, and the result is an output that shows how each parameter affects the input. Typically after each layer or multiple layers, nonlinearity function such as sigmoid, tanh, and rectified linear function (ReLU) [Glorot et al., 2011] are added to introduce the nonlinearity in the network. All these layers combined to make a deep neural network (DNN) [Schmidhuber, 2015]. The two main challenges in building a DNN are designing the structure of the networks (selection of the number of layers, neurons, and activation functions) and adjusting the weight of the parameters to train the neural network. The first challenge can be overcome simply by trial and error and prior experience. The second challenge can be reduced by using the backpropagation method to train the weight of the parameters in a supervised manner. The detailed discussion is given in the paper [Schmidhuber, 2015].
4.2.2 Convolutional neural network (CNN)
A convolution neural network introduced by LeCun et al. [LeCun et al., 1989] aims to increase classification accuracy and inference time based on computer-aided detection. Researchers [LeCun et al., 1989] and [Hubel & Wiesel, 1962] proposed that instead of using a fully connected layer, it is possible to use a single kernel and the shared weights to wisp the images and extract the local feature. This proposed approach improves the detection efficacy in terms of both classification accuracy and memory requirement when compared with traditional machine learning-based approaches, which require a handcrafted feature extractor [LeCun et al., 1998]. Usually, CNN consists of several convolutional layers, followed by pooling, nonlinearity, and a fully connected plus output layer at the top. The first three layers, convolution, pooling, and nonlinearity, are accountable for extracting the features, while fully connected layers and the output layer are used for image classification.
| Study |
|
|
Features |
|
Model |
|
||||||||||||||
|---|---|---|---|---|---|---|---|---|---|---|---|---|---|---|---|---|---|---|---|---|
|
1 (NIR) | 18 |
|
|
SVM |
|
||||||||||||||
|
1 (RGB) | 2 |
|
|
SVM | 97.4 | ||||||||||||||
|
2 (RGB) | 8 |
|
|
RF | 94.7 | ||||||||||||||
|
2 (RGB) | 6 |
|
|
RF |
|
||||||||||||||
|
1 (NIR) | 18 |
|
Shift descriptor | SVM | 90 | ||||||||||||||
|
1 (RGB) | 6 |
|
|
SVM | 93.7 | ||||||||||||||
|
1 (NIR) | 6 |
|
|
RF |
|
||||||||||||||
|
1 (NIR) | 6 |
|
|
RF | 91.4 | ||||||||||||||
|
1 (RGB-D) | 9 |
|
|
RF | 8.0° |
-
1.
Convolutional Layer: In CNN convolutional, layers consist of trainable parameters, each with learnable filters (kernels). Each filter has a width and height extended through the depth of the input volumes. When input enters the network, it spreads across the width and height of each filter, producing a 2D activation map or a feature map for each filter. Convolutional layers can reduce the model’s complexity by optimizing its output. This optimization can be done by using three hyperparameters, depth, stride, and setting zero padding [O’Shea & Nash, 2015].
-
2.
Nonlinearity Layer: It is also known as the activation layer. After each convolution layer, apply an activation function to check whether either neuron is active or not in the layer. The nonlinear activation function performs a nonlinear operation inside the input to make the network suitable for finding the complex pattern from the data. Different types of nonlinearity-providing activations functions are Sigmoid, Relu, Leaky Relu, Tanh, Softmax, etc. Of all of these, ReLu is the most commonly used activation function inside the CNN.
-
3.
Pooling Layer: The role of the pooling layer in CNN architecture is to reduce dimensionality, which further reduces the parameters and complexity of the model. It works over each feature map in the input and reduces its dimensionality using the MAX function [O’Shea & Nash, 2015]. There are several pooling techniques, out of which max pooling and average pooling are more commonly preferred in CNN [Akinyelu & Blignaut, 2020].
-
4.
Fully Connected Layer: In the fully connected layer, each neuron is fully connected to each neuron of the adjacent layers without being connected to the neuron within the layer. The fully connected layer takes the output (activation map) from the previous layer and converts it into a 1D vector, which is used as input to the layer. This 1D vector input passes through one or more fully connected layers.
-
5.
Output Layer: The final fully connected layer passes from the activation function (softmax) and gives the output, a continuous output in case of regression problem and discrete in case of the classification problem.
4.2.3 CNN models for driver gaze classification
Several state-of-the-art CNN-based models have been used for driver gaze classification mentioned in Table 3. These models are generally pre-trained on the large-scale ImageNet dataset [Deng et al., 2009] and applied to driver face data collected using RGB or NIR cameras. We first discuss studies that used RGB camera data, followed by NIR camera-based studies. In a study [Choi et al., 2016] proposed a CNN model inspired by Alexnet architecture [Krizhevsky et al., 2012], consisting of three convolutional, three pooling, two fully connected, and one output layer for nine gaze zone classifications. The pooling layer between the convolutional layers was taken from the original Alexnet architecture [Krizhevsky et al., 2012], and the prediction probability of each gaze zone was derived from the final output layer using the rectified linear unit. The proposed CNN model achieved a 95.0 % accuracy for nine gaze zone classifications for their datasets. Studies have focused on leveraging the advantage of large-scale CNN models by developing gaze classification models that can generalize for different drivers, driver position and perspective, lighting conditions, etc. In a study [Vora et al., 2018] collected ten drivers’ gaze data in naturalistic driving conditions during dry weather in the daytime to build a generalized driver gaze classification model using CNN architecture. The driver face data were further cropped into half-face, full-face, and face with context. Each data type was classified by fine-tuning VGG16 [Simonyan & Zisserman, 2014] and Alexnet pre-trained CNN model. They achieved the highest accuracy of 88.9 % and 93.4 % accuracy in half-face data type by using AlexNet and VGG16, respectively. The reason for getting higher accuracy on the upper half face as compared to the full face and face with context is that upper half face images can extract finer features of the eyes, like the position and shape of the iris and eyelid, which explains its better performance. One of the challenges in gaze classification is a reflection or low visibility due to eyeglasses. This study [Rangesh et al., 2020] attempted to overcome the eyeglass challenges by removing the eyeglasses in the natural driving environment using the Gaze Preserving CycleGAN (GPCycleGAN) model. After removing the eyeglasses, these images were given as input to the SqueezNet [Iandola et al., 2016] CNN model for gaze classification in seven zones and achieved an accuracy of 72.3 % accuracy.
Gaze classification using RGB cameras discussed above suffers during low light and sunlight reflection on the driver’s face. To solve this problem, [Naqvi et al., 2018] and [Yoon et al., 2019] collected driver face data using NIR camera. Naqvi et al. [Naqvi et al., 2018] used three separate VGG models, one each for the driver’s face, left eye, and right eye, respectively. The authors extracted 4096 features from each input type and calculated the Euclidean distance between them. Finally, the gaze zone was classified based on the score level fusion from the three groups of features. The accuracy of the proposed system was measured using two metrics: strictly correct estimation rate (SCER) and loosely correct estimation rate (LCER). SCER refers to the ratio of the number of strictly correct frames divided by the total number of frames. The strictly correct frame represents the frame where the estimated gaze zone is equivalent to the ground truth gaze zone. LCER refers to the ratio of the number of loosely correct frames divided by the total number of frames. The loosely correct frame represents the frame where the estimated gaze zone is placed within the ground truth gaze zone or its surrounding zones. The system achieved 92.8 % and 99.6 % accuracy in SCER and LCER, respectively. On the other hand, [Yoon et al., 2019] captured the drive frontal face and right side face images with two NIR cameras. The captured images consisted of the driver’s face area and some context regions. They used the Dlib facial feature trackers [Kazemi & Sullivan, 2014] to detect 68 facial landmark points on the driver’s face and detect the driver’s face and eye images from the originally captured image consist the face and context region. They have a total of six images that include the right eye, left eye, and face region of interest (ROI) of the front camera and those of the side camera. These six images were then combined to make a single image of three channels. Among the three channels, the front and side images of face ROIs are arranged top to bottom in the first channel, the front and side images of left eye ROIs are arranged top to bottom in the second channel, and the front and side images of right eye ROIs are arranged vertically in the third channel. Finally, three ResNet models, ResNet-50, ResNet-101, and Resnet-152 [He et al., 2016], were finetuned to trained on the dataset, which achieved an accuracy of 92.9, 79.1, 90.2 % in SCER, and 99.5, 97.1, 99.2 % in LCER, for the respective model.
Deep learning-based CNN models are preferred for gaze estimation because of their higher ability to learn complex features, such as large head and eye movement(relative position of pupil center, iris center, corneal reflection) detection, robustness to variations in vehicle type, driver’s head, different lighting conditions, such as low light, sunlight reflection on the face and improved classification accuracy. These models can handle large amounts of data, which is used for improving the model’s training to learn a complex feature and hence helpful in the finer gaze zone classification of the model.
| Study |
|
|
Description |
|
Accuracy (%) | ||||||||
|---|---|---|---|---|---|---|---|---|---|---|---|---|---|
|
1 (RGB) | 9 |
|
AlexNet | 95.0 | ||||||||
|
1 (RGB) | 7 |
|
|
|
||||||||
|
1 (NIR) | 17 |
|
VGG16 |
|
||||||||
|
2 (NIR) | 15 |
|
|
|
||||||||
|
1 (IR) | 7 |
|
SqueezeNet | 72.4 | ||||||||
|
1 (RGB) | 8 |
|
OpenFace | 92.5 |
5 Applications of Driver Gaze
Driver gaze estimation is essential from several aspects. One critical aspect of driver gaze is understanding driver gaze behavior at different road sections, which helps to build safer road infrastructure and safety systems for drivers. Driver gaze is also used to build a driver’s distraction detection system, attentiveness warning system, and advanced driver assistance system. Driver gaze behavior shows awareness of the driver of the surrounding traffic, such as vehicles coming from different traffic streams, road infrastructure such as traffic signs or traffic lights, road markings, etc., and roadside infrastructures such as buildings, trees, advertising hoardings, billboards, etc. It also shows whether the drivers check their surroundings before performing different traffic maneuvers such as lane changing, merging/diverging in on-ramp/off-ramps, and left/right turning at intersections. A detailed discussion of each aspect is provided in the following sections.
5.1 Gaze behavior at intersections
Intersections are known for their complex nature because of different participants’ behavior and interactions [Shirazi & Morris, 2016]. Interactions at intersections are vehicle-to-vehicle (V2V) [Harding et al., 2014, Liu et al., 2018, Ye et al., 2019], vehicle-to-pedestrian (V2P) [Anaya et al., 2014, Liu et al., 2018, Sewalkar & Seitz, 2019], vehicle-to-infrastructure (V2I) [Milanés et al., 2012, Liu et al., 2018], and pedestrian-to-infrastructure (P2I) [Liu et al., 2018]. In this paper, the first three interactions are essential for the driver’s interactions with vehicles, pedestrians, and infrastructures.
This section will discuss how the driver’s gaze is influenced when the driver approaches, maneuvers (left turning, right turning, and going straight), and leaves the intersection. Literature on driver gaze behavior at intersections is broadly divided into three categories based on the driver’s age or experience (novice, young experienced, old experienced), intersection types (signalized or unsignalized), and surrounding traffic environments (traffic density and familiarity), mentioned in Table 4. The discussion in this paper will be based on left-hand driving to maintain uniformity in the paper. A few studies compared driver glance behavior based on their age or experience while approaching or negotiating through the intersection [Bao & Boyle, 2009, Dukic & Broberg, 2012, Scott et al., 2013, Romoser et al., 2013, Savage et al., 2020, Chung et al., 2022].
In real driving scenarios, [Bao & Boyle, 2009] measured driver gaze scanning behavior in terms of the proportion of glances made by the drivers in the right, left, and rearview mirrors and the entropy rate in scanning. They found that middle-aged drivers (35-55 years old) had higher scanning randomness (i.e., a greater entropy rate) than older drivers (65-80 years old). Comparing glance frequency and average glance duration between younger and older drivers, [Dukic & Broberg, 2012] found older drivers looked more at road lines and markings to position themselves in surrounding traffic.
some other simulation-based studies examine the age and experience effect on driver gaze. While selecting a safe gap at an unsignalized intersection (USI), [Scott et al., 2013] compared glance transition patterns of three groups of drivers, including novice (mean age 20.57 years; SD=2.47 years), young experienced (mean age 23.79 years; SD=3.04 years) and older experienced (mean age 66.43 years; SD=5.03 years) on a right turn and divided intersection approach time into scanning and decision phases. The scanning phase was the first 10 seconds in which driver’s not found any negotiable gaps, while the next 5 seconds was the decision phase immediately before initiating maneuvers. The results showed that young, experienced drivers distributed their gaze more evenly across all gaze zones, whereas older and novice drivers had more sweeping transitions, bypassing adjacent areas. In a study, [Romoser et al., 2013] examined four hypotheses to determine why older drivers fail to scan effectively at intersections compared to young drivers. The four hypotheses were difficulty with head movements, increased distractibility, and failure to recall specific scanning patterns. None of the hypotheses fully explained the above reason. Still, the research does support the alternative theory that some of the issues older drivers experience when looking at junctions are due to unique attentional weaknesses in the older drivers’ ability. As a result, older drivers fail to gaze at scan hazardous areas outside of the vehicle’s intended path of travel. The effect of age and guidance type (lead car and GPS) was examined by [Savage et al., 2020] on gaze scanning while approaching an intersection. Overall guidance by the lead car was slightly reduced the gaze scanned when the driver was close to the intersection. As compared to younger drivers, the average scan magnitude was smaller for older drivers. [Chung et al., 2022] compared the static (dwell time) and dynamic (gaze transitions) gaze of novice and experienced drivers. Static analysis of novice drivers shows higher dwell time in an area of interest (AOI) than experience. The gaze transition of novice drivers between AOI at a close distance while experienced driver check surrounding traffic conditions for vehicle driving.
The general observation from these studies was older drivers, compared to younger drivers, scan fewer right and left areas of interest and focus more straight ahead or in the intended direction of vehicles. This behavior may explain the fact that older drivers are more involved in angle crashes at intersections and ”failure to yield” when involved in ”seen but not seen” crashes and accidents with other vehicles [Stutts et al., 2009].
In addition to studies focussing on driver scanning behavior in younger and older drivers, researchers have also focussed on driver gaze behavior in signalized intersections (SI) and unsignalized (USI) intersections. This study, [Li et al., 2019] compared driver glance allocation frequencies, durations, and transition probabilities at SI and USI to examine the influence of intersection types on driver scanning measures. Visual scanning performance was found to be similar between SI and USI in the through and left-turning movements while right-turning at SI; drivers give more attention to the forward and right areas than at USI. An approaching the SI, in two different studies, [Lemonnier et al., 2015, 2020] examined the impact of the three-factor priority rule (yield, priority, and stop), expected traffic density (no traffic, light, and heavy), and familiarity on the allocation of visual information. Three traffic densities were simulated: no traffic at all, light traffic (on average spaced 250 m from each other, 10 s time gap), and heavy traffic (on average spaced 100 m from each other, 4 s time gap). The dwell time in intersecting road AOI was found to be higher in yield than in priority condition and smallest in stop sign condition. They also found that the horizontal gaze eccentricity was higher with lower traffic density than higher traffic density. Horizontal eccentricity is defined as the absolute value of the horizontal component of the gaze (and head) direction angle. Familiarity was introduced, bypassing the driver on the first and second time on the same proposed route. Higher horizontal eccentricities were found in the first passage compared to the second one. This indicates that Visual information related to the decision-making task starts later when the driver is slightly familiar with the environment.
| Study | Study area |
|
Gaze behavior | Key findings | ||||||||||||||||||
|---|---|---|---|---|---|---|---|---|---|---|---|---|---|---|---|---|---|---|---|---|---|---|
|
|
|
|
|
||||||||||||||||||
|
|
|
|
|
||||||||||||||||||
|
|
|
|
|
||||||||||||||||||
|
|
|
|
|
||||||||||||||||||
|
|
|
|
|
||||||||||||||||||
|
|
|
|
|
||||||||||||||||||
|
|
|
|
|
||||||||||||||||||
|
|
|
|
|
||||||||||||||||||
|
|
|
|
|
5.2 Over taking/lane changing gaze behavior
Overtaking or lane-changing occurs in the traffic stream when all vehicles do not move at the design speed [Chandra & Shukla, 2012]. Here we are considering lane-changing gaze behavior for the overtaking of the vehicles. A leading vehicle moving at a slow speed hinders the following fast-moving vehicle, provoking the following vehicles to overtake, and lane changing occurs. A sequence of different glance patterns can be seen before the lane change starts to know the possible threats from the surrounding traffic. In lane changing broadly, two kinds of study have been done: driver gaze behavior understanding during a lane change and predicting lane changes based on driver gaze.
In a simulation study, [Salvucci & Liu, 2002] found that drivers began to exhibit notably different gaze behavior about three seconds before the lane change (independent of the vehicle speed), with an increase in the frequency of glances in the rearview mirror at the expense of glances in the direction of their current lane. As soon as the driver decides to change lanes, their eyes typically move from salient guiding features of the present lane (such as the tangent point or the lead car) to salient guiding features of the destination lane. Additionally, drivers increase their gazes at surrounding vehicles during lane changes to help with situation awareness and decision-making. Another simulation-based study by [Lavalliere et al., 2011] tested the influence of age differences in glances to the blind spot and mirrors when changing lanes. Compared to younger drivers, older drivers were found to show reduced glance frequency in checking towards the left side mirror, rearview mirror, and blind spot. This behavior of drivers may explain the observations made by [Stutts et al., 2009] that older drivers were more likely to be involved in collisions when changing lanes.
In addition to studies focussing on driver lane changing gaze behavior, researchers have also focussed on driver lane change prediction behavior using gaze information and other sensor data. The literature on lane change behavior prediction is categorized in three ways: (a) Uses vehicle-based data [Kuge et al., 2000, Dogan et al., 2011, Castignani et al., 2017, Zyner et al., 2017, Mahajan et al., 2020, Guo et al., 2021], (b) Driver state-based (gaze-based prediction) [Itoh et al., 2007, Wei et al., 2013, Long et al., 2022], and (c) Driving environment-based data [Oliver & Pentland, 2000, Doshi & Trivedi, 2009, Peng et al., 2020]. Lane-changing prediction based on vehicle information, such as speed, lateral and longitudinal acceleration, etc., is not considered any gaze-related information. So this section will discuss only driver state-based and driving environmental-based lane change behavior prediction. Research on lane change prediction indicates that the driver’s glances give an intent [Salvucci & Liu, 2002, Doshi & Trivedi, 2009, Pech et al., 2014, Martin et al., 2018], as an early indicator, before a lane change. The sequence of lane change on the highway has been defined by considering three parameters: reference point, start time, and end time. The lane marking has been defined as the reference point, while the start point is considered as the time just before touching the lane marking. Similarly, end time is taken as the time when the tire just crosses the reference lane marking. Since three seconds is usually taken as the critical decision-making [Lee et al., 2004, Mourant & Donohue, 1974] time for a lane change, several studies considered 3-5 seconds [Salvucci & Liu, 2002, Doshi & Trivedi, 2009, Martin et al., 2018, Long et al., 2022] duration before the start time to analyze the driver gaze behavior.
In real-time, lane change behavior prediction using driver gaze considers either eye movement, head movement, or sometimes both. Lane change prediction based on eye movements in a simulation-based study, [Long et al., 2022] proposed a 4DDTW (four-dimensional dynamic time warping) KNN-based lane-changing prediction approach to overcome the challenge of prediction accuracy. Driver gaze was captured using an eye tracker, which consists of a scene camera to capture the scene image and map the angle of vision of the eyes in the scene image to get the x and y coordinates of the left and right eye, which is further used to estimate the gaze. They used a sliding-space time algorithm to extract the scanpath of the left and right eyes in time series data. 4DDTW was used to find the similarity between the scanpath and then applied KNN on each sample to classify left lane change, right lane change, and lane keeping. The KNN classifier results were compared with the existing LSTM-based approach and achieved 86.5 % and 86.3 % accuracies, respectively. Study [McCall et al., 2007, Doshi & Trivedi, 2009] used only the head movements (Head movement classes such as left, front, right, etc.) to improve the relevance of vector machine-based classifiers for predicting lane change. Lane change prediction by considering only eye gaze fails in adverse lighting conditions, so integrating head movement with eye movement overcomes these challenges to some extent. In this study, [Martin et al., 2018] developed a machine vision-based lane change behavior, predictor. They classified dynamic lane change behavior into three classes: left or right lane change and lane keeping. A 10-second time window is considered to analyze the behavior, which comprised 5 seconds just before touching the lane marking and another 5 seconds after crossing the lane marking. Each time window consisted of multiple scanpath for each class, which were further used to extract features such as minimum, maximum, and average glance duration, frequency, and gaze accumulation in each gaze zone. The lane change gaze behavior for corresponding maneuvers was modeled using the multivariate normal distribution (MVN) and obtained an accuracy of around 75.0 % right and left lane change prediction.
Before and during the lane change, frequently looking gaze zones were rearview mirrors, left-wing and right-wing mirrors, statistics of fixations, scanpath were further used for the lane change prediction model.
5.3 Driver gaze behavior on curve, On-ramp and off-ramp sections
This section will cover the driver gaze behavior traveling on different road locations, such as on curve, on-ramp, and off-ramp. In a study, [Lehtonen et al., 2014] examined the look ahead fixation driving experience behavior when approaching and negotiating the curve on a rural road. They found over the curve; experienced drivers spent more time on look-ahead fixation than the road ahead. In order to obtain accurate foveal information from the rest of the curve, drivers need to make an eccentric fixation towards the road further up, disengaging the gaze from the visual guidance of online control of steering; these fixations have been called look-ahead fixations. Compared to the entry phase, the driver’s look-ahead fixation behavior is more on the approach phase because the turning steering driver needs a higher visual demand at the curve [Tsimhoni & Green, 2001, Lehtonen et al., 2014]. One of the measures of driver distraction is the measure of the eye off the road. The eye off the road indicates that the driver is looking somewhere else rather than looking at the road. The eye off the road delays the reaction time of the driver and causes a higher risk of accidents [Lamble et al., 1999, Bärgman et al., 2015, dingus2016drive]. In a study, [Zwahlen et al., 2003] investigated the effect of ground-mounted diagrammatic guide signs on drivers eye scanning before entrance of freeway ramps. The diagrammatic guide sign is a type of sign that indicates the destination using large map-like figures of the road layout. The study’s findings revealed that ground-mounted signs on multi-lane arterials do not excessively distract drivers or influence eye-scanning behavior detrimentally. In situations where placing overhead span type sign bridges can not be economically feasible and placing these signs is highly desirable for driver’s guidance, these diagrammatic signs give unfamiliar drivers more navigational information in advance (by identifying the correct lane to access the desired entrance ramp).
In addition to real-world experimental studies, simulation studies have also been done to understand driver gaze behavior in on-ramp and off-ramps. In this study, [Mecheri et al., 2022] checked how the presence of pavement shoulder influences driver gaze in the right bend curve on a two-lane rural highway. The results showed that the driver’s gaze shifted towards the inside of the curve, followed by the steering trajectory, irrespective of the width of the shoulder. They suggested that the delineator on the curve is more useful to bring the driver’s gaze and vehicle back to the lane. Further, [Zahabi et al., 2017] analyzed the effect of driver age, specific service sign content and format, and familiarity with the road sign on the performance and attention level of the driver when exiting the freeways, i.e., on-ramps and off-ramps. Drivers were found to identify six-panel signs more accurately than nine-panels and were found to be more accurate when familiar with the road sign. Six-panel or nine-panel sign board contains six or nine panels in which each panel has different information signs or symbols. In contrast, familiarity with the road sign means the driver priory has seen or knows about the meaning of the signs. Older drivers pay more attention to the driving task for attention level allocation than middle-aged and younger drivers.
5.4 Influence of roadside advertising structure on driver gaze behavior
A recurring finding in the literature is that there appears to be a link between crashes [Sisiopiku et al., 2015, Wallace, 2003] and the presence of roadside advertising. In literature, different studies have investigated the effect of different advertisement characteristics on driver behavior. Some of the attributes of the advertisement are its nature, placement, content, road, and traffic characteristics, type of area, and driver characteristics [Anciaes, 2022].
Compared to traditional static road sign, electronic roadside advertising have been usually found to have a more significant influence on the driver’s attention, which cause a higher safety risk for the general public [Beijer et al., 2004, Roberts et al., 2013, Dukic et al., 2013, Herrstedt et al., 2017, Oviedo-Trespalacios et al., 2019]. Further, roadside advertising billboards’ brightness levels and illumination also affect visual driver behavior. Driver gaze is attracted when the luminance changes in the visual field [Roberts et al., 2013, Oviedo-Trespalacios et al., 2019]. In a simulated study, [Herrstedt et al., 2017] examined the impact of LED advertising signs on driver gaze behavior. They found that average glance duration was higher for LED-based signs compared to other objects (e.g., non-Led signs, hoardings, rearview mirrors, speedometer, etc.) In comparison to control parts of the road with no billboards, drivers on the section of the road with billboards drove at lower mean speeds, with more speed variability, lane position variability, time spent at high-risk headway, and more visual fixations. The least detrimental effects on driving outcomes were caused by billboards with simple (versus complex) content presented for a longer dwell time (60 seconds versus 40 or 20 seconds). Regardless of dwell time, the billboards with complex content had similar adverse effects on driving. In this study, [Vickers, 2017] observed that the drivers confronting potential risks glanced more at street-level advertisements than the ones raised three meters from the street light. When the vehicle speed is low, drivers have been found to pay more attention to the electronic billboards and other advertising at the junction than other road locations [Abbas & Haghighi, 2020]. Further, the frequency of glances has been found to be higher in retail areas [Mollu et al., 2018], while the longer duration of glances has been found in rural areas [Costa et al., 2019].
5.5 Building advanced driver assistance system
An advanced driver assistance system (ADAS) is an automated system that assists the driver when the driver fails or misses some events in nearby traffic [Fletcher et al., 2005]. Since driver gaze information is an important input variable to measure a driver’s attentiveness from the surrounding traffic environment, it plays an important role in building an advance driver assistance system.
In a real driving scenario, [Fletcher et al., 2005] made a driver assistance system using driver gaze direction and speed limit sign. When the traffic sign is recognized, the system checks two things (a) the drivers looking at the sign and (b) whether the speed and acceleration of the vehicle are compliant with the sign. If the vehicle state was not compliant and the driver had not seen the sign, a high-priority warning was given to the driver. In another study, [Fletcher & Zelinsky, 2009] made a driver inattention detection system using eye gaze and road events. Multiple road event inattention detection system was built, and one of them was a road center inattention detection system. A warning is given whenever the driver’s gaze has been diverted from the forward direction for a specified period of time. At the same time, the specified period was the function of the inverse of the vehicle speed. Driver distraction also contributes to too many road crashes, [Ahlstrom et al., 2013] made an AttenD Algorithm as a distraction detection warning system, which can mitigate some of these crashes. One assumption of this study is that driver attention is directed toward the same object as the gaze, which may or may not be true in actual driving.
6 General Discussion and Future Scope
Over the past decade, significant progress has been made toward driver gaze estimation by gaze zone classification and tracking. Driver gaze data collection methods and equipment have also evolved over the years. Gaze estimation has evolved from coarse gaze zone classification to finer gaze zone classification, and gaze classification models have been developed using traditional machine learning techniques to deep learning algorithms. Detected driver gaze is used to analyze the driver’s surrounding awareness and attentiveness, build a safety system, and also used to make safer driving guidelines for the drivers. However, there are still research gaps existing in the current studies that can be handled in the future, which can help to further evolution of this domain, ultimately helping in building a safer transportation system.
6.1 Benchmark datasets and collection methodologies
As discussed in Section 3, benchmark open-source gaze data, discussed in Table 1, have been typically collected in parked or moving vehicles. Mostly, the parked vehicle data collection participants are college or university students [Ribeiro & Costa, 2019, Dua et al., 2020, Ghosh et al., 2021], who can have limited knowledge of how head movement or eye movements occur during real driving scenarios. Datasets collected in real driving scenarios have been limited in terms of the number of participants (drivers) [Nuevo et al., 2010, Diaz-Chito et al., 2016, Jain et al., 2016, Schwarz et al., 2017, Palazzi et al., 2018]. A limited number of participants in real driving datasets are also not diversified in terms of experience, age, and lighting conditions, traffic conditions. Therefore, large scale open source gaze datasets can be created encompassing different environmental and lighting conditions, which can help in the development of a robust and generalized system of gaze estimation based on deep learning techniques.
Further, there are inherent problems in classifying gaze zones inside a parked vehicle compared to real world driving scenarios. The ground truth labels of the gaze data in which the driver is looking from inside the parked vehicle are easy and safer for the driver. However, this method may affect the psychological behavior of the drivers because, in this method, a second person is giving the instructions [Costa et al., 2019, Ghosh et al., 2021] to the driver to look towards particular gaze zones for the labels, or the driver has been informed earlier to look at predefined gaze zones. This study [Chuang et al., 2014] revealed that the gaze zone classifier created using parked vehicles could not successfully generalize to a moving vehicle. While doing driver gaze data collection in moving vehicles, drivers gaze naturally in the dashboard and windshield area, but getting the ground truth labels of gaze zones is difficult in this situation. Since, in this method, drivers can not look towards the gaze zone by instructions due to accident risk, unsupervised techniques can be used for estimating the gaze zone class [Chuang et al., 2014].
Apart from data collection strategies, there are also limitations in ground truth generation methodology for gaze datasets. Datasets collected in the parked vehicle have been annotated by two or more human annotators and cross-verified. However, these datasets do not typically mention any data statistics on how much the difference or error was observed during ground truth generation of the different annotators and how to handle such cases. Also, gaze data annotations by humans cannot be assumed due to 100% accurate, which can impact gaze classification algorithms too. Ground truth generation by speak2label [Ghosh et al., 2021] is an automatic way of ground truth generation, but they still have the limitations of data generation inside parked vehicle, described before. Ground truth labels of existing driver gaze datasets are given based on the zone in which the driver is looking. These labels are the predefined regions such as rearview mirror, forward, left wing mirror, right wing mirror, center stack, speedometer, etc. These datasets do not clearly mention the surrounding data collection conditions except DGaze. During recording the DGaze datasets, moving traffic was shown on the screen, and the gaze zones were based on the vehicle entities [Dua et al., 2020]. Therefore, in future, gaze datasets can be classified not only based on the gaze zone but can also denote the vehicle entities observed, which can help in understanding driver gaze behavior better.
Finally, the datasets mentioned in Table 1 captured the driver’s face using a single camera. However, in case of large head movement, one face side is occluded by the other face side, thereby creating problems in detecting the iris or pupil position inside the eye. Therefore, in such cases, estimating the driver’s actual point of gaze is very challenging. These limitations can be overcome by using multiple cameras and capturing the driver’s face at different angles or positions. From the above discussion, we can conclude that there is a need for more extensive gaze data collection, which can be based on real world driving, incorporating a large number of drivers (both male and female), with and without eyeglasses, including all possible lighting and weather conditions. The ground truth based on the point of gaze (POG) can be created with the help of an eye tracker and compared with human annotation too.
6.2 Algorithms and models for driver gaze classification
Driver’s gaze zone classification using traditional machine learning and deep learning-based methods has its own limitations. In traditional machine learning-based gaze classification, the decision made by the classifier completely depends on the individual sub-model (face, pupil detection, landmark estimation, feature extraction), which affects the accuracy of the classification. The hand-crafted features designed from facial landmarks on the eyes are not completely robust to variations across different drivers, cars and seat positions, etc. On the other hand, gaze zone classification using a pre-trained CNN model does not require hand-crafted features because of inherent feature extraction quality. However, these models require large-scale datasets and more computational power for their training compared to traditional machine-learning classifiers. The availability of large-scale open-source datasets with different illumination conditions and more subjects can help build a robust classifier. Also, gaze estimation models can focus on estimating the exact point of gaze instead of gaze zones in the windscreen, right and left-wing mirror only. This can help to understand driver attention on different traffic entities, such as vehicles, pedestrians, etc., and other surrounding objects, such as billboards, traffic signs, etc. This can also help to understand driver behavior during complex traffic maneuvers such as intersections, on-ramps, off-ramps, etc.
6.3 Applications of driver gaze
There has been a significant number of driver gaze behavior studies that have focused on maneuvering through intersections, lane changing during overpassing, etc. However, most of these studies are either based on comparing different driver groups, such as younger versus older, or based on experience, such as novice versus experienced. A few studies, based on real driving [Lemonnier et al., 2020] and simulator [Lemonnier et al., 2015], evaluated the impact of traffic density and the familiarity of the route at intersections on the driver gaze. Further, gaze behavior studies on mixed traffic conditions and unstructured driving environments are also minimal; only one study in real driving compared the gaze pattern of drivers on SI and USI [Li et al., 2019]. Hence, more research is needed on driver gaze behavior in mixed-traffic environments, which can include the effect of pedestrians, traffic density, intersection type, etc., along with focusing on unstructured driving environments too.
Gaze behavior, on eye trackers-based studies, used the terminologies such as fixation, dwell time, and saccades; on the other hand, studies based on the remote setup used the terminologies such as glance duration, glance frequency, and gaze transitions to define driver gaze behavior. They explain the gaze behavior based on the statistics such as minimum, and maximum glance duration, glance frequency, number of fixations, dwell time in each gaze zone, glance or gaze transitions, saccades between the gaze zones, etc. However, these studies do not consider the effect of different traffic entities’ shapes and sizes on driver gaze. For example, does the influence of small vehicles (cycles, motorcycles) on driver gaze are same or different than the large vehicle such as trucks, buses, etc.? More detailed analysis on understanding such gaze behavior will be helpful in determining driver attentiveness and build a safer driving environment.
Gaze research can also be incorporated and extended with other physiological sensors such as heartbeat (fitbit) [Lu et al., 2022, Othman et al., 2022], EEG (Electroencephalography) [Tuncer et al., 2021, Arefnezhad et al., 2022] etc., to understand driver gaze behavior comprehensively. Since connected and autonomous vehicles are the emerging future of intelligent transportation systems, much research is required to know how the driver’s gaze is influenced in the surrounding traffic, including autonomous or connected vehicles. Very limited research on the use of driver gaze in building assistance driver systems. So there is significant scope for researchers and industry experts to build a robust and generalized driver assistance system that will help drivers perform safe maneuvers at intersections, overpassing, etc. Driver gaze behavior understanding can also help in taking steering control from manual to semi-automatic when the driver is not fully attentive to the surrounding traffic environment.
7 Conclusion
Driver gaze plays an important role in different driving gaze-based applications, such as driver attentiveness detection, visual distraction detection, and taking automatic steering control. This study thoroughly summarizes different terminologies used in driver gaze estimation and behavior understanding based on head-mounted or remote setup-based techniques and compiles the existing benchmark gaze estimation datasets. We also reviewed different gaze estimation algorithms and their applications on different gaze behavior understanding, such as negotiating at intersections, lane changing during overpassing, moving on the curve, on-ramp and off-ramp, the influence of roadside advertising infrastructure, etc. Compared to traditional machine learning, deep learning-based approaches are more robust in detecting the driver gazes in different lighting conditions and large head movements. Finally, we have provided some suggestions and the future scope to the researchers and the developers, which can help them to build a more robust and generalized driver gaze estimation and gaze-based driving assistance system.
Acknowledgement
Our research results are based upon work supported by the Initiation Grant scheme of Indian Institute of Technology Kanpur (IITK/CE/2019378). Any opinions, findings, and conclusions or recommendations expressed in this material are those of the author(s) and do not necessarily reflect the views of the IITK.
CRediT authorship contribution statement
Pavan Kumar Sharma: Conceptualization, Formal analysis, Methodology, Investigation, Writing. Pranamesh Chakraborty: Conceptualization, Methodology, Investigation, Supervision, Writing.
Declaration of competing interest
The authors declare that they have no known competing financial interests or personal relationships that could have appeared to influence the work reported in this paper.
References
- Abbas & Haghighi [2020] Abbas, S., & Haghighi, F. (2020). Driver distraction by digital billboards. structural equation modelling based on naturalistic driving study data: a case study in iran. J. Saf. Res, 72, 1–8.
- Ahlstrom et al. [2013] Ahlstrom, C., Kircher, K., & Kircher, A. (2013). A gaze-based driver distraction warning system and its effect on visual behavior. IEEE Transactions on Intelligent Transportation Systems, 14, 965–973.
- Aizerman [1964] Aizerman, A. (1964). Theoretical foundations of the potential function method in pattern recognition learning. Automation and remote control, 25, 821–837.
- Akinyelu & Blignaut [2020] Akinyelu, A. A., & Blignaut, P. (2020). Convolutional neural network-based methods for eye gaze estimation: A survey. IEEE Access, 8, 142581–142605.
- Anaya et al. [2014] Anaya, J. J., Merdrignac, P., Shagdar, O., Nashashibi, F., & Naranjo, J. E. (2014). Vehicle to pedestrian communications for protection of vulnerable road users. In 2014 IEEE Intelligent Vehicles Symposium Proceedings (pp. 1037–1042). IEEE.
- Anciaes [2022] Anciaes, P. (2022). Effects of the roadside visual environment on driver wellbeing and behaviour–a systematic review. Transport Reviews, (pp. 1–28).
- Arefnezhad et al. [2022] Arefnezhad, S., Hamet, J., Eichberger, A., Frühwirth, M., Ischebeck, A., Koglbauer, I. V., Moser, M., & Yousefi, A. (2022). Driver drowsiness estimation using eeg signals with a dynamical encoder–decoder modeling framework. Scientific reports, 12, 1–18.
- Bao & Boyle [2009] Bao, S., & Boyle, L. N. (2009). Age-related differences in visual scanning at median-divided highway intersections in rural areas. Accident Analysis & Prevention, 41, 146–152.
- Bärgman et al. [2015] Bärgman, J., Lisovskaja, V., Victor, T., Flannagan, C., & Dozza, M. (2015). How does glance behavior influence crash and injury risk? a ‘what-if’counterfactual simulation using crashes and near-crashes from shrp2. Transportation Research Part F: Traffic Psychology and Behaviour, 35, 152–169.
- Beijer et al. [2004] Beijer, D., Smiley, A., & Eizenman, M. (2004). Observed driver glance behavior at roadside advertising signs. Transportation Research Record, 1899, 96–103.
- Birrell & Fowkes [2014] Birrell, S. A., & Fowkes, M. (2014). Glance behaviours when using an in-vehicle smart driving aid: A real-world, on-road driving study. Transportation research part F: traffic psychology and behaviour, 22, 113–125.
- Breiman [2001] Breiman, L. (2001). Random forests. Machine learning, 45, 5–32.
- Brolly & Mulligan [2004] Brolly, X. L., & Mulligan, J. B. (2004). Implicit calibration of a remote gaze tracker. In 2004 Conference on Computer Vision and Pattern Recognition Workshop (pp. 134–134). IEEE.
- Castignani et al. [2017] Castignani, G., Derrmann, T., Frank, R., & Engel, T. (2017). Smartphone-based adaptive driving maneuver detection: A large-scale evaluation study. IEEE Transactions on Intelligent Transportation Systems, 18, 2330–2339.
- Chandra & Shukla [2012] Chandra, S., & Shukla, S. (2012). Overtaking behavior on divided highways under mixed traffic conditions. Procedia-Social and Behavioral Sciences, 43, 313–322.
- Chen et al. [2019] Chen, X., Wang, S., Shi, C., Wu, H., Zhao, J., & Fu, J. (2019). Robust ship tracking via multi-view learning and sparse representation. The Journal of Navigation, 72, 176–192.
- Cheng et al. [2021] Cheng, Y., Wang, H., Bao, Y., & Lu, F. (2021). Appearance-based gaze estimation with deep learning: A review and benchmark. arXiv preprint arXiv:2104.12668, .
- Choi et al. [2016] Choi, I.-H., Hong, S. K., & Kim, Y.-G. (2016). Real-time categorization of driver’s gaze zone using the deep learning techniques. In 2016 International conference on big data and smart computing (BigComp) (pp. 143–148). IEEE.
- Chu et al. [2010] Chu, B. S., Wood, J. M., & Collins, M. J. (2010). The effect of presbyopic vision corrections on nighttime driving performance. Investigative ophthalmology & visual science, 51, 4861–4866.
- Chuang et al. [2014] Chuang, M.-C., Bala, R., Bernal, E. A., Paul, P., & Burry, A. (2014). Estimating gaze direction of vehicle drivers using a smartphone camera. In Proceedings of the IEEE conference on computer vision and pattern recognition workshops (pp. 165–170).
- Chung et al. [2022] Chung, J., Lee, H., Moon, H., & Lee, E. (2022). The static and dynamic analyses of drivers’ gaze movement using vr driving simulator. Applied Sciences, 12, 2362.
- Costa et al. [2019] Costa, M., Bonetti, L., Vignali, V., Bichicchi, A., Lantieri, C., & Simone, A. (2019). Driver’s visual attention to different categories of roadside advertising signs. Applied ergonomics, 78, 127–136.
- Cover & Hart [1967] Cover, T., & Hart, P. (1967). Nearest neighbor pattern classification. IEEE transactions on information theory, 13, 21–27.
- Deng et al. [2009] Deng, J., Dong, W., Socher, R., Li, L.-J., Li, K., & Fei-Fei, L. (2009). Imagenet: A large-scale hierarchical image database. In 2009 IEEE conference on computer vision and pattern recognition (pp. 248–255). Ieee.
- Diaz-Chito et al. [2016] Diaz-Chito, K., Hernández-Sabaté, A., & López, A. M. (2016). A reduced feature set for driver head pose estimation. Applied Soft Computing, 45, 98–107.
- Dogan et al. [2011] Dogan, Ü., Edelbrunner, J., & Iossifidis, I. (2011). Autonomous driving: A comparison of machine learning techniques by means of the prediction of lane change behavior. In 2011 IEEE International Conference on Robotics and Biomimetics (pp. 1837–1843). IEEE.
- Doshi & Trivedi [2009] Doshi, A., & Trivedi, M. M. (2009). On the roles of eye gaze and head dynamics in predicting driver’s intent to change lanes. IEEE Transactions on Intelligent Transportation Systems, 10, 453–462.
- Drewes [2010] Drewes, H. (2010). Eye gaze tracking for human computer interaction. Ph.D. thesis lmu.
- Dua et al. [2020] Dua, I., John, T. A., Gupta, R., & Jawahar, C. (2020). Dgaze: Driver gaze mapping on road. In 2020 IEEE/RSJ International Conference on Intelligent Robots and Systems (IROS) (pp. 5946–5953). IEEE.
- Dukic et al. [2013] Dukic, T., Ahlstrom, C., Patten, C., Kettwich, C., & Kircher, K. (2013). Effects of electronic billboards on driver distraction. Traffic injury prevention, 14, 469–476.
- Dukic & Broberg [2012] Dukic, T., & Broberg, T. (2012). Older drivers’ visual search behaviour at intersections. Transportation research part F: traffic psychology and behaviour, 15, 462–470.
- Fletcher et al. [2005] Fletcher, L., Loy, G., Barnes, N., & Zelinsky, A. (2005). Correlating driver gaze with the road scene for driver assistance systems. Robotics and Autonomous Systems, 52, 71–84.
- Fletcher & Zelinsky [2009] Fletcher, L., & Zelinsky, A. (2009). Driver inattention detection based on eye gaze—road event correlation. The international journal of robotics research, 28, 774–801.
- Fridman et al. [2016a] Fridman, L., Langhans, P., Lee, J., & Reimer, B. (2016a). Driver gaze region estimation without use of eye movement. IEEE Intelligent Systems, 31, 49–56.
- Fridman et al. [2016b] Fridman, L., Lee, J., Reimer, B., & Victor, T. (2016b). ‘owl’and ‘lizard’: Patterns of head pose and eye pose in driver gaze classification. IET Computer Vision, 10, 308–314.
- Fridman et al. [2017] Fridman, L., Toyoda, H., Seaman, S., Seppelt, B., Angell, L., Lee, J., Mehler, B., & Reimer, B. (2017). What can be predicted from six seconds of driver glances? In Proceedings of the 2017 CHI Conference on Human Factors in Computing Systems (pp. 2805–2813).
- Fuhl et al. [2016] Fuhl, W., Tonsen, M., Bulling, A., & Kasneci, E. (2016). Pupil detection for head-mounted eye tracking in the wild: an evaluation of the state of the art. Machine Vision and Applications, 27, 1275–1288.
- Fusek [2018] Fusek, R. (2018). Pupil localization using geodesic distance. Lecture Notes in Computer Science (including subseries Lecture Notes in Artificial Intelligence and Lecture Notes in Bioinformatics), 11241 LNCS, 433–444.
- Ghosh et al. [2021] Ghosh, S., Dhall, A., Sharma, G., Gupta, S., & Sebe, N. (2021). Speak2label: Using domain knowledge for creating a large scale driver gaze zone estimation dataset. In Proceedings of the IEEE/CVF International Conference on Computer Vision (pp. 2896–2905).
- Glorot et al. [2011] Glorot, X., Bordes, A., & Bengio, Y. (2011). Deep sparse rectifier neural networks. In Proceedings of the fourteenth international conference on artificial intelligence and statistics (pp. 315–323). JMLR Workshop and Conference Proceedings.
- Guo et al. [2019] Guo, T., Liu, Y., Zhang, H., Liu, X., Kwak, Y., In Yoo, B., Han, J.-J., & Choi, C. (2019). A generalized and robust method towards practical gaze estimation on smart phone. In Proceedings of the IEEE/CVF International Conference on Computer Vision Workshops (pp. 0–0).
- Guo et al. [2021] Guo, Y., Zhang, H., Wang, C., Sun, Q., & Li, W. (2021). Driver lane change intention recognition in the connected environment. Physica A: Statistical Mechanics and its Applications, 575, 126057.
- Harding et al. [2014] Harding, J., Powell, G., Yoon, R., Fikentscher, J., Doyle, C., Sade, D., Lukuc, M., Simons, J., Wang, J. et al. (2014). Vehicle-to-vehicle communications: readiness of V2V technology for application.. Technical Report United States. National Highway Traffic Safety Administration.
- Harezlak & Kasprowski [2018] Harezlak, K., & Kasprowski, P. (2018). Application of eye tracking in medicine: A survey, research issues and challenges. Computerized Medical Imaging and Graphics, 65, 176–190.
- He et al. [2016] He, K., Zhang, X., Ren, S., & Sun, J. (2016). Deep residual learning for image recognition. In Proceedings of the IEEE conference on computer vision and pattern recognition (pp. 770–778).
- Heger [1998] Heger, R. (1998). Driving behavior and driver mental workload as criteria of highway geometric design quality. Transportation research circular, (pp. 43–1).
- Herrstedt et al. [2017] Herrstedt, L., Greibe, P., Andersson, P., & la Cour Lund, B. (2017). Do led-advertising signs affect driver attention. In 5th International Driver Distraction and Innatention (DDI) Conference, Paris, France.
- Holmqvist et al. [2022] Holmqvist, K., Örbom, S. L., Hooge, I. T., Niehorster, D. C., Alexander, R. G., Andersson, R., Benjamins, J. S., Blignaut, P., Brouwer, A.-M., Chuang, L. L. et al. (2022). Eye tracking: empirical foundations for a minimal reporting guideline. Behavior research methods, (pp. 1–53).
- Hosp et al. [2020] Hosp, B., Eivazi, S., Maurer, M., Fuhl, W., Geisler, D., & Kasneci, E. (2020). Remoteeye: An open-source high-speed remote eye tracker. Behavior research methods, 52, 1387–1401.
- Hubel & Wiesel [1962] Hubel, D. H., & Wiesel, T. N. (1962). Receptive fields, binocular interaction and functional architecture in the cat’s visual cortex. The Journal of physiology, 160, 106.
- Iandola et al. [2016] Iandola, F. N., Han, S., Moskewicz, M. W., Ashraf, K., Dally, W. J., & Keutzer, K. (2016). Squeezenet: Alexnet-level accuracy with 50x fewer parameters and¡ 0.5 mb model size. arXiv preprint arXiv:1602.07360, .
- Imaoka et al. [2020] Imaoka, Y., Flury, A., & De Bruin, E. D. (2020). Assessing saccadic eye movements with head-mounted display virtual reality technology. Frontiers in Psychiatry, 11, 572938.
- Itoh et al. [2007] Itoh, M., Yoshimura, K., & Inagaki, T. (2007). Inference of large truck driver’s intent to change lanes to pass a lead vehicle via analyses of driver’s eye glance behavior in the real world. In SICE Annual Conference 2007 (pp. 2385–2389). IEEE.
- Jain et al. [2016] Jain, A., Koppula, H. S., Soh, S., Raghavan, B., Singh, A., & Saxena, A. (2016). Brain4cars: Car that knows before you do via sensory-fusion deep learning architecture. arXiv preprint arXiv:1601.00740, .
- Jha & Busso [2018] Jha, S., & Busso, C. (2018). Probabilistic estimation of the gaze region of the driver using dense classification. In 2018 21st International Conference on Intelligent Transportation Systems (ITSC) (pp. 697–702). IEEE.
- Kar & Corcoran [2017] Kar, A., & Corcoran, P. (2017). A review and analysis of eye-gaze estimation systems, algorithms and performance evaluation methods in consumer platforms. IEEE Access, 5, 16495–16519.
- Kar & Corcoran [2018] Kar, A., & Corcoran, P. (2018). Performance evaluation strategies for eye gaze estimation systems with quantitative metrics and visualizations. Sensors, 18, 3151.
- Karsh & Breitenbach [2021] Karsh, R., & Breitenbach, F. W. (2021). Looking at looking: The amorphous fixation measure. In Eye movements and psychological functions (pp. 53–64). Routledge.
- Kazemi & Sullivan [2014] Kazemi, V., & Sullivan, J. (2014). One millisecond face alignment with an ensemble of regression trees. In Proceedings of the IEEE conference on computer vision and pattern recognition (pp. 1867–1874).
- Ketkar & Santana [2017] Ketkar, N., & Santana, E. (2017). Deep learning with Python volume 1. Springer.
- Khan & Lee [2019] Khan, M. Q., & Lee, S. (2019). Gaze and eye tracking: Techniques and applications in adas. Sensors, 19, 5540.
- Klaib et al. [2021] Klaib, A. F., Alsrehin, N. O., Melhem, W. Y., Bashtawi, H. O., & Magableh, A. A. (2021). Eye tracking algorithms, techniques, tools, and applications with an emphasis on machine learning and internet of things technologies. Expert Systems with Applications, 166, 114037.
- König & Buffalo [2014] König, S. D., & Buffalo, E. A. (2014). A nonparametric method for detecting fixations and saccades using cluster analysis: Removing the need for arbitrary thresholds. Journal of neuroscience methods, 227, 121–131.
- Kotseruba & Tsotsos [2022] Kotseruba, I., & Tsotsos, J. K. (2022). Attention for vision-based assistive and automated driving: A review of algorithms and datasets. IEEE Transactions on Intelligent Transportation Systems, .
- Kramer [2020] Kramer, A. F. (2020). Physiological metrics of mental workload: A review of recent progress. Multiple-task performance, (pp. 279–328).
- Krejtz et al. [2015] Krejtz, K., Duchowski, A., Szmidt, T., Krejtz, I., González Perilli, F., Pires, A., Vilaro, A., & Villalobos, N. (2015). Gaze transition entropy. ACM Transactions on Applied Perception (TAP), 13, 1–20.
- Krizhevsky et al. [2012] Krizhevsky, A., Sutskever, I., & Hinton, G. E. (2012). Imagenet classification with deep convolutional neural networks. In F. Pereira, C. Burges, L. Bottou, & K. Weinberger (Eds.), Advances in Neural Information Processing Systems. Curran Associates, Inc. volume 25.
- Kuge et al. [2000] Kuge, N., Yamamura, T., Shimoyama, O., & Liu, A. (2000). A driver behavior recognition method based on a driver model framework. SAE transactions, (pp. 469–476).
- Lamble et al. [1999] Lamble, D., Laakso, M., & Summala, H. (1999). Detection thresholds in car following situations and peripheral vision: Implications for positioning of visually demanding in-car displays. Ergonomics, 42, 807–815.
- Lavalliere et al. [2011] Lavalliere, M., Laurendeau, D., Simoneau, M., & Teasdale, N. (2011). Changing lanes in a simulator: effects of aging on the control of the vehicle and visual inspection of mirrors and blind spot. Traffic injury prevention, 12, 191–200.
- LeCun et al. [1989] LeCun, Y., Boser, B., Denker, J. S., Henderson, D., Howard, R. E., Hubbard, W., & Jackel, L. D. (1989). Backpropagation applied to handwritten zip code recognition. Neural computation, 1, 541–551.
- LeCun et al. [1998] LeCun, Y., Bottou, L., Bengio, Y., & Haffner, P. (1998). Gradient-based learning applied to document recognition. Proceedings of the IEEE, 86, 2278–2324.
- Lee et al. [2004] Lee, S. E., Olsen, E. C., Wierwille, W. W. et al. (2004). A comprehensive examination of naturalistic lane-changes. Technical Report United States. National Highway Traffic Safety Administration.
- Lee et al. [2011] Lee, S. J., Jo, J., Jung, H. G., Park, K. R., & Kim, J. (2011). Real-time gaze estimator based on driver’s head orientation for forward collision warning system. IEEE Transactions on Intelligent Transportation Systems, 12, 254–267.
- Lehtonen et al. [2014] Lehtonen, E., Lappi, O., Koirikivi, I., & Summala, H. (2014). Effect of driving experience on anticipatory look-ahead fixations in real curve driving. Accident Analysis & Prevention, 70, 195–208.
- Lemonnier et al. [2015] Lemonnier, S., Brémond, R., & Baccino, T. (2015). Gaze behavior when approaching an intersection: Dwell time distribution and comparison with a quantitative prediction. Transportation research part F: traffic psychology and behaviour, 35, 60–74.
- Lemonnier et al. [2020] Lemonnier, S., Désiré, L., Brémond, R., & Baccino, T. (2020). Drivers’ visual attention: A field study at intersections. Transportation research part F: traffic psychology and behaviour, 69, 206–221.
- Li et al. [2019] Li, G., Wang, Y., Zhu, F., Sui, X., Wang, N., Qu, X., & Green, P. (2019). Drivers’ visual scanning behavior at signalized and unsignalized intersections: A naturalistic driving study in china. Journal of safety research, 71, 219–229.
- Liang et al. [2012] Liang, Y., Lee, J. D., & Yekhshatyan, L. (2012). How dangerous is looking away from the road? algorithms predict crash risk from glance patterns in naturalistic driving. Human Factors, 54, 1104–1116.
- Liu et al. [2018] Liu, W., Muramatsu, S., & Okubo, Y. (2018). Cooperation of v2i/p2i communication and roadside radar perception for the safety of vulnerable road users. In 2018 16th International Conference on Intelligent Transportation Systems Telecommunications (ITST) (pp. 1–7). IEEE.
- Liu et al. [2002] Liu, X., Xu, F., & Fujimura, K. (2002). Real-time eye detection and tracking for driver observation under various light conditions. In Intelligent Vehicle Symposium, 2002. IEEE (pp. 344–351). IEEE volume 2.
- Long et al. [2022] Long, Y., Huang, J., Zhao, X., & Li, Z. (2022). Does lstm outperform 4ddtw-knn in lane change identification based on eye gaze data? Transportation research part C: emerging technologies, 137, 103583.
- Lu et al. [2022] Lu, K., Dahlman, A. S., Karlsson, J., & Candefjord, S. (2022). Detecting driver fatigue using heart rate variability: A systematic review. Accident Analysis & Prevention, 178, 106830.
- Mahajan et al. [2020] Mahajan, V., Katrakazas, C., & Antoniou, C. (2020). Prediction of lane-changing maneuvers with automatic labeling and deep learning. Transportation research record, 2674, 336–347.
- Majaranta & Bulling [2014] Majaranta, P., & Bulling, A. (2014). Eye tracking and eye-based human–computer interaction. In Advances in physiological computing (pp. 39–65). Springer.
- Marquart et al. [2015] Marquart, G., Cabrall, C., & de Winter, J. (2015). Review of eye-related measures of drivers’ mental workload. Procedia Manufacturing, 3, 2854–2861.
- Martens & Fox [2007] Martens, M. H., & Fox, M. (2007). Does road familiarity change eye fixations? a comparison between watching a video and real driving. Transportation Research Part F: Traffic Psychology and Behaviour, 10, 33–47.
- Martin et al. [2018] Martin, S., Vora, S., Yuen, K., & Trivedi, M. M. (2018). Dynamics of driver’s gaze: Explorations in behavior modeling and maneuver prediction. IEEE Transactions on Intelligent Vehicles, 3, 141–150.
- McCall et al. [2007] McCall, J. C., Wipf, D. P., Trivedi, M. M., & Rao, B. D. (2007). Lane change intent analysis using robust operators and sparse bayesian learning. IEEE Transactions on Intelligent Transportation Systems, 8, 431–440.
- Mecheri et al. [2022] Mecheri, S., Mars, F., & Lobjois, R. (2022). Gaze and steering strategies while driving around bends with shoulders. Applied ergonomics, 103, 103798.
- Milanés et al. [2012] Milanés, V., Villagrá, J., Godoy, J., Simó, J., Pérez, J., & Onieva, E. (2012). An intelligent v2i-based traffic management system. IEEE Transactions on Intelligent Transportation Systems, 13, 49–58.
- Mollu et al. [2018] Mollu, K., Cornu, J., Brijs, K., Pirdavani, A., & Brijs, T. (2018). Driving simulator study on the influence of digital illuminated billboards near pedestrian crossings. Transportation research part F: traffic psychology and behaviour, 59, 45–56.
- Mourant & Donohue [1974] Mourant, R. R., & Donohue, R. (1974). Mirror sampling characteristics of drivers. Technical Report SAE Technical Paper.
- Mowrer et al. [1935] Mowrer, O. H., Ruch, T. C., & Miller, N. E. (1935). The corneo-retinal potential difference as the basis of the galvanometric method of recording eye movements. American Journal of Physiology-Legacy Content, 114, 423–428.
- Muñoz et al. [2016] Muñoz, M., Reimer, B., Lee, J., Mehler, B., & Fridman, L. (2016). Distinguishing patterns in drivers’ visual attention allocation using hidden markov models. Transportation research part F: traffic psychology and behaviour, 43, 90–103.
- Naqvi et al. [2018] Naqvi, R. A., Arsalan, M., Batchuluun, G., Yoon, H. S., & Park, K. R. (2018). Deep learning-based gaze detection system for automobile drivers using a nir camera sensor. Sensors, 18, 456.
- Nasrabadi & Alonso [2022] Nasrabadi, H. R., & Alonso, J.-M. (2022). Modular streaming pipeline of eye/head tracking data using tobii pro glasses 3. bioRxiv, .
- Nuevo et al. [2010] Nuevo, J., Bergasa, L. M., & Jiménez, P. (2010). Rsmat: Robust simultaneous modeling and tracking. Pattern Recognition Letters, 31, 2455–2463.
- Oliver & Pentland [2000] Oliver, N., & Pentland, A. P. (2000). Graphical models for driver behavior recognition in a smartcar. In Proceedings of the IEEE Intelligent Vehicles Symposium 2000 (Cat. No. 00TH8511) (pp. 7–12). IEEE.
- Organization et al. [2018] Organization, W. H. et al. (2018). Global status report on road safety 2018: Summary (no. who/nmh/nvi/18.20). World Health Organization, .
- Ortega et al. [2020] Ortega, J. D., Kose, N., Cañas, P., Chao, M.-A., Unnervik, A., Nieto, M., Otaegui, O., & Salgado, L. (2020). Dmd: A large-scale multi-modal driver monitoring dataset for attention and alertness analysis. In European Conference on Computer Vision (pp. 387–405). Springer.
- O’Shea & Nash [2015] O’Shea, K., & Nash, R. (2015). An introduction to convolutional neural networks. arXiv preprint arXiv:1511.08458, .
- Othman et al. [2022] Othman, W., Kashevnik, A., Ali, A., & Shilov, N. (2022). Drivermvt: in-cabin dataset for driver monitoring including video and vehicle telemetry information. Data, 7, 62.
- Ou et al. [2021] Ou, W.-L., Kuo, T.-L., Chang, C.-C., & Fan, C.-P. (2021). Deep-learning-based pupil center detection and tracking technology for visible-light wearable gaze tracking devices. Applied Sciences, 11, 851.
- Oviedo-Trespalacios et al. [2019] Oviedo-Trespalacios, O., Truelove, V., Watson, B., & Hinton, J. A. (2019). The impact of road advertising signs on driver behaviour and implications for road safety: A critical systematic review. Transportation research part A: policy and practice, 122, 85–98.
- Owsley et al. [1991] Owsley, C., Ball, K., Sloane, M. E., Roenker, D. L., & Bruni, J. R. (1991). Visual/cognitive correlates of vehicle accidents in older drivers. Psychology and aging, 6, 403.
- Palazzi et al. [2018] Palazzi, A., Abati, D., Solera, F., Cucchiara, R. et al. (2018). Predicting the driver’s focus of attention: the dr (eye) ve project. IEEE transactions on pattern analysis and machine intelligence, 41, 1720–1733.
- Pang et al. [2011] Pang, Y., Yuan, Y., Li, X., & Pan, J. (2011). Efficient hog human detection. Signal processing, 91, 773–781.
- Pathirana et al. [2022] Pathirana, P., Senarath, S., Meedeniya, D., & Jayarathna, S. (2022). Eye gaze estimation: A survey on deep learning-based approaches. Expert Systems with Applications, 199, 116894.
- Pech et al. [2014] Pech, T., Lindner, P., & Wanielik, G. (2014). Head tracking based glance area estimation for driver behaviour modelling during lane change execution. In 17th International IEEE Conference on Intelligent Transportation Systems (ITSC) (pp. 655–660). IEEE.
- Peng et al. [2020] Peng, X., Murphey, Y. L., Liu, R., & Li, Y. (2020). Driving maneuver early detection via sequence learning from vehicle signals and video images. Pattern Recognition, 103, 107276.
- Rangesh et al. [2020] Rangesh, A., Zhang, B., & Trivedi, M. M. (2020). Driver gaze estimation in the real world: Overcoming the eyeglass challenge. In 2020 IEEE Intelligent Vehicles Symposium (IV) (pp. 1054–1059). IEEE.
- Recarte et al. [2008] Recarte, M. Á., Pérez, E., Conchillo, Á., & Nunes, L. M. (2008). Mental workload and visual impairment: Differences between pupil, blink, and subjective rating. The Spanish journal of psychology, 11, 374–385.
- Ribeiro & Costa [2019] Ribeiro, R. F., & Costa, P. D. (2019). Driver gaze zone dataset with depth data. In 2019 14th IEEE International Conference on Automatic Face & Gesture Recognition (FG 2019) (pp. 1–5). IEEE.
- Roberts et al. [2013] Roberts, P., Boddington, K., & Rodwell, L. (2013). Impact of roadside advertising on road safety. AP-R420/13.
- Romoser et al. [2013] Romoser, M. R., Pollatsek, A., Fisher, D. L., & Williams, C. C. (2013). Comparing the glance patterns of older versus younger experienced drivers: Scanning for hazards while approaching and entering the intersection. Transportation research part F: traffic psychology and behaviour, 16, 104–116.
- Rosch & Vogel-Walcutt [2013] Rosch, J. L., & Vogel-Walcutt, J. J. (2013). A review of eye-tracking applications as tools for training. Cognition, technology & work, 15, 313–327.
- Salvucci & Liu [2002] Salvucci, D. D., & Liu, A. (2002). The time course of a lane change: Driver control and eye-movement behavior. Transportation research part F: traffic psychology and behaviour, 5, 123–132.
- Santini et al. [2018] Santini, T., Fuhl, W., & Kasneci, E. (2018). Pure: Robust pupil detection for real-time pervasive eye tracking. Computer Vision and Image Understanding, 170, 40–50.
- Savage et al. [2020] Savage, S. W., Zhang, L., Swan, G., & Bowers, A. R. (2020). The effects of age on the contributions of head and eye movements to scanning behavior at intersections. Transportation research part F: traffic psychology and behaviour, 73, 128–142.
- Schindler & Piccinini [2021] Schindler, R., & Piccinini, G. B. (2021). Truck drivers’ behavior in encounters with vulnerable road users at intersections: Results from a test-track experiment. Accident Analysis & Prevention, 159, 106289.
- Schmidhuber [2015] Schmidhuber, J. (2015). Deep learning in neural networks: An overview. Neural networks, 61, 85–117.
- Schwarz et al. [2017] Schwarz, A., Haurilet, M., Martinez, M., & Stiefelhagen, R. (2017). Driveahead-a large-scale driver head pose dataset. In Proceedings of the IEEE Conference on Computer Vision and Pattern Recognition Workshops (pp. 1–10).
- Scott et al. [2013] Scott, H., Hall, L., Litchfield, D., & Westwood, D. (2013). Visual information search in simulated junction negotiation: Gaze transitions of young novice, young experienced and older experienced drivers. Journal of safety research, 45, 111–116.
- Sewalkar & Seitz [2019] Sewalkar, P., & Seitz, J. (2019). Vehicle-to-pedestrian communication for vulnerable road users: Survey, design considerations, and challenges. Sensors, 19, 358.
- Shannon [1948] Shannon, C. E. (1948). A mathematical theory of communication. The Bell system technical journal, 27, 379–423.
- Shehu et al. [2021] Shehu, I. S., Wang, Y., Athuman, A. M., & Fu, X. (2021). Remote eye gaze tracking research: A comparative evaluation on past and recent progress. Electronics, 10, 3165.
- Shimata et al. [2015] Shimata, R., Mitani, Y., & Ochiai, T. (2015). A study of pupil detection and tracking by image processing techniques for a human eye-computer interaction system. In 2015 IEEE/ACIS 16th International Conference on Software Engineering, Artificial Intelligence, Networking and Parallel/Distributed Computing (SNPD) (pp. 1–4). IEEE.
- Shirazi & Morris [2016] Shirazi, M. S., & Morris, B. T. (2016). Looking at intersections: a survey of intersection monitoring, behavior and safety analysis of recent studies. IEEE Transactions on Intelligent Transportation Systems, 18, 4–24.
- Simonyan & Zisserman [2014] Simonyan, K., & Zisserman, A. (2014). Very deep convolutional networks for large-scale image recognition. arXiv preprint arXiv:1409.1556, .
- Sisiopiku et al. [2015] Sisiopiku, V. P., Stavrinos, D., Sullivan, A., Islam, M. M., Wittig, S., Haleem, K., Gan, A., Alluri, P. et al. (2015). Digital advertising billboards and driver distraction, .
- Stutts et al. [2009] Stutts, J., Martell, C., Staplin, L., TransAnalytics, L. et al. (2009). Identifying behaviors and situations associated with increased crash risk for older drivers, .
- Sun et al. [2017] Sun, Y., Li, Q., Zhang, H., & Zou, J. (2017). The application of eye tracking in education. In International Conference on Intelligent Information Hiding and Multimedia Signal Processing (pp. 27–33). Springer.
- Ta et al. [2009] Ta, D.-N., Chen, W.-C., Gelfand, N., & Pulli, K. (2009). Surftrac: Efficient tracking and continuous object recognition using local feature descriptors. In 2009 IEEE conference on computer vision and pattern recognition (pp. 2937–2944). IEEE.
- Tawari et al. [2014] Tawari, A., Møgelmose, A., Martin, S., Moeslund, T. B., & Trivedi, M. M. (2014). Attention estimation by simultaneous analysis of viewer and view. In 17th International IEEE Conference on Intelligent Transportation Systems (ITSC) (pp. 1381–1387). IEEE.
- Tawari & Trivedi [2014] Tawari, A., & Trivedi, M. M. (2014). Robust and continuous estimation of driver gaze zone by dynamic analysis of multiple face videos. In 2014 IEEE Intelligent Vehicles Symposium Proceedings (pp. 344–349). IEEE.
- Tianyu et al. [2018] Tianyu, Z., Zhenjiang, M., & Jianhu, Z. (2018). Combining cnn with hand-crafted features for image classification. In 2018 14th ieee international conference on signal processing (icsp) (pp. 554–557). IEEE.
- Tomas et al. [2021] Tomas, H., Reyes, M., Dionido, R., Ty, M., Mirando, J., Casimiro, J., Atienza, R., & Guinto, R. (2021). Goo: A dataset for gaze object prediction in retail environments. In Proceedings of the IEEE/CVF Conference on Computer Vision and Pattern Recognition (pp. 3125–3133).
- Tonsen et al. [2020] Tonsen, M., Baumann, C. K., & Dierkes, K. (2020). A high-level description and performance evaluation of pupil invisible. arXiv preprint arXiv:2009.00508, .
- Tsimhoni & Green [2001] Tsimhoni, O., & Green, P. (2001). Visual demand of driving and the execution of display-intensive in-vehicle tasks. In Proceedings of the Human Factors and Ergonomics Society Annual Meeting (pp. 1586–1590). SAGE Publications Sage CA: Los Angeles, CA volume 45.
- Tuncer et al. [2021] Tuncer, T., Dogan, S., & Subasi, A. (2021). Eeg-based driving fatigue detection using multilevel feature extraction and iterative hybrid feature selection. Biomedical Signal Processing and Control, 68, 102591.
- Valgren & Lilienthal [2007] Valgren, C., & Lilienthal, A. J. (2007). Sift, surf and seasons: Long-term outdoor localization using local features. In 3rd European conference on mobile robots, ECMR’07, Freiburg, Germany, September 19-21, 2007 (pp. 253–258).
- Vasli et al. [2016] Vasli, B., Martin, S., & Trivedi, M. M. (2016). On driver gaze estimation: Explorations and fusion of geometric and data driven approaches. In 2016 IEEE 19th International Conference on Intelligent Transportation Systems (ITSC) (pp. 655–660). IEEE.
- Vicente et al. [2015] Vicente, F., Huang, Z., Xiong, X., De la Torre, F., Zhang, W., & Levi, D. (2015). Driver gaze tracking and eyes off the road detection system. IEEE Transactions on Intelligent Transportation Systems, 16, 2014–2027.
- Vickers [2017] Vickers, N. J. (2017). Animal communication: when i’m calling you, will you answer too? Current biology, 27, R713–R715.
- Vora et al. [2018] Vora, S., Rangesh, A., & Trivedi, M. M. (2018). Driver gaze zone estimation using convolutional neural networks: A general framework and ablative analysis. IEEE Transactions on Intelligent Vehicles, 3, 254–265.
- Wallace [2003] Wallace, B. (2003). Driver distraction by advertising: genuine risk or urban myth? In Proceedings of the Institution of Civil Engineers-Municipal Engineer (pp. 185–190). Thomas Telford Ltd volume 156.
- Wang & Ji [2005] Wang, P., & Ji, Q. (2005). Learning discriminant features for multi-view face and eye detection. In 2005 IEEE Computer Society Conference on Computer Vision and Pattern Recognition (CVPR’05) (pp. 373–379). IEEE volume 1.
- Wang et al. [2014] Wang, Y., Reimer, B., Dobres, J., & Mehler, B. (2014). The sensitivity of different methodologies for characterizing drivers’ gaze concentration under increased cognitive demand. Transportation research part F: traffic psychology and behaviour, 26, 227–237.
- Wang et al. [2022] Wang, Y., Yuan, G., & Fu, X. (2022). Driver’s head pose and gaze zone estimation based on multi-zone templates registration and multi-frame point cloud fusion. Sensors, 22, 3154.
- Wang et al. [2019] Wang, Y., Yuan, G., Mi, Z., Peng, J., Ding, X., Liang, Z., & Fu, X. (2019). Continuous driver’s gaze zone estimation using rgb-d camera. Sensors, 19, 1287.
- Wei et al. [2013] Wei, Y., Rui, F., Ying-shi, G., Jin-shuan, P., & Yong, M. (2013). Drivers’ lane changing intention identification based on visual characteristics. China Journal of Highway and Transport, 26, 132.
- Wong & Huang [2013] Wong, J.-T., & Huang, S.-H. (2013). Attention allocation patterns in naturalistic driving. Accident Analysis & Prevention, 58, 140–147.
- Wood et al. [2017] Wood, J. M., Tyrrell, R. A., Lacherez, P., & Black, A. A. (2017). Night-time pedestrian conspicuity: effects of clothing on drivers’ eye movements. Ophthalmic and physiological optics, 37, 184–190.
- Ye et al. [2019] Ye, H., Li, G. Y., & Juang, B.-H. F. (2019). Deep reinforcement learning based resource allocation for v2v communications. IEEE Transactions on Vehicular Technology, 68, 3163–3173.
- Yoon et al. [2019] Yoon, H. S., Baek, N. R., Truong, N. Q., & Park, K. R. (2019). Driver gaze detection based on deep residual networks using the combined single image of dual near-infrared cameras. IEEE Access, 7, 93448–93461.
- Yuan et al. [2022] Yuan, G., Wang, Y., Yan, H., & Fu, X. (2022). Self-calibrated driver gaze estimation via gaze pattern learning. Knowledge-Based Systems, 235, 107630.
- Zahabi et al. [2017] Zahabi, M., Machado, P., Lau, M. Y., Deng, Y., Pankok Jr, C., Hummer, J., Rasdorf, W., & Kaber, D. B. (2017). Driver performance and attention allocation in use of logo signs on freeway exit ramps. Applied ergonomics, 65, 70–80.
- Zwahlen et al. [2003] Zwahlen, H. T., Russ, A., & Schnell, T. (2003). Viewing ground-mounted diagrammatic guide signs before entrance ramps at night: Driver eye scanning behavior. Transportation research record, 1843, 61–69.
- Zyner et al. [2017] Zyner, A., Worrall, S., Ward, J., & Nebot, E. (2017). Long short term memory for driver intent prediction. In 2017 IEEE Intelligent Vehicles Symposium (IV) (pp. 1484–1489). IEEE.