Social Impressions of the NAO Robot and its Impact on Physiology
Abstract
The social applications of robots possess intrinsic challenges with respect to social paradigms and heterogeneity of different groups. These challenges can be in the form of social acceptability, anthropomorphism, likeability, past experiences with robots etc. In this paper, we have considered a group of neurotypical adults to describe how different voices and motion types of the NAO robot can have effect on the perceived safety, anthropomorphism, likeability, animacy, and perceived intelligence of the robot. In addition, prior robot experience has also been taken into consideration to perform this analysis using a one-way Analysis of Variance (ANOVA). Further, we also demonstrate that these different modalities instigate different physiological responses in the person. This classification has been done using two different deep learning approaches, 1) Convolutional Neural Network (CNN), and 2) Gramian Angular Fields on the Blood Volume Pulse (BVP) data recorded. Both of these approaches achieve better than chance accuracy (25%) for a 4 class classification.
Index Terms:
social impressions, NAO robot, classification, CNN, Gramian Angular Field, physiological signal processingI Introduction
Autism Spectrum Disorder (ASD), as an umbrella term, has been associated with challenges in social communication and interaction along with restrictive and repetitive behaviors according to the Diagnostic Statistical Manual [3]. The world ASD population is around 1.5 percent [35], with 1 out of 54 children being diagnosed in the United States alone [2, 4]. More recently, this number has increased by 104% [29]. Since, there is no cure for autism [7, 29], there exist numerous treatments/interventions, as presented by the authors in [28, 12], not all of which are scientifically proven to have positive results [31, 20, 18].
To mitigate the scientific shortcomings of some of these studies, Evidence Based Practices (EBP) have presented numerous interventions that have been chosen as a result of positive scientific evidence [33]. Among them, Technology-Aided Instruction and Intervention (TAII) has been on the rise since a few decades now as is evident from the works of [30, 9, 10, 40], some of which have also been used to form the guidelines for EBP like [13, 32].
Apart from following the EBP, it is also essential to take into account the acceptability of the robot in a therapeutic scenario that involves a human-robot interaction (HRI). Due to the heterogeneity of the ASD population, these responses can vary based on the individual [37]. In addition to considering the social acceptability of the robot, factors such as repeated exposure to a robot [27], features of robots to be considered in therapy [19], anthropomorphic appearance and intonation [38] etc. have also been studied. The reason for these studies can be attributed to the fact that these interventions are directed towards bringing about positive effects in the individual with ASD.
Another aspect that can be associated with social acceptability of the robot during therapy is the uncanny valley, as has been studied by the authors in [36]. Since the human-like traits of a robot can stir discomfort in people surrounding it; this phenomena, introduced in [24], has been explored using different modalities of HRI [22]. Since the effect of the uncanny valley has been shown to be more profound on the ASD population than on neurotypicals [11], it becomes imperative to validate individual communication modality in a robotic intervention to be analyzed on the neurotypical population first. Since the uncanny valley is associated with the features of the robots in terms of the appearance and its anthropomorphic appeal, it can have an effect on the affective states of the individual [38].
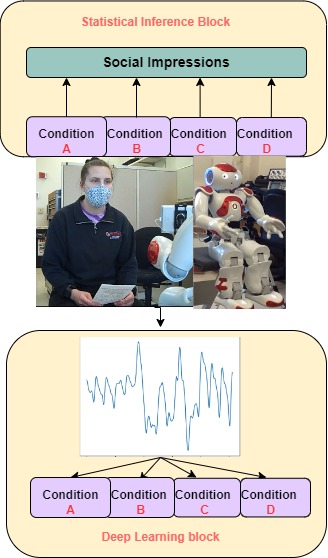
In this work, we have presented a one-to-one HRI as shown in Figure 1 with neurotypical adults. We start with the use of the humanoid NAO robot for a neurotypical population with four different conditions (A-D) (see Section II-B for more details). The participants’ prior experience with robots has also been considered in this study. We have analysed the response of the participants on five pf of the robot namely, perceived safety, anthropomorphism, likeability, animacy, and perceived intelligence. We have analysed if the different conditions (A-D) have any effect on the users’ perception of the five perceived robot features. In addition, we have compared the effects of varying amounts of prior experience with robots among the participants on pf under the four conditions (A-D). Further, the effect of these conditions on the physiological signals have been differentiated using deep learning algorithms.
II Methodology
II-A Data acquisition
We have considered 30 neurotypical adults for this study. The mean age of all the participants was 21.4 years with a standard deviation of 3.36 years. Out of the 30 adults, 43% were male participants and the rest were female participants. During the sessions, the participants’ audio, video and physiology was recorded. The physiological signals were recorded using the Empatica E4 wrist band. For the purpose of this study, just the BVP data was used for our deep learning based classification approaches. Before conducting this study, it was approved by the University’s Institute Review Board (IRB). In addition, consent was taken from all the participants before the activity. There was no compensation involved for the participants involved in this research.
II-B Impressions of the NAO robot
The participants were given a set of pre-defined questions to use to interact with the NAO robot. The modalities of the NAO robot were tested under four different scenarios:
-
•
Default NAO voice with smooth motions (Condition A),
-
•
Amazon Polly Justin voice [26] with smooth motions (Condition B),
-
•
Default NAO voice with jerky motions (Condition C),
-
•
Amazon Polly Justin voice with jerky motions (Condition D).
The participants’ reactions to their impressions of the NAO robot were then assessed through the Godspeed and Robotic Social Attributes Scale (RoSAS) [8] questionnaires across five categories: 1) perceived safety (PS), 2) anthropomorphism (AP), 3) animacy (AM), 4) likeability (LK) and, 5) perceived intelligence (PI), similar to the authors in [5]. The scores for these categories were recorded after each of the robot conditions (A-D). Since the participants had varying backgrounds in terms of prior experience with robots in their personal or professional lives, this difference in experience with robots has been accounted for while assessing perceived safety, anthropomorphism, animacy, likeability, and perceived intelligence. The experience of a participant with robots was recorded on a scale of 0-3, where 0 stands for no familiarity whereas 3 stands for intermediate level of familiarity (e.g., completed projects with robots). All of these statistical inferences were made using the one-way Analysis of Variance (ANOVA) [21, 34] as has been discussed in later sections.
II-C Effect on Physiology
Since the BVP data is recorded during HRI, we use it to examine whether these physiological responses are differentiable using our deep learning algorithm. The BVP data is collected using a windowing approach. Since we use two different approaches for classification from the literature, the problem formulation for both of them have been explained.
II-C1 Problem formulation
The first approach comprises of just CNNs for time series classification of the BVP signal. Given the univariate BVP signal data, , split the time series into windows as has been shown in equation
| (1a) | |||
| (1b) |
where is the number of training data point made from splitting the time series each into steps, denotes the stride length we used, and denotes the labels w.r.t. the conditions A-D. This basic formulation is used to find the multivariate function using our proposed Deep Learning approaches.
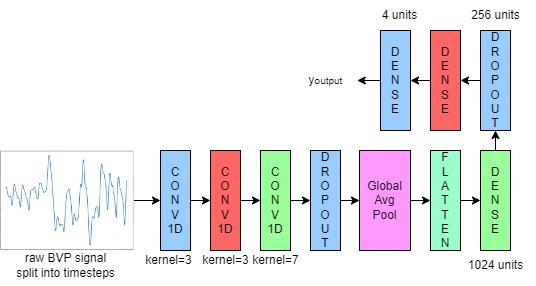
II-C2 Deep Learning for classification
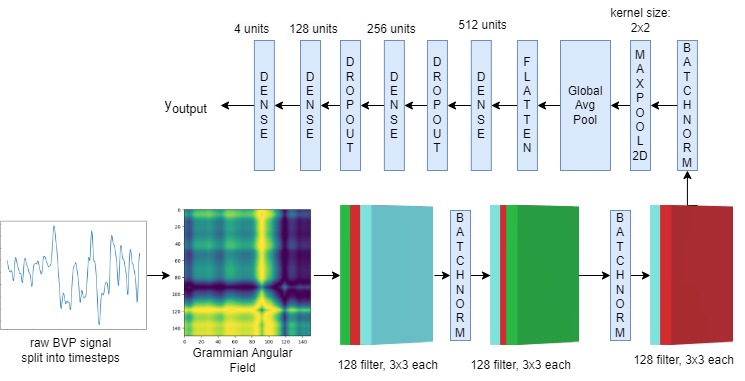
The first approach used for our classification problem is based on CNNs on the raw time series signal which has been split into smaller windows. The network architecture has been shown in Figure 2. For the second architecture, instead of using raw signals as inputs, we convert the split signals from equation 1 into images based on Gramian Angular Fields [39, 41]. In this work, we use the Gramian Angular Field Difference (GADF) as defined in[39] as:
| (2) |
where are the polar coordinates of the time-series BVP signal , and is the unit vector [39]. The definition of the polar coordinate can be expressed as in [39]:
| (3) |
In the above equation, the values of the BVP signal can be scaled between as has been mentioned in the expression of or between as has been mentioned by the expression of .
III Results and Discussions
III-A Effects of Conditions (A-D) on user experience
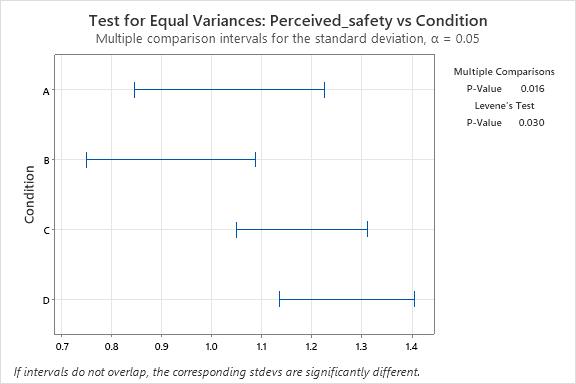
III-A1 Test for equal variances
The first step is to check the null hypothesis () in equation 4 for each of the features: PS, AP, AM, LK and, PI.
| (4a) | |||
| (4b) |
| Perceived features | values | ||||
| Condition A | Condition B | Condition C | Condition D | ||
| Perceived Safety | Test of variance | 0.912 | 0.643 | 0.733 | 0.136 |
| One-way ANOVA | 0.592 | 0.237 | 0.083 | 0.376 | |
| Anthrpomorphism | Test of variance | 0.042 | 0.468 | 0.640 | 0.055 |
| One-way ANOVA | 0.013 | 0.411 | 0.548 | 0.288 | |
| Likeability | Test of variance | 0.586 | 0.112 | 0.042 | 0.005 |
| One-way ANOVA | 0.000 | 0.206 | 0.000 | 0.025 | |
| Animacy | Test of variance | 0.073 | 0.071 | 0.901 | 0.295 |
| One-way ANOVA | 0.911 | 0.359 | 0.268 | 0.433 | |
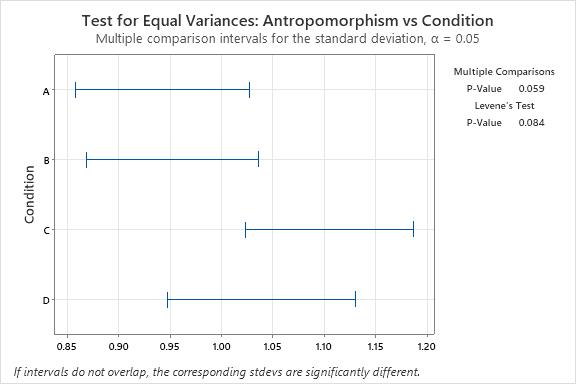
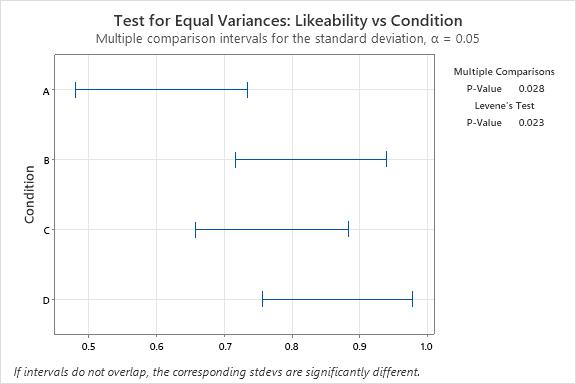
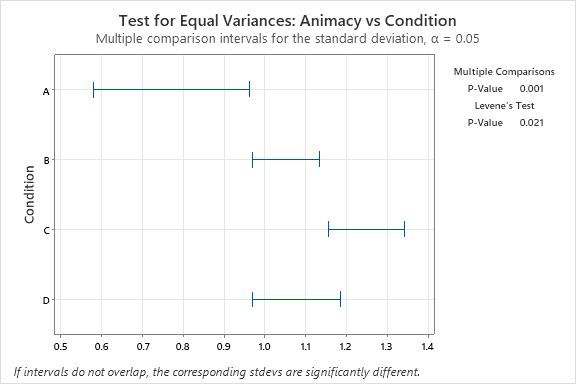
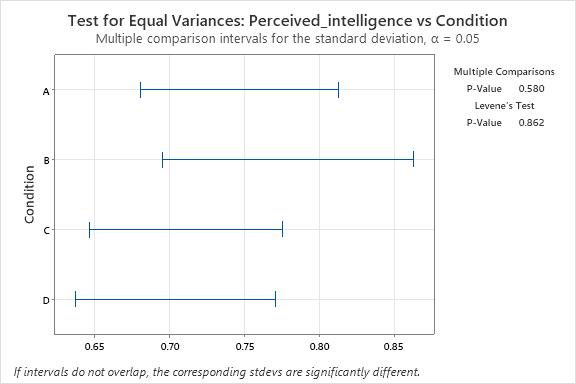
From the -values, obtained using Bonferroni 95% confidence intervals for standard deviations, we can reject the null hypothesis for PS, LK, and AM (-value) which means that the variances for these groups are different [15, 14]. On the other hand, we accept the null hypothesis for anthropomorphism and perceived intelligence (-value), which means that for each of these features, we can consider the variances of conditions A-D to be equal.
III-A2 ANOVA for each perceived feature
For this we consider the data of all the 30 participants included in this study irrespective of their previous exposure to robots. We use Welch’s one-way ANOVA [21, 34] for perceived safety, likeability, and animacy since we do not assume equal variances as was shown from the results in Figure 3. We compare the difference between conditions A-D by making a hypothesis similar to that in equation 4, but this time with the means of the values:
| (5a) | |||
| (5b) |
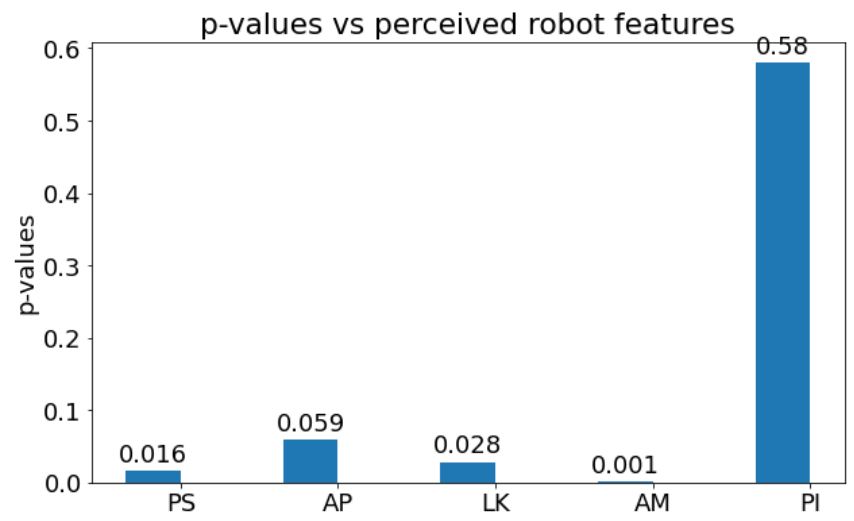
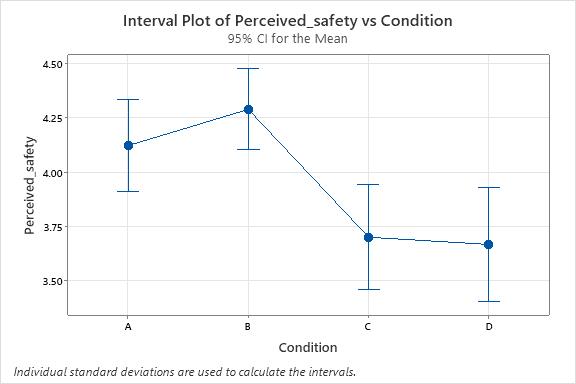
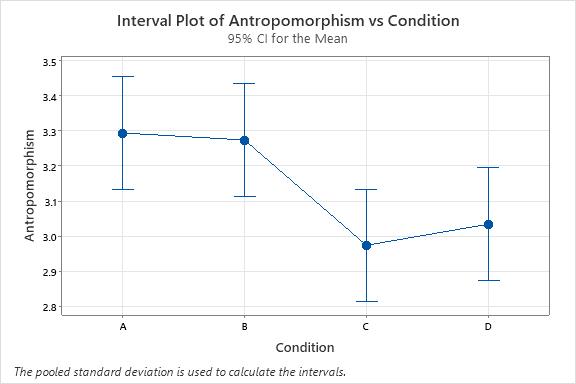
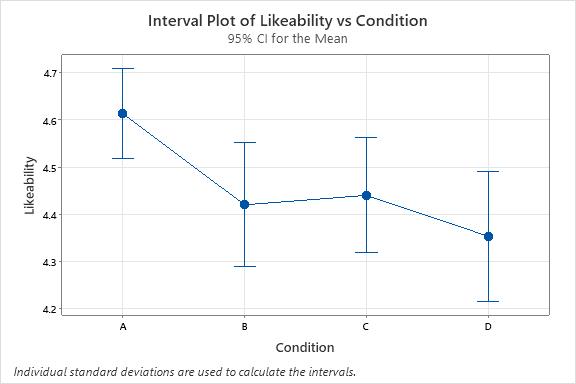
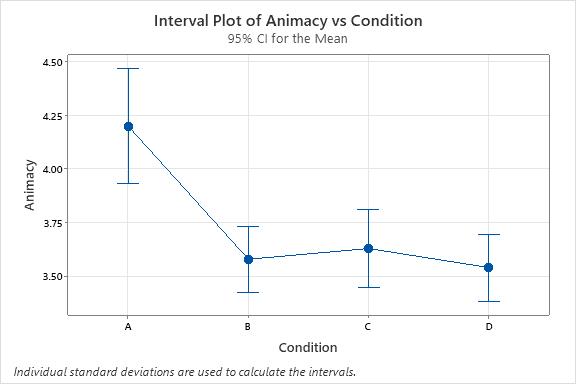
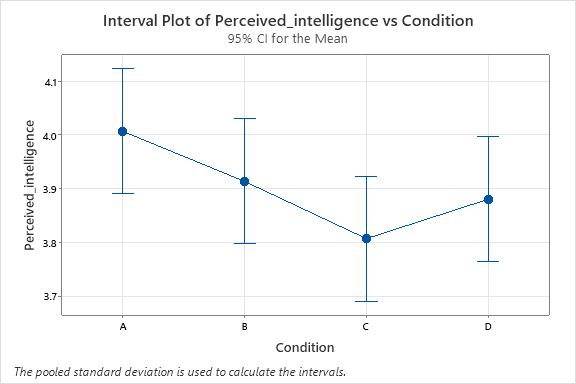
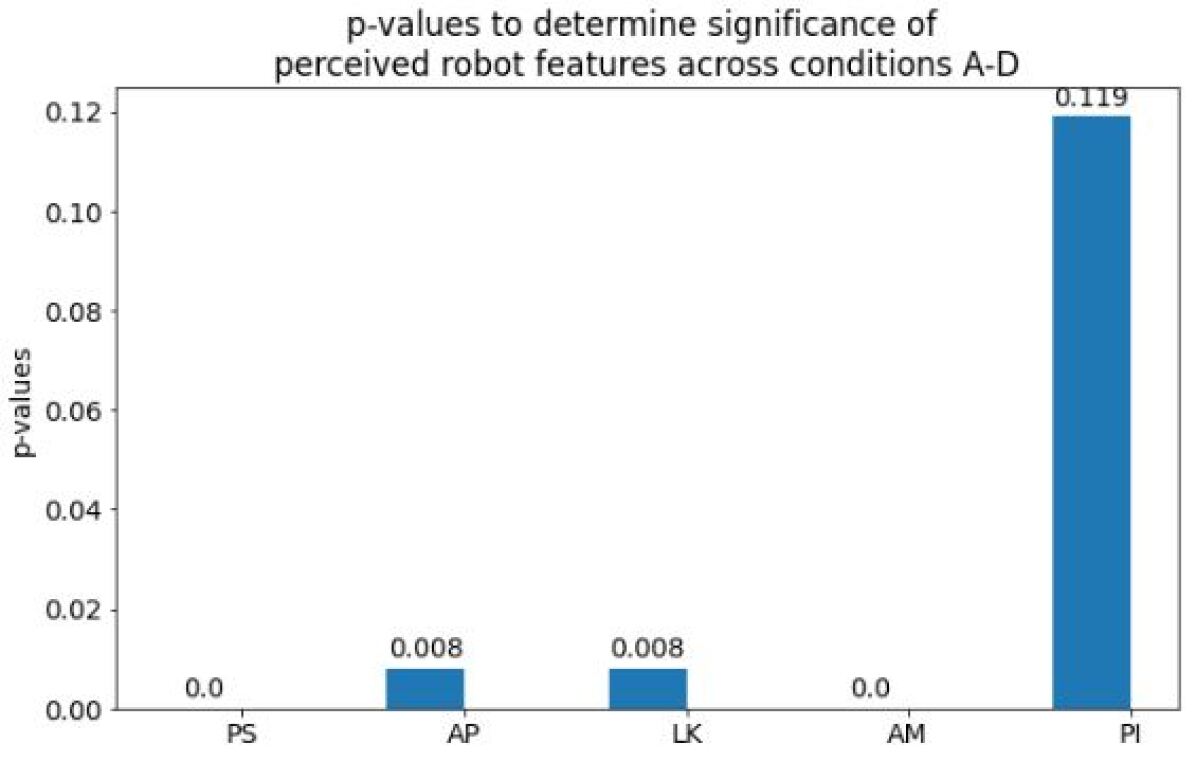
The main effects plot for each of the perceived features has been shown in Figure 4(a)-4(e), and the -values for them have been shown in Figure 4(f). From the values it can be seen that for perceived safety, anthropomorphism, likeability and animacy, we can reject the null hypothesis since the -value , whereas we accept for perceived intelligence (-value ). This means that under different conditions A-D, a user has different levels of perception of PS, AP, LK, and AM; but the perceived intelligence of the robot remains unaffected. From the main effects plot in Figures 4(a)-4(d), we can also conclude that:
-
•
Perceived safety: BACD. This means that the modality of the Amazon Polly Justin voice of the NAO robot with smooth motions was perceived to be the safest among users.
-
•
Anthropomorphism: ABDC. The users perceived the NAO robot’s default voice with smooth motions to be most anthropomorphic (human-like).
-
•
Likeability: ACBD. The participants liked the NAO’s default voice with its smooth motions most, similar to the case of anthropomorphism.
-
•
Animacy: ABCD. Condition A still has the most preference for animacy as compared to the other conditions.
III-B Effects of Experience with robots
In this section, we compare the effects of varying robot experiences for each of the significantly perceived features (value 0.05) evaluated from the previous section (i.e perceived safety, anthropomorphism, likeability, and animacy). We have considered 4 levels of robot experiences:
-
•
0: No experience/never heard of robots before today
-
•
1: Fundamental awareness (basic knowledge/awareness of robots)
-
•
2: Novice (limited direct experience with robots)
-
•
3: Intermediate (completed practical applications with robots)
We use a similar hypothesis as in equation 5 for finding the effect of robot experience on the perceived features:
| (6a) | |||
| (6b) |
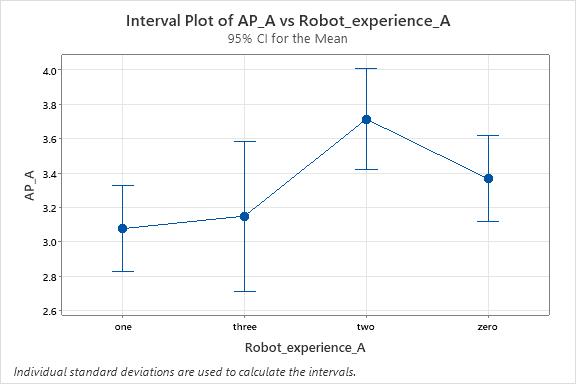
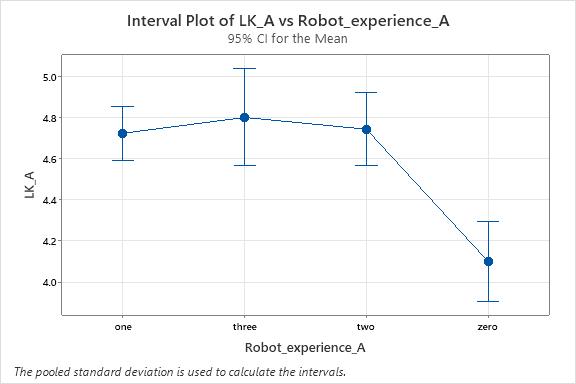
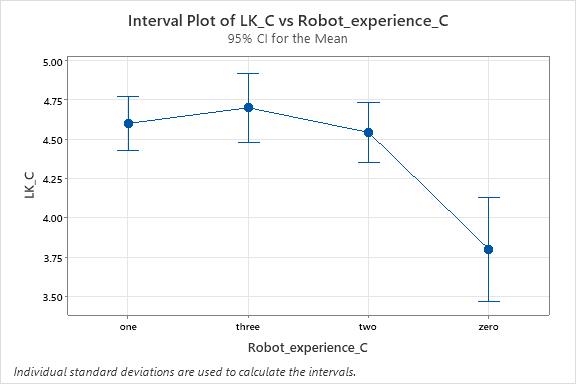
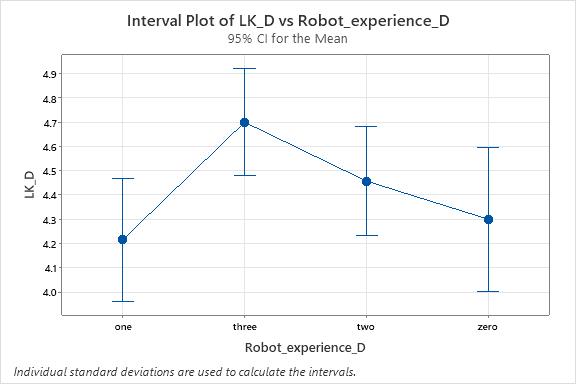
The details of test of variances, values for all combinations of conditions and features have been shown in Table II. It can be seen that prior experience with robots does not have any effect on the participants under any of the conditions (A-D) as far as perceived safety of robots during the interaction is concerned. The same holds for animacy too. On the other hand, under some conditions (A-D), anthropomorphism and likeability of the robot depend on prior experience with robotics has been highlighted in Table II. The main effects plot of these significant values have been shown in Figure 5. Based on these graphs, we conclude that for condition A, novice participants (level-‘2’) found the robot to be more anthropomorphic than the other participants. Similarly, participants with experience level-‘3’ found the robot more likeable for conditions A, C, and D.
III-C Effects on Physiological response
From equation 1, we can see that the sliding window approach has strides in between two consecutive windows. The approach has been adopted from the authors in [26] where an eight-second sliding window is used with a two-second stride length. We analyzed the effect of different stride length on the train, test, and validation accuracy of both of our models. All the code for these deep learning models was run on Google Colab’s premium version. The learning rate used for each of these simulations was 0.001 with Adam optimization and accuracy as the metric. The framework used for this work was Tensorflow.
III-C1 CNN model with raw BVP signal
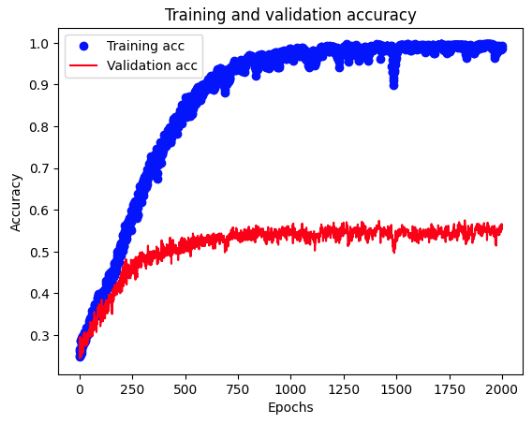
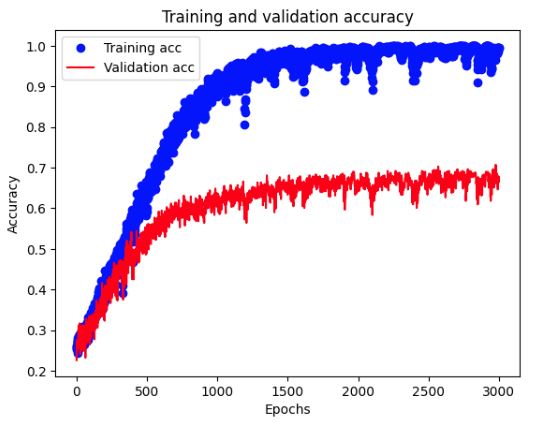
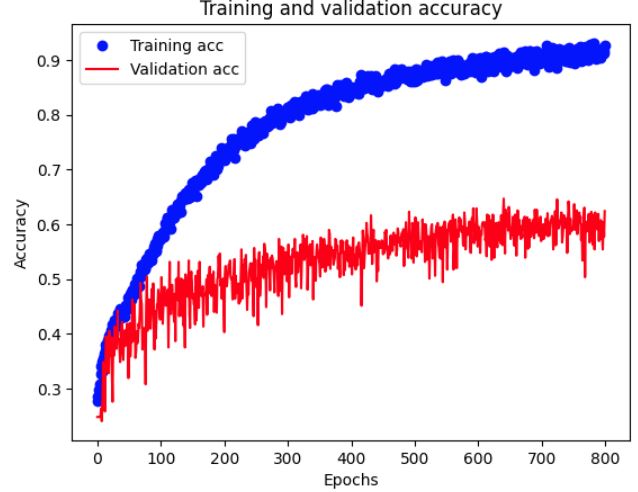
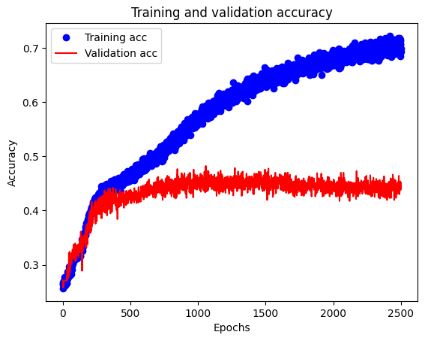
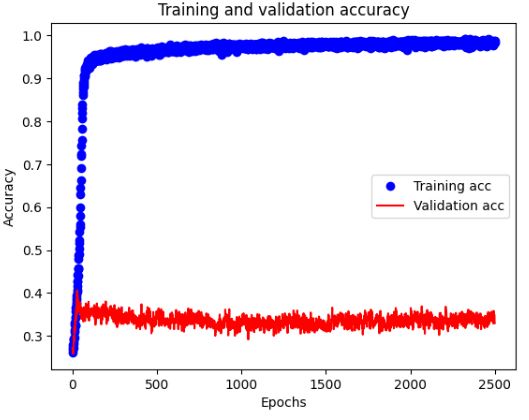
The effective length, as defined by the equation in 7, has been used as the reference for inspecting different lengths of the sliding window and strides.
| (7) |
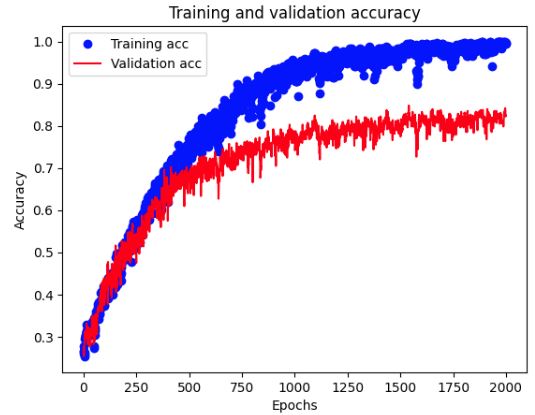
As can be seen from Figure 6, the effective length of 0.25 (Figure 7(a)) fetched the maximum test accuracy (0.8179) followed by the effective length of 0.39 (Figure 7(b)) with a test accuracy of 0.6767 and effective length of 0.5 with a test accuracy of 0.5831. In addition, the validation accuracies are also in agreement with the test accuracies for each of the effective length values. Hence, as the effective length increases, the validation and test accuracies of the model decreases.
III-C2 CNN model with Gramian Angular Field
III-C3 Proof of trend stationarity of BVP signal
We have used the Augmented Dickey-Fuller (ADF) test [6] and the Kwiatkowski-Phillips-Schmidt-Shin (KPSS) Test [25] for testing the trend stationarity of the BVP signal.
| -values w.r.t. 95% confidence interval | ||||
| Tests | A | B | C | D |
| ADF | 0.1 | 0.1 | 0.1 | 0.1 |
| KPSS | 0.0 | 0.0 | 0.0 | 0.0 |
IV Limitations and Future Work
For the user acceptance part of this paper, we would like to further test the impressions of children with ASD to the robot’s modalities for comparing the perceived features of the NAO robot. In addition, we would like to expand the capability of the NAO robot to be able to understand and respond to candid conversations rather than pre-defined questions which is aligned with the aims in [23]. For the classification problem described, we would like to include the use of autoencoders for denoising the BVP signal [16, 42] towards making an end-to-end deep learning pipeline for classification.
V Conclusion
In this paper, we present a study that involves the use of the humanoid NAO robot for a neurotypical population with four different conditions (A-D) of varying voice types and motions during HRI (see Section II-B for more details). The participants’ prior experience with robots has also been considered in this study. We have analysed the response of the participants on five perceived features (pf) of the robot namely, perceived safety, anthropomorphism, likeability, animacy, and perceived intelligence. We have analysed if the different conditions (A-D) have any effect on the users’ perception of the five perceived robot features. In addition, we have compared the effects of varying amounts of prior experience with robots among the participants on pf under the four conditions (A-D). In the end, we demonstrated the effect of these conditions on the physiology (here BVP) of the participants. Based on the performance of our deep learning approach, we were able to classify the physiological responses of the participants under different conditions with more than chance () accuracy. Between the two approaches used for classification, using the raw signals with a CNN model (test acc: 0.8179 %) worked better than using GAF (test accuracy: 0.59%) attributing to the trend stationarity of the BVP signal.
Ethical Impact Statement
As described in Section II, prior IRB approval was taken before conducting this study. Informed consent was taken from all the participants. In addition, they had an option to opt out of the study at any stage.
The data collected during this study had no gender or racial bias. We had a close to equal male to female ratio (Male= 43%, Female= 57%). However, efforts were not made to ensure cross cultural data collection. Additional research would be needed to address the social impressions of the NAO robot across cultures.
For the deep learning model used, the generalization is performed across the subject data collected currently. Although, only BVP data was used as a physiological marker for differentiating between the conditions A-D. This distinction might not be generalizable across different physiological signals like Electrodermal Activity (EDA) or temperature.
Acknowledgment
The authors wish to acknowledge undergraduate researchers for their assistance with collecting the data. We also want to thank the adult subjects and the staff at the university-affiliated autism center.
References
- [1] Saime Akdemir Akar, Sadık Kara, Fatma Latifoğlu, and Vedat Bilgic. Spectral analysis of photoplethysmographic signals: The importance of preprocessing. Biomedical Signal Processing and Control, 8(1):16–22, 2013.
- [2] Manahil Alfuraydan, Jodie Croxall, Lisa Hurt, Mike Kerr, and Sinead Brophy. Use of telehealth for facilitating the diagnostic assessment of autism spectrum disorder (asd): A scoping review. PloS one, 15(7):e0236415, 2020.
- [3] A American Psychiatric Association, American Psychiatric Association, et al. Diagnostic and statistical manual of mental disorders: DSM-5, volume 10. Washington, DC: American psychiatric association, 2013.
- [4] Jon Baio. Prevalence of autism spectrum disorder among children aged 8 years-autism and developmental disabilities monitoring network, 11 sites, united states, 2010. 2014.
- [5] Christoph Bartneck, Dana Kulić, Elizabeth Croft, and Susana Zoghbi. Measurement instruments for the anthropomorphism, animacy, likeability, perceived intelligence, and perceived safety of robots. International journal of social robotics, 1:71–81, 2009.
- [6] Christopher Baum. Kpss: Stata module to compute kwiatkowski-phillips-schmidt-shin test for stationarity. 2018.
- [7] Sven Bölte. Is autism curable? Developmental Medicine & Child Neurology, 56(10):927–931, 2014.
- [8] Colleen M Carpinella, Alisa B Wyman, Michael A Perez, and Steven J Stroessner. The robotic social attributes scale (rosas) development and validation. In Proceedings of the 2017 ACM/IEEE International Conference on human-robot interaction, pages 254–262, 2017.
- [9] Kerstin Dautenhahn and Iain Werry. Towards interactive robots in autism therapy: Background, motivation and challenges. Pragmatics & Cognition, 12(1):1–35, 2004.
- [10] Kerstin Dautenhahn, Iain Werry, Tamie Salter, and Rene Boekhorst. Towards adaptive autonomous robots in autism therapy: Varieties of interactions. In Proceedings 2003 IEEE International Symposium on Computational Intelligence in Robotics and Automation. Computational Intelligence in Robotics and Automation for the New Millennium (Cat. No. 03EX694), volume 2, pages 577–582. IEEE, 2003.
- [11] Matthieu Destephe, Massimiliano Zecca, Kenji Hashimoto, and Atsuo Takanishi. Uncanny valley, robot and autism: Perception of the uncanniness in an emotional gait. In 2014 IEEE International Conference on Robotics and Biomimetics (ROBIO 2014), pages 1152–1157. IEEE, 2014.
- [12] K Francis. Autism interventions: a critical update. Developmental medicine and child neurology, 47(7):493–499, 2005.
- [13] Shimrit Fridenson-Hayo, Steve Berggren, A Lassalle, Shahar Tal, Delia Pigat, N Meir-Goren, Helen O’Reilly, S Ben-Zur, Sven Bölte, Simon Baron-Cohen, et al. ‘emotiplay’: a serious game for learning about emotions in children with autism: results of a cross-cultural evaluation. European child & adolescent psychiatry, 26:979–992, 2017.
- [14] Toufigh Gordi and Harry Khamis. Simple solution to a common statistical problem: interpreting multiple tests. Clinical therapeutics, 26(5):780–786, 2004.
- [15] Gerhard Hommel. A stagewise rejective multiple test procedure based on a modified bonferroni test. Biometrika, 75(2):383–386, 1988.
- [16] TAO Huamin, DENG Qiuqun, and XIAO Shanzhu. Reconstruction of time series with missing value using 2d representation-based denoising autoencoder. Journal of Systems Engineering and Electronics, 31(6):1087–1096, 2020.
- [17] Vijay Kumar. Statistical tests to check stationarity in time series, 2021. Last accessed 11 April 2023.
- [18] Justin B Leaf, Sara K Sato, Asim Javed, Shannon M Arthur, Ashley N Creem, Joseph H Cihon, Julia L Ferguson, and Misty L Oppenheim-Leaf. The evidence-based practices for children, youth, and young adults with autism report: Concerns and critiques. Behavioral Interventions, 36(2):457–472, 2021.
- [19] Jaeryoung Lee, Hiroki Takehashi, Chikara Nagai, Goro Obinata, and Dimitar Stefanov. Which robot features can stimulate better responses from children with autism in robot-assisted therapy? International Journal of Advanced Robotic Systems, 9(3):72, 2012.
- [20] Scott O Lilienfeld, Julia Marshall, James T Todd, and Howard C Shane. The persistence of fad interventions in the face of negative scientific evidence: Facilitated communication for autism as a case example. Evidence-Based Communication Assessment and Intervention, 8(2):62–101, 2014.
- [21] Hangcheng Liu. Comparing Welch ANOVA, a Kruskal-Wallis test, and traditional ANOVA in case of heterogeneity of variance. Virginia Commonwealth University, 2015.
- [22] Nidhi Mishra, Manoj Ramanathan, Gauri Tulsulkar, and Nadia Magnenat Thalmann. Uncanny valley for interactive social agents: An experimental study. Virtual Reality & Intelligent Hardware, 4(5):393–405, 2022.
- [23] Ruchik Mishra. Towards adaptive and personalized robotic therapy for children with autism spectrum disorder. In 2022 10th International Conference on Affective Computing and Intelligent Interaction Workshops and Demos (ACIIW), pages 1–5. IEEE, 2022.
- [24] Masahiro Mori. Bukimi no tani (the uncanny valley). Energy, 7(4):33–35, 1970.
- [25] Rizwan Mushtaq. Augmented dickey fuller test. 2011.
- [26] Attila Reiss, Ina Indlekofer, Philip Schmidt, and Kristof Van Laerhoven. Deep ppg: large-scale heart rate estimation with convolutional neural networks. Sensors, 19(14):3079, 2019.
- [27] Ben Robins, Kerstin Dautenhahn, Rene Te Boekhorst, and Aude Billard. Effects of repeated exposure to a humanoid robot on children with autism. In Designing a more inclusive world, pages 225–236. Springer, 2004.
- [28] Micheal Sandbank, Kristen Bottema-Beutel, Shannon Crowley, Margaret Cassidy, Kacie Dunham, Jacob I Feldman, Jenna Crank, Susanne A Albarran, Sweeya Raj, Prachy Mahbub, et al. Project aim: Autism intervention meta-analysis for studies of young children. Psychological bulletin, 146(1):1, 2020.
- [29] Dincer Saral, Seray Olcay, and Halil Ozturk. Autism spectrum disorder: When there is no cure, there are countless of treatments. Journal of Autism and Developmental Disorders, pages 1–16, 2022.
- [30] Brian Scassellati, Henny Admoni, and Maja Matarić. Robots for use in autism research. Annual review of biomedical engineering, 14:275–294, 2012.
- [31] Alison Singer and Ramita Ravi. Complementary and alternative treatments for autism part 2: identifying and avoiding non-evidence-based treatments. AMA journal of ethics, 17(4):375–380, 2015.
- [32] Wing-Chee So, Miranda Kit-Yi Wong, Carrie Ka-Yee Lam, Wan-Yi Lam, Anthony Tsz-Fung Chui, Tsz-Lok Lee, Hoi-Man Ng, Chun-Hung Chan, and Daniel Chun-Wing Fok. Using a social robot to teach gestural recognition and production in children with autism spectrum disorders. Disability and Rehabilitation: Assistive Technology, 13(6):527–539, 2018.
- [33] Jessica R Steinbrenner, Kara Hume, Samuel L Odom, Kristi L Morin, Sallie W Nowell, Brianne Tomaszewski, Susan Szendrey, Nancy S McIntyre, Serife Yücesoy-Özkan, and Melissa N Savage. Evidence-based practices for children, youth, and young adults with autism. FPG Child Development Institute, 2020.
- [34] Ajit C Tamhane. Multiple comparisons in model i one-way anova with unequal variances. Communications in Statistics-Theory and Methods, 6(1):15–32, 1977.
- [35] Fadi Thabtah and David Peebles. A new machine learning model based on induction of rules for autism detection. Health informatics journal, 26(1):264–286, 2020.
- [36] Yuki Ueyama. A bayesian model of the uncanny valley effect for explaining the effects of therapeutic robots in autism spectrum disorder. PloS one, 10(9):e0138642, 2015.
- [37] Iris van den Berk-Smeekens, Martine van Dongen-Boomsma, Manon WP De Korte, Jenny C Den Boer, Iris J Oosterling, Nienke C Peters-Scheffer, Jan K Buitelaar, Emilia I Barakova, Tino Lourens, Wouter G Staal, et al. Adherence and acceptability of a robot-assisted pivotal response treatment protocol for children with autism spectrum disorder. Scientific reports, 10(1):1–11, 2020.
- [38] Caroline L van Straten, Iris Smeekens, Emilia Barakova, Jeffrey Glennon, Jan Buitelaar, and Aoju Chen. Effects of robots’ intonation and bodily appearance on robot-mediated communicative treatment outcomes for children with autism spectrum disorder. Personal and Ubiquitous Computing, 22:379–390, 2018.
- [39] Zhiguang Wang and Tim Oates. Imaging time-series to improve classification and imputation. arXiv preprint arXiv:1506.00327, 2015.
- [40] Iain Werryz, Kerstin Dautenhahn, Bernard Ogden, and William Harwinz. Can social interaction skills be taught by a social agent? the role of a robotic mediator in autism. In Cognitive Technology: Instruments of Mind: 4th International Conference, CT 2001 Coventry, UK, August 6-9, 2001 Proceedings, volume 2117, page 57. Springer Science & Business Media, 2001.
- [41] Hongji Xu, Juan Li, Hui Yuan, Qiang Liu, Shidi Fan, Tiankuo Li, and Xiaojie Sun. Human activity recognition based on gramian angular field and deep convolutional neural network. IEEE Access, 8:199393–199405, 2020.
- [42] Zhong Zheng, Zijun Zhang, Long Wang, and Xiong Luo. Denoising temporal convolutional recurrent autoencoders for time series classification. Information Sciences, 588:159–173, 2022.