EIGER IV: The cool 104K circumgalactic environment of high- galaxies reveals remarkably efficient IGM enrichment
Abstract
We report new observations of the cool diffuse gas around 29, galaxies, using deep JWST/NIRCam slitless grism spectroscopy around the sightline to the quasar J0100+2802. The galaxies span a stellar mass range of , and star-formation rates of SFR/ . We find galaxies for seven Mg ii absorption systems within 300 kpc of the quasar sightline. The Mg ii radial absorption profile falls off sharply with radii, with most of the absorption extending out to 2-3 of the host galaxies. Six out of seven Mg ii absorption systems are detected around galaxies with 9. Mg ii absorption kinematics are shifted from the systemic redshift of host galaxies with a median absolute velocity 135 and standard deviation 85 . The high kinematic offset and large radial separation (), suggest that five out of the seven Mg ii absorption systems are gravitationally not bound to the galaxies. In contrast, most cool circumgalactic media at are gravitationally bound. The high incidence of unbound Mg ii gas in this work suggests that towards the end of reionization, galaxy halos are in a state of remarkable disequilibrium, and are highly efficient in enriching the intergalactic medium. Two strongest Mg ii absorption systems are detected at 4.22 and 4.5, the former associated with a merging galaxy system and the latter associated with three kinematically close galaxies. Both these galaxies reside in local galaxy over-densities, indicating the presence of cool Mg ii absorption in two “proto-groups” at .
1 Introduction
The commissioning of the has ushered in a new era for spectroscopy of galaxies and intergalactic matter near the Epoch of Reionization (EoR) (Rigby et al., 2022). Strong rest frame optical lines (e.g., H-, [OIII]) are finally observable at ; which combined with JWST’s efficient spectroscopic modes have enabled large scale spectroscopic surveys of galaxies at EoR (Kashino et al., 2023a; Matthee et al., 2023b; Wang et al., 2023; Oesch et al., 2023). By performing carefully constructed spectroscopic experiments, where the galaxy fields also have bright high- quasars, one can extend the study of galaxies to characterize their gaseous halos (Kashino et al., 2023a). Deep ground based near infra-red (NIR) spectroscopy of these quasars often reveal intervening metal absorption line systems associated with galaxies along the line of sight: a signature of diffuse baryonic reservoir of gas around galaxies (e.g., Cooper et al., 2019). These cosmic ecosystems fuel the growth of stellar mass in galaxies and serve as reservoirs of gas recycling. At , such cosmic ecosystems have been successfully characterized as the circumgalactic medium (CGM) around galaxies (Tumlinson et al., 2017). Over the last two decades, large galaxy and quasar surveys have enabled detailed characterization of the CGM, establishing it as an ubiquitous reservoir of diffuse gas around galaxies (Chen et al., 2001, 2010; Bordoloi et al., 2011; Tumlinson et al., 2013; Nielsen et al., 2013; Zhu et al., 2014; Huang et al., 2016; Burchett et al., 2016; Johnson et al., 2017).
In the last 7 Gyrs of the history of the Universe (), comparison of absorption line systems observed in background spectra of bright background quasars or galaxies with their host galaxy populations have revolutionized our understanding of the late-time CGM and its role in galaxy formation (see, Tumlinson et al. 2017 for a detailed review). These studies have revealed that both highly ionized metals (traced by O vi, C iv) and low ionized metals (traced by Mg ii) show strong trends with increasing galaxy star-formation rates, and stellar masses (Chen et al., 2001; Prochaska et al., 2011; Chen et al., 2010; Tumlinson et al., 2011; Bordoloi et al., 2011; Nielsen et al., 2013; Liang & Chen, 2014; Lan & Mo, 2018). Cool circumgalactic gas traced by Mg ii shows strong dependence on morphology and orientation of outflows vs inflows (Bordoloi et al., 2011, 2014a, 2014b; Kacprzak et al., 2012; Bouché et al., 2012; Rubin et al., 2014; Martin et al., 2019; Lundgren et al., 2021). Diffuse warm-hot intra-group medium is also detected around groups of galaxies (Bordoloi et al., 2011; Johnson et al., 2015; Chen et al., 2020; Dutta et al., 2021; McCabe et al., 2021). CGM gas appears bimodal in metallicity, with a portion tracing enriched outflows (20-100% solar) and a distinct metal-poor component ( 5% solar) that may resemble the long-sought “cold accretion” entering galaxies from the IGM (Lehner et al., 2013; Wotta et al., 2019). Most crucially mass and metal census of the CGM gas at suggests that the CGM may host a large share of galactic baryons, with the CGM mass content outweighing the total stellar mass content of galaxies (Stocke et al., 2013; Werk et al., 2014; Prochaska et al., 2017), and hosts a massive reservoir of galactic metals, with galaxies having ejected at least as much metal mass as they have retained (Tumlinson et al., 2011; Bordoloi et al., 2014b; Peeples et al., 2014). At these redshifts, most of the CGM gas is bound to the dark matter halo of its host galaxy, suggesting that most of the gas will be recycled back to the ISM (Tumlinson et al., 2013; Bordoloi et al., 2014b; Ford et al., 2014; Huang et al., 2016; Bordoloi et al., 2018).
At , the CGM contain a large metal reservoir, but more of this gas is kinematically consistent with not being bound to the host galaxy’s dark matter halo than their counterparts (Rudie et al., 2019). Observations by lensed QSOs and spatially extended lensed arcs reveal that individual CGM gas clouds are small and show large variations even within a single halo (Rauch et al., 1999; Rubin et al., 2018; Lopez et al., 2018; Bordoloi et al., 2022b). A consensus has emerged that the CGM is a ubiquitous feature of galaxies from to (Rudie et al., 2012; Tumlinson et al., 2017; Péroux & Howk, 2020; Lehner et al., 2022).
Within the first Gyr of cosmic history, the rest-frame UV transitions that are instrumental in characterizing the low- CGM, are redshifted into the near infrared (NIR). Moreover, any transition blueward of Ly- will not be observable owing to the intervening neutral IGM. Therefore, heavy element absorption systems in high- quasar spectra provide our only access to the chemical enrichment and ionization taking place in this environment. NIR spectroscopy of QSOs at (e.g., Becker et al. 2001; Simcoe et al. 2012; Bañados et al. 2018; Cooper et al. 2019; Yang et al. 2020; Davies et al. 2023) has pushed these investigations within the first Gyr of the Big Bang. These studies find that the number density evolution of strong Mg ii absorption systems trace the cosmic star-formation history of the Universe whereas the weaker systems show no evolution out to (Matejek & Simcoe, 2012). The incidence of detection of low ionization species (e.g., C ii, O i) remain high even at high-, whereas the incidence of detection of high ionized species (e.g., C iv, Si iv) drop off sharply beyond (Cooper et al., 2019; Becker et al., 2019). This might be owing to change in UV background at the early Universe or reflect some fundamental change in galaxy properties. Therefore, identifying the galaxies associated with these absorbers at high- might give crucial insight into the latter stages of EoR.
Prior to JWST, it has been prohibitive to conduct detailed galaxy surveys to identify the host galaxies of these absorbers. But initial studies of detection of host galaxies suggest a strong correlation between the absorption lines detected at high- with host galaxies.
Recently two works reported the presence of galaxy overdensities near a strong C iv absorption system at 5.72, four Ly- emitting galaxies (LAE) (Díaz et al., 2021) and two [CII]158 m emitting galaxies (Kashino et al., 2023b). Additionally, another host galaxy associated with a OI absorption system using [CII]158 m line was reported (Wu et al., 2021). Cross correlation of LAE galaxies from deep MUSE observations also suggest a link between strong C iv absorbers and bright LAE galaxies out to (Galbiati et al., 2023).
These promising early results suggest that a systematic multi-wavelength galaxy survey is warranted to study the CGM host galaxies at , where detailed galaxy properties can be studied.
In this work we present the first CGM measurements traced by Mg ii absorption around 29 () galaxies in the EIGER survey (Emission-line Galaxies and Intergalactic Gas in the Epoch of Reioniation; Kashino et al. 2023a). We focus on the first observations around the hyper-luminous quasar J0100+2802.
This paper is organized as follows. In section 2 we describe the observations and summarize the survey strategy. In section 3 we describe the measurements of galaxy properties and the CGM absorber properties. In section 4 we describe the results. In section 5 we present the summary and discussion of the results. Throughout this paper we follow a flat CDM cosmology with 67.7 , = 0.31, and = 0.69 (Planck Collaboration et al., 2020). All magnitudes are listed in the AB system. Unless stated otherwise, all distances are quoted in units of physical kpc.
2 Observations
2.1 The EIGER Survey
The EIGER survey is a 126.5 hour JWST GTO (PID:1243, PI: S. J. Lilly) program, that performs NIRCam wide field slitless spectroscopy (WFSS) around six extra-galactic fields, each centered on a hyper-luminous () quasar. We refer the reader to Kashino et al. (2023a) for a detailed description of survey design rationale and data reduction methods. Below we briefly summarize different aspects of the observations.
2.2 NIRCam observations of J0100+2802
In this work, we focus on metal absorption in the vicinity of galaxies detected in the quasar field of J0100+2802. JWST/NIRCam WFSS spectroscopy is performed with the F356W filter using the reverse grisms (GRISMR), which both disperse the spectra horizontally on the NIRCam sensors but with opposite parity. The spectral resolution of the observations is . Simultaneously with spectroscopy, F115W, F200W imaging of the field is performed. Direct and out-of-field imaging in the F356W filter is performed to cover the full spectroscopic field of view (Kashino et al., 2023a).
A four pointing mosaic strategy is employed, that ensures that the central has the maximum depth of 35 kilo-seconds. The total spectroscopic field of view around J0100+2802 is 25.9 arcmin2, and the total exposure time ranges from 8-35 kilo-seconds. In this work we focus only on the central 4.6 arcmin2 of the field, which is covered by both the NIRCam modules A and B (with reversed dispersion directions). This enables us to accurately identify single emission line objects and measure their redshifts (Matthee et al., 2023a).
NIRCam imaging data is reduced as described in Kashino et al. (2023a) using jwst pipeline (v1.8.2; Bushouse et al., 2022a). Additional post-processing steps are performed to mask strong cosmic ray hits following Merlin et al. (2022). Astrometry is calibrated by aligning known stars from the Gaia Data Release 2 catalog (Gaia Collaboration et al., 2018). Several known artefacts (e.g., stray-light features, 1/f noise, residual sky background) are subtracted (Kashino et al., 2023a) before obtaining a final co-added image with pixel sizes of 0.03 /pixel.
These final co-added images are used to perform aperture-matched photometry with SExtractor in dual mode. The F356W image is used as the detection image. All images are convolved to match the point spread function of the F356W image. Kron aperture magnitudes are measured and photometric uncertainties are estimated by measuring random blank sky variations for apertures of different sizes, scaled to the local variance propagated by the pipeline (see, Kashino et al. 2023a).
NIRCam WFSS data reduction is performed using a combination of jwst pipeline (v1.7.0; Bushouse et al., 2022b) and custom in-house tools as described in detail in Kashino et al. (2023a) and Matthee et al. (2023a). To summarize, each individual exposure is processed with the Detector1 step in the jwst pipeline and assigned a WCS with the Spec2 step. The frames are flat fielded and additional noise and sky background variation are removed by subtracting the median flux of each column to create the science frames. A continuum map is created by using a running median filter along the dispersion direction. The median filter kernel size is adaptive and has a hole in the center to ensure that it does not over subtract the emission lines. This continuum map is subtracted from each science frame to create an emission line map for each exposure. We stress that the continuum subtraction process does not rely on the source position or any trace model. We refer the reader to (Kashino et al., 2023a) for detailed description of this process.
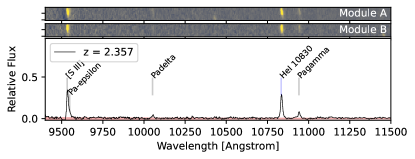
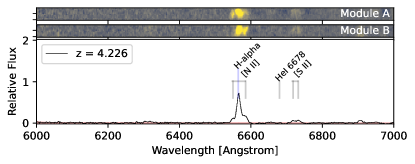
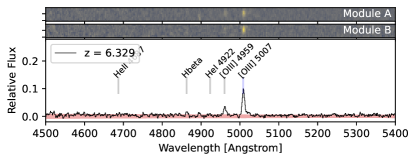
For each object detected in F356W imaging, a 2D spectrum is extracted based on grismconf111https://github.com/npirzkal/GRISMCONF with the V4 trace models222https://github.com/npirzkal/GRISM_NIRCAM. We perform additional pixel-level correction to the trace models to optimize the extraction based on our own empirical calibration using spectra of bright stars. Individual exposures are divided by the relevant sensitivity curve, rectified for small curvature, and re-sampled onto a common observed wavelength grid (, with pixel size of 9.75 Å). For each individual module, these exposures are co-added with sigma clipping to produce the final 2D spectrum of a galaxy. For a given object position, we extract one independent spectra from each module. This results in two independent spectra obtained from the two NIRCam modules for each source. Since these two spectra have reverse dispersion directions, only emission lines that are truly coming from the object of interest will appear at the same observed wavelength in both the spectra. All other lines will shift in wavelength and/or disappear completely. This is the primary diagnostic to remove unrelated emission lines that are coming from other objects. Figure 1, top panels show the continuum subtracted 2D emission line spectra of three galaxies at 2.3, 4.2 and 6.3, respectively. Common emission lines are independently detected on both modules, further verifying their robustness.
2.3 HST observations of J0100+2802
We obtain HST/ACS imaging of the J0100+2802 field in F850LP, F775W, and F606W filters respectively (HST PID: 15085, 13605). The total exposure time for these observations is 24,450 seconds. We query MAST for the individual flc.fits exposures, which are corrected for charge transfer inefficiency but have not been re-sampled. We align the individual exposures to the NIRCam F356W mosaic, and drizzle the images to the common pixel grid of the NIRCam mosaics using DrizzlePac (Mack et al., 2022). The routine masks cosmic rays, performs median blotting and matches the sky of each exposure before calculating the median co-added image. To create PSF-matched images for precise multi-band photometry we calculate matching kernels, using PSFs derived from TinyTim (Krist et al., 2011) and re-sample to the 0.03 pixel scale.
2.4 Ground Based spectroscopy of Quasar J0100+2802
Deep ground based optical and NIR spectroscopic observations are performed on the quasar J0100+2802 using both the Magellan/FIRE and the VLT/X-shooter instruments. The target has been observed for a total of 16.8 hours with 5.8 hours of Magellan/FIRE (PI: Simcoe) and 11 hours of VLT/X-shooter (program ID: 096.A-0095; PI: Pettini) observations, respectively. Additionally, high-resolution (), Keck/HIRES observations are performed on J0100+2802, to cover the optical () part of the spectrum (Cooper et al., 2019). The total integration time for HIRES observations are 3.8 and 3 hours, respectively in two different grating setups.
These observations are self consistently reduced with the PypeIt data reduction pipeline (Prochaska et al., 2020), and a final co-added, flux calibrated spectra is produced for both the instruments. We refer the reader to Eilers et al. (2023) for a detailed description of the data reduction method. The final FIRE/XShooter spectra have a median signal to noise ratios (SNR) 138/126 per resolution element across the full wavelength range. The 16th and 84th percentile SNR per resolution element for FIRE/XShooter spectra are 75/32 and 204/214, respectively. The variation of SNR per resolution element as a function of observed frame wavelength is presented in Table 1.
3 Methods
Here we describe how emission line galaxy properties are measured and how absorption lines are identified and analyzed.
| Instrument | aaThe 16th, 50th and 84th percentile SNR per resolution element are reported. | aaThe 16th, 50th and 84th percentile SNR per resolution element are reported. | aaThe 16th, 50th and 84th percentile SNR per resolution element are reported. | |
|---|---|---|---|---|
| FIRE | 102, 143, 189 | 83, 180,244 | 59, 106, 183 | |
| XShooter | 80, 150, 188 | 80, 196, 245 | 20, 37, 65 |
3.1 Galaxy Redshifts
We create a candidate emission line galaxy list using the following two criteria. We search for emission line objects (with SNR per module 7) in the central 4.6 arcmin2 of the EIGER footprint, which is covered by both the NIRCam grism modules (A and B). This choice ensures that the total SNR of each emission line object is 10. We further restrict our search to objects whose spectrum contains a verified emission line that would plausibly be at a redshift within 0.02 of the identified intervening metal absorption lines. For each identified object, we extract 2D galaxy spectra as described in Section 2.2. Additionally, we look for higher redshift galaxies near the quasar identified with [OIII]/H- emission lines (Matthee et al., 2023a). This yields a sample of 127 objects within 108 arcsec of the J0100+2802 quasar. Monte Carlo simulations of injecting and recovering synthetic emission lines in the central 4.6 arcmin2 of the J0100+28 field, yield a spectroscopic completeness of 50% for emission line flux of 1.6, and 90% for emission line flux of 2.8, respectively (Mackenzie et al. in prep). We quantify the mass completeness of the spectroscopic sample presented in this work by using mock observations from the JAGUAR (JWST extra-galactic mock) catalog (Williams et al., 2018). We compute the spectroscopic mass completeness as a function of stellar mass bins in different redshift slices. In each redshift slice, the mass completeness of an individual stellar mass bin is defined as the ratio between the number of galaxies above the F356W flux detection threshold and the total number of galaxies in that bin. At 6 we find that the spectroscopic sample presented in this work is 50% mass complete at 8.5, and at 4.2 the galaxy sample is 50% mass complete at 8.13, respectively.
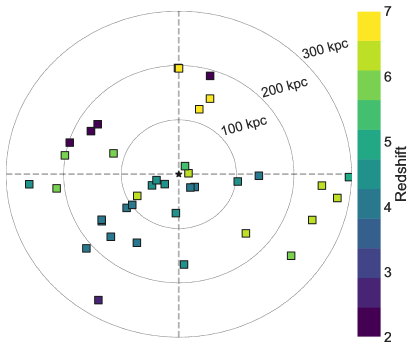
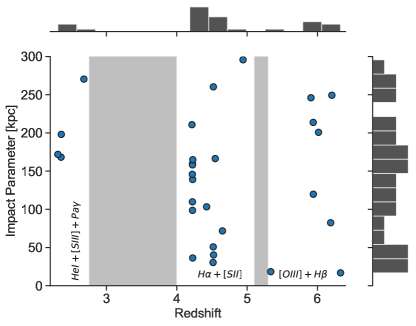
Each spectrum is individually inspected using a custom python API (zgui, Bordoloi et al., 2022a), which is used to independently extract an 1D spectrum for each module. We identify individual emission lines and fit a Gaussian profile to measure the redshift of the galaxy. Photo- posterior distribution function for each object is also inspected to identify any foreground contaminating object. For the same object, it is crucial to inspect the spectra from both modules to identify and mask out any contaminating feature from other galaxies. Since the two spectra are extracted from the two NIRCam modules with reversed dispersion directions, only “real” lines associated with the extracted object will appear consistently at the same wavelength in the two modules. Each object is visually inspected by at least two individuals, and only objects with secure redshifts are considered for analysis. This creates a total sample of 87 galaxies with . Figure 2, left panel shows the spatial distribution of these galaxies within 300 physical kpc of the J0100+2802 quasar sightline. Each individual galaxy is color coded to reflect its spectroscopic redshift. Independent redshift measurements from both modules yield a typical redshift accuracy of 140 for each galaxy. Since we focus only on the CGM host of the Mg ii absorbers along the J0100+2802 sightline, we further select only galaxies within 300 kpc from the J0100+2802 quasar sightline and at a redshift lower than the quasar (). The lower redshift limit is chosen to match the lowest redshift Mg ii absorber detected along this line of sight. This yields a final sample of 29 galaxies. Figure 2, right panel shows the redshift and impact parameter distribution of this final sample of galaxies with a mean redshift of . Throughout the rest of the paper, we will only focus on this sample of galaxies.
The gray shaded regions (Figure 2, right panel) mark the redshift ranges where no strong galaxy rest frame optical emission lines shift into the observed wavelength range of EIGER NIRCam/grism spectroscopy. Our survey is most sensitive to the three redshift windows, (using HeI+[SIII]+Pa- lines), (using H-+[SII] lines), and (using [OIII]+H- lines). Future, ground based spectroscopic follow-ups or additional JWST spectroscopy with different gratings will enable us to cover these missing redshift ranges.
We note that since our galaxy search is explicitly within 0.02 ( ) of the identified absorption lines, the galaxy sample is not selected blindly without any knowledge of the absorption systems. This “galaxy centric” (e.g., Bordoloi et al., 2011; Tumlinson et al., 2013) approach is essential to characterize the covering fraction of the CGM gas or to measure the total metal mass budget of the CGM (Tumlinson et al., 2011; Bordoloi et al., 2014c). Owing to challenges of identifying single emission line galaxies, and in mitigating contamination from other sources, we restrict this work to focus only on galaxies within 0.02 of identified absorption line systems. This search window is large enough that we can still detect galaxies not associated with these absorption systems. However, this work does not search for all galaxies outside the selection window and does not attempt to quantifying the Mg ii absorption covering fraction and metal mass budget around the EIGER galaxies. A complete “galaxy centric” analysis of the CGM of the full EIGER survey will be presented in a future work.
3.2 Emission line measurement and SED fitting
We follow the procedure introduced in Matthee et al. (2023a) to measure the emission line flux of the strongest lines in a galaxy spectrum (e.g., H-, He-, [OIII]) from the grism emission line observations, which is summarized as follows. We start with the 2D emission line spectra (Top panels, Figure 1), and select a spectral region within Å of the emission line of interest in the rest frame. We collapse this emission line in the spectral direction and fit the spatial profile with single or multiple Gaussian profiles. This spatial profile is used to optimally extract an 1D continuum filtered spectrum for the galaxy. We follow Matthee et al. (2023a) and re-scale the noise levels of the 2D emission line spectrum, by evaluating the standard deviation of empty sky pixels and setting it equal to the mean noise level of our 1D spectrum. This procedure is performed independently on each module. Figure 1 bottom panels show the three representative optimally extracted 1D spectra of galaxies at 2.3, 4.2 and 6.3, respectively. The strong emission line features in each spectrum are marked.
We use these optimally extracted 1D spectra to fit the emission lines of interest. We fit the emission lines with Gaussian profiles (between 1 and 3, depending on complexity) and measure their total line flux.
These line fluxes are used to perform spectral energy distribution (SED) fits, along with the photometric data at the spectroscopic redshift of the galaxy. We use broad-band photometry from three HST (F6060W, F776W, F850LP) and three JWST (F115W, F200W, F356W) images (see Section 2.2, 2.3). We use the SED fitting code prospector (Johnson et al., 2021) to perform fits to these six photometric measurements along with F356W grism line fluxes. Following Matthee et al. (2023a), we assume a 5% error on the spectro-photometric calibration of the observations. Prospector fits model the total stellar mass, gas-phase and stellar metallicity, the star-formation history of the galaxy, dust attenuation and the ionization parameter. We assume a Chabrier (2003) initial mass function (IMF) and use the MIST isochrone models (Dotter, 2016; Choi et al., 2016). We use a delayed- star-formation history model, and apply a dust attenuation correction following Calzetti et al. (2000).
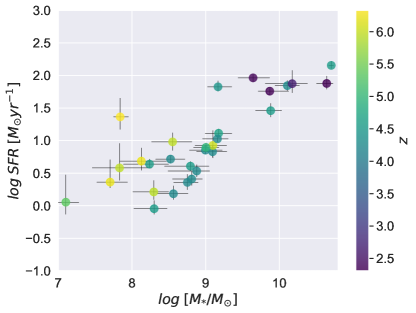
Figure 3, shows the stellar mass and star-formation rate (SFR) estimates for these galaxies from the SED fits. Each circle represents a galaxy and is color coded as a function of their spectroscopic redshifts. The estimated stellar masses span four decades in range (, and almost two dex in star-formation rate estimates. Most of the high- () galaxies are of lower stellar mass ().
We estimate the halo mass of the galaxies using the abundance matching relation from Behroozi et al. (2019). In this work, we quantify the virial radius of a galaxy as , the radius at which the halo mass density is 200 times the critical density of the Universe. We write it as
| (1) |
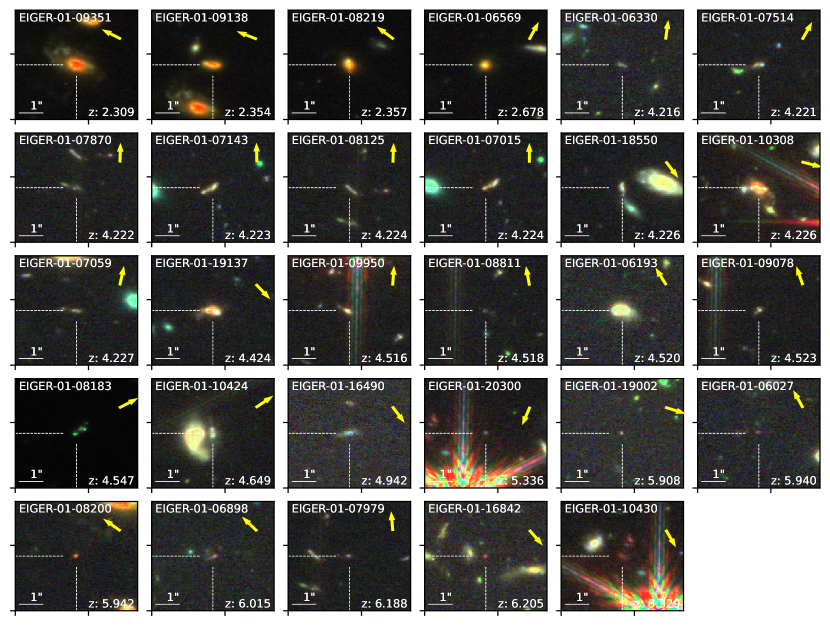
where is the halo mass, is the universal constant of gravitation and is the Hubble parameter at the redshift of interest. The uncertainty on stellar mass and abundance matching relations are propagated through to halo mass and virial radii estimates. The measurements are within 5% of estimates derived from Bryan & Norman 1998, well within the uncertainty of the estimates. The galaxy properties are presented in Table 3. We create false color JWST/NIRCam (F115W, F200W, F356W) rgb images of each galaxy presented in this work. Each image is a stamp and is presented in Figure 4.
3.3 Absorption line measurements
We visually inspect the spectra of the quasar J0100 obtained from FIRE, X-shooter and HIRES instruments and search for intervening absorption line systems. We use a python-based API from the rbcodes package (Bordoloi et al., 2022a) to identify and tabulate these systems. Along the J0100+2802 quasar line of sight, 22 unique intervening absorption line systems are identified within . These lines include strong absorption systems traced by Al ii, Al iii, C ii, C iv, Fe ii, Mg ii, Mg i, O i, Si ii, Si iv transitions. Among these, there are 16 unique Mg ii absorption systems between . We compute the rest frame Mg ii equivalent width detection limit (3- detection threshold) per two resolution elements for both the XShooter and FIRE spectrum of J0100+2802, respectively. The mean 3- detection threshold for XShooter and FIRE spectra are 11 mÅ and 18 mÅ, respectively. The 50% equivalent width completeness limit, computed as the median 3 detection threshold per two resolution elements within different redshift bins are presented in Table 2.
| Redshift bins | FIRE | XShooter |
|---|---|---|
| 2.3–3.8 | 14 | 8 |
| 3.8–5.5 | 10 | 5 |
| 5.8–6.4 | 14 | 13 |
In this paper we will focus primarily on the hosts of Mg ii absorption line systems within the redshift windows of , , and (see Figure 2). This redshift range corresponds to the observer frame wavelength range with optical galaxy emission lines covered by EIGER NIRCam/grism spectroscopy. We use a semi-automated framework to measure the absorption line strengths and kinematics associated with each identified foreground galaxy as follows: we first shift the reduced final quasar spectrum to the rest-frame of the foreground galaxy, using the spectroscopic redshift of the galaxy as described in the previous section. We focus on the common atomic absorption lines at predictable observed frame wavelength ranges. We quantify a detected absorption system to be associated with a host galaxy if it is within 300 physical kpc of the J0100+2802 quasar sightline and within 400 of the systemic redshift of the galaxy. Our emission line search criterion (galaxy emission line SNR per module), can detect galaxies at 7.1 (Figure 3). However, it is possible that some faint emission line galaxies are missed in this search. We adopt a conservative approach and only focus on the reliably detected emission line galaxies in this work. The search for fainter (lower SNR) emission line galaxies would be carried out in a future work incorporating all the six quasar fields of the EIGER survey (Bordoloi et al. in prep).
We extract short slices of quasar spectra around 600 of the systemic redshift of the galaxy, for each line of interest. These lines include Mg ii, Fe ii, C IV, Si IV etc. We continuum normalize each slice using a multi-ordered Legendre polynomial and measure the rest frame equivalent width and apparent optical depth (AOD) column density of each transition. We visually inspect each transition to confirm its presence, and set the velocity range for AOD column density integration. We use the identified absorption line list to minimize contamination from other intervening absorption line systems, and when setting the velocity integration range. We attempt to identify every detection feature within 600 of the lines of interest. Most such features are not associated with the Mg ii host galaxy and are positively identified to be associated with other intervening absorption line systems. We pay particular attention to the identified Mg ii absorption doublet and ensure that the AOD ratios between the doublet range from 2:1 to 1:1 and require that the Mg ii absorption profiles are aligned within 200 from other detected metal absorption lines in that system.
Additionally, we fit Voigt profiles to both the Mg ii absorption doublet, to quantify the kinematic component structure and to estimate column densities for severely blended lines. This is a crucial step, as the Voigt profile fitting improves on the AOD column density measurement using information about line shape, and location to constrain the fit. Further, for several saturated Mg ii absorption features line saturation is taken into account as the line spread function is accounted for in these fits.
We use a python-based Bayesian Markov chain Monte Carlo (MCMC) Voigt profile fitting toolbox rbvfit (Bordoloi et al., 2023) to perform simultaneous fits to the Mg ii absorption doublet. This approach fits column density (), Doppler parameter and velocity offset for each component simultaneously for each Mg ii doublet. We assume flat priors on each of these parameters with reasonable physical bounds. The number of components and the initial guess of the velocity offsets are obtained via visual inspection of the data. The fitting procedure generates posterior distributions for the model parameters. We chose the median of each distribution as the best fit model parameters and the 16th and 84th percentile as the upper and lower bounds on the best fit parameters. One advantage of using a Bayesian MCMC approach over a frequentist -squared minimization approach is that our approach yields marginalized posterior distribution of fitted parameters. This results in accurate column density estimates, even if simultaneously the Doppler parameters are not well constrained in moderate resolution spectrum used in this work. The Mg ii absorption systems presented in this work, and the best fit Voigt profile parameters are reported in Table 4, and Figure 7.

4 Results
In this section we present the variation of Mg ii absorption strength with galaxy properties, their radial profiles, and the absorber kinematics.
4.1 Distribution of Mg ii absorption around galaxies
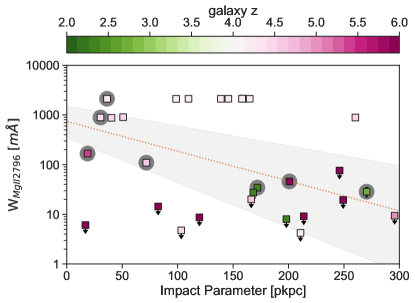
We first characterize the spatial extent of Mg ii absorption around the EIGER galaxies. We examine how the Mg ii rest frame equivalent width () varies as a function of impact parameter () and the normalized virial radius () around the EIGER galaxies. Figure 5 shows the 1-D Mg ii radial absorption profile around 29 galaxies as function of (left panel) and (right panel), respectively. Seven unique Mg ii absorption system associated with host galaxies are detected and the galaxy at the closest impact parameter to the absorber is assigned as the host galaxy (gray circles). No absorption is detected around 12 galaxies and are marked with downward arrows. These measurements show the 2- limit on non-detection. Seven galaxies associated with non-detection are at kpc, suggesting that Mg ii absorption is patchy at . All galaxies are color coded as a function of their redshifts. In particular, for Mg ii absorption systems at 4, multiple galaxies are detected within 400 of the absorber redshift. All these associated galaxies are also presented in Figure 5. We will discuss the environment of Mg ii absorbers in the next Section. The error bar on x-axis (right panel) denotes the uncertainty on estimates.
Focusing on the closest galaxy (gray circles), two immediate observations stand out in Figure 5, left panel. The strongest absorbers are detected at close impact parameters ( 100 kpc) of their host galaxies. Further, there are several absorbers detected at high impact parameters ( 150 kpc). These absorbers are at the outer edge of the radial profile for Mg ii absorption systems observed at 2 (gray shaded region, Dutta et al. 2021). However, this trend is not taking into consideration that these galaxies all have different masses and virial radii, or the possibility that even fainter galaxies below our detection limit exist at closer distances.
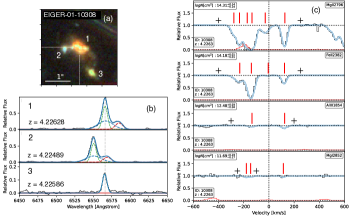
False-color JWST/NIRCam F115W/F200W/F356W broad band images of each galaxy is presented in Figure 4. Individual galaxies exhibit diverse morphology. Galaxies at , typically show well-formed disks and prominent inner bulge. Most of the galaxies exhibit complex morphology, with several of them exhibiting tidally disturbed features and several individual knots indicating either merger or discrete star-formation events along the galaxy disk. In particular, the stamp of galaxy EIGER-01-10308 stands out (Figure 4) as a merging galaxy with tidal streams clearly visible within 2 arcsec of the galaxy. This galaxy is associated with the strongest Mg ii absorption system reported in this work (Appendix A.1), and we discuss this system in detail in the next section.
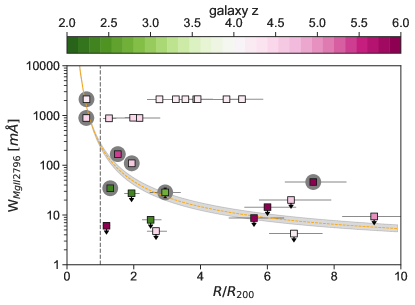
As a fraction of their inferred virial radii (Figure 5, right panel), most Mg ii absorption extends out to 2-3 of the host galaxies. This spatial extent is much larger than typically observed around galaxies at (Chen et al., 2010; Bordoloi et al., 2011; Churchill et al., 2013; Nielsen et al., 2013; Werk et al., 2013). Mg ii absorption strength also show a steep decline with . We quantify this radial fall off, by considering only the closest galaxies with detected Mg ii absorption, and fit a power law: . The best fit power law with 68% confidence interval is presented as the dashed line with gray shaded region in Figure 5, right panel). When non-detections are included in the fit, the radial profile becomes slightly steeper but not too different than the previous fit (). We note that % (5/7) of the Mg ii absorbers are detected outside the inferred virial radii of the host galaxies.
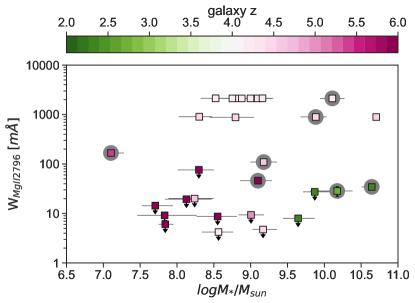
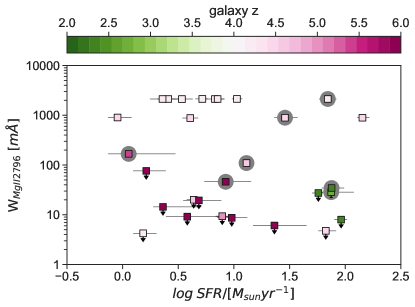
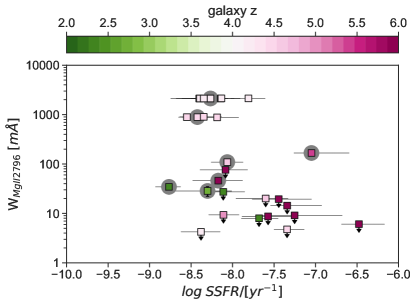
Figure 6 presents the variation of Mg ii absorption as a function of stellar mass (top left panel), SFR (top right panel) and specific star-formation rate (sSFR; bottom panel) respectively. The symbols are color coded to be consistent with Figure 5. We note that 86% (6/7) of the detected Mg ii absorption systems are associated with higher stellar mass galaxies (), with strongest absorption systems associated with the highest stellar mass systems. The two highest redshift Mg ii absorption systems are associated with lower mass 7.1 () and 9.1 () galaxies, respectively. Further, the strongest Mg ii absorption systems are associated with galaxies with the highest SFR. These results tentatively suggest a correlation between the absorption strength of these strong high- Mg ii absorption systems and star-formation activity in their host galaxies, similar to what is observed for strong Mg ii absorption at galaxies (Bordoloi et al., 2011). However, the variation of Mg ii absorption with sSFR of the host galaxies (Figure 6; bottom panel) doesn’t show a strong trend with increasing sSFR. Although the strongest Mg ii absorption is detected around the most massive and vigorously star-forming galaxies; these are not the galaxies with the highest sSFR in this sample. This suggests that within this highly star-forming galaxy sample; galaxies with higher stellar masses host the strongest Mg ii absorption. We add the caveat that the sample presented in this work, exclusively consist of high-star forming galaxies (). Therefore, detailed comparison of galaxy sSFR and CGM absorption would require a sample of galaxies with . This will be explored in a future work with the once the full EIGER survey is complete (Bordoloi et al. in prep). A unique facet of these high- Mg ii absorption systems is that majority of them are beyond the inferred virial radii of their host galaxies. At these distances the Mg ii absorbing gas may not be bound to the gravitational potential of their host galaxies. We explore this in the next section.
4.2 CGM kinematics and environments at high-z
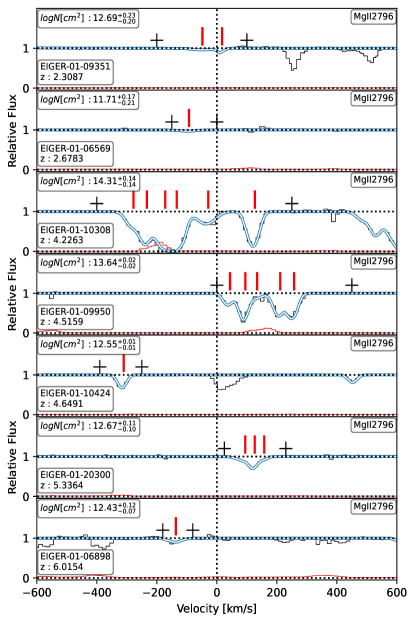
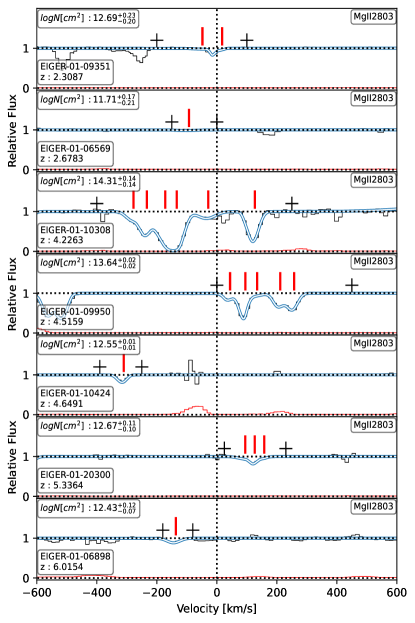
In this section we focus on the kinematics and environment of the seven observed Mg ii absorption profiles and discuss whether the observed absorption profiles are consistent with being bound to the dark matter halo of the host galaxies. We obtain the Mg ii column densities and the best fit Voigt profiles as described in Section 3.3. Figure 7 shows the best fit absorption profiles for both Mg ii transitions. Different panels show Mg ii absorption associated with each system. The vertical red ticks mark the position of individual Voigt profile components. We use these components to quantify the velocity distribution of the Mg ii absorption systems.
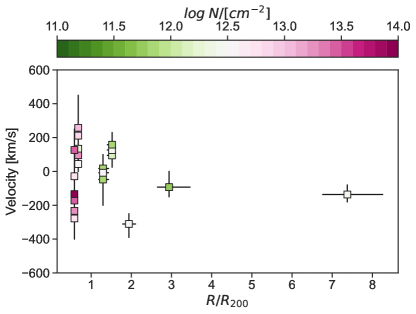
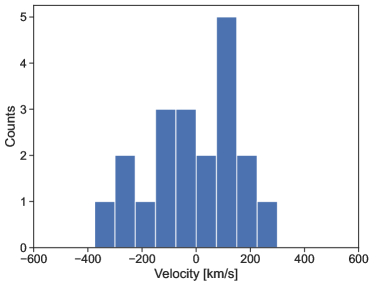
Figure 8, left panel shows the velocity centroids of individual Voigt profile fitted Mg ii absorption components as a function of from their respective host galaxies. The symbols are color coded to show the Mg ii column density of each component. The vertical range bars show the velocity range over which the equivalent width of the system is calculated. They are effectively the full width at zero optical depth of each Mg ii absorption system. Both the thermal and bulk motion associated with the Mg ii absorption systems are incorporated within the full velocity widths and therefore represents the maximum projected velocity of the absorption systems. The horizontal range bars represent the uncertainty in estimating . Figure 8, right panel shows the distribution of Mg ii absorption components relative to the host galaxy redshift. The distribution of absorption components show a large velocity spread from -400 to 300 . The absorption component velocities are offset from the systemic zero velocities with a median absolute velocity of 135 and a standard deviation of 85 , respectively. This is different than what is observed at the CGM of low- galaxies, where most of the CGM absorption systems cluster around the systemic zero velocity of their host galaxies and their velocities are almost always consistent with being less than the associated virial velocities (Tumlinson et al., 2013; Bordoloi et al., 2014c; Huang et al., 2016).
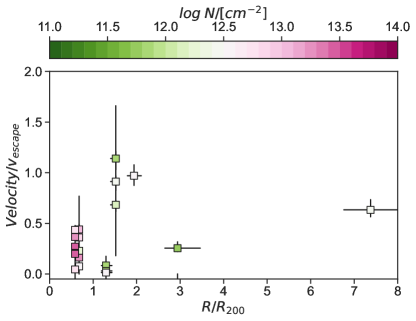
We further investigate if the Mg ii absorption detected around EIGER galaxies are consistent with being bound to the dark matter halos of the host galaxies in Figure 9. We present the Mg ii absorption component velocities normalized to the escape velocity associated with the host galaxy at that impact parameter as a function of . The horizontal error bars represent the uncertainty associated with the inferred . The vertical range bars denote the velocity range over which equivalent width of the system is calculated (normalized to the escape velocity of the system). It is clearly seen that 5 out of 7 Mg ii absorption systems are detected at . Two absorption components have velocities higher than the projected escape velocities of these systems. This suggests that these absorption systems are not consistent with being bound to the dark matter halos of the host galaxies. Only two absorption systems (galaxies: EIGER-01-10308, EIGER-01-09950) are at , and their component velocities are less than escape velocities associated at these impact parameters. Only these two systems are consistent with being bound to the dark matter halo of their host galaxies. These two systems are also associated with higher galaxy over-densities around them (Figure 10). Looking at both the absorption component kinematics and the distribution of these absorption systems, we conclude that the CGM kinematics at high- is significantly different than what is observed at . At low- bulk of the CGM absorption systems are consistent with being bound to the dark matter halos of their host galaxies, unlike the CGM of EIGER galaxies. This suggests an evolution in CGM gas kinematics as a galaxy evolves from early Universe to today. In the early Universe, the CGM gas could easily escape from individual galaxy halos and chemically enrich the IGM around galaxies. But as the galaxies became larger at low-, the CGM becomes increasingly bound to the host galaxies.
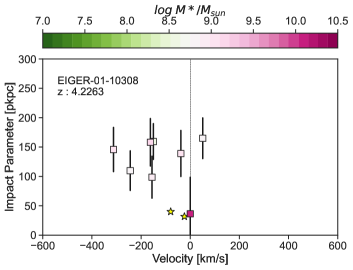
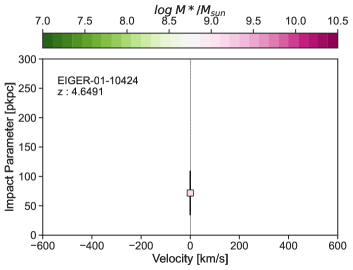
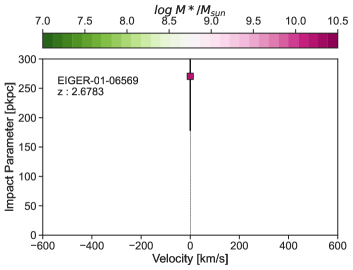
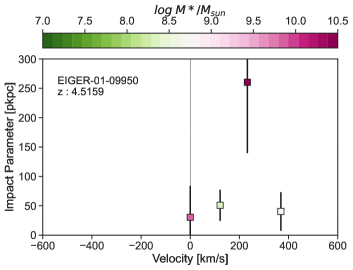
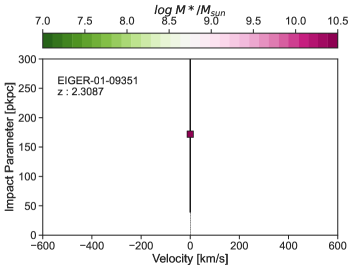
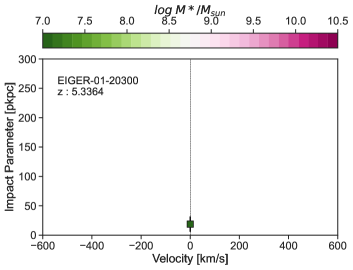
We finally explore the environment around the seven EIGER CGM host galaxies and quantify if these are isolated host galaxies or if they have companion galaxies. Figure 10 show the impact parameter to each galaxy at the systemic redshift of the galaxy noted in each panel. We plot all galaxies within 300 kpc from the J0100+2802 sightline, and within 600 of the host galaxies. Each galaxy is color coded as a function of its stellar mass. The vertical range bars show the associated of each galaxy. We describe the environment of each system below.
EIGER-01-10308: This galaxy at 4.22, is a tidally disturbed merging system. The tidal streams and different components of the merger can be clearly seen in high-resolution JWST imaging (Appendix A.1, panel a). The merging system has an integrated stellar mass of 10.17, and a SFR 70 . We extract individual NIRCam spectra of the two smaller merging components (Appendix A.1, panel b) and compute their individual redshifts. These two components are at -23 and -80 from the main galaxy, respectively. These individual components are marked as gold stars in Figure 10, top left panel. The galaxy EIGER-01-10308 resides in a local over-density and there are seven additional galaxies within 200 kpc from the quasar sightline. The galaxies are within 220 kpc of each other and have a velocity dispersion of 228 . This large over-density of galaxies at close physical and kinematic separation may be part of a proto-group at 4.2234. The additional seven galaxies are at higher impact parameter than EIGER-01-10308 and at . The Mg ii absorption associated with EIGER-01-10308 show complex kinematics with six distinct individual absorption components identified with a velocity spread of 500 (Figure 7). Absorption is also detected in Fe ii, Mg i, Al iii and Si ii transitions (Appendix A.1, panel c). The galaxy is at low impact parameter with and the velocity of the absorption components are less than the escape velocity associated at this impact parameter. This system is one of the two absorption systems in this work, that has Mg ii absorption kinematics consistent with being bound to the dark matter halo of the host galaxy.
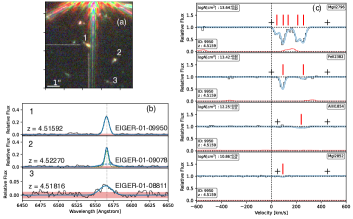
EIGER-01-09950: At 4.5, there are three additional galaxies within 300 kpc of this galaxy (Appendix A.2). The galaxy EIGER-01-09950 has a stellar mass of 9.88, and a SFR 29 , respectively. There are two other galaxies at very close kinematic separations: EIGER-01-09078 at a separation of 16 kpc from EIGER-01-09950 and a velocity offset of 368 , and galaxy EIGER-01-08811, at a separation of 22 kpc from EIGER-01-09950 and a velocity offset of 122 . Both galaxies EIGER-01-09078 and EIGER-01-08811 are 40 and 50 kpc away from the quasar sightline J0100+2802. A third more massive galaxy (EIGER-01-06193) is detected at 235 kpc away from EIGER-01-09950 and at a velocity separation of 232 . Galaxy EIGER-01-06193 is at an impact parameter of 260 kpc from the quasar sightline J0100+2802. These galaxies all lie close to each other (within 232 kpc and 166 ) and could form a proto-group at . The Mg ii absorption profile is again complex for this system (Figure 7), with five identified distinct absorption components. The absorption spans a velocity range of 350 . We also detect absorption in Fe ii, Mg i, Al iii and Si ii transitions in this system (Appendix A.2). The strongest Mg ii absorption component is offset from the systemic redshift galaxy EIGER-01-09950 by 95 , and kinematically lines up with the nearby galaxy EIGER-01-09078. But EIGER-01-09078 has a much lower stellar masses (see Table 3), and the impact parameter to it is higher than the inferred virial radius associated with it (Figure 10). Since the galaxy EIGER-01-09950 is the closest galaxy to the line of sight, and kinematically the projected Mg ii velocity is lower than the escape velocity of the host galaxy, we conclude that the Mg ii absorption is consistent with being bound to the dark matter halo of the host galaxy.
EIGER-01-10424: At 4.64, a faint galaxy is detected at an impact parameter of 72 kpc from the J0100+2802 quasar line of sight. This galaxy has a stellar mass of 9.18, and a SFR 13 , respectively. The galaxy is next to a bright 1 foreground galaxy detected in Pa- emission (see Figure 4). Ground based MUSE spectrum of the bright foreground galaxy show [OII] emission doublet, confirming it as a low- galaxy. There are two faint emission components detected for the target galaxy, suggesting that it is a merging system at 4.64, however, owing to the position angle of the NIRCam grism spectra, the two components cannot be spatially resolved. We note that since the emission line redshift for this system is estimated from a single H- emission line, it is possible that this emission is associated with the foreground bright galaxy at 1. However, ground based seeing does not allow us to check for [OII] emission associated with the fainter components in the MUSE datacube. The presence of metal absorption and the emission lines in the NIRCam grism spectra has led us to conclude that EIGER-01-10424 is the host galaxy for Mg ii absorption detected at 4.6. This system only shows weak Mg ii absorption doublet, kinematically offset from the host galaxy’s systemic redshift by -350 (Figure 7), and beyond the inferred virial radius of the host galaxy (Figure 10). We therefore conclude that the CGM absorption is not consistent with being bound to the host galaxy.
Galaxies EIGER-01-06898, EIGER-01-20300: These galaxies are associated with Mg ii absorption at 6.015 and 5.33, respectively. EIGER-01-06898 is at an impact parameter of 201 kpc and has a stellar mass of 9.1, and a SFR 8.4 , respectively. EIGER-01-20300 is at an impact parameter of 19 kpc and has a stellar mass of 7.1, and a SFR 1.1 , respectively. Both these galaxies are “isolated”, in the sense that no companion galaxy within 600 and 300 kpc of them is detected. Both galaxies are at an impact parameter beyond the radii of their host galaxies (Figure 10). For EIGER-01-06898, we detect Mg ii and C iv absorption offset from the systemic redshift of the galaxy by -136 . Around EIGER-01-20300, we detect Mg ii, C iv, Si iv and Si ii absorption, kinematically offset from the systemic redshift of the host galaxy by 120 . We will report and quantify the high-ionization C iv absorption profiles in an upcoming publication (Simcoe et al. in prep). For both these systems, the absorption is kinematically offset from the systemic galaxy redshift and is detected beyond the inferred virial radii of their corresponding host galaxies. We therefore conclude that the Mg ii absorption detected around these galaxies is not bound to the host galaxy’s dark matter halo.
Galaxies EIGER-01-06569, EIGER-01-09351: These two galaxies are associated with Mg ii absorption at 2.67 and 2.31, respectively. The galaxy 6569 is at an impact parameter of 270 kpc and has a stellar mass of 10.17, and a SFR 75 , respectively. EIGER-01-09351 is at an impact parameter of 172 kpc and has a stellar mass of 10.64, and a SFR 75 , respectively. In both these systems, Mg ii absorption doublet is detected as any line with bluer rest frame wavelength will be in the Ly- forest and not observable along this high- quasar sightline. Both these Mg ii systems are weak absorption systems (Figure 7) and are beyond the inferred virial radii of their host galaxies. In both cases, the Mg ii absorption is consistent with not being bound to the dark matter halos of the host galaxies.
In all the detected systems, only two galaxies EIGER-01-10308 and EIGER-01-09950 have associated Mg ii absorption consistent with being bound to the host galaxy dark matter halos. In both cases, there is a galaxy overdensity suggesting that these galaxies reside in two galaxy proto-groups. In all other cases, where no galaxy overdensity is seen, most of the Mg ii absorption is consistent with not being bound to the dark matter halo of their host galaxies. This is significantly different than the cool CGM detected at , where most of the CGM gas is consistent with being bound to their host galaxies.
5 Discussion and Conclusions
The commissioning of JWST has opened a new discovery space to study the circumgalactic medium of high- galaxies. In this work, we present the deep NIR (3.5m) WFSS JWST NIRCam spectroscopic observations of the 6.33 quasar field J0100+2802 from the EIGER survey to characterize the cool CGM (traced by Mg ii absorption) around 29 galaxies. The JWST WFSS spectroscopy is accompanied by deep JWST/NIR and HST/Optical broad band imaging and deep ground based high resolution spectroscopy of the quasar. This work builds on the initial EIGER survey papers that characterized the properties of a large sample of [OIII] emitting galaxies at 5.33–6.93 (Kashino et al., 2023a; Matthee et al., 2023a). Our main conclusions are summarized as follows:
-
•
Using JWST/NIRCam 3.5m grism spectroscopy, we discover 29 galaxies within 300 kpc from the quasar sightline J0100+2802 in three redshift windows , , and , respectively. Accurate spectroscopic redshifts are measured using strong rest frame optical emission lines (e.g., [SIII], He-I 10830, Pa-, H-, H-, [OIII]).
-
•
The galaxies span a stellar mass range of , and exhibit strong correlation between star-formation rates and stellar mass of the galaxies. All the galaxies presented in this work are star-forming.
-
•
Galaxies identified show a diverse morphology, from tidally disturbed mergers, to well-formed disks. Most of the galaxies show complex morphology of either several clumps or tidally disturbed features.
-
•
We identify the CGM host galaxies of seven Mg ii absorption systems within an impact parameter of 300 kpc. Identifying the closest galaxy to the quasar line of sight as the host, we find that strongest Mg ii absorption is detected at close impact parameters ( kpc). The Mg ii absorption strength drops off as a function of galactocentric radii from the host galaxies, characterized by a power law fall off. This radial fall off is slightly shallower than the Mg ii radial absorption profile observed for galaxies.
-
•
There are 12 galaxies within 300 kpc, for which no Mg ii absorption is detected at a mean detection threshold of 10-20 mÅ. This shows that at high-, cool CGM traced by Mg ii absorption is patchy.
-
•
The Mg ii absorption radial profile normalized to the host galaxy virial radius (), show a steep decline with impact parameter. The radial profile is quantified as a power law fit: . Most of the CGM host galaxies are detected at .
-
•
71% (5/7) of the Mg ii absorption systems are detected outside the virial radii of their host galaxies. Two Mg ii absorption systems are detected within the virial radii of their host galaxies, and both these galaxies reside in local galaxy overdensities.
-
•
86% (6/7) of the Mg ii absorption systems are detected around host galaxies with 9, with strongest absorption systems associated with the highest stellar mass systems. The two Mg ii absorption system are associated with lower mass 7 and 9 galaxies, respectively. Similarly, strongest Mg ii absorption systems are also associated with the most star-forming galaxies.
-
•
The Mg ii absorption kinematics is not symmetrically clustered around the systemic zero velocity of their host galaxies. The absorption components velocities have a large velocity spread (from -400 to 300 ) around the systemic redshift of the host galaxies. The absorption components show a median absolute velocity of 135 and a standard deviation of 85 .
-
•
Five out of the seven Mg ii absorption systems are associated with host galaxies at . Moreover, two absorption components show projected velocities higher than the escape velocity of the host galaxies. We conclude that five out of seven absorption systems have cool CGM gas, consistent with being unbound to their host dark matter halos.
-
•
We highlight the CGM around two particular Mg ii absorption systems ( 4.2 and 4.5) because they are associated with host galaxies at , and with absorption gas kinematics consistent with being bound to the dark matter halos of the host galaxies. Both these 4.22 and 4.5 Mg ii absorption systems exhibit complex kinematics spanning 500 and 350 , respectively.
-
•
The Mg ii absorption system at 4.22 is associated with a morphologically disturbed merging galaxy with three distinct merging components within 80 of each other. This galaxy is within a local galaxy over-density where seven additional galaxies are observed within 200 kpc of the quasar sightline and within 500 of the host galaxy. These galaxies might be part of a galaxy proto-group at 4.22.
-
•
The Mg ii absorption system at 4.5 is associated with a galaxy with two close kinematic companions within 16-22 kpc of the host galaxy. Both these companion galaxies are within velocity separation of 370 from the host galaxy. A third massive companion galaxy is detected 235 kpc from the CGM host galaxy. These galaxies might be part of a galaxy proto-group at 4.5.
-
•
The two strongest and kinematically most complex Mg ii absorption systems (at 4.22 and 4.5) are both part of two local galaxy over-densities. The Mg ii absorption detected in these systems may be part of the intra-group gas associated with these two “proto-group” galaxies at high-.
In summary, we present the first results characterizing the cool CGM around galaxies in the first field of the EIGER survey. We examine CGM hosts of seven Mg ii absorption systems and find that most of the high- Mg ii absorption is not consistent with being bound to the dark matter halos of the host galaxies. This is in contrast to what is seen for CGM of galaxies (Tumlinson et al., 2017). In particular, extensive HST/COS CGM surveys of , L* and sub-L* galaxies show that at low- most of the CGM is kinematically consistent with being bound to their host galaxies. These differences arise owing to a combination of lower gravitational potential of high- galaxies and a much higher Hubble parameter in the earlier Universe. These findings indicate that the galaxies in the early Universe were much more efficient in distributing metals produced in stars out of galaxies and chemically enrich their IGM. Such chemically enriched gas could be deposited to nearby galaxies at a later time, providing fuel for next generation of stars in them.
These observations will enable direct comparison of CGM-galaxy correlation in next generation simulations. Several simulations have looked into statistical properties of metal absorption line systems at high-. These works reproduce the absorber statistics of strong absorption systems but significantly overproduce weak metal absorption systems (Hasan et al., 2020; Finlator et al., 2020; Rahmati et al., 2016), perhaps suggesting that the feedback prescription used in these simulations were too strong at high-. There are tensions between the observed metal absorption line statistics of cool Mg ii gas and those produced in simulations at high- (Keating et al., 2016).
In the TECHNICOLOR DAWN simulation, a correlation between high- absorbers and galaxies within a few hundred physical kpc was found (Finlator et al., 2020; Doughty & Finlator, 2023). A two-point correlation function analysis between metal absorption systems and galaxies show a strong correlation at small impact parameters ( 100 pkpc), that qualitatively trace the Mg ii absorption strength- anti-correlation presented in this work. Interestingly, Doughty & Finlator 2023 find that there is a strong correlation between metal absorber type/strengths with the local galaxy over density than the stellar mass of the host galaxies. Several strong systems in this work are also observed in local overdensities and better statistics is needed to explore these correlations. With new JWST observations providing direct observational constraints on CGM-galaxy correlation, quantitative comparison in future would enable direct constraints on the feedback prescriptions being implemented in these simulations.
These results reinforce the power of JWST/NIRCam grism observations to efficiently conduct high- galaxy spectroscopy campaigns. By combining the high fidelity JWST spectroscopic campaign with deep group based NIR spectroscopy of quasars, we demonstrate an efficient program design to census the cool CGM around high- galaxies in the EIGER survey. In an upcoming paper, we will focus on detailed properties of the CGM of high- O i and C iv absorption systems (Simcoe et al in prep.). We will further extend this work to the full six quasar fields of the EIGER survey (Bordoloi et al in prep) to better quantify the CGM-galaxy correlation in the EIGER survey.
| IDaaGalaxies within 300 kpc of the quasar J0100+2802. | galaxy | galaxy | bbUncertainties listed are line centroiding errors. | ccImpact parameter in physical kpc. | ddVirial radius in kpc. | SFR | eeMg ii rest frame equivalent widths. Limits on are 2. | |
|---|---|---|---|---|---|---|---|---|
| [J2000] | [J2000] | [pkpc] | [pkpc] | [mÅ] | ||||
| EIGER-01-09351 | 01:00:14.38 | 28:02:16.42 | 2.30870.0001 | 171.9 | 10.64 | 133 | 1.88 | 343 |
| EIGER-01-09138 | 01:00:14.28 | 28:02:14.86 | 2.35370.0001 | 168.2 | 9.87 | 87 | 1.76 | 27 |
| EIGER-01-08219 | 01:00:14.72 | 28:02:18.91 | 2.35710.0000 | 198.0 | 9.64 | 79 | 1.96 | 8 |
| EIGER-01-06569 | 01:00:14.31 | 28:02:54.32 | 2.67830.0001 | 270.4 | 10.17 | 92 | 1.87 | 296 |
| EIGER-01-06330 | 01:00:14.76 | 28:02:45.49 | 4.21560.0003 | 210.8 | 8.56 | 31 | 0.18 | 4 |
| EIGER-01-07514 | 01:00:13.80 | 28:02:44.01 | 4.22080.0002 | 145.7 | 9.00 | 38 | 0.85 | 211852 |
| EIGER-01-07870 | 01:00:14.00 | 28:02:34.76 | 4.22200.0003 | 109.8 | 8.75 | 34 | 0.36 | 211952 |
| EIGER-01-07143 | 01:00:14.47 | 28:02:37.92 | 4.22340.0001 | 158.1 | 9.16 | 40 | 1.03 | 212752 |
| EIGER-01-08125 | 01:00:13.89 | 28:02:33.98 | 4.22360.0002 | 98.6 | 8.88 | 36 | 0.53 | 211652 |
| EIGER-01-07015 | 01:00:14.47 | 28:02:38.32 | 4.22370.0004 | 159.4 | 8.52 | 30 | 0.72 | 212953 |
| EIGER-01-18550 | 01:00:11.50 | 28:02:26.27 | 4.22560.0000 | 139.0 | 9.09 | 39 | 0.83 | 211853 |
| EIGER-01-10308 | 01:00:12.71 | 28:02:29.24 | 4.22630.0003 | 36.3 | 10.11 | 62 | 1.84 | 212252 |
| EIGER-01-07059 | 01:00:14.30 | 28:02:42.43 | 4.22720.0006 | 165.0 | 8.81 | 35 | 0.41 | 212152 |
| EIGER-01-19137 | 01:00:11.88 | 28:02:27.81 | 4.42450.0001 | 103.3 | 9.17 | 39 | 1.83 | 5 |
| EIGER-01-09950 | 01:00:13.28 | 28:02:28.54 | 4.51590.0001 | 30.4 | 9.88 | 53 | 1.46 | 89130 |
| EIGER-01-08811 | 01:00:13.53 | 28:02:28.89 | 4.51820.0007 | 50.9 | 8.30 | 26 | -0.05 | 90230 |
| EIGER-01-06193 | 01:00:15.92 | 28:02:28.58 | 4.52020.0003 | 260.3 | 10.70 | 120 | 2.15 | 89030 |
| EIGER-01-09078 | 01:00:13.45 | 28:02:27.48 | 4.52270.0001 | 40.3 | 8.79 | 32 | 0.61 | 87830 |
| EIGER-01-08183 | 01:00:12.91 | 28:02:50.56 | 4.54660.0002 | 166.4 | 8.24 | 25 | 0.64 | 20 |
| EIGER-01-10424 | 01:00:13.07 | 28:02:36.60 | 4.64910.0003 | 71.7 | 9.18 | 37 | 1.11 | 1094 |
| EIGER-01-16490 | 01:00:09.55 | 28:02:26.67 | 4.94220.0005 | 295.7 | 9.00 | 32 | 0.90 | 9 |
| EIGER-01-20300 | 01:00:12.88 | 28:02:23.44 | 5.33640.0021 | 18.8 | 7.10 | 12 | 0.05 | 1673 |
| EIGER-01-19002 | 01:00:10.51 | 28:02:51.33 | 5.90790.0023 | 246.0 | 8.30 | 19 | 0.21 | 76 |
| EIGER-01-06027 | 01:00:15.74 | 28:02:30.31 | 5.94000.0023 | 213.7 | 7.83 | 15 | 0.58 | 9 |
| EIGER-01-08200 | 01:00:14.47 | 28:02:19.32 | 5.94170.0004 | 119.6 | 8.55 | 21 | 0.98 | 9 |
| EIGER-01-06898 | 01:00:15.58 | 28:02:19.91 | 6.01540.0001 | 200.7 | 9.10 | 27 | 0.93 | 466 |
| EIGER-01-07979 | 01:00:13.96 | 28:02:32.78 | 6.18830.0024 | 82.4 | 7.70 | 14 | 0.36 | 14 |
| EIGER-01-16842 | 01:00:09.74 | 28:02:29.50 | 6.20510.0024 | 249.3 | 8.13 | 17 | 0.69 | 19 |
| EIGER-01-10430 | 01:00:12.79 | 28:02:25.55 | 6.32880.0002 | 16.9 | 7.84 | 14 | 1.36 | 6 |
| ID | ||||
|---|---|---|---|---|
| EIGER-01-09351 | 2.3087 | 11.84 | 40 | -48 |
| – | – | 11.81 | 11 | 17 |
| EIGER-01-06569 | 2.6783 | 11.71 | 31 | -93 |
| EIGER-01-10308 | 4.2263 | 12.70 | 20 | -278 |
| – | – | 13.28 | 16 | -233 |
| – | – | 13.48 | 25 | -172 |
| – | – | 14.05 | 22 | -134 |
| – | – | 12.78 | 36 | -29 |
| – | – | 13.50 | 16 | 127 |
| EIGER-01-09950 | 4.5159 | 12.52 | 14 | 44 |
| – | – | 13.29 | 9 | 95 |
| – | – | 12.25 | 27 | 134 |
| – | – | 12.90 | 15 | 211 |
| – | – | 13.04 | 17 | 258 |
| EIGER-01-10424 | 4.6491 | 12.55 | 12 | -310 |
| EIGER-01-20300 | 5.3364 | 12.11 | 25 | 95 |
| – | – | 12.41 | 9 | 126 |
| – | – | 11.87 | 13 | 158 |
| EIGER-01-06898 | 6.0154 | 12.43 | 4 | -136 |
References
- Astropy Collaboration et al. (2013) Astropy Collaboration, Robitaille, T. P., Tollerud, E. J., et al. 2013, A&A, 558, A33, doi: 10.1051/0004-6361/201322068
- Astropy Collaboration et al. (2018) Astropy Collaboration, Price-Whelan, A. M., Sipőcz, B. M., et al. 2018, AJ, 156, 123, doi: 10.3847/1538-3881/aabc4f
- Bañados et al. (2018) Bañados, E., Venemans, B. P., Mazzucchelli, C., et al. 2018, Nature, 553, 473, doi: 10.1038/nature25180
- Becker et al. (2019) Becker, G. D., Pettini, M., Rafelski, M., et al. 2019, ApJ, 883, 163, doi: 10.3847/1538-4357/ab3eb5
- Becker et al. (2001) Becker, R. H., Fan, X., White, R. L., et al. 2001, AJ, 122, 2850, doi: 10.1086/324231
- Behroozi et al. (2019) Behroozi, P., Wechsler, R. H., Hearin, A. P., & Conroy, C. 2019, MNRAS, 488, 3143, doi: 10.1093/mnras/stz1182
- Bertin & Arnouts (1996) Bertin, E., & Arnouts, S. 1996, A&AS, 117, 393, doi: 10.1051/aas:1996164
- Bordoloi et al. (2023) Bordoloi, R., jbhiggi, Manoranjan, S., & Ribaudo, J. 2023, rongmon/rbvfit: rbvfit v0.01, alpha1, Zenodo, doi: 10.5281/zenodo.10403232
- Bordoloi et al. (2014a) Bordoloi, R., Lilly, S. J., Kacprzak, G. G., & Churchill, C. W. 2014a, ApJ, 784, 108, doi: 10.1088/0004-637X/784/2/108
- Bordoloi et al. (2022a) Bordoloi, R., Liu, B., & Clark, S. 2022a, rongmon/rbcodes: rbcodes v0.2, v0.2, Zenodo, doi: 10.5281/zenodo.7226204
- Bordoloi et al. (2018) Bordoloi, R., Prochaska, J. X., Tumlinson, J., et al. 2018, ApJ, 864, 132, doi: 10.3847/1538-4357/aad8ac
- Bordoloi et al. (2011) Bordoloi, R., Lilly, S. J., Knobel, C., et al. 2011, ApJ, 743, 10, doi: 10.1088/0004-637X/743/1/10
- Bordoloi et al. (2014b) Bordoloi, R., Lilly, S. J., Hardmeier, E., et al. 2014b, ApJ, 794, 130, doi: 10.1088/0004-637X/794/2/130
- Bordoloi et al. (2014c) Bordoloi, R., Tumlinson, J., Werk, J. K., et al. 2014c, ApJ, 796, 136, doi: 10.1088/0004-637X/796/2/136
- Bordoloi et al. (2022b) Bordoloi, R., O’Meara, J. M., Sharon, K., et al. 2022b, Nature, 606, 59, doi: 10.1038/s41586-022-04616-1
- Bouché et al. (2012) Bouché, N., Hohensee, W., Vargas, R., et al. 2012, MNRAS, 426, 801, doi: 10.1111/j.1365-2966.2012.21114.x
- Bryan & Norman (1998) Bryan, G. L., & Norman, M. L. 1998, ApJ, 495, 80, doi: 10.1086/305262
- Burchett et al. (2016) Burchett, J. N., Tripp, T. M., Bordoloi, R., et al. 2016, ApJ, 832, 124, doi: 10.3847/0004-637X/832/2/124
- Bushouse et al. (2022a) Bushouse, H., Eisenhamer, J., Dencheva, N., et al. 2022a, JWST Calibration Pipeline, 1.8.2, Zenodo, doi: 10.5281/zenodo.7325378
- Bushouse et al. (2022b) —. 2022b, JWST Calibration Pipeline, 1.7.0, Zenodo, doi: 10.5281/zenodo.7071140
- Calzetti et al. (2000) Calzetti, D., Armus, L., Bohlin, R. C., et al. 2000, ApJ, 533, 682, doi: 10.1086/308692
- Chabrier (2003) Chabrier, G. 2003, PASP, 115, 763, doi: 10.1086/376392
- Chen et al. (2010) Chen, H.-W., Helsby, J. E., Gauthier, J.-R., et al. 2010, ApJ, 714, 1521, doi: 10.1088/0004-637X/714/2/1521
- Chen et al. (2001) Chen, H.-W., Lanzetta, K. M., & Webb, J. K. 2001, ApJ, 556, 158, doi: 10.1086/321537
- Chen et al. (2020) Chen, H.-W., Zahedy, F. S., Boettcher, E., et al. 2020, MNRAS, 497, 498, doi: 10.1093/mnras/staa1773
- Choi et al. (2016) Choi, J., Dotter, A., Conroy, C., et al. 2016, ApJ, 823, 102, doi: 10.3847/0004-637X/823/2/102
- Churchill et al. (2013) Churchill, C. W., Nielsen, N. M., Kacprzak, G. G., & Trujillo-Gomez, S. 2013, ApJ, 763, L42, doi: 10.1088/2041-8205/763/2/L42
- Cooper et al. (2019) Cooper, T. J., Simcoe, R. A., Cooksey, K. L., et al. 2019, ApJ, 882, 77, doi: 10.3847/1538-4357/ab3402
- Davies et al. (2023) Davies, R. L., Ryan-Weber, E., D’Odorico, V., et al. 2023, MNRAS, 521, 289, doi: 10.1093/mnras/stac3662
- Díaz et al. (2021) Díaz, C. G., Ryan-Weber, E. V., Karman, W., et al. 2021, MNRAS, 502, 2645, doi: 10.1093/mnras/staa3129
- Dotter (2016) Dotter, A. 2016, ApJS, 222, 8, doi: 10.3847/0067-0049/222/1/8
- Doughty & Finlator (2023) Doughty, C. C., & Finlator, K. M. 2023, MNRAS, 518, 4159, doi: 10.1093/mnras/stac3342
- Dutta et al. (2021) Dutta, R., Fumagalli, M., Fossati, M., et al. 2021, MNRAS, 508, 4573, doi: 10.1093/mnras/stab2752
- Eilers et al. (2023) Eilers, A.-C., Simcoe, R. A., Yue, M., et al. 2023, ApJ, 950, 68, doi: 10.3847/1538-4357/acd776
- Ferland et al. (2013) Ferland, G. J., Porter, R. L., van Hoof, P. A. M., et al. 2013, Rev. Mexicana Astron. Astrofis., 49, 137. https://arxiv.org/abs/1302.4485
- Finlator et al. (2020) Finlator, K., Doughty, C., Cai, Z., & Díaz, G. 2020, MNRAS, 493, 3223, doi: 10.1093/mnras/staa377
- Ford et al. (2014) Ford, A. B., Davé, R., Oppenheimer, B. D., et al. 2014, MNRAS, 444, 1260, doi: 10.1093/mnras/stu1418
- Gaia Collaboration et al. (2018) Gaia Collaboration, Brown, A. G. A., Vallenari, A., et al. 2018, A&A, 616, A1, doi: 10.1051/0004-6361/201833051
- Galbiati et al. (2023) Galbiati, M., Fumagalli, M., Fossati, M., et al. 2023, arXiv e-prints, arXiv:2302.00021, doi: 10.48550/arXiv.2302.00021
- Hasan et al. (2020) Hasan, F., Churchill, C. W., Stemock, B., et al. 2020, ApJ, 904, 44, doi: 10.3847/1538-4357/abbe0b
- Huang et al. (2016) Huang, Y.-H., Chen, H.-W., Johnson, S. D., & Weiner, B. J. 2016, MNRAS, 455, 1713, doi: 10.1093/mnras/stv2327
- Johnson et al. (2021) Johnson, B. D., Leja, J., Conroy, C., & Speagle, J. S. 2021, ApJS, 254, 22, doi: 10.3847/1538-4365/abef67
- Johnson et al. (2015) Johnson, S. D., Chen, H.-W., & Mulchaey, J. S. 2015, MNRAS, 449, 3263, doi: 10.1093/mnras/stv553
- Johnson et al. (2017) Johnson, S. D., Chen, H.-W., Mulchaey, J. S., Schaye, J., & Straka, L. A. 2017, ApJ, 850, L10, doi: 10.3847/2041-8213/aa9370
- Kacprzak et al. (2012) Kacprzak, G. G., Churchill, C. W., & Nielsen, N. M. 2012, ApJ, 760, L7, doi: 10.1088/2041-8205/760/1/L7
- Kashino et al. (2023a) Kashino, D., Lilly, S. J., Matthee, J., et al. 2023a, ApJ, 950, 66, doi: 10.3847/1538-4357/acc588
- Kashino et al. (2023b) Kashino, D., Lilly, S. J., Simcoe, R. A., et al. 2023b, Nature, 617, 261, doi: 10.1038/s41586-023-05901-3
- Keating et al. (2016) Keating, L. C., Puchwein, E., Haehnelt, M. G., Bird, S., & Bolton, J. S. 2016, MNRAS, 461, 606, doi: 10.1093/mnras/stw1306
- Krist et al. (2011) Krist, J. E., Hook, R. N., & Stoehr, F. 2011, in Society of Photo-Optical Instrumentation Engineers (SPIE) Conference Series, Vol. 8127, Optical Modeling and Performance Predictions V, ed. M. A. Kahan, 81270J, doi: 10.1117/12.892762
- Lan & Mo (2018) Lan, T.-W., & Mo, H. 2018, ApJ, 866, 36, doi: 10.3847/1538-4357/aadc08
- Lehner et al. (2013) Lehner, N., Howk, J. C., Tripp, T. M., et al. 2013, ApJ, 770, 138, doi: 10.1088/0004-637X/770/2/138
- Lehner et al. (2022) Lehner, N., Kopenhafer, C., O’Meara, J. M., et al. 2022, ApJ, 936, 156, doi: 10.3847/1538-4357/ac7400
- Liang & Chen (2014) Liang, C. J., & Chen, H.-W. 2014, MNRAS, 445, 2061, doi: 10.1093/mnras/stu1901
- Lopez et al. (2018) Lopez, S., Tejos, N., Ledoux, C., et al. 2018, Nature, 554, 493, doi: 10.1038/nature25436
- Lundgren et al. (2021) Lundgren, B. F., Creech, S., Brammer, G., et al. 2021, ApJ, 913, 50, doi: 10.3847/1538-4357/abef6a
- Mack et al. (2022) Mack, J., Hack, W., Burger, M., et al. 2022, Improved Absolute Astrometry for ACS and WFC3 Data Products, Instrument Science Report WFC3 2022-06
- Martin et al. (2019) Martin, C. L., Ho, S. H., Kacprzak, G. G., & Churchill, C. W. 2019, ApJ, 878, 84, doi: 10.3847/1538-4357/ab18ac
- Matejek & Simcoe (2012) Matejek, M. S., & Simcoe, R. A. 2012, ApJ, 761, 112, doi: 10.1088/0004-637X/761/2/112
- Matthee et al. (2023a) Matthee, J., Mackenzie, R., Simcoe, R. A., et al. 2023a, ApJ, 950, 67, doi: 10.3847/1538-4357/acc846
- Matthee et al. (2023b) Matthee, J., Naidu, R. P., Brammer, G., et al. 2023b, arXiv e-prints, arXiv:2306.05448, doi: 10.48550/arXiv.2306.05448
- McCabe et al. (2021) McCabe, T., Borthakur, S., Heckman, T., et al. 2021, ApJ, 923, 189, doi: 10.3847/1538-4357/ac283c
- Merlin et al. (2022) Merlin, E., Bonchi, A., Paris, D., et al. 2022, ApJ, 938, L14, doi: 10.3847/2041-8213/ac8f93
- Nielsen et al. (2013) Nielsen, N. M., Churchill, C. W., & Kacprzak, G. G. 2013, ApJ, 776, 115, doi: 10.1088/0004-637X/776/2/115
- Oesch et al. (2023) Oesch, P. A., Brammer, G., Naidu, R. P., et al. 2023, arXiv e-prints, arXiv:2304.02026, doi: 10.48550/arXiv.2304.02026
- Peeples et al. (2014) Peeples, M. S., Werk, J. K., Tumlinson, J., et al. 2014, ApJ, 786, 54, doi: 10.1088/0004-637X/786/1/54
- Péroux & Howk (2020) Péroux, C., & Howk, J. C. 2020, ARA&A, 58, 363, doi: 10.1146/annurev-astro-021820-120014
- Planck Collaboration et al. (2020) Planck Collaboration, Aghanim, N., Akrami, Y., et al. 2020, A&A, 641, A6, doi: 10.1051/0004-6361/201833910
- Prochaska et al. (2020) Prochaska, J., Hennawi, J., Westfall, K., et al. 2020, The Journal of Open Source Software, 5, 2308, doi: 10.21105/joss.02308
- Prochaska et al. (2011) Prochaska, J. X., Weiner, B., Chen, H. W., Mulchaey, J., & Cooksey, K. 2011, ApJ, 740, 91, doi: 10.1088/0004-637X/740/2/91
- Prochaska et al. (2017) Prochaska, J. X., Werk, J. K., Worseck, G., et al. 2017, ApJ, 837, 169, doi: 10.3847/1538-4357/aa6007
- Rahmati et al. (2016) Rahmati, A., Schaye, J., Crain, R. A., et al. 2016, MNRAS, 459, 310, doi: 10.1093/mnras/stw453
- Rauch et al. (1999) Rauch, M., Sargent, W. L. W., & Barlow, T. A. 1999, ApJ, 515, 500, doi: 10.1086/307060
- Rigby et al. (2022) Rigby, J., Perrin, M., McElwain, M., et al. 2022, arXiv e-prints, arXiv:2207.05632, doi: 10.48550/arXiv.2207.05632
- Rubin et al. (2014) Rubin, K. H. R., Prochaska, J. X., Koo, D. C., et al. 2014, ApJ, 794, 156, doi: 10.1088/0004-637X/794/2/156
- Rubin et al. (2018) Rubin, K. H. R., O’Meara, J. M., Cooksey, K. L., et al. 2018, ApJ, 859, 146, doi: 10.3847/1538-4357/aaaeb7
- Rudie et al. (2019) Rudie, G. C., Steidel, C. C., Pettini, M., et al. 2019, ApJ, 885, 61, doi: 10.3847/1538-4357/ab4255
- Rudie et al. (2012) Rudie, G. C., Steidel, C. C., Trainor, R. F., et al. 2012, ApJ, 750, 67, doi: 10.1088/0004-637X/750/1/67
- Simcoe et al. (2012) Simcoe, R. A., Sullivan, P. W., Cooksey, K. L., et al. 2012, Nature, 492, 79, doi: 10.1038/nature11612
- Stocke et al. (2013) Stocke, J. T., Keeney, B. A., Danforth, C. W., et al. 2013, ApJ, 763, 148, doi: 10.1088/0004-637X/763/2/148
- Tumlinson et al. (2017) Tumlinson, J., Peeples, M. S., & Werk, J. K. 2017, ARA&A, 55, 389, doi: 10.1146/annurev-astro-091916-055240
- Tumlinson et al. (2011) Tumlinson, J., Thom, C., Werk, J. K., et al. 2011, Science, 334, 948, doi: 10.1126/science.1209840
- Tumlinson et al. (2013) —. 2013, ApJ, 777, 59, doi: 10.1088/0004-637X/777/1/59
- Wang et al. (2023) Wang, F., Yang, J., Hennawi, J. F., et al. 2023, arXiv e-prints, arXiv:2304.09894, doi: 10.48550/arXiv.2304.09894
- Werk et al. (2013) Werk, J. K., Prochaska, J. X., Thom, C., et al. 2013, ApJS, 204, 17, doi: 10.1088/0067-0049/204/2/17
- Werk et al. (2014) Werk, J. K., Prochaska, J. X., Tumlinson, J., et al. 2014, ApJ, 792, 8, doi: 10.1088/0004-637X/792/1/8
- Williams et al. (2018) Williams, C. C., Curtis-Lake, E., Hainline, K. N., et al. 2018, ApJS, 236, 33, doi: 10.3847/1538-4365/aabcbb
- Wotta et al. (2019) Wotta, C. B., Lehner, N., Howk, J. C., et al. 2019, ApJ, 872, 81, doi: 10.3847/1538-4357/aafb74
- Wu et al. (2021) Wu, Y., Cai, Z., Neeleman, M., et al. 2021, Nature Astronomy, 5, 1110, doi: 10.1038/s41550-021-01471-4
- Yang et al. (2020) Yang, J., Wang, F., Fan, X., et al. 2020, ApJ, 897, L14, doi: 10.3847/2041-8213/ab9c26
- Zhu et al. (2014) Zhu, G., Ménard, B., Bizyaev, D., et al. 2014, MNRAS, 439, 3139, doi: 10.1093/mnras/stu186
In this section we present the JWST false color stamps, NIRCam WFSS spectra and ground based absorption spectroscopy of the Mg ii absorption systems at (Figure A.1) and (Figure A.2), respectively.