Strain, Young’s modulus, and structural transition of \ceEuTiO3 thin films probed by micro-mechanical methods
Abstract
\ceEuTiO3 (ETO) is a well-known complex oxide mainly investigated for its magnetic properties and its incipient ferro-electricity. In this work, we demonstrate the realization of suspended micro-mechanical structures, such as cantilevers and micro-bridges, from 100 nm-thick single-crystal epitaxial ETO films deposited on top of \ceSrTiO3(100) substrates. By combining profile analysis and resonance frequency measurements of these devices, we obtain the Young’s modulus, strain, and strain gradients of the ETO thin films. Moreover, we investigate the ETO anti-ferro-distorsive transition by temperature-dependent characterizations, which show a non-monotonic and hysteretic mechanical response. Comparison between experimental and literature data allows us to weight the contribution from thermal expansion and softening to the tuning slope, while a full understanding of the origin of such a wide hysteresis is still missing. We also discuss the influence of oxygen vacancies on the reported mechanical properties by comparing stoichiometric and oxygen-deficient samples. This is the author’s peer reviewed, accepted manuscript. However, the online version of record will be different from this version once it has been copyedited and typeset. PLEASE CITE THIS ARTICLE AS DOI: 10.1063/5.0166762.
Introduction
EuTiO3 (ETO) is a complex oxide belonging to the titanate family. It is the closest compound to \ceSrTiO3 (STO),[1] which was extensively studied over the last decades and is among the standard substrate materials employed for the deposition of oxide thin films. An interesting aspect of ETO is that it is iso-structural to STO, with almost identical lattice constants.[2] This allows to grow very high quality thin films, having bulk-like characteristics, on top of STO substrates.[3] At room temperature, \ceEuTiO3 has Perovskite crystal structures with cubic lattice and, upon cooling, it undergoes a cubic to tetragonal transition at about 282 K, driven by oxygen octahedra rotation,[4] which is similar to that observed in STO at 105 K.[5] Specific heat and thermal expansion measurements point toward a first-order phase transition, which also affects Young’s modulus temperature dependence.[2, 6] Thanks to its magnetic cation, ETO is also characterized by an anti-ferromagnetic transition at =5.5 K.[7] Moreover, it is an incipient ferroelectric and, despite its negative critical temperature of −175 K forbids the transition to a ferroelectric state, evidences of magneto-dielectric coupling made this compound an interesting candidate as multiferroic material.[8, 9]
In recent years, the possibility to realize prototypical micro-electro-mechanical systems from complex oxides thin films has been demonstrated by taking advantage from selective chemical etching of different oxide compounds.[10, 11, 12, 13, 14] In order to develop this new scientific and technological direction, it is of great interest to increase the number of viable oxide materials by discussing their fabrication protocols and characterizing their mechanical properties. Contrary to STO, ETO is resistant to \ceHF, enabling selective chemical etching to realize suspended structures having desired shape.[15]
In this work, we investigate the mechanical properties of \ceEuTiO3 by fabricating micro-mechanical structures from single crystal thin films deposited on top of STO(100). ETO samples are initially characterized in terms of structural, magnetic, and optical properties and then micro-fabricated into suspended double-clamped bridges and cantilevers. The analysis of their mechanical properties allow us to quantify the ETO built-in strain, strain gradient along the in/out-of-plane directions, and Young’s modulus. Temperature-dependent measurements of the cantilever’s resonance frequency allow us to investigate the ETO anti-ferro-distorsive transition by mechanical methods, which was analyzed taking into account contributions from thermal expansion and Young’s modulus temperature dependence. At last, we discuss how oxygen vacancies, one of the most common doping defect in complex oxides, affect the reported characteristics.
Experimental
EuTiO3 thin films were grown by pulsed laser deposition on top of \ceSrTiO3(100) single-crystal substrates kept at 650 ∘C. We employed a KrF excimer laser (248 nm) with a repetition rate of 4 Hz. The energy density on the target was 1.7 J/cm2, and the distance between the target and the substrate was 50 mm. The growth chamber base pressure was 110-6 mbar and, where not stated differently, the background oxygen pressure during the deposition was 1.510-4 mbar. Thickness measurements are discussed in the Supplementary Material Sec. I. Atomic Force Microscope (AFM) imaging as has been performed by using the Bruker Dimension ICON AFM with Nanoscope 6 controller in tapping mode. Suspended microstructures were fabricated by UV lithography of SPR-220 photo-resist spin-coated at 6000 RPM for 45 s, followed by baking at 120 ∘C for 135 s. ETO was removed by dry etching with an Argon milling system having sample water-cooling. Etching time was 45 mins and Ar ions energy was 500 eV with a current density of 0.2 mA/cm2. Samples cleaning from photo-resist residues required room-temperature ultrasonic baths of acetone followed by ethanol and then dried under nitrogen flow. Selective etching of the STO substrate was obtained by put soaking the samples in a 5 % HF aqueous solution kept at 35 ∘C in bain-marie for 30 mins. During the bath, the samples were kept suspended above a magnetic stirrer rotating at 200 RPM. They are then transferred in a deionized water bath, followed by two different baths of pure ethanol to remove the presence of water. Finally, they are dried in a \ceCO2 critical point dryer system. Mechanical characterizations were performed in a custom setup providing PID-controlled temperature and 210-5 mbar base pressure. When not stated otherwise, the mechanical measurements were performed at the constant temperature of 25 ∘C. All the mechanical spectra were recorded by measuring the thermal noise of the ETO cantilevers in the optical-lever detection scheme. We employed a 670 nm laser focused on top of the structures with an optical power of 60 µW. The reflected light was converted into an electrical signal by a custom four quadrant photo-diode connected to a spectrum analyzer. The reported spectra were typically the result of 8 averages, with a bandwidth depending on the central frequency value starting from 1 Hz when measuring around 13 kHz.
Results
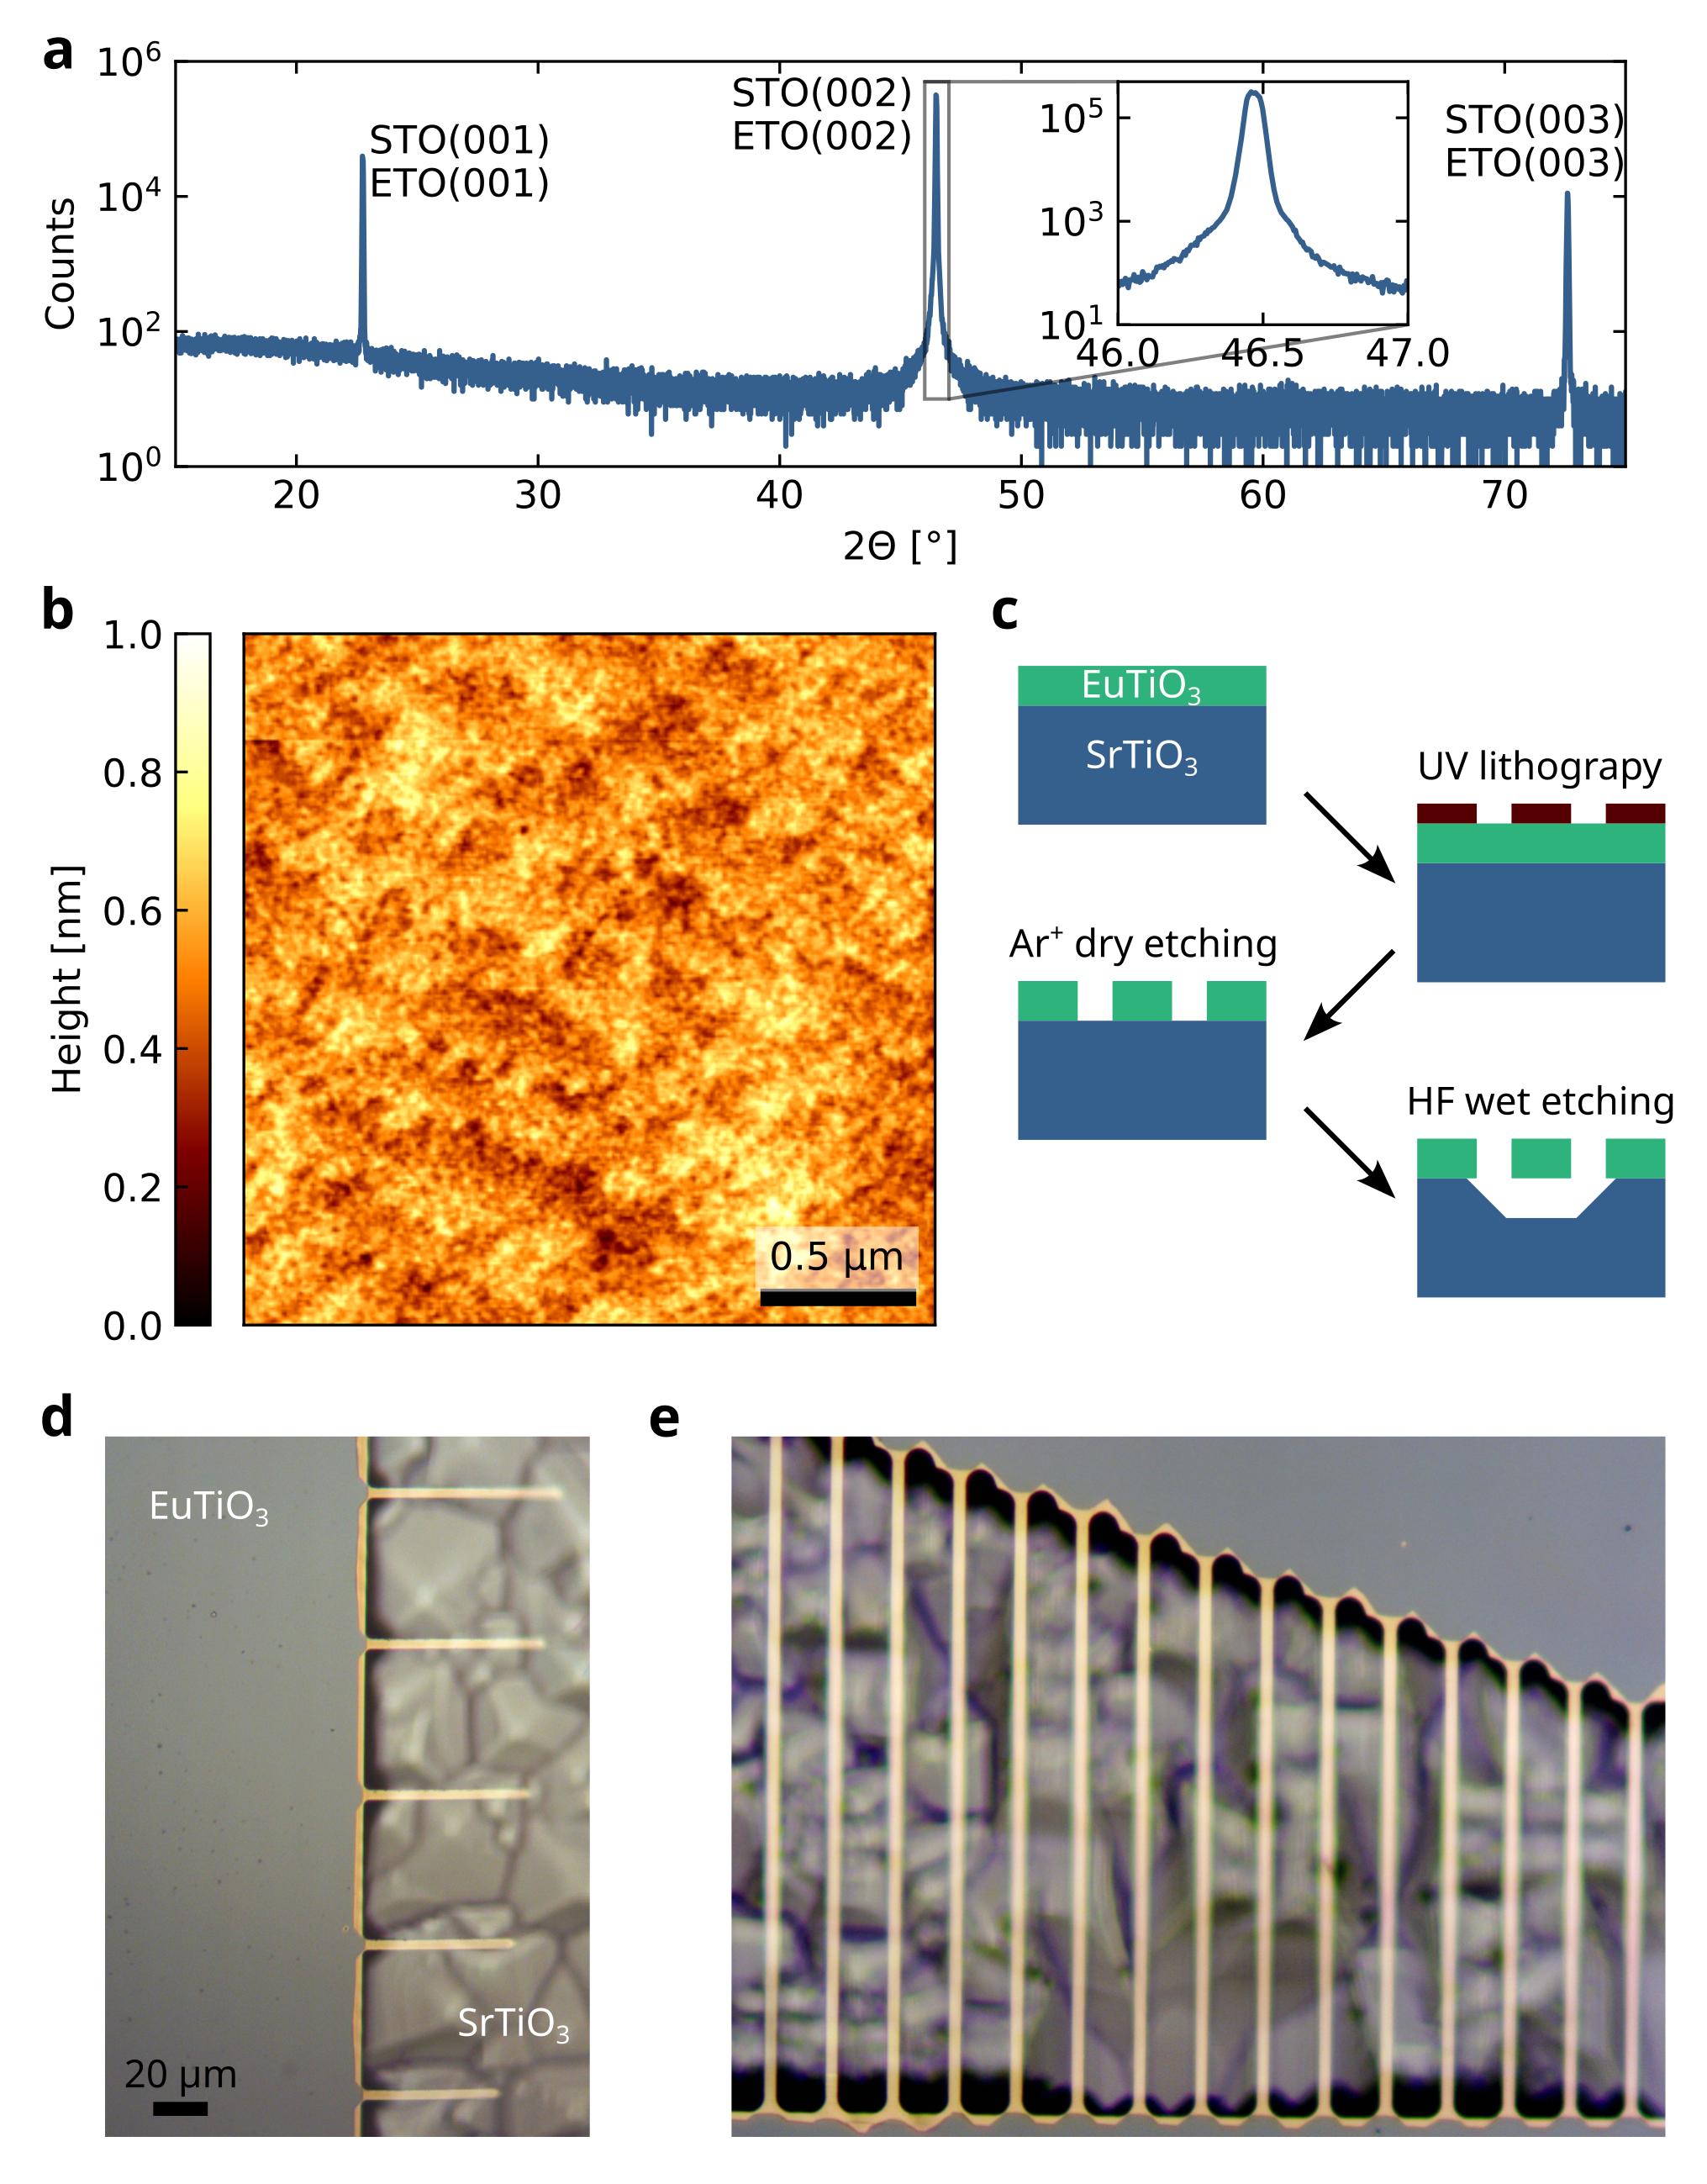
The ETO crystal structure was investigated by X-ray diffraction, and a – scan of a 100 nm-thick film is reported in Fig. 1a. ETO peaks cannot be resolved due to the superposition with those owning to the STO substrate, as further confirmed by reciprocal space maps reported in the Supplementary Material Sec. II. This is in agreement with previous reports of stoichiometric bulk-like ETO films grown in similar conditions.[3] Surface morphology was investigated by atomic force microscopy (AFM), showing very smooth ETO film surface with a RMS roughness of about 0.1 nm over a scan area of 2.52.5 µm2, as shown in Fig. 1b. This is representative of all the samples analyzed in this work, as reported in the Supplementary Material Sec. III. Our fabrication protocol is based on standard UV mask lithography and its main steps are schematically illustrated in Fig. 1c, while details are discussed in the experimental section. ETO film is patterned by Ar ion milling and then cleaned in ultrasound acetone and ethanol baths,while selective etching of the STO substrate is obtained by put soaking the samples in HF diluted at 5% in water. The etching of STO starts out-of-plane, from the exposed regions, and then proceeds removing the substrate below the edges of the ETO film, making the narrower geometries suspended.[15] In about 30 minutes all the structures having width below 5 µm are completely released and ready for the mechanical characterizations.
Examples of the two kind of geometries employed in this work, cantilevers and double-clamped bridges, are shown in Fig. 1d and e, respectively, all having nominal width of 5 µm. In these pictures, clamped ETO is dark/blueish, while all the suspended regions are light/yellowish. The typical pyramids that form on top of the STO(100) substrates after HF etching are visible on the background: these are the regions where ETO was removed by ion milling. The nominal length of the cantilevers spans from 15 to 100 µm. In our samples all the cantilevers up to 60 µm were measurable, while all those above 75 µm were touching the substrate. This relatively sharp threshold is due to the balance between the downward bending of the cantilevers (signaling out-of-plane strain gradient) and the etching depth of the STO substrate, of about 6 µm, making the tip of longer ones to reach the substrate and sticking to that. Touching can be avoided by increasing the wet etching time, but in such a case liquid flow due to stirring may also become a limiting factor by bending and breaking longer structures. Double-clamped micro-bridges, instead, do not easily collapse and were fabricated with length from 100 to 250 µm. As visible in Fig. 1e, their center is out-of-focus due to the relaxation of built-in compressive strain by buckling.
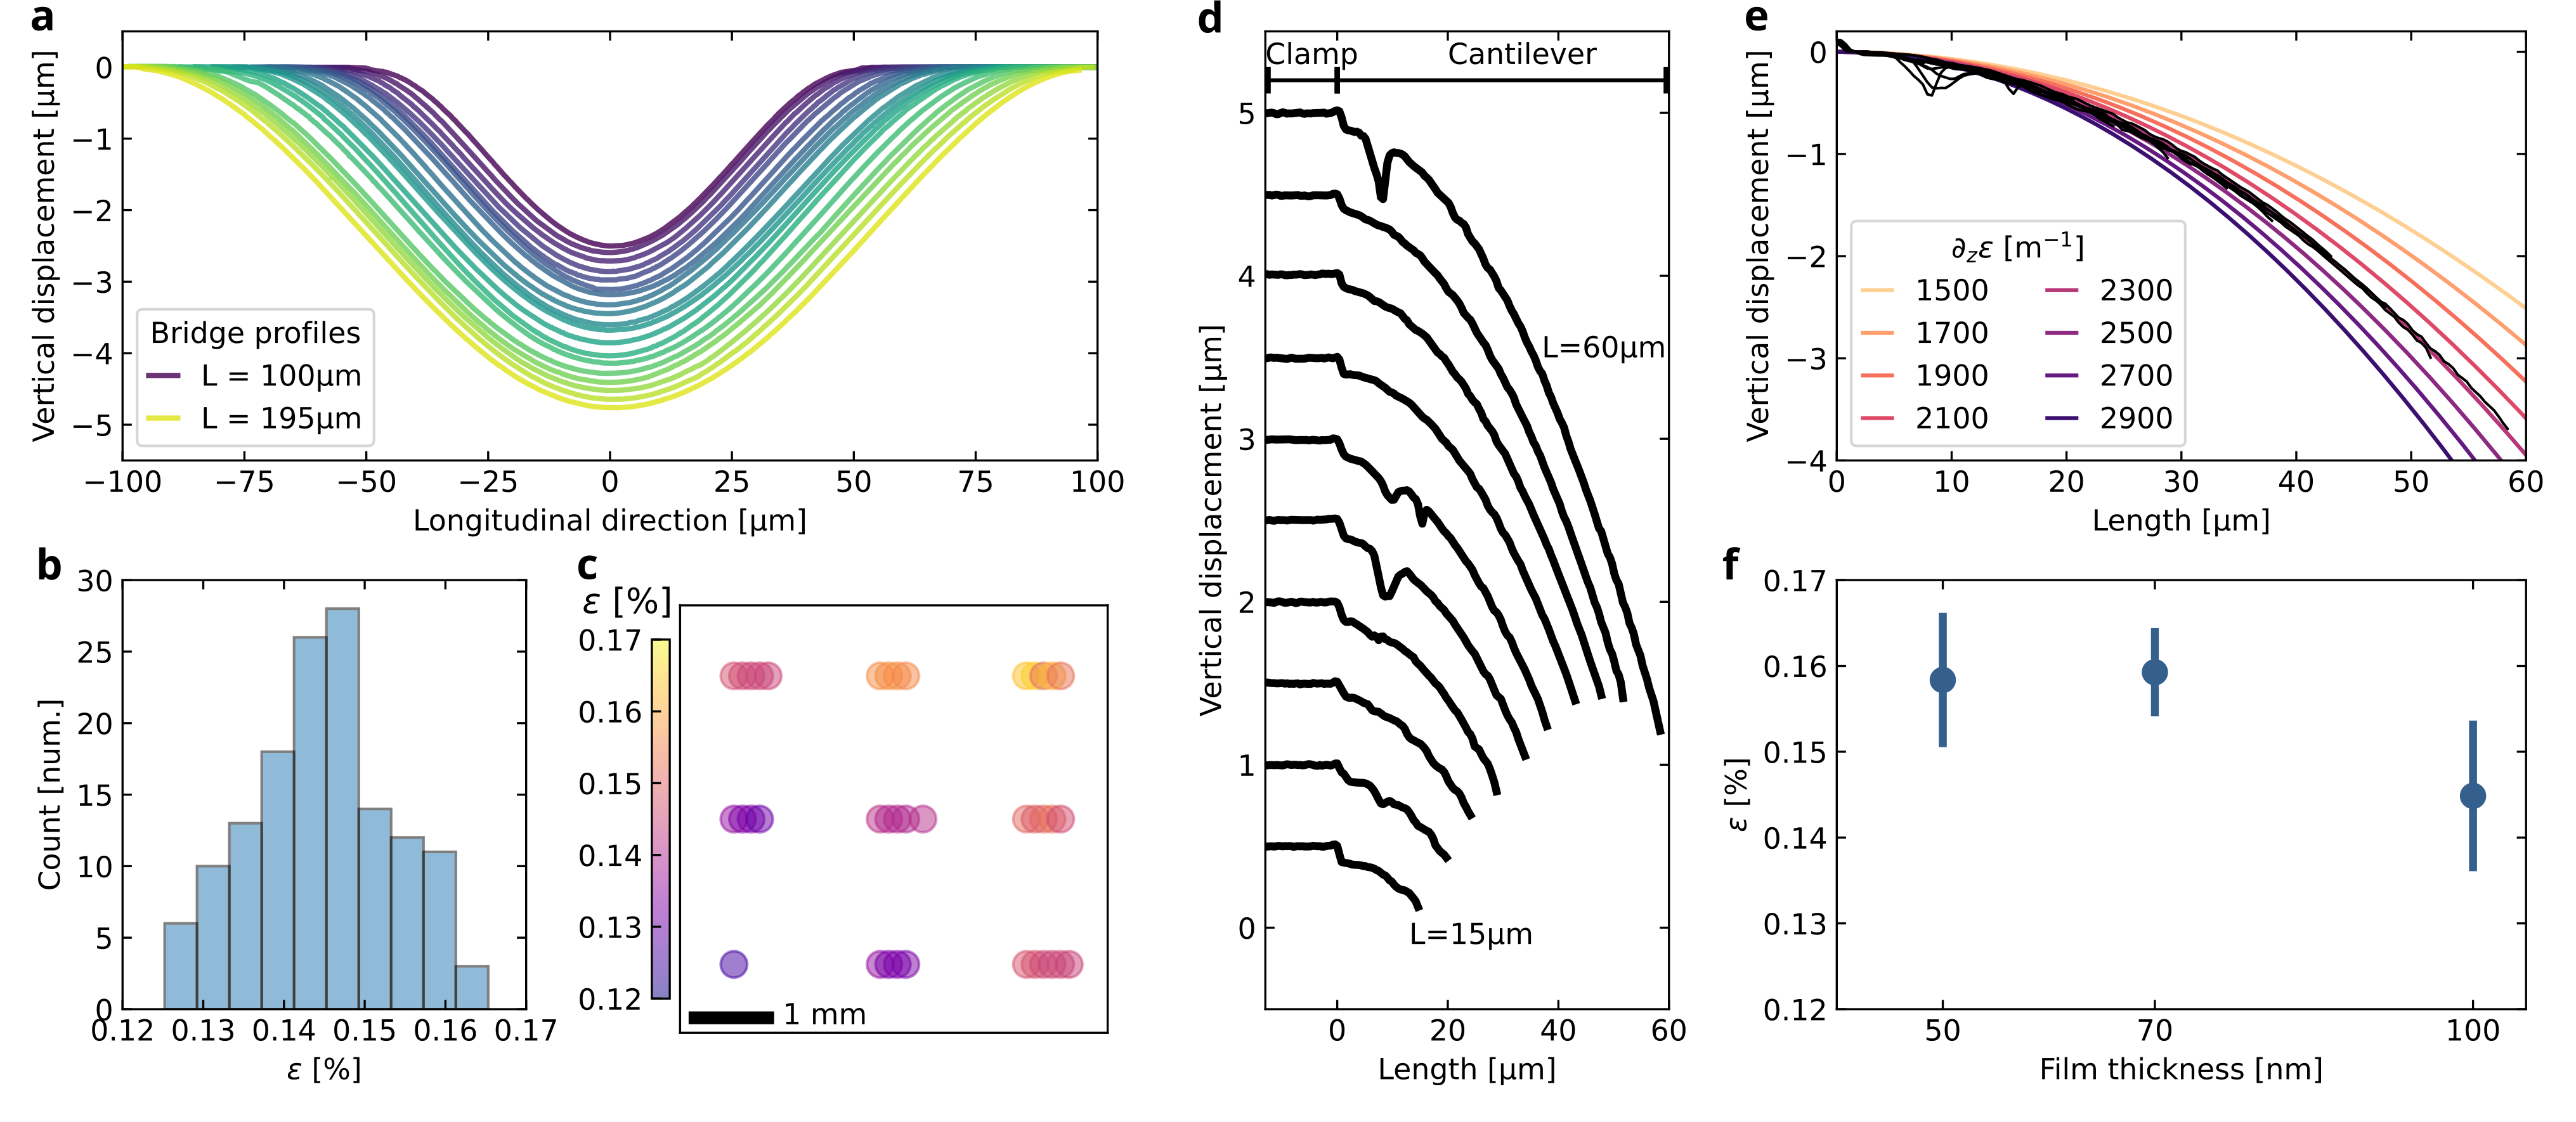
We can quantitatively evaluate the strain of an ETO film from the shape analysis of buckled double-clamped micro-bridges.[14] To do so, we measured the profile of each bridge by using an optical profilometer, which is an interferometric microscope providing an height map of its field of view. An example of the profiles extracted from these maps is reported in Fig. 2a, showing an array of ETO micro-bridges having length between 100 and 195 µm. Notably, they are all bent downwards, which is the most common case in our samples. This could be related to the fabrication process or to strain relaxation at the clamping points. For each individual profile we calculated the best fit of a sum of trigonometric functions. The resulting analytical expression was then employed to obtain the profile length , which was compared to its nominal value to calculate the strain
| (1) |
This analysis is based on the assumption that all the in-plane compressive stress of the bridge is relaxed and converted into strain (elongation) upon the structure release. The Python script implementing the strain analysis is included in the dataset associated to this work, as indicated in the “Open Data” section.
In this study we measured 140 micro-bridges fabricated on two different ETO thin film samples having thickness of of 97 and 100 nm. The calculated strain distribution of the whole dataset is reported in the histogram of Fig. 2b, showing an average strain of = +0.14 % 0.02 %, where the positive sign corresponds to compressive state. The resulting implies an in-plane lattice compression of ETO films of = 0.55 pm. Under elastic deformation this would corresponds to an expansion of the -axis in the out-of-plane direction of 0.85 pm, calculated considering a Poisson’s ratio of 0.22, as obtained from Ref. 16 (see Supplementary Material Sec. IV). Literature reports of ETO pseudo-cubic lattice constants at 300 K indicate values between 3.860 Å and 3.908 Å.[3, 4, 16, 17] Such dispersion is wider than our calculated lattice deformation due to epitaxial growth, making difficult to uniquely correlate the in-plane strain to out-of-plane lattice expansion from XRD data reported in Fig. 1. ETO films grown on top of STO are thus likely at the crossover between tensile and compressive strain, depending on the specific growth condition and crystal defects. Our conclusion is that the measured compressive strain is the result of the formation of thermodynamically stable defects during the growth, such as oxygen vacancies or dislocations.
The width of the strain distribution was found to be related to long-range film inhomogeneities and not to random bridge-to-bridge variations. This is shown in the strain map reported in Fig. 2c, where the black frame represents the edges of the 55 mm2 STO substrate. Each colored circle is located at the real position of a ETO micro-bridge and its color indicates the measured strain value. Strain magnitude increases from the bottom-left to the top-right corner, while bridges close to each other show smaller strain values dispersion. Analysis of strain variation of bridges from the same set, such as those belonging to the same harp structure shown in Fig. 2a, is reported in the Supplementary Material Sec. V. Similar characteristics were already observed in manganite thin films, and likely related to temperature gradients or to small variations of film stoichiometry due to substrate-plume misalignment during the growth.[18]
While double-clamped bridges provide information about in-plane strain, cantilevers do not, because, thanks to their free end, stress is relaxed by elongating the structures and not by buckling. However, cantilevers can be employed to evaluate the strain gradient in the out-of-plane direction (), because it results in vertical bending of the structures due to the different in-plane strain between top and bottom surfaces. Fig. 2d shows a set of profiles owing to cantilevers having length between 15 and 60 µm. Here, the horizontal coordinate was shifted to align at =0 the begin of the suspended regions, while all the profiles were vertically shifted of 0.5 µm for better visibility. The irregularities in the profiles are artifacts of the measurement technique, which fails to reconstruct the shape of these semi-transparent structures where the substrate is close below. All the cantilevers are bent downwards, signaling a positive strain gradient in the vertical direction. Such gradient can be quantitatively evaluated by comparing the measured profiles with what expected from a simple finite element model based on a constant vertical gradient, which is reported in Fig. 2e. Here, the black lines are all the measured profiles of 2d collapsed on top of each other, while the colored lines are profiles calculated for different values of . Best agreement is found for =2300 m-1, with a confidence interval of about 5 %, i.e. one-half of the 200 m-1 line spacing. Since the ETO thickness is =97 nm, the resulting in-plane strain difference between the bottom and top surface is ==0.023 %, which is about 6 times smaller than the average in-plane strain.
To further understand the characteristics of strain and strain relaxation in ETO thin films, we grew films having different thicknesses and measured their average in-plane strain from the profile analysis of buckled micro-bridges. Apparently, thinner films have a slightly higher compressive strain, as can be seen in Fig. 2f. From this comparison we conclude that strain relaxation does not evolve layer-by-layer during the growth, otherwise we would observe an increase of strain value for thicker structures due to the positive gradient. It is instead a global characteristics of the crystal which likely evolves across its whole thickness as long as the growth process continues, at least for the explored film thickness range.
Even if slightly bent out-of-plane, micro-cantilevers can be employed as mechanical resonators to obtain the Young’s modulus of the ETO film.[19] The resonance frequency can be calculated by using Euler-Bernoulli theory assuming a linear elastic material and small deflections. The resonance frequency of the flexural modes () of our cantilevers are modeled assuming thin and long beams having width much greater than their thickness (plate approximationq).[20]
| (2) |
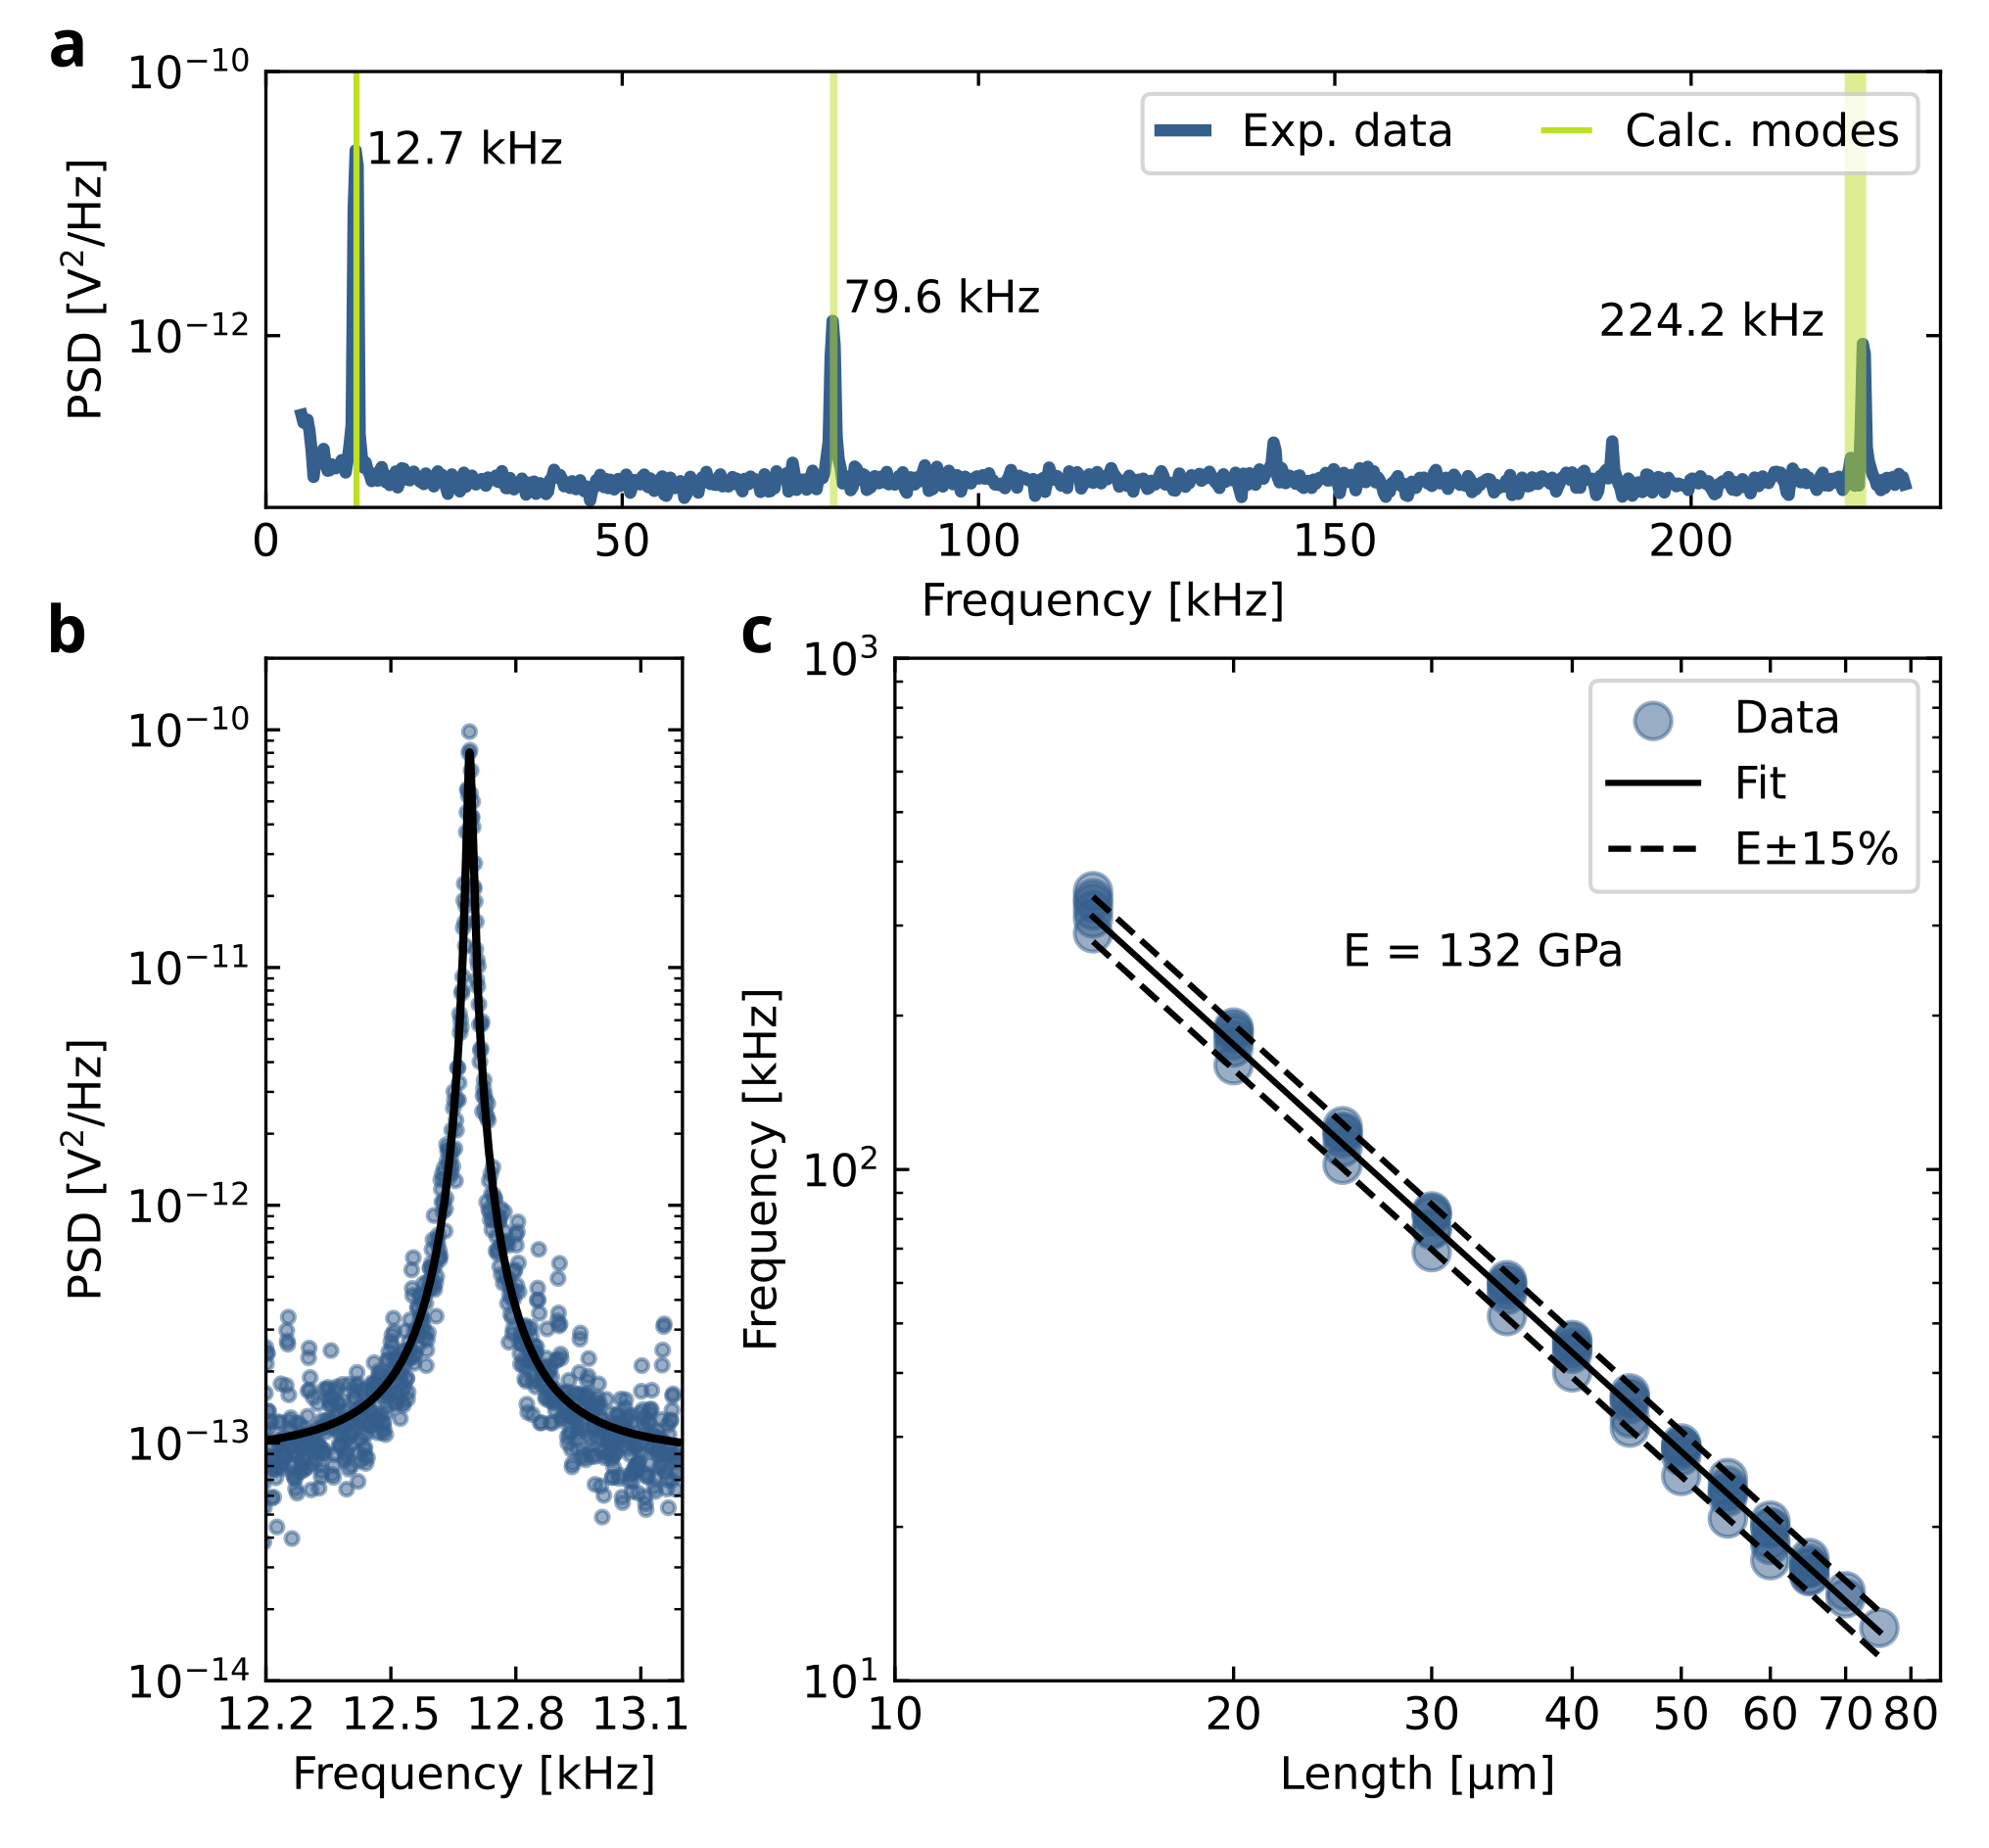
where =1.8751, 4.6941, 7.8548, is a numerical parameter related to the mode shape, is the thickness, the length, the density, and the Young’s modulus. We note that Eq. (2) has no stress dependence. This is because, as previously discussed, in cantilevers the longitudinal stress is relaxed due to their free end. To confirm that the simple analytical model of Eq. (2) can be applied to our ETO resonators, we first measured a wide spectrum of a 75 µm-long cantilever, which is reported in Fig. 3a. The first flexural mode is located at 12.7 kHz, the second at 79.6 kHz, and the third at 224.2 kHz. Since the mode spacing should be only given by the numerical factors in Eq. (2), we can take the first mode as a reference and calculate the expected values of the higher modes as . The resulting frequencies are marked by the green bands in Fig. 3a and well-match the experimental values. Fig. 3b shows a detailed spectrum of the first flexural mode, where the black line is a fit of the analytical expression of thermal noise spectrum.[21]. The resulting Q factor of 960 is in line with the other ETO cantilever resonators fabricated on these samples, all between 600 and 1300. These values are much lower than what recently reported for other complex oxides micro-bridge resonators, exceeding 10k,[18] this because double-clamped geometries under tension may take advantage from dissipation-dilution mechanism to enhance their Q factor.[22]
We measured several ETO cantilevers having length spanning from 15 to 75 µm and reported their first eigenfrequency in the scatter plot of Fig. 3c. In order to calculate the ETO Young’s modulus () from this dataset, we fit Eq. (2) considering a theoretical density of 6916.5 kg/m3, calculated from the \ceEu, \ceTi, and \ceO atomic masses and a (3.9 Å)3 cubic unit cell volume. To evaluate the dispersion of the measured resonance frequencies around their best fit (black solid line), in Fig. 3c we mark the 15 % window (dashed black lines) comprising all the data points. The resulting =132 GPa is about one half of what obtained from measurements of resonant ultrasound spectroscopy in bulk single crystal samples, where the reported elastic moduli correspond to a Young’s modulus of about 280 GPa (see Supplementary Material Sec. V).[16] However, this result is in line with a recent work studying the mechanics of ultra-thin \ceSrTiO3 which shows that the Young’s modulus of 100 nm-thick STO membranes is just below one half of the bulk value.[23]
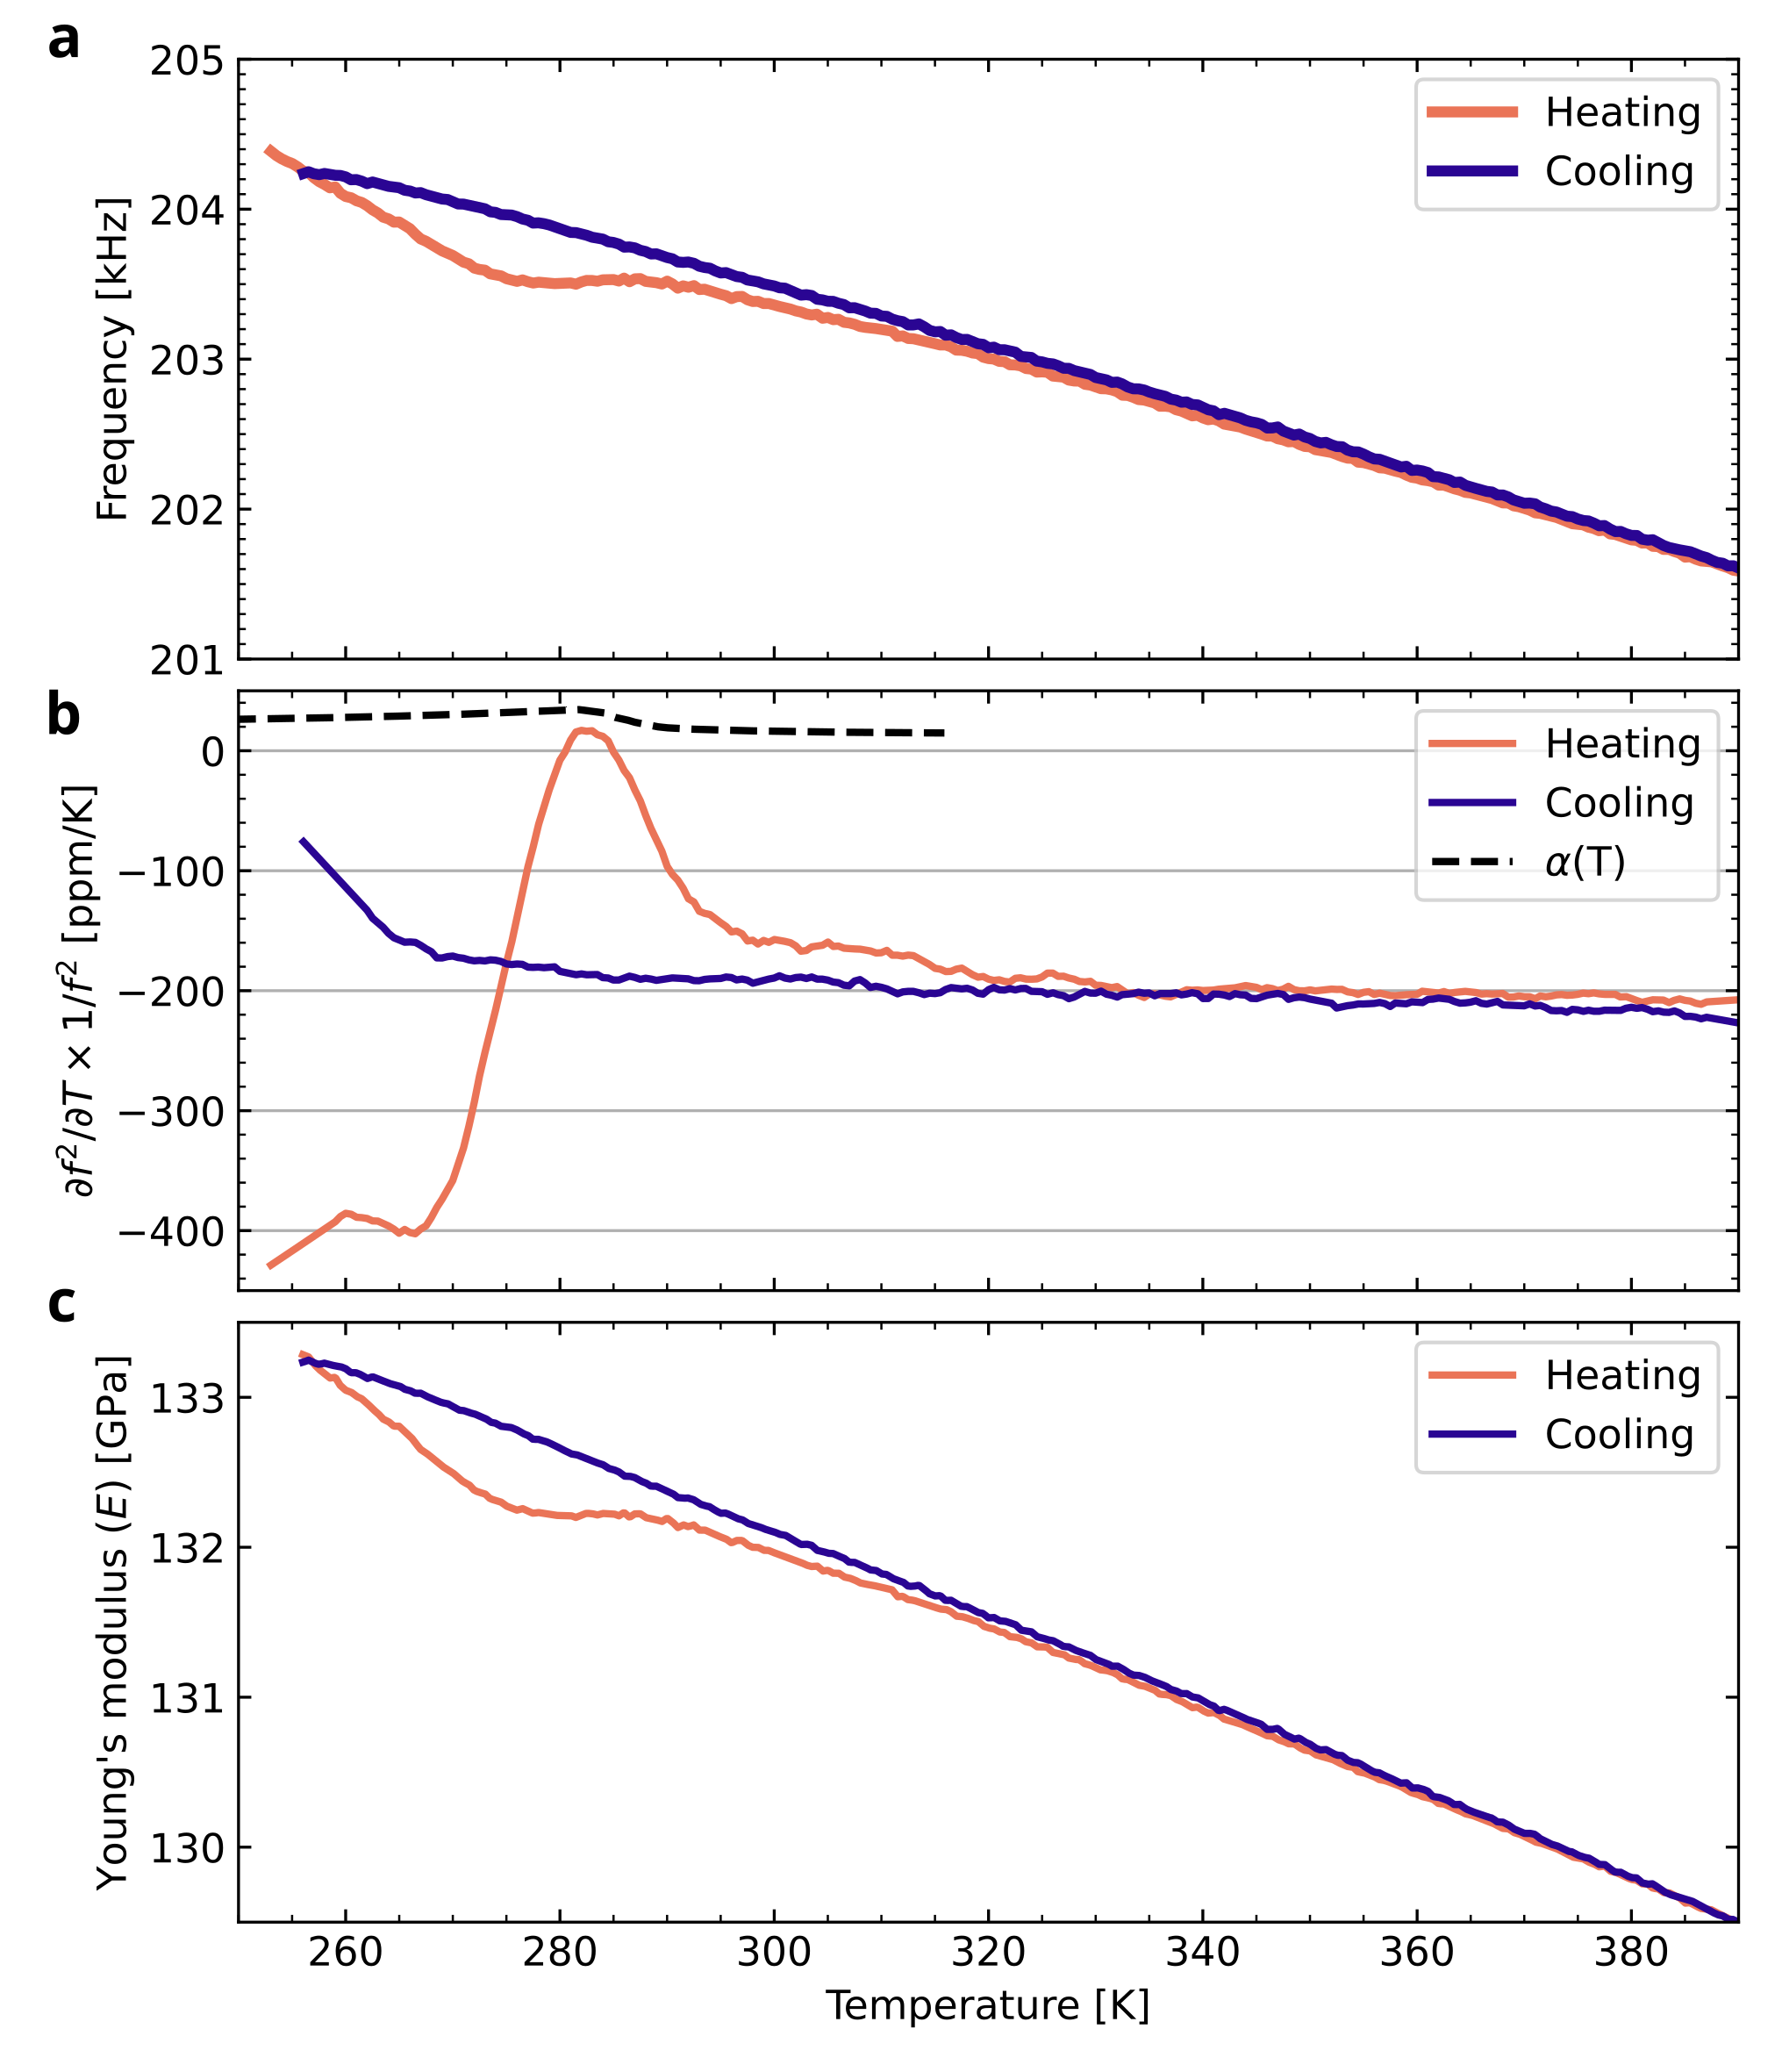
By measuring the temperature dependence of the resonance frequency of ETO cantilever resonators it is also possible to investigate the \ceEuTiO3 anti-ferro-distorsive transition characteristics. To do so we measured a 20 µm-long cantilever which was initially cooled down from room temperature to 255 K. The thermal noise spectrum of its first flexural mode was then recorded every 0.5 K during both a heating and a cooling stepped ramps. The eigenfrequency vs temperature characteristics () is reported in Figure 4a, showing two distinct features: (i) a slope change during heating between 275 K and 295 K, (ii) a thermal hysteresis. We can separate the contributions from thermal expansion and Young’s modulus temperature dependence by considering the relative temperature derivative of the squared frequency
| (3) |
where is the linear expansion coefficient. Eq. (3) was obtained from Eq. (2) as discussed in the Supplementary Material, Sec. VI. In Fig. 4b we compare the experimental (solid lines) with the thermal expansion coefficient as exacted from Ref. 6 (dashed line). Thermal expansion is small if compared to the experimental measurements, peaking at 35 ppm/K at 282 K and flattening out at about 15 ppm/K at high temperatures. As a consequence, Young’s modulus provides the dominant contribution to the measured slope, with a high-temperature constant value of about 200 ppm/K. From the data we can also obtain the Young’s modulus of ETO by considering the first-order thermal expansion approximation for , , and in Eq. (2).
| (4) |
where the is reference temperature of 298 K at which we measured the Young’s modulus of 132 GPa (see Fig. 3c) and is the integral function of the thermal expansion calculated bewteen and , as discussed in the Supplementary Material, Sec. VI.
The anomaly of Young’s modulus, marked by the oscillatory behavior of below 300 K, indicates the onset of the anti-ferro-distorsive transition. This is in agreement with a previous report from J. Schiemer and coworkers,[24] showing large variations of the stiffness moduli in the proximity of the transition temperature in both single crystal and policristalline bulk ETO samples measured by resonant ultrasound spectroscopy. A key difference between our results and these previous studies is the width of the thermal hysteresis, that in their experiment was of about 1 K. In our case, instead, thermal hysteresis is of about 35 K, as estimated form Fig. 4b. This wider transition could be the due to the high surface/volume ratio of our thin film-based devices, since hysteresis widening driven by size effect has been already reported for other materials showing first order phase transition.[25, 26] Another possible contribution is the presence of thermal gradients along the cantilever, since clamping point is in better contact with the thermal bath and the tip dissipates more. However, considering the background pressure of 210-5 mbar, such effect is expected to be small. Because of the limited temperature span of our measurement setup, we could not access the whole hysteresis width. Such hysteretic behavior was observed in several devices fabricated on different samples, as reported in Supplementary Material, Sec. VII, where differences in hysteresis width and amplitude are related to the nature of nested loops, whose shape is critically dependent from the extremal temperatures. Detailed analysis of this behavior will require dedicated experiments involving wider temperature range, samples having different thickness and cantilever geometries, and, ideally, magnetic field.
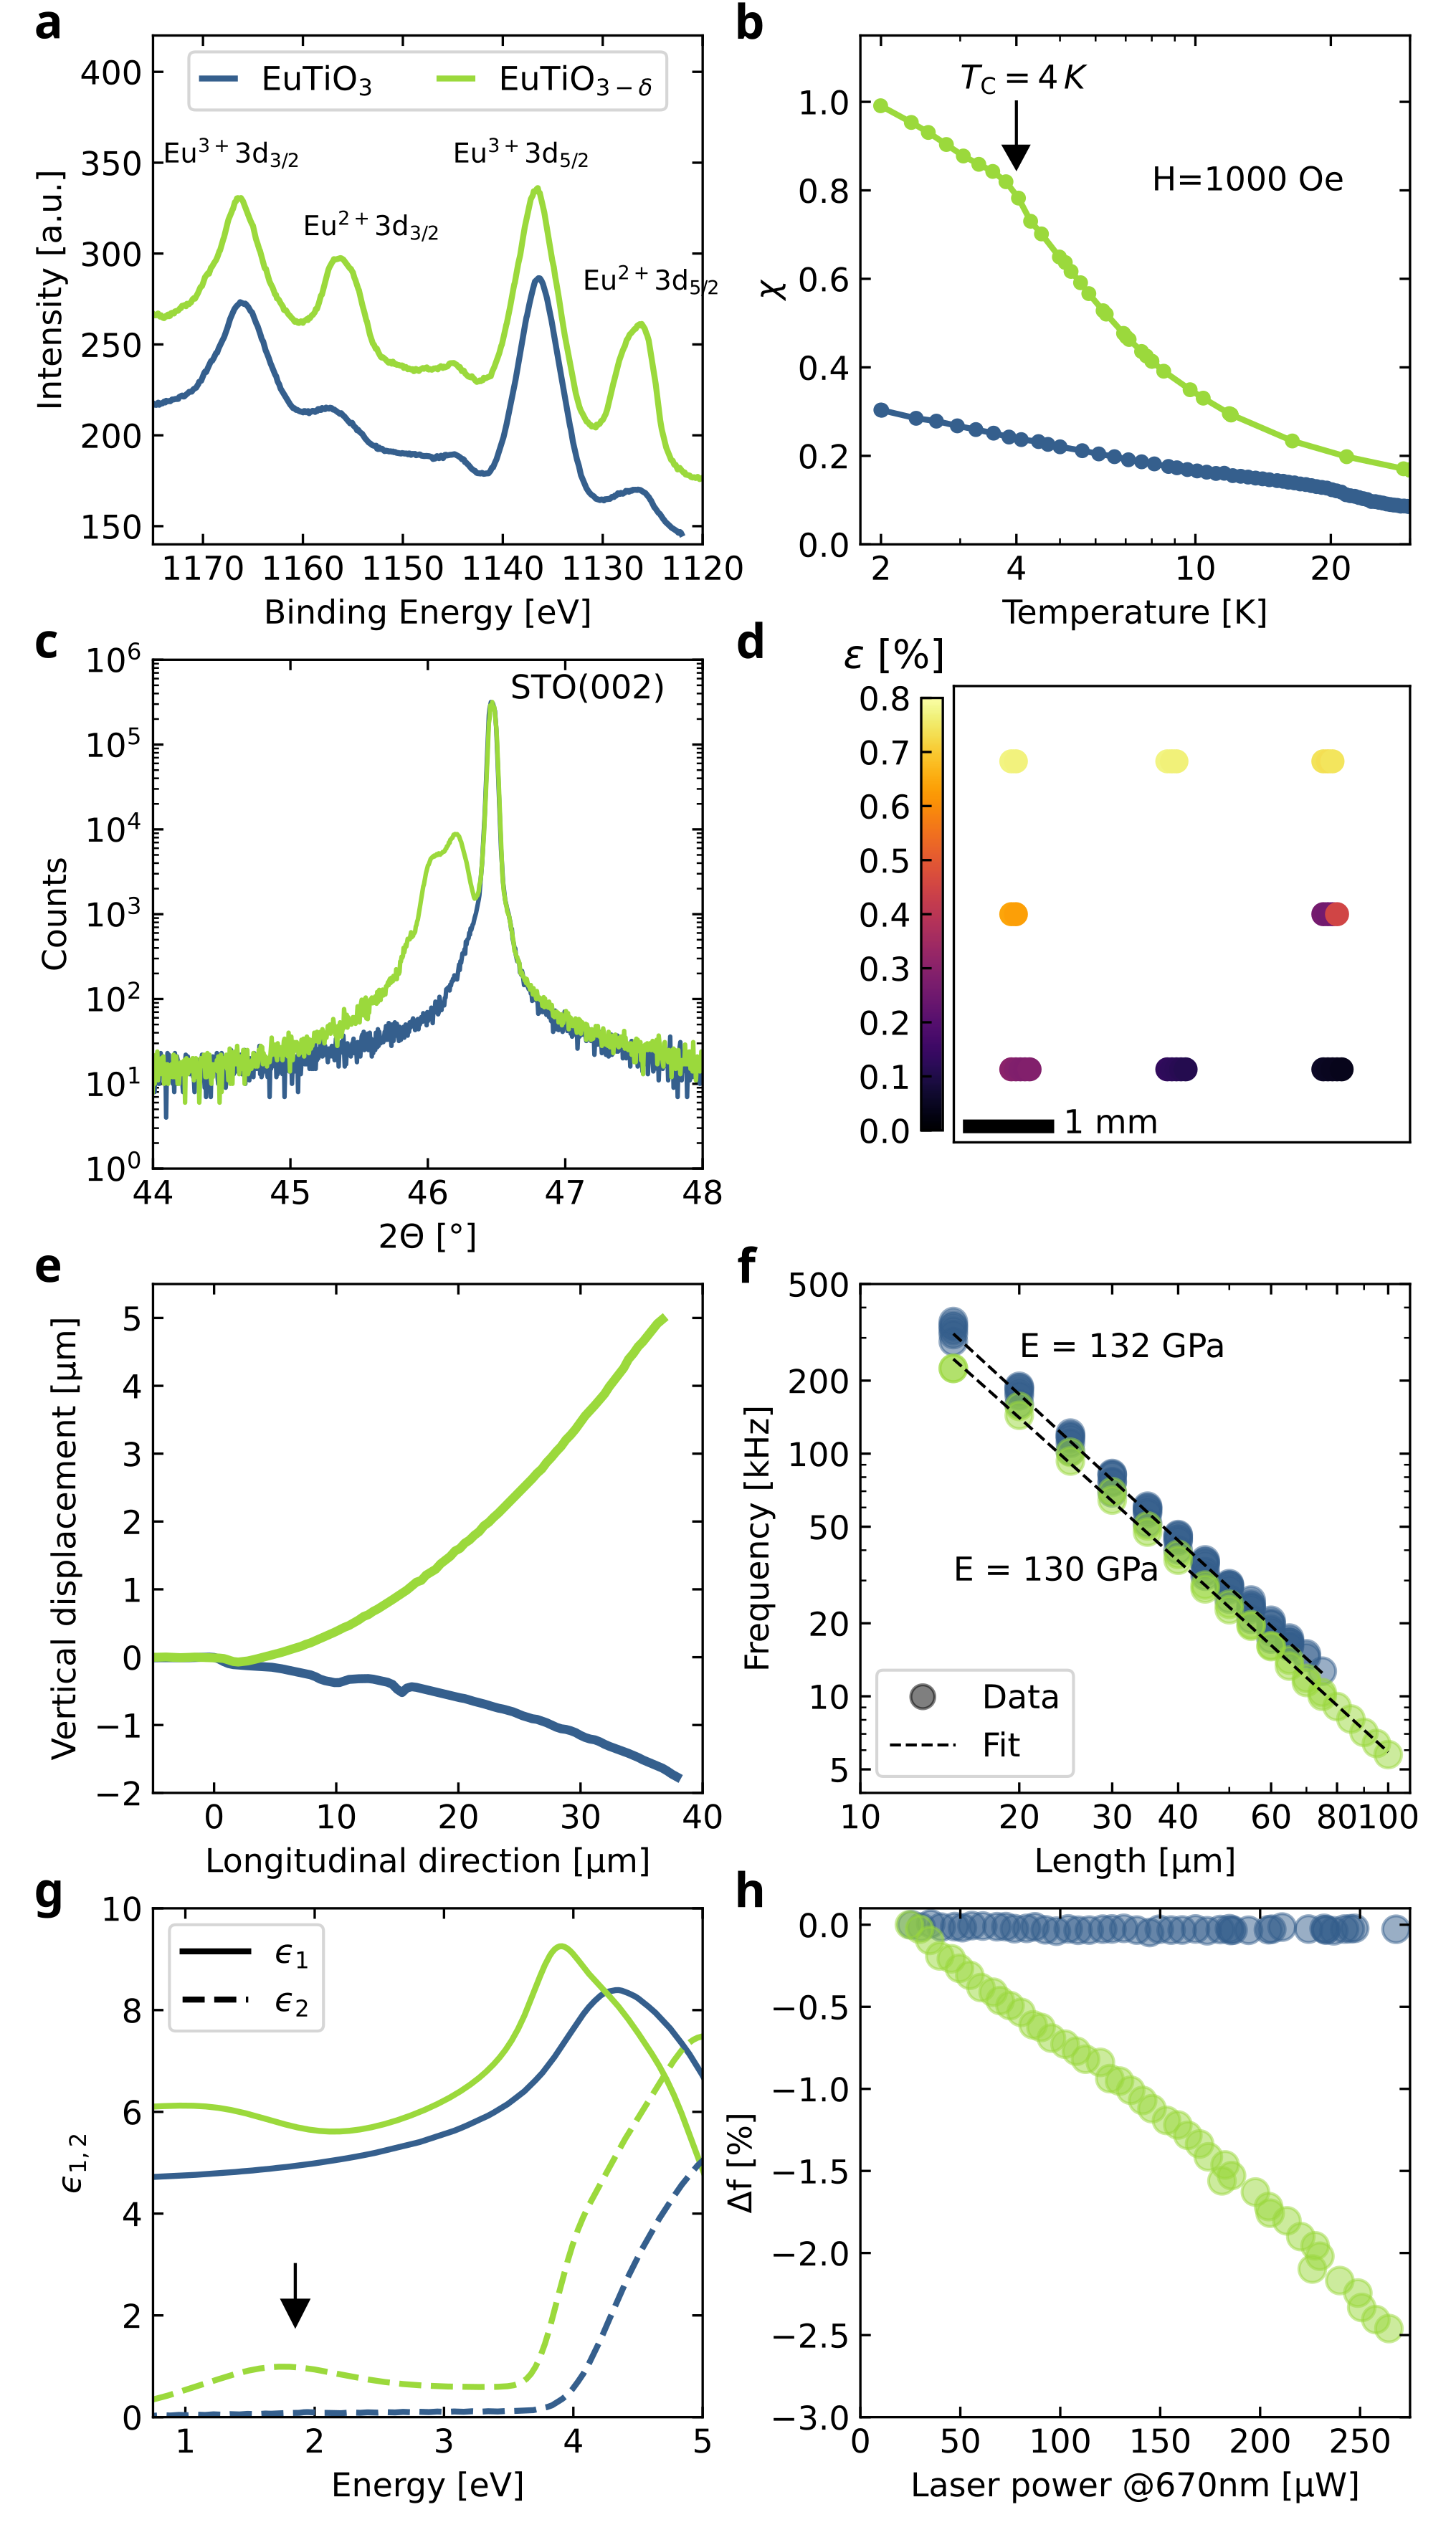
Finally, we investigated how the \ceEuTiO3 characteristics reported so far are affected by oxygen vacancies, which are a typical defect as well as doping mechanism of complex oxides. To do so, we grew a nominally 100 nm-thick films at the lower oxygen pressure of 10-6 mbar instead of 10-4 mbar. Its actual thickness, however, was 83 nm, as reported in the Supplementary Material, Sec. I. After the preliminary characterizations reported in Fig 5a–c, \ceETO_3-δ samples underwent the same fabrication protocol of stoichiometric ones. The formation of oxygen vacancies is indicated by the XPS data reported in Figure 5a, where the valence change of Eu atoms, with added weight on \ceEu^2+, is a consequence of charge balance after oxygen removal. Another feature of \ceETO_3-δ films is the onset of a ferro-magnetic transition at low temperature evidenced by an inflection point in the characteristic.[3] This feature is visible in our SQUID data as evidenced by the black arrow in Fig. 5b. XRD measurements reported in Fig. 5c shows that oxygen-deficient samples have larger out-of-plane inter-planar distance. Such lattice expansion is a common feature of oxygen vacancies-doped complex oxides,[27, 28] which is associated to an increase in the compressive strain of the material. Moreover, the broadening of the diffraction peak is quite large, also showing peak splitting.
A peculiar characteristics of \ceETO_3-δ samples is strain inhomogeneity, as exemplified by the strain map of Fig. 5e, which shows strong variations between the upper and the lower edges. Similar strain gradients were observed across four samples grown in different deposition runs and always associated to broad XRD peaks, similar to what reported in Fig. 5c. Because of that, we hypothesize that oxygen deficiency during growth makes ETO much more sensitive to small temperature gradients or substrate inhomogeneities, which, in higher pressure condition, do not affect long-range strain characteristics. Another dramatic difference between stoichiometric and vacancy-doped cases is the out-of-plane strain gradient. Fig. 5f compares the profiles of two 40 µm-long cantilevers: the \ceETO_3-δ one is bent upwards and shows a much larger displacement than the stoichiometric case. Strain gradient is thus negative and about three times larger. This feature is quite surprising, because in a simple layer-by-layer growth picture we could expect a better film oxidation at the bottom layers due to oxygen exchange with the STO substrate. However, in such a case the bottom surface of the cantilever would be more compressed, resulting in a profile shape similar to the \ceETO3 case. This result supports our previous conclusion that strain and strain gradients behave as a global film characteristics determined during the entire deposition process. We also investigate whether the Young’s modulus of \ceETO_3-δ was affected by oxygen vacancies by analyzing the frequency vs length relationship of an array of cantilevers, as in Fig. 3c. As reported in Fig. 5f, this is not the case, beacuse the difference between the resulting Young’s moduli, of just 2 GPa, is within the experimental error, while the lower resonance frequencies for the \ceETO_3-δ cantilevers are due to the thickness of the films (=97 nm and =83 nm).
It is well known that the formation of oxygen vacancies affects the light absorption of complex oxides.[29] To understand how this happens in \ceETO_3-δ, we assessed the optical properties of stoichiometric and oxygen-deficient films, prior to microfabrication, by means of spectroscopic ellipsometry. The complex dielectric functions of the substrate and the ETO film were modeled as a superposition of PSEMI oscillators (parametrized functions used to describe the optical response of crystalline semiconductors).[30, 31] The values of extracted from the ellipsometry data, reported in Fig. 5g, indicate that stoichiometric samples show no absorption below the band-gap, located at about 4 eV, in agreement with previous reports.[32] Oxygen vacancies determine a small redshifting of the band gap, from 4.0 eV to 3.6 eV, but critically increase (green dashed line) in the low-energy region, signaling the formation of in-gap states leading to broadband light absorption. An increased optical absorption affects the response of mechanical resonators to incident light. We thus compared the resonance frequency shift of two 65 µm-long cantilevers, one made of \ceETO3 and the other from \ceETO_3-δ as a function of the incident light power. The laser is the same employed to probe the motion of the structure and its wavelength of 670 nm corresponds to the arrow in Fig. 5g. The resulting tuning slopes are reported in Fig. 5h, where, for better comparison, we considered the relative frequency shift with respect to the lowest power employed in the experiment (25 µW). The stoichiometric sample shows almost no softening, and thus no heating, in agreement with its good transparency. \ceETO_3-δ cantilever, instead, lowers its eigenfrequency of about 2.5 % for an incident light power of =250 µW. This can be compared to the frequency shift measured during the temperature ramps in Fig. 4b by considering the finite differences
| (5) |
Quite nicely, we found a 1 µW 1 K equivalence, which holds for this specific cantilever length and above 300 K.
Conclusions
In summary, we investigated the mechanical properties of stoichiometric and oxygen vacancy-doped \ceEuTiO3 by fabricating suspended micro-structures from single-crystal thin films grown on top of \ceSrTiO3(001) substrates. Mechanical characterization measurements provided a quantitative evaluation of average in/out-of-plane strain and strain gradients as well as the Young’s modulus of the material. Stoichiometric films are found slightly compressed, with an average strain of +0.14,%, while oxygen-deficient ones shows higher strain inhomogeneity. The Young’s modulus of about 132 GPa is almost one-half of what found in bulk samples, in line with recent measurements on \ceSrTiO3 membranes having similar thickness. Temperature-dependent mechanical measurements indicates that above 300 K the relative derivative of the Young’s modulus is about 200 ppm/K. Below 300 K we observe a non-monotonic and hysteretic mechanical response associated to the \ceEuTiO3 anti-ferro-distorsive transition. Its width of about 35 K is in striking difference with respect to bulk samples that show a small histeresis of about 1 K. Such wideding could be related to size effect or temperature gradients across the structure, but a clear understanding of its origin will require new dedicated experiments.
Supplementary Material
The Supplementary Material of this article contains \ceEuTiO3 growth data and thickness calibration, reciprocal space maps of stoichiometric and oxygen-deficient samples, surface topography of as-grown \ceEuTiO3 thin films, evaluation of bulk \ceEuTiO3 Young’s modulus and Poisson’s ratio from literature data, analysis of strain variations within bridges owning to the same harp array, derivation of Eq. (3) and Eq. (4), and frequency vs temperature data, as those reported in Fig. 4a, measured on different cantilevers.
Acknowledgments
We thank Emilio Bellingeri, Gianrico Lamura, Cristina Bernini, and Alejandro Enrique Plaza for the useful discussions. This work was carried out under the OXiNEMS project (www.oxinems.eu). This project has received funding from the European Union’s Horizon 2020 research and innovation programme under Grant Agreement No. 828784. We acknowledge financial support from the Università di Genova through the “Fondi di Ricerca di Ateneo” (FRA). We also acknowledge support from the Swedish infrastructure for micro- and nano-fabrication - MyFab.
Open Data
The numerical data shown in the figures of this manuscript and the supplemental material can be donwloaded from the Zenodo online repository: http://dx.doi.org/10.5281/zenodo.8109185
References
- Bussmann-Holder et al. [2011] A. Bussmann-Holder, J. Köhler, R. K. Kremer, and J. M. Law, Physical Review B 83, 212102 (2011).
- Goian et al. [2012] V. Goian, S. Kamba, O. Pacherová, J. Drahokoupil, L. Palatinus, M. Dušek, J. Rohlíček, M. Savinov, F. Laufek, W. Schranz, A. Fuith, M. Kachlík, K. Maca, A. Shkabko, L. Sagarna, A. Weidenkaff, and A. A. Belik, Physical Review B 86, 054112 (2012).
- Fujita et al. [2009] K. Fujita, N. Wakasugi, S. Murai, Y. Zong, and K. Tanaka, Applied Physics Letters 94, 062512 (2009).
- Köhler, Dinnebier, and Bussmann-Holder [2012] J. Köhler, R. Dinnebier, and A. Bussmann-Holder, Phase Transitions 85, 949 (2012).
- Shirane and Yamada [1969] G. Shirane and Y. Yamada, Physical Review 177, 858 (1969).
- Reuvekamp et al. [2014] P. G. Reuvekamp, R. K. Kremer, J. Köhler, and A. Bussmann-Holder, Physical Review B 90, 104105 (2014).
- McGuire et al. [1966] T. R. McGuire, M. W. Shafer, R. J. Joenk, H. A. Alperin, and S. J. Pickart, Journal of Applied Physics 37, 981 (1966).
- Katsufuji and Takagi [2001] T. Katsufuji and H. Takagi, Physical Review B 64, 054415 (2001).
- Bussmann-Holder and Köhler [2015] A. Bussmann-Holder and J. Köhler, Journal of Physics and Chemistry of Solids 84, 2 (2015).
- Pellegrino et al. [2009] L. Pellegrino, M. Biasotti, E. Bellingeri, C. Bernini, A. S. Siri, and D. Marré, Advanced Materials 21, 2377 (2009).
- Manca et al. [2017] N. Manca, L. Pellegrino, T. Kanki, W. J. Venstra, G. Mattoni, Y. Higuchi, H. Tanaka, A. D. Caviglia, and D. Marré, Advanced Materials 29, 1701618 (2017).
- Manca et al. [2019] N. Manca, G. Mattoni, M. Pelassa, W. J. Venstra, H. S. J. van der Zant, and A. D. Caviglia, ACS Applied Materials & Interfaces 11, 44438 (2019).
- Manca et al. [2020] N. Manca, T. Kanki, F. Endo, D. Marré, and L. Pellegrino, Nano Letters 20, 7251 (2020).
- Manca et al. [2021] N. Manca, T. Kanki, F. Endo, E. Ragucci, L. Pellegrino, and D. Marré, ACS Applied Electronic Materials 3, 211 (2021).
- Plaza et al. [2021] A. E. Plaza, N. Manca, C. Bernini, D. Marré, and L. Pellegrino, Applied Physics Letters 119, 033504 (2021).
- Li et al. [2015] L. Li, J. R. Morris, M. R. Koehler, Z. Dun, H. Zhou, J. Yan, D. Mandrus, and V. Keppens, Physical Review B 92, 024109 (2015).
- Pappas et al. [2022] P. Pappas, A. Bussmann-Holder, H. Keller, E. Liarokapis, and K. Roleder, Physical Review B 106, 214306 (2022).
- Manca et al. [2022] N. Manca, F. Remaggi, A. E. Plaza, L. Varbaro, C. Bernini, L. Pellegrino, and D. Marré, Small 18, 2202768 (2022).
- Kiesewetter et al. [1992] L. Kiesewetter, J.-M. Zhang, D. Houdeau, and A. Steckenborn, Sensors and Actuators A: Physical 35, 153 (1992).
- Schmid, Villanueva, and Roukes [2016] S. Schmid, L. G. Villanueva, and M. L. Roukes, Fundamentals of Nanomechanical Resonators (Springer International Publishing, Cham, 2016).
- Hauer et al. [2013] B. Hauer, C. Doolin, K. Beach, and J. Davis, Annals of Physics 339, 181 (2013).
- Sementilli, Romero, and Bowen [2022] L. Sementilli, E. Romero, and W. P. Bowen, Advanced Functional Materials 32, 2105247 (2022).
- Harbola et al. [2021] V. Harbola, S. Crossley, S. S. Hong, D. Lu, Y. A. Birkhölzer, Y. Hikita, and H. Y. Hwang, Nano Letters 21, 2470 (2021).
- Schiemer et al. [2016] J. Schiemer, L. J. Spalek, S. S. Saxena, C. Panagopoulos, T. Katsufuji, A. Bussmann-Holder, J. Köhler, and M. A. Carpenter, Physical Review B 93, 054108 (2016).
- Brassard et al. [2005] D. Brassard, S. Fourmaux, M. Jean-Jacques, J. C. Kieffer, and M. A. El Khakani, Applied Physics Letters 87, 051910 (2005).
- Nazari et al. [2013] M. Nazari, Y. Zhao, V. Hallum, A. A. Bernussi, Z. Y. Fan, and M. Holtz, Applied Physics Letters 103, 043108 (2013).
- Choi et al. [2009] W. S. Choi, Z. Marton, S. Y. Jang, S. J. Moon, B. C. Jeon, J. H. Shin, S. S. A. Seo, T. W. Noh, K. Myung-Whun, H. N. Lee, and Y. S. Lee, Journal of Physics D: Applied Physics 42, 165401 (2009).
- Mattoni et al. [2018] G. Mattoni, A. Filippetti, N. Manca, P. Zubko, and A. D. Caviglia, Physical Review Materials 2, 053402 (2018).
- Blanc and Staebler [1971] J. Blanc and D. L. Staebler, Physical Review B 4, 3548 (1971).
- Johs et al. [1998] B. Johs, C. Herzinger, J. Dinan, A. Cornfeld, and J. Benson, Thin Solid Films 313–314, 137 (1998).
- Sygletou et al. [2023] M. Sygletou, S. Benedetti, A. di Bona, M. Canepa, F. Bisio, and E. Bellingeri, ACS Applied Materials & Interfaces , acsami.2c16668 (2023).
- Stuhlhofer et al. [2016] B. Stuhlhofer, G. Logvenov, M. Górny, K. Roleder, A. Boris, D. Pröpper, R. K. Kremer, J. Köhler, and A. Bussmann-Holder, Phase Transitions 89, 731 (2016).
See pages 1 of Supplementary.pdf See pages 2 of Supplementary.pdf See pages 3 of Supplementary.pdf See pages 4 of Supplementary.pdf See pages 5 of Supplementary.pdf See pages 6 of Supplementary.pdf See pages 7 of Supplementary.pdf See pages 8 of Supplementary.pdf See pages 9 of Supplementary.pdf See pages 10 of Supplementary.pdf See pages 11 of Supplementary.pdf See pages 12 of Supplementary.pdf