Tellurium emission line in kilonova AT 2017gfo
Abstract
The late-time spectra of the kilonova AT 2017gfo associated with GW170817 exhibit a strong emission line feature at . The line structure develops with time and there is no apparent blue-shifted absorption feature in the spectra, suggesting that this emission line feature is produced by electron collision excitation. We attribute the emission line to a fine structure line of Tellurium (Te) III, which is one of the most abundant elements in the second r-process peak. By using a synthetic spectral modeling including fine structure emission lines with the solar r-process abundance pattern beyond the first r-process peak, i.e., atomic mass numbers , we demonstrate that [Te III] is indeed expected to be the strongest emission line in the near infrared region. We estimate that the required mass of Te III is , corresponding to the merger ejecta of , which is in agreement with the mass estimated from the kilonova light curve.
keywords:
transients: neutron star mergers1 Introduction
The origin of r-process elements is a long-standing problem in astrophysics (Burbidge et al., 1957; Cameron, 1957). Neutron star mergers have been considered as promising sites of r-process nucleosynthesis (Lattimer & Schramm, 1974). A neutron star merger, GW170817, was accompanied by an uv-optical-infrared counterpart, a kilonova (or macronova) AT 2017gfo, which provides strong evidence that r-process nucleosynthesis occurs in neutron star merger ejecta (see, e.g., Metzger, 2017; Nakar, 2020; Margutti & Chornock, 2021, for reviews).
A series of spectral data of the kilonova AT 2017gfo was obtained in the the optical and near infrared bands from 0.5 to 10 days after the merger (Andreoni et al., 2017; Chornock et al., 2017; Kasliwal et al., 2017; Pian et al., 2017; Smartt et al., 2017; Tanvir et al., 2017; Troja et al., 2017). The kilonova AT 2017gfo is dominated by the photospheric emission at the early times. The photospheric emission around a few days after the merger peaks in the near infrared band, indicating the existence of lanthanides, which have strong absorption at optical to near infrared wavelengths (Barnes & Kasen, 2013; Kasen et al., 2013; Tanaka & Hotokezaka, 2013; Fontes et al., 2020; Tanaka et al., 2020; Kawaguchi et al., 2018; Barnes et al., 2021). The early spectra also exhibit several absorption structures including: (i) the feature attributed to Sr II or He I (Watson et al., 2019; Domoto et al., 2021; Gillanders et al., 2022; Perego et al., 2022; Tarumi et al., 2023) and (ii) the and features attributed to La III and Ce III, respectively (Domoto et al., 2022). In addition to the elemental identification, Sneppen et al. (2023) demonstrated that the spectra in the photospheric phase are useful to study the geometry of the outer part of the kilonova ejecta, .
After the photospheric phase, kilonovae enter the nebula phase, where the ejecta is heated by charged decay products of the radioactivity of r-process nuclei and the heat is radiated through atomic emission lines. Examining kilonova nebular spectra provides opportunities to identify atomic species synthesized in the merger ejecta that may not appear as absorption lines during the photospheric phase. For instance, Hotokezaka et al. (2022) interpreted the detection of Spitzer (Villar et al., 2018; Kasliwal et al., 2022) at at and days after the merger as emission lines of selenium (Se) or tungsten (W). In the early nebular phase, , the infrared emission is of particular interest because the absorption opacity due to atomic transitions is lower compared to the optical region (e.g., Tanaka et al., 2020), and thus, the emission lines are expected to appear as early as days. Most of infrared emission lines are expected to arise from fine-structure transitions in the ground terms of heavy elements, for which the line wavelengths and transition rates can be obtained with reasonably high accuracy from the experimentally calibrated atomic energy levels. Furthermore, such emission lines can be used to estimate the mass distribution of the emitting ions from the emission line spectra. In fact, the mass distributions of ions in type Ia supernova ejecta have been derived from the infrared nebular spectra (e.g., Kwok et al., 2023; DerKacy et al., 2023)
In section 2, we study an emission line feature at in the kilonova AT 2017gfo spectra from 7.5 to 10.5 days. We attribute this line to a fine-structure line of doubly ionized Tellurium (Te III, atomic number 52). The Te III mass that is required to explain the observed data is estimated as . With a synthetic spectral modeling with the solar r-process abundance pattern, we show that [Te III] is the strongest fine structure emission line in the near infrared region. In section 3, we conclude the results and discuss the uncertainties and implications.
2 Te III line in kilonova
The emission lines produced through radiative de-excitation of atoms emerge from the optically thin region of the ejecta. The optical depth of the kilonova ejecta with an expansion velocity of and a mass of is
| (1) | ||||
| (2) |
where is the opacity and is the time since merger. The opacity is dominated by bound-bound transitions of heavy elements and depends on the composition and wavelengths. Tanaka et al. (2020) show that the expansion opacity decreases with wavelength, e.g., – around and around . Therefore, infrared emission lines are expected to emerge at the earlier time than optical lines. With the ejecta parameters of AT 2017gfo, we expect emission lines to dominate over the photospheric emission as early as around .
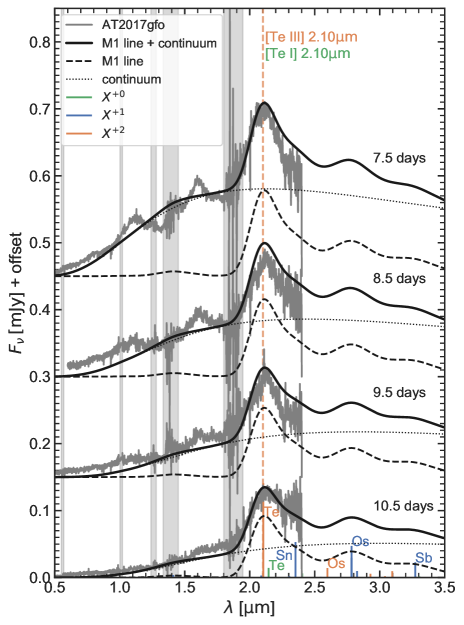
Figure 1 shows the spectral series of the kilonova AT 2017gfo from to days after the merger taken by X-shooter on the Very Large Telescope (Pian et al., 2017). The observed spectra are composed of several line features and a continuum component extending from the optical to near infrared bands. We model the underlying continuum spectrum by blackbody radiation, where the photospheric velocity and temperature for – days are – and – , respectively. The observed spectra clearly show an emission line at (see Gillanders et al. 2023 for a detailed analysis). The expansion velocity of the line emitting region is derived from Doppler broadening of the line, which is consistent with the picture where the emission line is produced outside the photosphere. The line flux remains roughly constant with time while the continuum flux declines, and thus, the line-to-continuum ratio increases from at 7.5 days to at 10.5 days. This development of the emission line without a blue-shifted absorption feature indicates that the emission at is a forbidden line driven by electron collision rather than an emission line associated with an absorption line, e.g., a P-Cygni line or a fluorescence line. The wavelength of the peak of the emission line feature indeed coincides with a fine structure line, [Te III] , arising from the transition between the ground level and the first excited level . It is worth noting that [Te III] has been detected in planetary nebulae (Madonna et al., 2018). Note that the transition between the ground level and the second excited level of Te I also produces an emission line at 2.1 . As discussed later, the contribution of Te I line is weaker than Te III line.
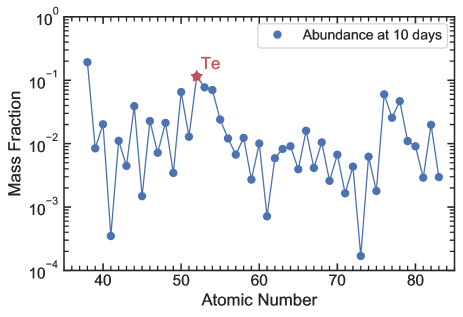
It may not be surprising that Te III produces the strongest emission lines because Te is among the most abundant elements in the second r-process peak. Figure 2 shows the mass fraction of each atom at 10 days after the merger. Here we assume that the final abundance pattern matches the solar r-process residual with atomic numbers (Hotokezaka & Nakar, 2020), i.e., the elements beyond the first r-process peak. With this assumption, the most abundant element is Sr and the second most is Te at 10 days. Note also that [Te III] is particularly expected to be strong as long as Te III is abundant outside the photosphere because this line is produced by radiative decay of the first fine structure transition level, which is easily excited by electron collision. For the iron peak elements, [Co III] and [Co II] represent lines of the same nature. Indeed, these are among the most prominent mid-IR lines observed in SNe Ia and SN 1987A, respectively (Kwok et al., 2023; Wooden et al., 1993).
Let us first give an estimate of the amount of Te III from the observed line flux assuming that the observed line flux is predominantly produced by Te III and the ejecta is optically thin to the [Te III] line. The total line luminosity is given by
| (3) |
where , , and are the excitation energy, the radiative decay rate, and the fraction of Te III ions in the level, respectively, and is the total number of Te III ions in the ejecta (see equations (1) and (2) in Hotokezaka et al., 2022, for the formula of M1 transition probabilities). The observed flux at after subtracting the underlying continuum is , corresponding to the observed line luminosity of with . Equation (3) leads to a total mass of Te III:
| (4) |
Note that the electron density at day may be comparable to the critical density of Te III (Madonna et al., 2018), and therefore, the level fraction is comparable to or slightly less than that expected from the thermal distribution, i.e., in thermal equilibrium at . Given the total ejecta mass of , we estimate that the mass fraction of Te is greater than a few per cent.
We now turn to the comparison of the observed spectra with a synthetic spectral model. The synthetic spectrum is composed of fine structure emission lines and a continuum component, where the continuum emission is approximated by blackbody radiation. The blackbody temperature and radius at a given epoch are determined such that the synthetic spectrum roughly agrees with the observed one at the near IR region . The emission line spectrum is computed by the one-zone modeling presented in Hotokezaka et al. (2022), where the energy level populations are solved by balance between collision and radiative decay for a given electron density, temperature, and ionization state. We use the collision strengths of the fine structure transitions of the ground term of Te III derived by Madonna et al. (2018). The collision strengths of other elements that are relevant for the nebular modeling at are obtained by using an atomic structure code Hullac (Bar-Shalom et al. 2001, see also Hotokezaka et al. 2022) and the M1 line list is constructed by using the NIST database (Kramida et al., 2021) and the LS selection rules with the single-configuration approximation (Hotokezaka et al. in prep). Note that the wavelengths and radiative transition rates of the M1 lines in the list are sufficiently accurate for our purpose.
In the modeling, the ejecta composition is assumed to be the solar r-process abundance pattern with (figure 2), which is the same as the second and third peak model used in Hotokezaka et al. (2022). The model also assumes the electron temperature, and the ionization fractions 111We neglect the emission lines of ions in .. These quantities are assumed to be constant with time for simplicity. This choice of the ionization fraction is somewhat motivated by Hotokezaka et al. (2021), where the ionization fractions of Nd atoms in the kilonova nebular phase are studied. With these parameters, the ejecta mass of and the expansion velocity of , [Te III] is the strongest emission line among M1 transitions of all the heavy elements beyond the first r-process peak and the synthetic spectra can roughly reproduce the emission line structure around . However, one should keep in mind that the ionization fraction varies among different atomic species. The ejecta mass of agrees with the ejecta mass estimated from the energy budget of the bolometric light curve (Waxman et al., 2019; Kasen & Barnes, 2019; Hotokezaka & Nakar, 2020).
If this interpretation is correct, we expect that the line remains at the later times while the continuum flux keeps declining. It is worth noting that Te III may produce another emission line at arising from the transition between the first and second excited levels (-) at the later times because the electron temperature is expected to gradually increase with time (Hotokezaka et al., 2021; Pognan et al., 2022a). Although this line may be hidden by several other lines of Os II, III, and Pd III, detecting the two lines of Te III in future events can provide solid confirmation of the Te III production in mergers. Furthermore, the ratio of these line fluxes can be used to diagnose the electron temperature.
3 Conclusion and discussion
The observed spectra of the kilonova AT 2017gfo exhibit a strong emission line at . The emission line with the lack of an apparent blue-shifted absorption feature suggests that the emission feature is a forbidden line excited through electron collision. We attribute this line to the fine structure line, [Te III] , which has also been detected in planetary nebulae (Madonna et al., 2018). Note that Te is one of the most abundant elements in the second r-process peak. We estimate that the mass of Te III is roughly to account for the observed line flux.
We compare the observed spectra with a synthetic model, where the spectrum is composed of fine structure emission lines and a continuum component approximated by blackbody radiation. The spectrum of fine structure emission lines is computed with the one-zone model presented in Hotokezaka et al. (2022). With the solar r-process abundance beyond the first r-process peak, , and , we show that [Te III] is the strongest emission line among M1 transitions of all the heavy elements around 10 days after merger. Our model agrees with the observed spectra for the ejecta of with the solar r-process abundance pattern with , an expansion velocity of , and electron temperature of , and the ionization fraction of . Because blackbody radiation may be a poor approximation to the continuum flux around we should keep in mind that the amount of Te III in our analysis may be affected by the continuum flux model. It is also interesting to note that the same abundance pattern can reproduce the Spitzer detection at 40 days (Villar et al., 2018; Kasliwal et al., 2022), in which the emission is attributed to a fine structure line of W III (Hotokezaka et al., 2022). Note that, if the lighter r-process elements are abundant, they are expected to produce emission lines around such as [Kr III] and [Se IV] . However, the observed spectra peak at , suggesting that these ions are less abundant compared to Te III in the line emitting region of the ejecta.
Our model does not include electric dipole (E1) lines, which may produce strong absorption and emission lines. Recently, Gillanders et al. (2023) suggested that may be composed of two lines and an E1 line of Ce III is the best candidate producing this line feature. Although we cannot quantify the contamination of E1 lines to the feature, we emphasize that the M1 emission of Te can account the observed line flux with reasonable parameters. To verify this hypothesis we need spectral modelings with E1 lines. We also note that the M1 lines in our list cannot account for the observed feature at . The flux in this line declines with time as the continuum flux declines, indicating that this emission feature may be produced by E1 lines. Interestingly, Domoto et al. (2022) show that Ce III has several strong E1 lines around .
From the early blue emission in the photospheric phase, it is suggested that the emission is dominated by the ejecta composed of light r-process elements in order to avoid significant absorption in the optical band by lanthanides. Furthermore, the analyses of the kilonova spectra in the photospheric phase lead to the similar conclusion. The absorption feature around is likely caused by one of light r-process elements, Sr (), or even He (Watson et al., 2019; Gillanders et al., 2022; Tarumi et al., 2023). Domoto et al. (2022) propose that La () and Ce () produce the absorption lines around and , respectively. But the abundances of La and Ce inferred from the spectral analysis are lower than the solar r-process residuals by factor of . These indicate that the outer part of the ejecta () is predominantly composed of light r-process elements. In contrast to the early emission, our analysis implies that heavier elements, i.e., the second r-process peak, are likely more abundant in the slower part of the ejecta.
In order to obtain better constraints on the elemental abundances and ejecta parameters, the spectral modelings should be improved by developing non-LTE radiation transfer modelings (e.g., Pognan et al., 2022b) and by improving atomic data such as the radiative transition rates (e.g., Gaigalas et al., 2019), collision strengths, and recombination rate coefficients. For future kilonova events, the spectroscopic observations with the JWST as well as ground-based telescopes will be useful to identify more elements in the nebular spectra with a wider wavelength range.
Acknowledgments
We thank Nanae Domoto and Yuta Tarumi for useful discussion. This research was supported by JST FOREST Program (Grant Number JPMJFR212Y, JPMJFR2136), NIFS Collaborative Research Program (NIFS22KIIF005), the JSPS Grant-in-Aid for Scientific Research (19H00694, 20H00158, 21H04997, 20K14513, 20H05639, 22JJ22810).
DATA AVAILABILITY
The data presented this article will be shared on request to the corresponding author.
References
- Andreoni et al. (2017) Andreoni I., et al., 2017, Publ. Astron. Soc. Australia, 34, e069
- Bar-Shalom et al. (2001) Bar-Shalom A., Klapisch M., Oreg J., 2001, J. Quant. Spectrosc. Radiative Transfer, 71, 169
- Barnes & Kasen (2013) Barnes J., Kasen D., 2013, ApJ, 775, 18
- Barnes et al. (2021) Barnes J., Zhu Y. L., Lund K. A., Sprouse T. M., Vassh N., McLaughlin G. C., Mumpower M. R., Surman R., 2021, ApJ, 918, 44
- Burbidge et al. (1957) Burbidge E. M., Burbidge G. R., Fowler W. A., Hoyle F., 1957, Reviews of Modern Physics, 29, 547
- Cameron (1957) Cameron A. G. W., 1957, PASP, 69, 201
- Chornock et al. (2017) Chornock R., et al., 2017, ApJ, 848, L19
- DerKacy et al. (2023) DerKacy J. M., et al., 2023, ApJ, 945, L2
- Domoto et al. (2021) Domoto N., Tanaka M., Wanajo S., Kawaguchi K., 2021, ApJ, 913, 26
- Domoto et al. (2022) Domoto N., Tanaka M., Kato D., Kawaguchi K., Hotokezaka K., Wanajo S., 2022, arXiv e-prints, p. arXiv:2206.04232
- Fontes et al. (2020) Fontes C. J., Fryer C. L., Hungerford A. L., Wollaeger R. T., Korobkin O., 2020, MNRAS, 493, 4143
- Gaigalas et al. (2019) Gaigalas G., Kato D., Rynkun P., Radžiūtė L., Tanaka M., 2019, ApJS, 240, 29
- Gillanders et al. (2022) Gillanders J. H., Smartt S. J., Sim S. A., Bauswein A., Goriely S., 2022, MNRAS, 515, 631
- Gillanders et al. (2023) Gillanders J. H., Sim S. A., Smartt S. J., Goriely S., Bauswein A., 2023, arXiv e-prints, p. arXiv:2306.15055
- Hotokezaka & Nakar (2020) Hotokezaka K., Nakar E., 2020, ApJ, 891, 152
- Hotokezaka et al. (2021) Hotokezaka K., Tanaka M., Kato D., Gaigalas G., 2021, MNRAS, 506, 5863
- Hotokezaka et al. (2022) Hotokezaka K., Tanaka M., Kato D., Gaigalas G., 2022, MNRAS, 515, L89
- Kasen & Barnes (2019) Kasen D., Barnes J., 2019, ApJ, 876, 128
- Kasen et al. (2013) Kasen D., Badnell N. R., Barnes J., 2013, ApJ, 774, 25
- Kasliwal et al. (2017) Kasliwal M. M., et al., 2017, Science, 358, 1559
- Kasliwal et al. (2022) Kasliwal M. M., et al., 2022, MNRAS, 510, L7
- Kawaguchi et al. (2018) Kawaguchi K., Shibata M., Tanaka M., 2018, ApJ, 865, L21
- Kramida et al. (2021) Kramida A., Yu. Ralchenko Reader J., and NIST ASD Team 2021, NIST Atomic Spectra Database (ver. 5.9), [Online]. Available: https://physics.nist.gov/asd [2017, April 9]. National Institute of Standards and Technology, Gaithersburg, MD.
- Kwok et al. (2023) Kwok L. A., et al., 2023, ApJ, 944, L3
- Lattimer & Schramm (1974) Lattimer J. M., Schramm D. N., 1974, ApJ, 192, L145
- Madonna et al. (2018) Madonna S., et al., 2018, ApJ, 861, L8
- Margutti & Chornock (2021) Margutti R., Chornock R., 2021, ARA&A, 59
- Metzger (2017) Metzger B. D., 2017, Living Reviews in Relativity, 20, 3
- Nakar (2020) Nakar E., 2020, Phys. Rep., 886, 1
- Perego et al. (2022) Perego A., et al., 2022, ApJ, 925, 22
- Pian et al. (2017) Pian E., et al., 2017, Nature, 551, 67
- Pognan et al. (2022a) Pognan Q., Jerkstrand A., Grumer J., 2022a, MNRAS, 510, 3806
- Pognan et al. (2022b) Pognan Q., Jerkstrand A., Grumer J., 2022b, MNRAS, 513, 5174
- Smartt et al. (2017) Smartt S. J., et al., 2017, Nature, 551, 75
- Sneppen et al. (2023) Sneppen A., Watson D., Bauswein A., Just O., Kotak R., Nakar E., Poznanski D., Sim S., 2023, Nature, 614, 436
- Tanaka & Hotokezaka (2013) Tanaka M., Hotokezaka K., 2013, ApJ, 775, 113
- Tanaka et al. (2020) Tanaka M., Kato D., Gaigalas G., Kawaguchi K., 2020, MNRAS, 496, 1369
- Tanvir et al. (2017) Tanvir N. R., et al., 2017, Astrophys. J., 848, L27
- Tarumi et al. (2023) Tarumi Y., Hotokezaka K., Domoto N., Tanaka M., 2023, arXiv e-prints, p. arXiv:2302.13061
- Troja et al. (2017) Troja E., et al., 2017, Nature, 551, 71
- Villar et al. (2018) Villar V. A., et al., 2018, ApJ, 862, L11
- Watson et al. (2019) Watson D., et al., 2019, Nature, 574, 497
- Waxman et al. (2019) Waxman E., Ofek E. O., Kushnir D., 2019, ApJ, 878, 93
- Wooden et al. (1993) Wooden D. H., Rank D. M., Bregman J. D., Witteborn F. C., Tielens A. G. G. M., Cohen M., Pinto P. A., Axelrod T. S., 1993, ApJS, 88, 477