Anelasticity to plasticity transition in a model two-dimensional amorphous solid ††thanks: Project supported by Guangdong Major Project of Basic and Applied Basic Research, China (Grant No.2019B030302010),the NSF of China (Grant No.52130108), Guangdong Basic and Applied Basic Research, China (Grant No.2021B1515140005), Pearl River Talent Recruitment Program (Grant No.2021QN02C04).
Abstract
Anelasticity, as an intrinsic property of amorphous solids, plays a significant role in understanding their relaxation and deformation mechanism. However, due to the lack of long-range order in amorphous solids, the structural origin of anelasticity and its distinction from plasticity remain elusive. In this work, using frozen matrix method, we study the transition from anelasticity to plasticity transition in a two-dimensional model glass. Three distinct mechanical behaviours, namely elasticity, anelasticity, and plasticity, are identified with control parameters in the amorphous solid. Through the study of finite size effects on these mechanical behaviors, it is revealed that anelasticity can be distinguished from plasticity. Anelasticity serves as an intrinsic bridge connecting the elasticity and plasticity of amorphous solids. Additionally, it is observed that anelastic events are localized, while plastic events are subextensive. The transition from anelasticity to plasticity is found to resemble the entanglement of long-range interactions between element excitations. This study sheds light on the fundamental nature of anelasticity as a key property of element excitations in amorphous solids.
Keywords: amorphous solid; deformation mechanism; anelasticity to plasticity transition; molecular dynamics simulation
PACS: 61.43.-j;62.40.+i;71.55.Jv
1 Introduction
Amorphous solids, as non-equilibrium materials, have captivated the interest of both academic researchers and industrial applications due to their diverse deformation behaviors \uciteSchuh20074067,Wang2012a,hufnagel2016deformation. However, unlike crystalline materials, the underlying deformation mechanism in amorphous solids remains a topic of debate. While crystalline materials exhibit topological defects such as dislocations or grain boundaries as plasticity carriers, amorphous solids rely on shear transformations or rearrangement events rather than specific topological structures\uciteCheng2011379,barrat2011heterogeneities,RevModPhys.90.045006.
Previous studies\uciteargon1979plastic,PhysRevLett.95.095502,schall2007structural,PhysRevE.82.055103,PhysRevE.96.033002 have observed that rearrangement events in amorphous solids are localized and can occur within the apparent elastic regime. However, considering plastic rearrangements as excitation elements is inappropriate due to their entanglement with long-range elastic interactions and plastic events\ucitePhysRevE.79.066109,PhysRevLett.93.016001,krisponeit2014crossover,PhysRevLett.112.155501,Lagogianni2018,Shang2019,PhysRevMaterials.7.013601. Consequently, identifying the excitation element in amorphous solids remains a topic of ongoing debate\ucitebarrat2011heterogeneities,argon2013strain.
Furthermore, it is crucial to note that not all rearrangement events in amorphous solids exhibit irreversible plastic behavior. Recently, a new type of rearrangement event characterized by an intrinsic anelastic nature has garnered significant attention\ucitexu2017strain,PhysRevMaterials.4.113609,PhysRevE.102.033006,Regev2015. Unlike plastic events, these anelastic rearrangements are reversible during the loading-unloading process. They play a vital role in influencing various mechanical properties of amorphous solids, including relaxation \ucitePhysRevLett.99.135502,Wang2019, thermal cycling rejuvenation\uciteCosta2022anelastic, mechanical anisotropy\ucitePhysRevB.48.3048,Shang2022cycle , and memory effect\ucitePhysRevE.88.062401,PhysRevLett.112.025702.
However, the understanding of the discrepancies and connections between anelastic and plastic events, as well as the key parameters governing the transition from anelasticity to plasticity, remain elusive. Further investigations are necessary to unravel the underlying mechanisms and establish a comprehensive understanding of the relationship between these two deformation modes in amorphous solids.
In this study, we aim to address these questions through molecular dynamics simulations. We investigate the mechanical response of amorphous solids using athermal quasistatic shear and frozen matrix methods. Our focus is on observing the transition from anelasticity to plasticity and understanding the underlying mechanisms. By analyzing the characterized parameters, we identify three distinct deformation modes: elasticity, anelasticity, and plasticity. Specifically, we explore the effects of finite system size on these parameters. Our findings reveal that anelasticity precedes plasticity and serves as a critical intermediary between elasticity and plasticity. Furthermore, we observe that anelastic events, characterized by their system size independence, exhibit a localized nature within the material. On the other hand, plastic events display subextensive behavior. This suggests that plasticity emerges from the collective interaction of a series of anelastic events. As a result, anelastic events can be regarded as potential element excitations in amorphous solids.
2 Method
2.1 Initial sample preparation
We used a well studied two dimensional binary Lenard-Jones model with a polymoinal cutoff smooth \ucitePhysRevE.97.033001,PhysRevMaterials.4.113609 to investigate the mechanical property of amorphous solid. All units were expressed in terms of the mass and the two parameters describing the energy and length scales of interspecies interaction, and and the Boltzmann constant , respectively. Therefore, time was measured in units of , and temperature was measured in units of . The composition ratio of large () and small () was . 100 samples each containing atoms with periodic boundary condition, were obtained by quenching from to with constant volume, and quench rate was fixed at 0.0000325 , and then the initial sample was obtained by minimized the quenched sample with conjugate gradient (CG) method, where the fictive temperature of the sample is around 0.335. The reduce density of system was fixed at 1.02. All the results were presented in reduced units. We performed all the simulations using the LAMMPS molecular dynamics package\uciteThompson2022, and used the OVITO package\uciteStukowski2009VisualizationAA for atomic visualization.
2.2 Frozen matrix method
Frozen matrix method is a useful tool to investigate the local yield stress\ucitePhysRevLett.117.045501 or local modulus\ucitePhysRevE.87.042306 of the amorphous system, and local relaxation time\uciteShang2019 of supercooled liquid, it can also use to study the thermaly activated rearrangement\ucitePhysRevLett.129.195501 and to calibrate more quantitatively elastoplastic models\uciteFernndezCastellanos2021, even for different preparation protocol\uciteCastellanos2022. Here, we extent this method to study the anelasticity to plasticity transition in the amorphous solid. The investigated region was selected within a radius , then the outside region was frozen with affine deformation (Figure 1 (a)). In this study, the investigated region is fixed at the center of each sample. The mechanical response of amorphous solid was probed by the athermal quasi-static shear (AQS) protocol. The simple shear deformation was performed in all regions and the shear strain increment was , during each shear strain increment, the investigated region was relaxed by energy minimization, and the outside region was frozen with affine deformation. The loading process continues until the shear strain reaches to 0.3. The choice of 0.3 is not grounded in specific physical reasoning; rather, it was selected to ensure that all investigated samples exhibit a transition from anelasticity to plasticity.
2.3 Physical property characterization
2.3.1 anelastic event and plastic event
During the loading process, stress and potential energy drops occur (Figure 1 (b),(c)), which are caused by rearrangement events (Figure 1 (d)). A rearrangement event is defined as when the maximum atomic displacement exceeds 0.1, or the potential energy drop per atom is greater than 0.1, in the investigated region. To characterize the anelastic and plastic events, the following unloading process was performed. After each potential energy drop, the shear strain was reversed and sheared back to , which is called the unloaded sample. The mean squared displacement (MSD) between the unloaded sample and the initial sample was compared, and if MSD was zero, the drop was an anelastic event; otherwise, it was a plastic event. The potential energy per atom and the shear stress of the investigated region were monitored during the loading and unloading process, and the shear strain increment was fixed at .
2.3.2 atomic displacement
To compare configuration 1 and configuration 2, the atomic displacement of atom is defined as , where is the coordination vector of atomic at configuration 1. The MSD between two configuration can be defined as , where is the atomic number in the investigation region.
3 Method
3.1 Initial sample preparation
We used a well studied two dimensional binary Lenard-Jones model with a polymoinal cutoff smooth \ucitePhysRevE.97.033001,PhysRevMaterials.4.113609 to investigate the mechanical property of amorphous solid. All units were expressed in terms of the mass and the two parameters describing the energy and length scales of interspecies interaction, and and the Boltzmann constant , respectively. Therefore, time was measured in units of , and temperature was measured in units of . The composition ratio of large () and small () was . 100 samples each containing atoms with periodic boundary condition, were obtained by quenching from to with constant volume, and quench rate was fixed at 0.0000325 , and then the initial sample was obtained by minimized the quenched sample with conjugate gradient (CG) method, where the fictive temperature of the sample is around 0.335. The reduce density of system was fixed at 1.02. All the results were presented in reduced units. We performed all the simulations using the LAMMPS molecular dynamics package\uciteThompson2022, and used the OVITO package\uciteStukowski2009VisualizationAA for atomic visualization.
3.2 Frozen matrix method
Frozen matrix method is a useful tool to investigate the local yield stress\ucitePhysRevLett.117.045501 or local modulus\ucitePhysRevE.87.042306 of the amorphous system, and local relaxation time\uciteShang2019 of supercooled liquid, it can also use to study the thermaly activated rearrangement\ucitePhysRevLett.129.195501 and to calibrate more quantitatively elastoplastic models\uciteFernndezCastellanos2021, even for different preparation protocol\uciteCastellanos2022. Here, we extent this method to study the anelasticity to plasticity transition in the amorphous solid. The investigated region was selected within a radius , then the outside region was frozen with affine deformation (Figure 1 (a)). In this study, the investigated region is fixed at the center of each sample. The mechanical response of amorphous solid was probed by the athermal quasi-static shear (AQS) protocol. The simple shear deformation was performed in all regions and the shear strain increment was , during each shear strain increment, the investigated region was relaxed by energy minimization, and the outside region was frozen with affine deformation. The loading process continues until the shear strain reaches to 0.3. The choice of 0.3 is not grounded in specific physical reasoning; rather, it was selected to ensure that all investigated samples exhibit a transition from anelasticity to plasticity.
3.3 Physical property characterization
3.3.1 anelastic event and plastic event
During the loading process, stress and potential energy drops occur (Figure 1 (b),(c)), which are caused by rearrangement events (Figure 1 (d)). A rearrangement event is defined as when the maximum atomic displacement exceeds 0.1, or the potential energy drop per atom is greater than 0.1, in the investigated region. To characterize the anelastic and plastic events, the following unloading process was performed. After each potential energy drop, the shear strain was reversed and sheared back to , which is called the unloaded sample. The mean squared displacement (MSD) between the unloaded sample and the initial sample was compared, and if MSD was zero, the drop was an anelastic event; otherwise, it was a plastic event. The potential energy per atom and the shear stress of the investigated region were monitored during the loading and unloading process, and the shear strain increment was fixed at .
3.3.2 atomic displacement
To compare configuration 1 and configuration 2, the atomic displacement of atom is defined as , where is the coordination vector of atomic at configuration 1. The MSD between two configuration can be defined as , where is the atomic number in the investigation region.
4 Results and Discussions
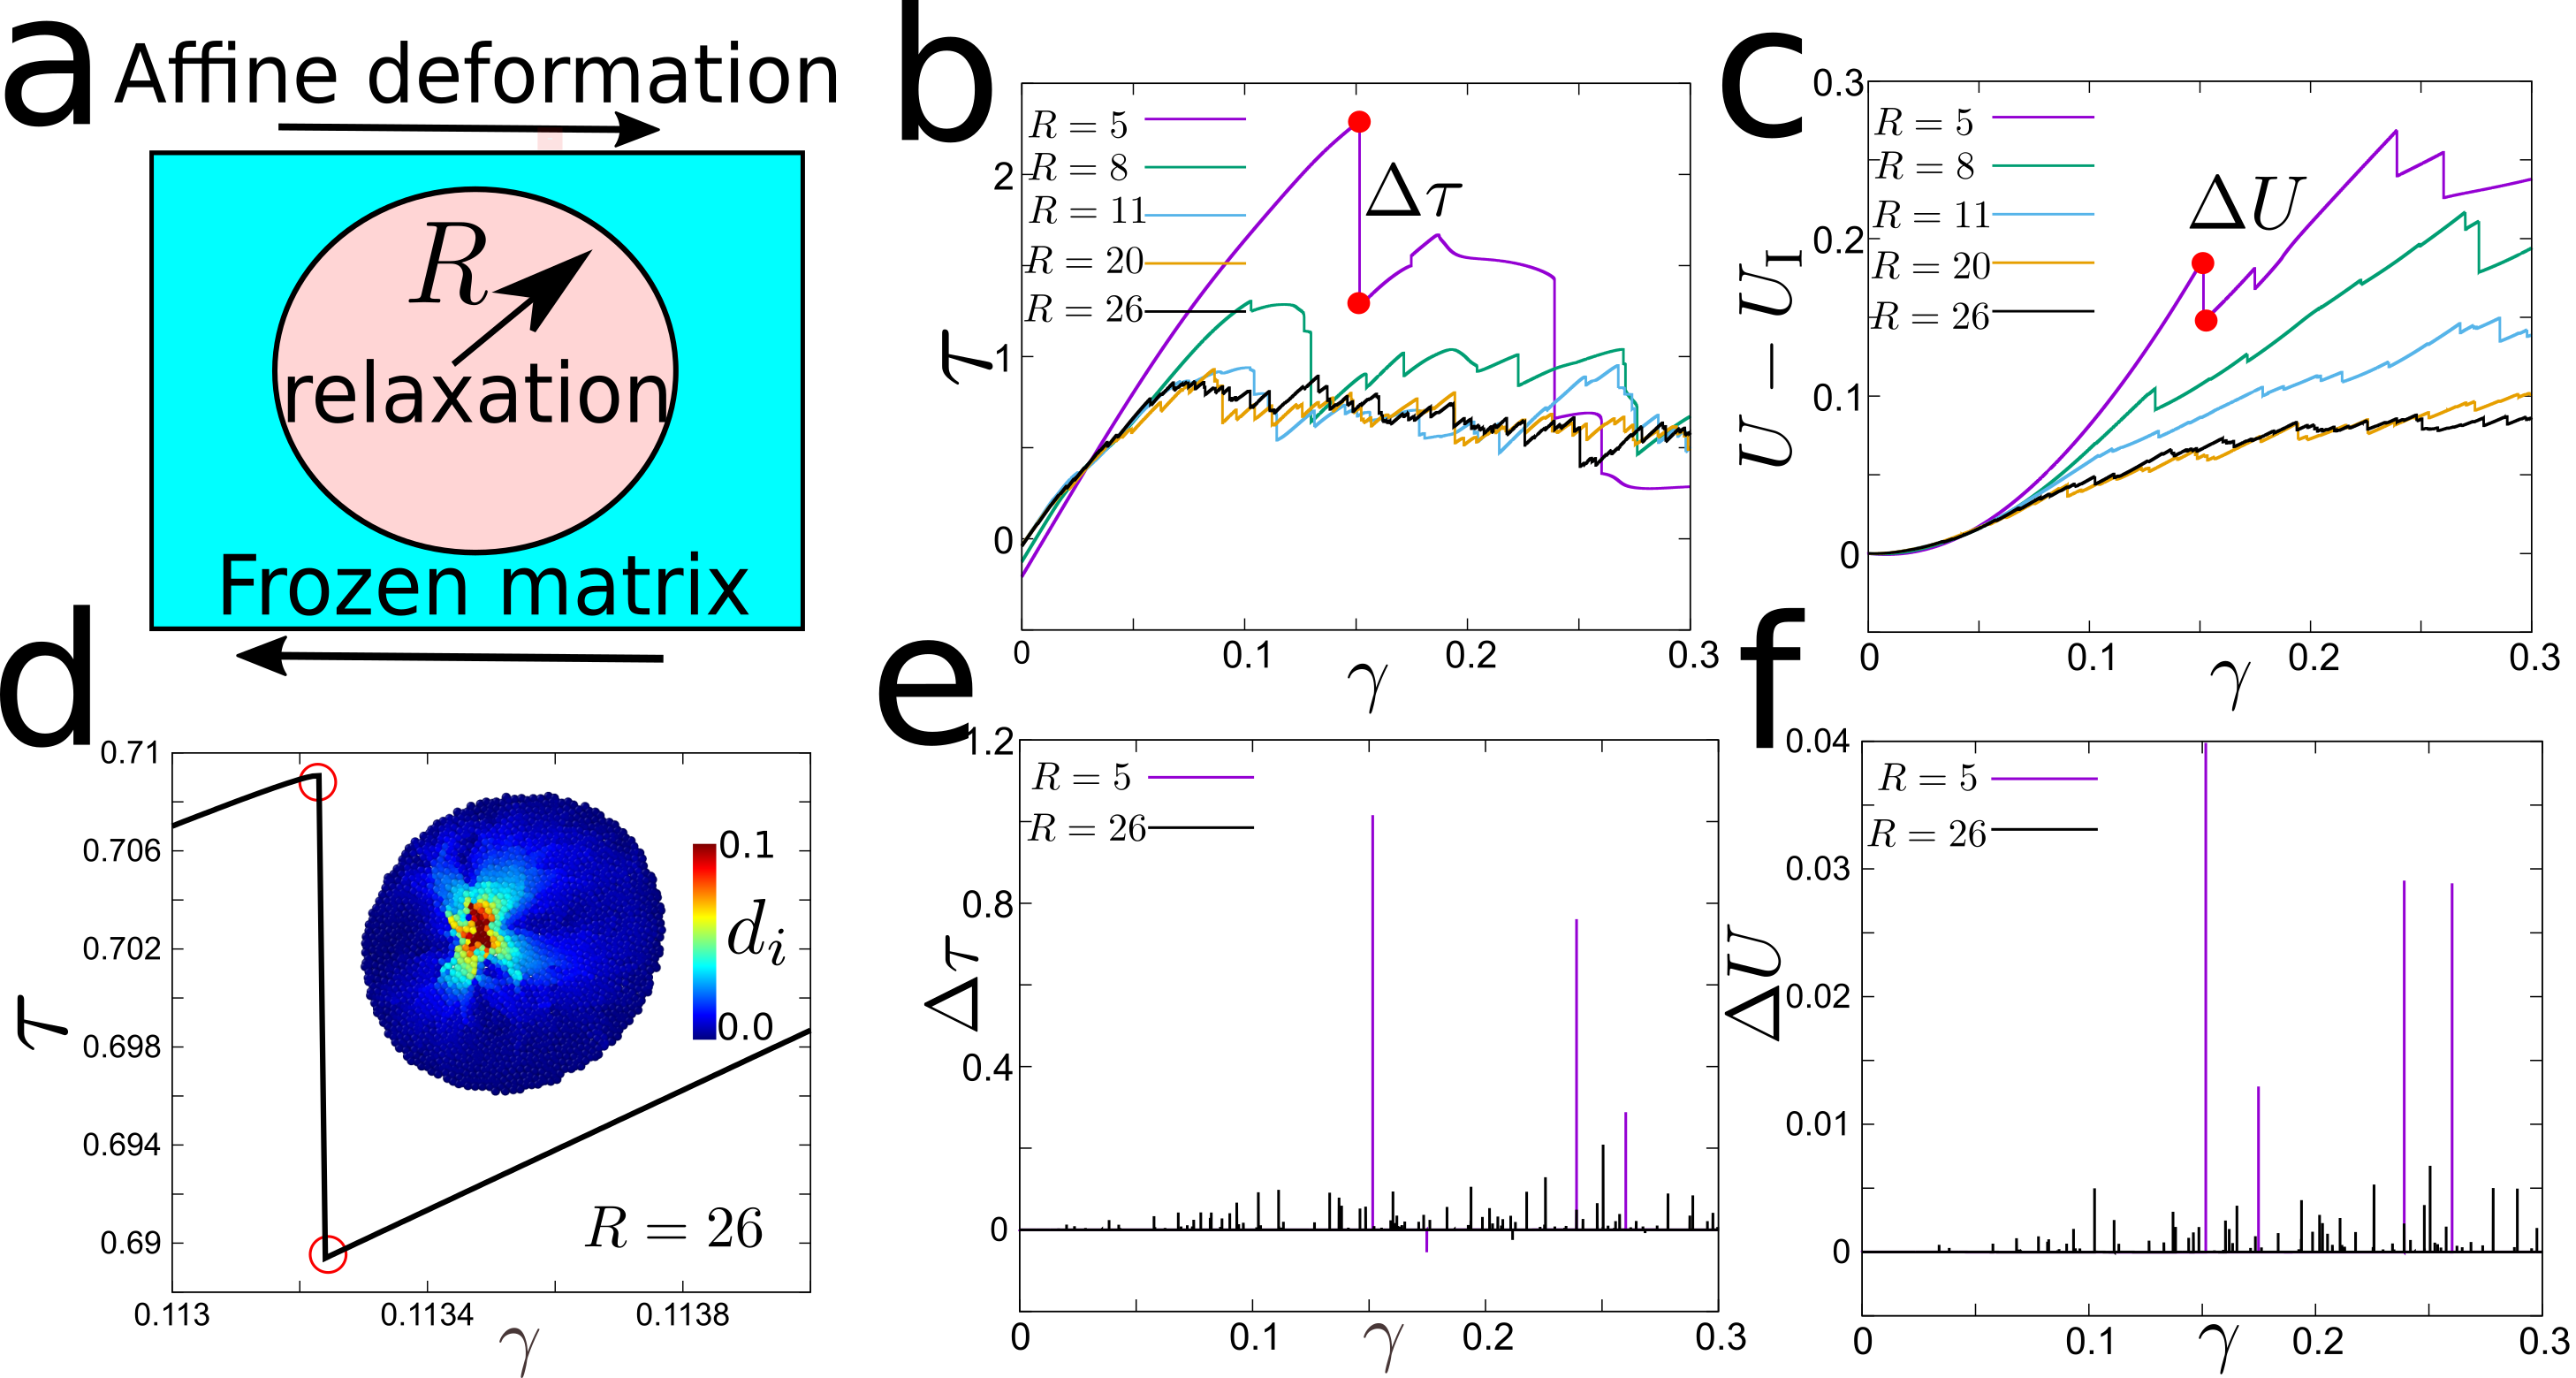
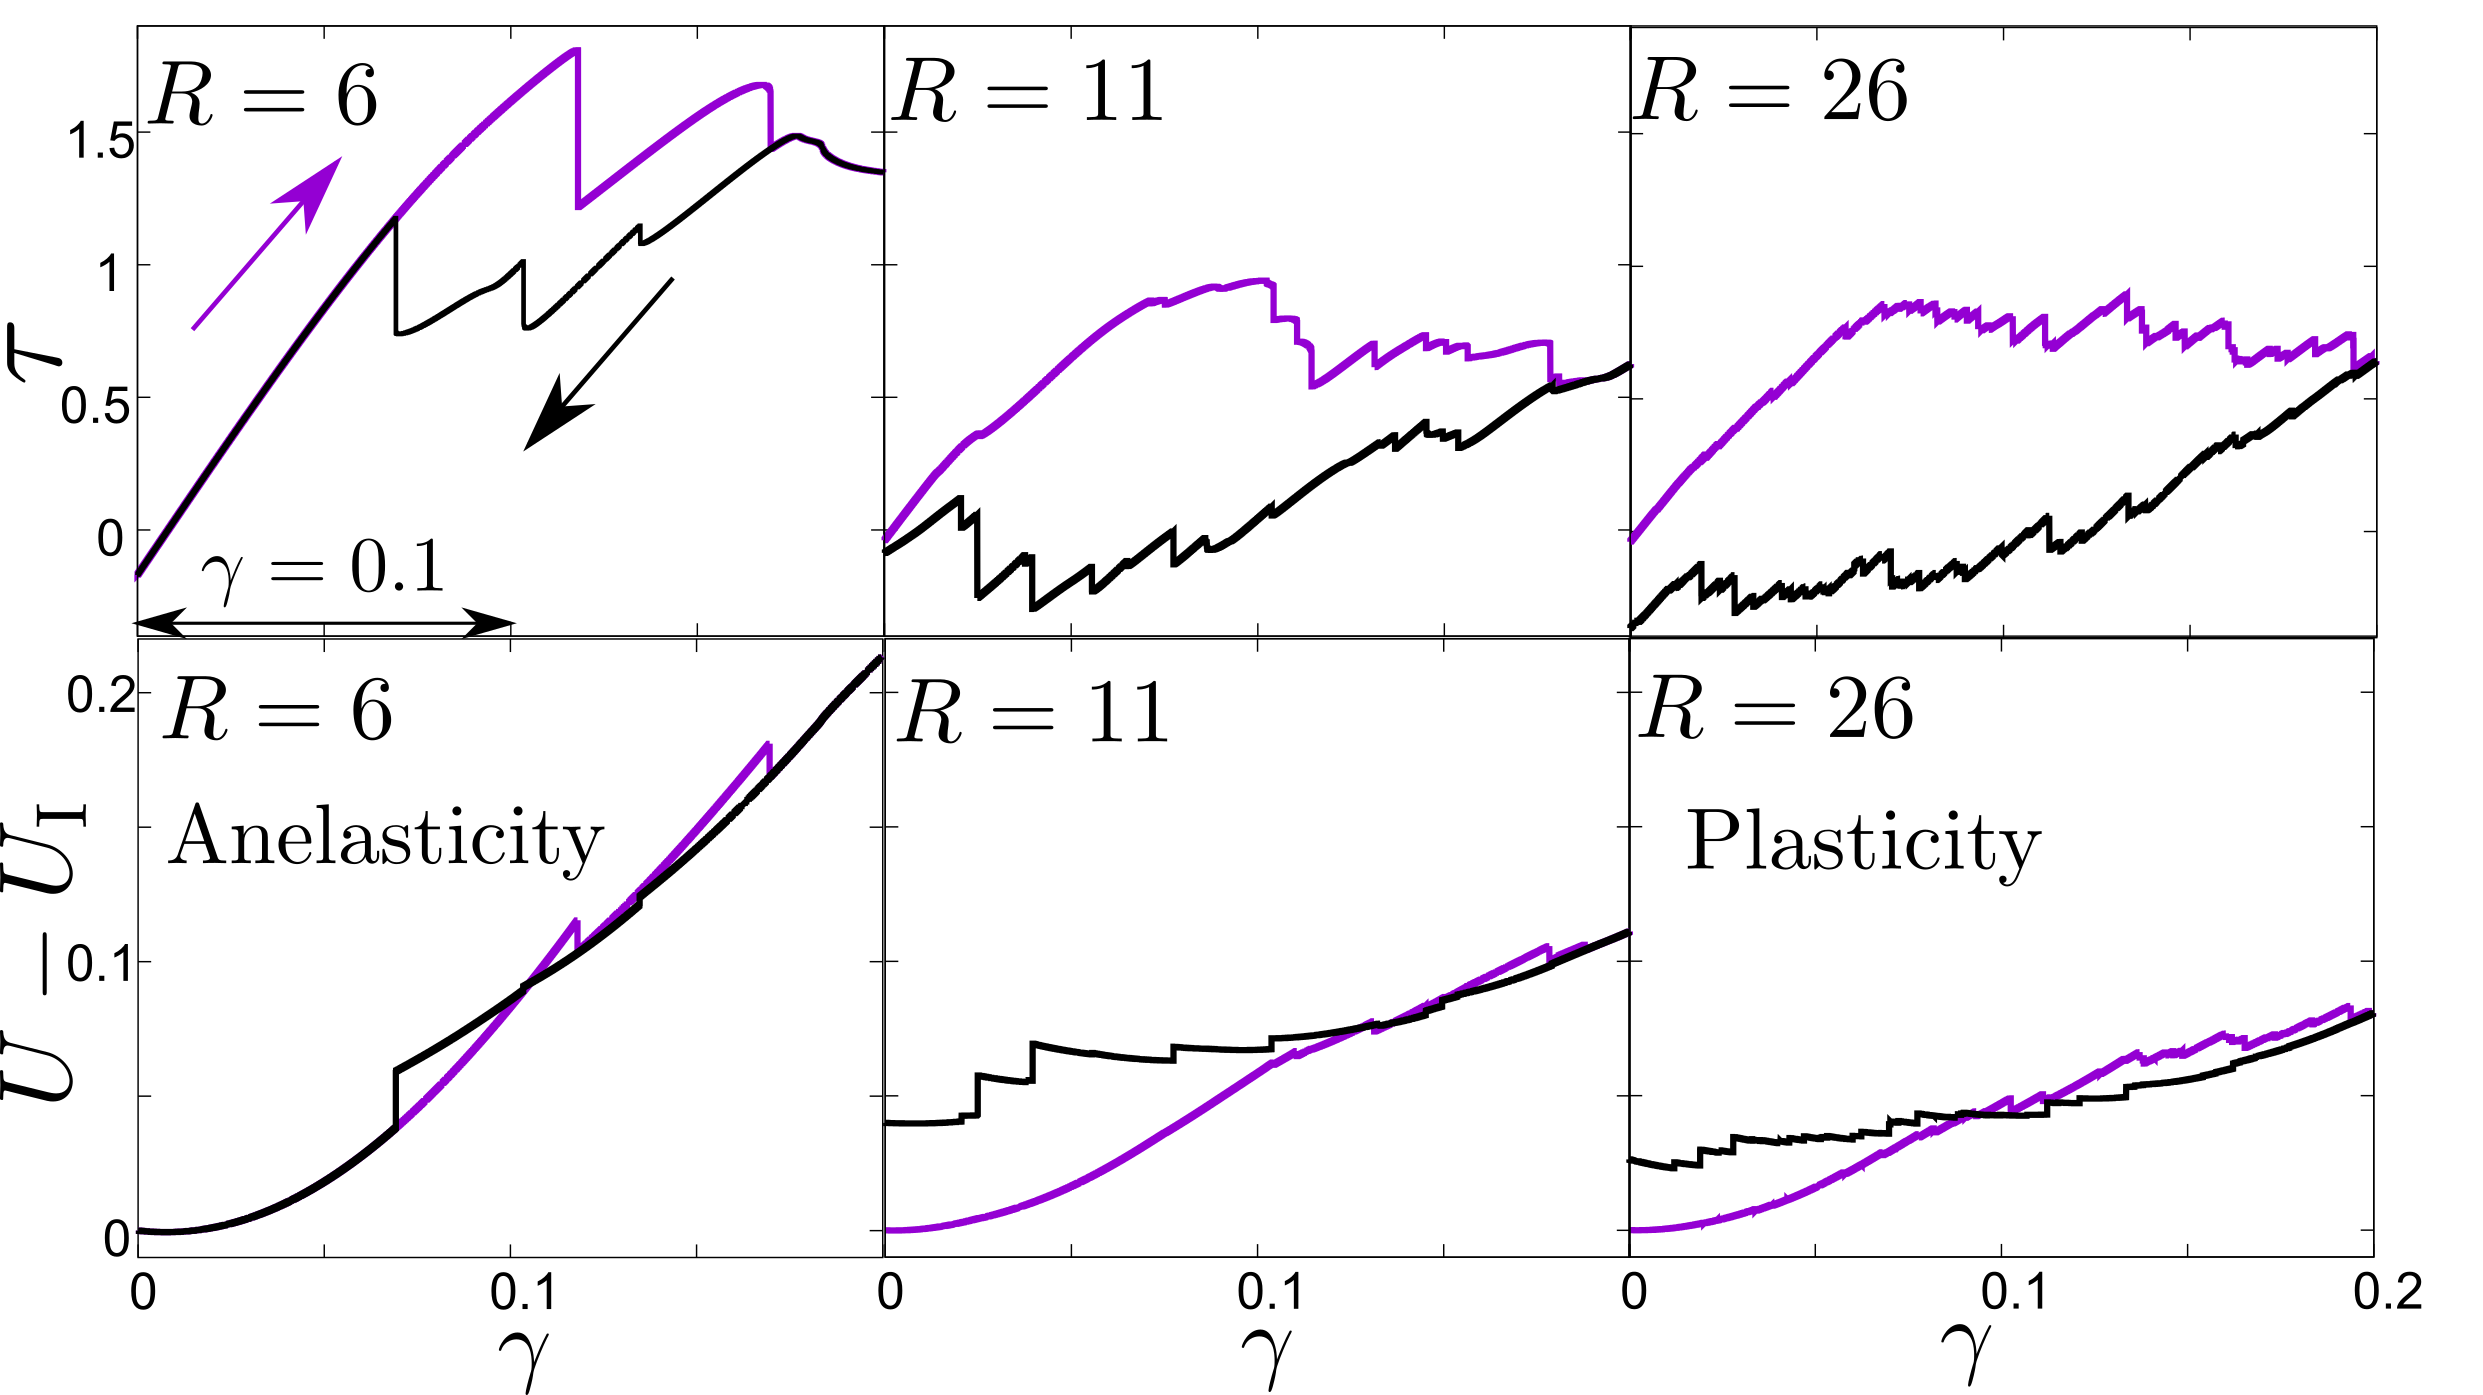
Figure 1 shows the loading process of the amorphous solid with various system sizes. There are notable finite size effects with frozen matrix boundary condition, both the frequency of stress drop and potential energy drop per atom increases with system size . Conversely, the amplitude of and decreases with system size (Figure 1 e,f). During the stress drop (Figure 1 e), the atomic displacement shows a typical quadrupolar symmetry. This is qualitatively consistent with the situation with periodic boundary condition \ucitelemaitre2006sum,PhysRevE.82.055103. However, the frozen matrix boundary condition not only blocks the long range elastic interaction from outside region, but also causes significant confinement effect\uciteShang2019. As suggested by Regev et al \uciteRegev2015, the confinement effect can lead to reversible rearrangement. As shown in Figure 2 , for system, both the stress and potential energy state are fully recovered after the loading-unloading process, indicating an anelastic behavior. In contrast, for system, both the stress and potential energy states are different from the initial state, indicating a plastic behavior. Interestingly, for system, the stress state is almost recovered but the energy state is not. This behavior can be attributed to the confinement effect of the frozen matrix boundary, and it signifies a transition from anelasticity to plasticity controlled by the system size. Increasing the system size weakens the confinement effect, thereby influencing the nature of the deformation response.
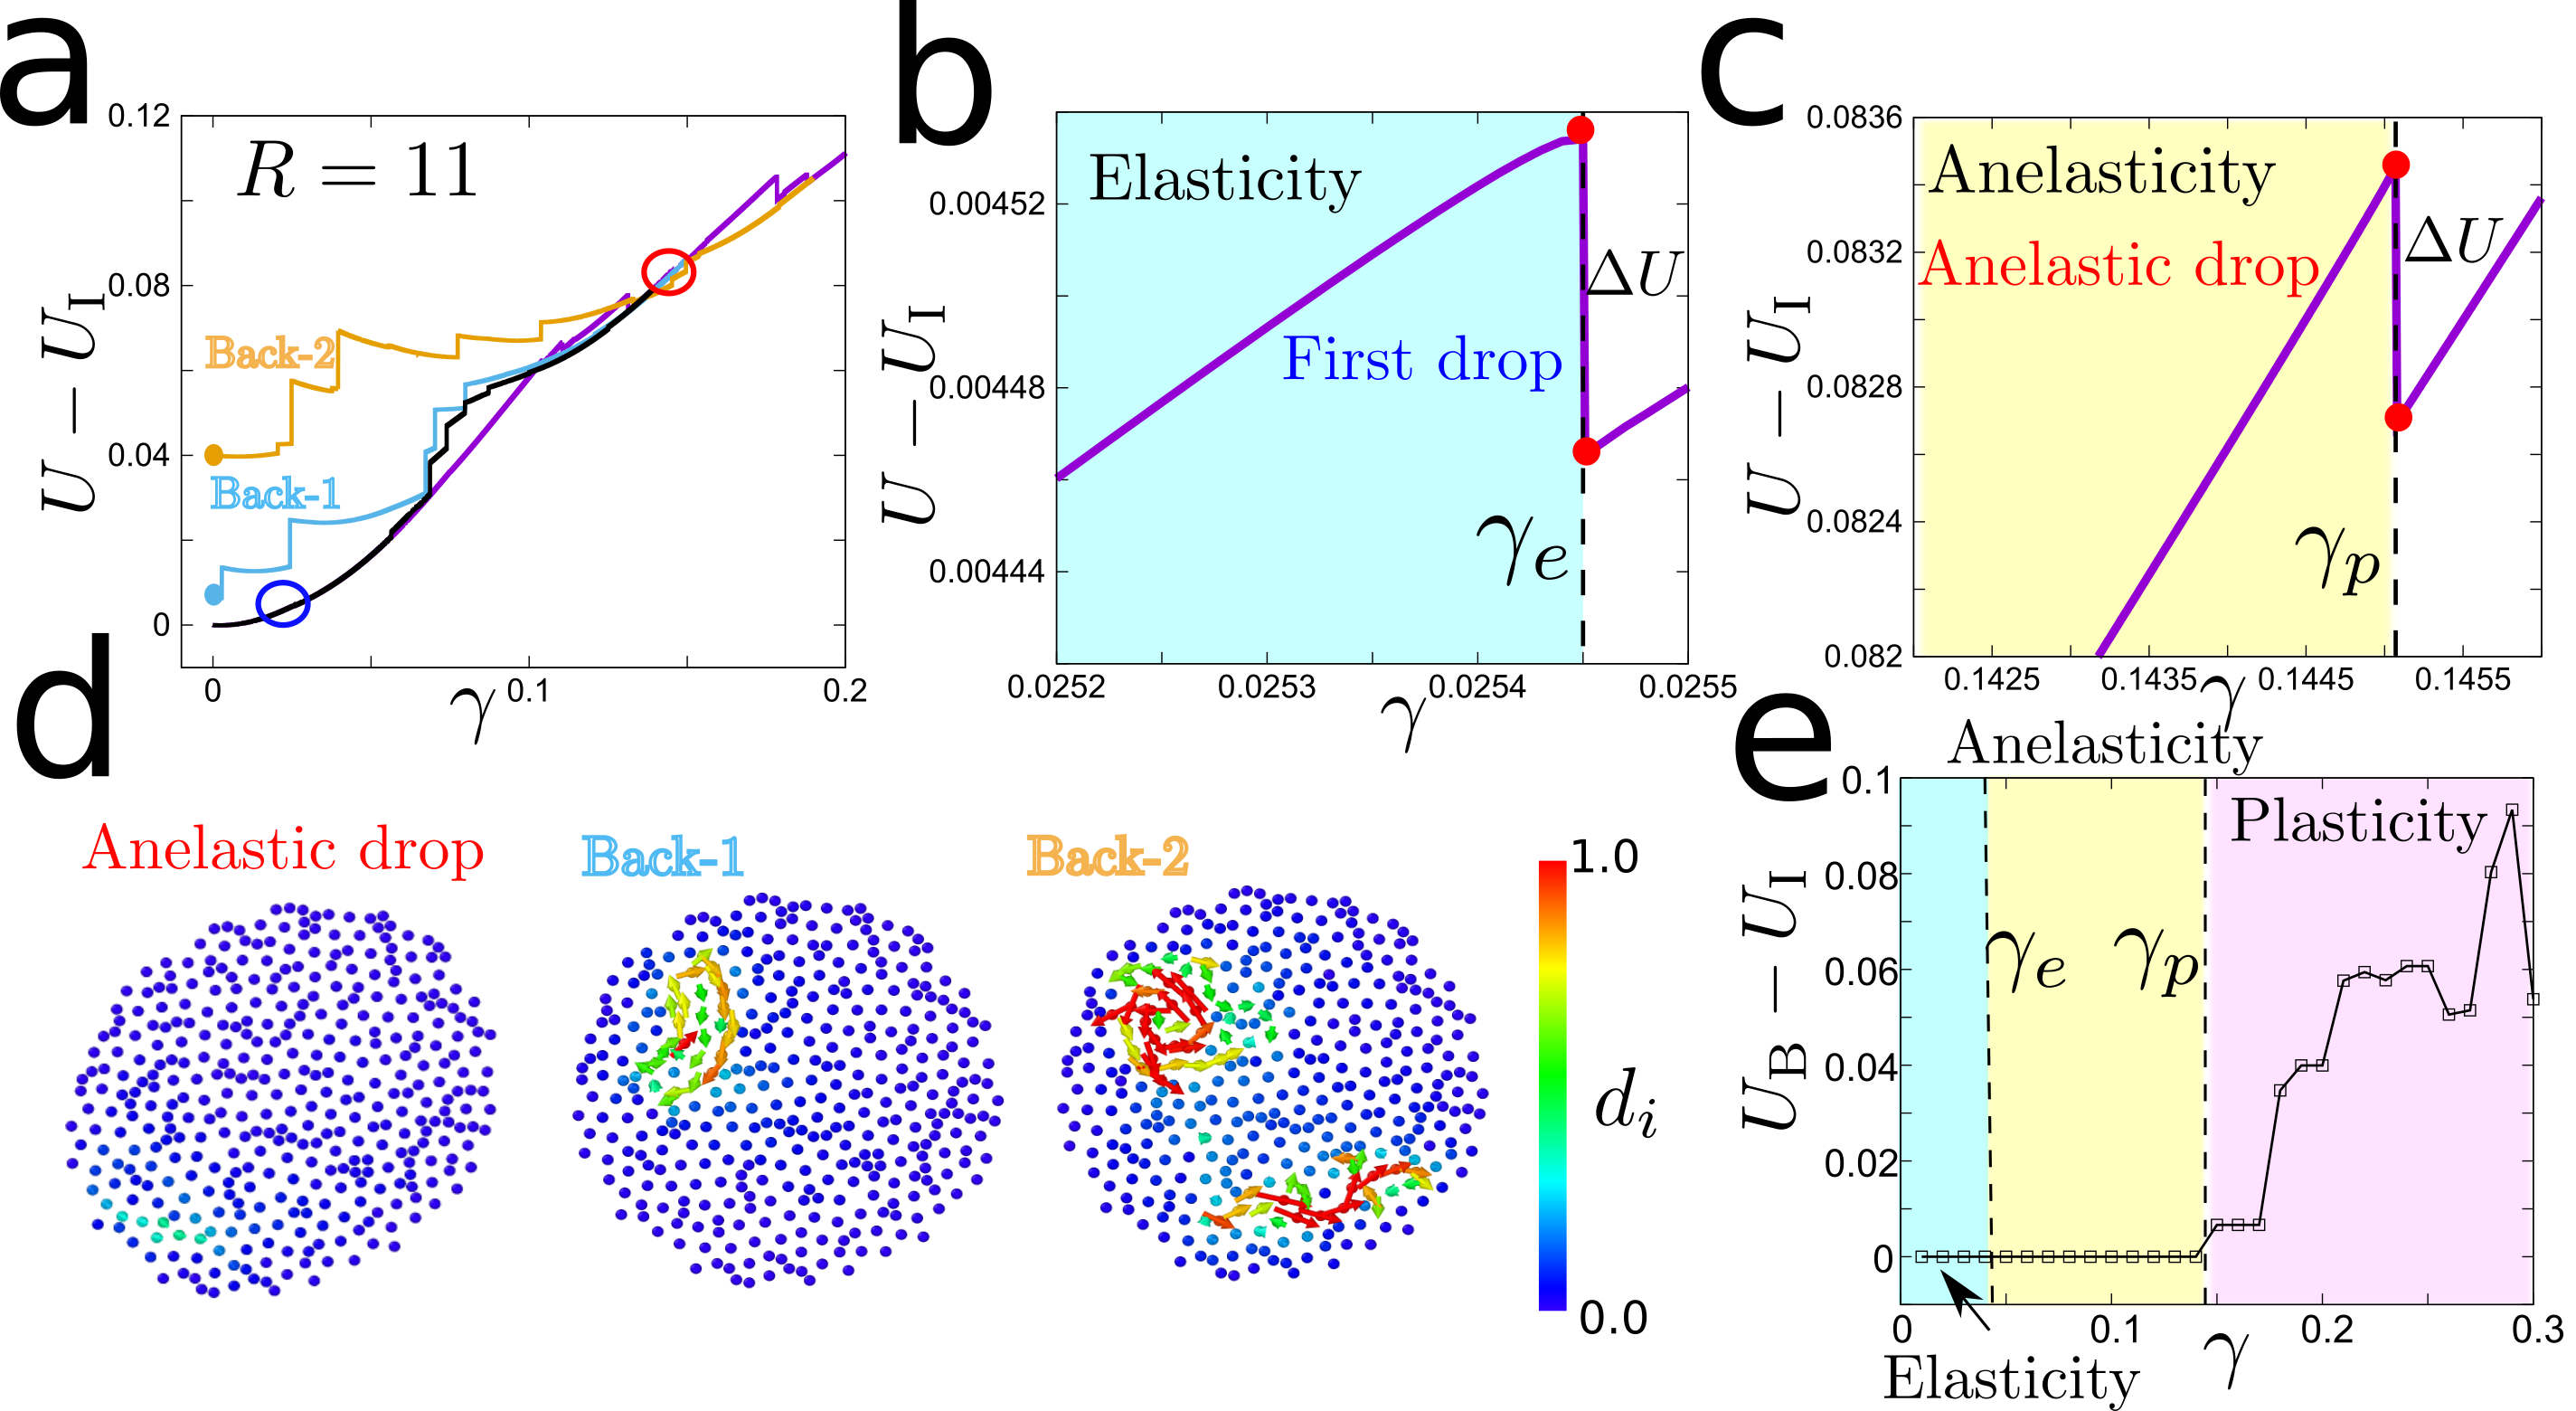
Moreover, it should be noted that for a given system size, the increase in strain can also lead to a transition from anelasticity to plasticity. This behavior is depicted in Figure 3, which illustrates the loading process with various unloading processes for a system size of . When the unloading process starts from a strain value of , the potential energy of the system can be fully recovered to its initial state. However, when the unloading process starts from or , the potential energy of the unloaded samples (Back-1, Back-2) is higher than the initial state (Figure 3(a)). The loading process exhibits a characteristic first drop strain, denoted as (Figure 3(b)). When the loading strain is smaller than , the loading-unloading process can be fully recovered. This behavior is indicative of elasticity, where no dissipation () occurs during the loading phase.
In addition, when the loading strain exceeds , the potential energy-strain curve exhibits sudden drops, indicating atomic rearrangement events. These energy drops are further examined through the unloading process. The last energy drop corresponding to an anelastic event can be identified (Figure 3(c)). The loading process exhibits a last anelastic drop strain denoted as . For loading strains between and , the loading-unloading process can be fully recovered, but dissipation occurs. When the loading strain exceeds , the unloaded sample cannot be fully recovered to its initial state, and plastic rearrangement takes place. The displacement color map of the anelastic drop is presented in Figure 3(d). A comparison of the atomic displacement during the anelastic drop with the plastic displacement of Back-1 and Back-2 samples reveals that the atomic displacement during the anelastic drop is reversible, while plastic rearrangement results in permanent displacement. By comparing the energy of the unloaded sample with the initial state, three types of mechanical property during the loading process can be identified: elasticity, anelasticity, and plasticity (Figure 3(e)).
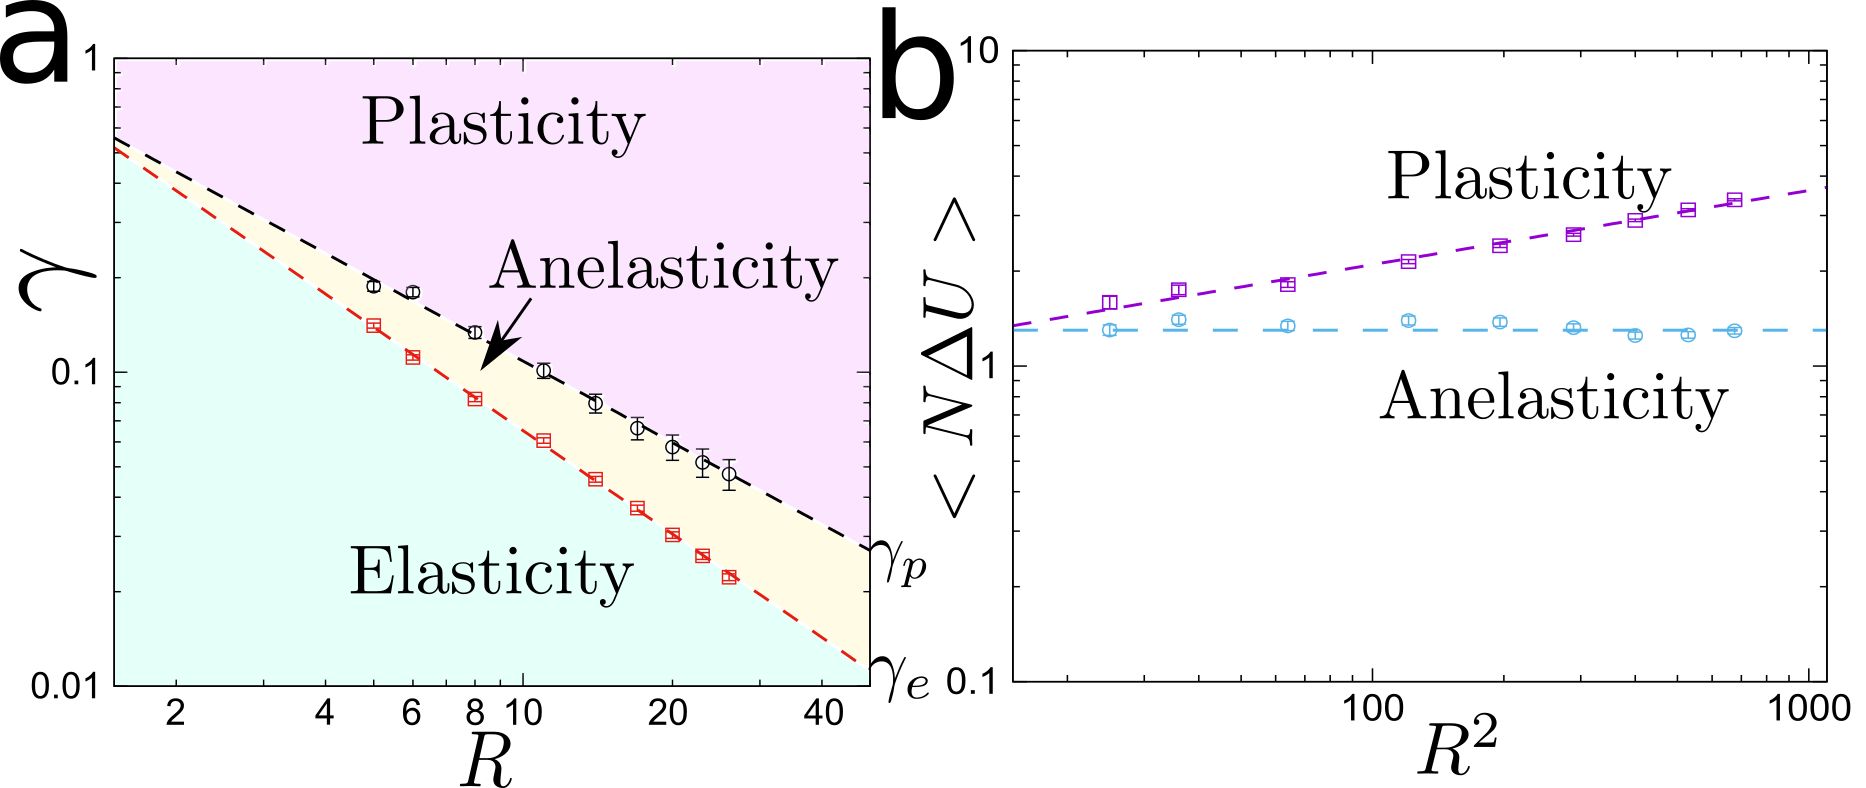
The anelasticity to plasticity transition is both controlled by system size and loading strain , and the key parameters for the transition are and . Figure 4 (a) shows the mean value of and decreases with system size , and the finite size effect can be well depicted by a powerlaw formula , for and , respectively. The discrepancy of exponent between and reveals that, as the system size increase, the anelastic property will be more significant. It will dominate the deformation of the apparent elastic region. Furthermore, for thermodynamic limit , both of elasticity and anelasticity will be disappeared, and the intrinsic mechanical property of amorphous solid is inelasticity, this is consistent with the observation of avalanche statistics in the apparent elastic region\uciteShang2019. It confirms that regardless of boundary condition, the nature of amorphous solid is inelastic.
The finite size exponent can determent the property of avalanche statistic, and the avalanche size is defined as . The boundary between anelasticity and plasticity is marked by . Avalanches during loading between and are anelastic; beyond this range, they are plastic. Figure 4 (b) illustrates avalanche size statistics. Plastic avalanches grow with system size, while anelastic ones stay constant regardless of size. It reveals the anelastic avalanche is localized event, which is distinguished with the sub-extensitive nature of plastic avalanche\ucitePhysRevLett.93.016001,PhysRevE.79.066109. The anelastic event can be recognized as the basin hopping within a metabasin based on the view of potential energy landscape\ucitePhysRevLett.99.135502,PhysRevE.98.033002, and the accumulation of basin hopping would arouse metabasin hopping, it means the plastic event can be only triggered when the strain is larger than . Therefore, the anelasticity can be identified as the activation of element excitation, such as STZ\ucitePhysRevE.82.055103 or fluid units\uciteWang2018, and the sub-extensitive plasticity is composed of the element excitation, and entangled with long range elasticity.
5 Conclusion
In summary, our study focused on understanding the transition from anelasticity to plasticity in amorphous solids. We employed molecular dynamics simulations using athermal quasistatic shear and frozen matrix methods. By analyzing various parameters, we identified three distinct deformation modes: elasticity, anelasticity, and plasticity. We found that anelasticity acts as a critical intermediary between elasticity and plasticity, and it precedes the onset of plastic deformation. The transition from anelasticity to plasticity is influenced by both the system size () and the applied loading strain (). We characterized this transition using key parameters and . The transition from anelasticity to plasticity occurs when the loading strain exceeds . Anelastic events were found to exhibit localized behavior, while plastic events exhibited subextensive behavior.
Our findings suggest that plasticity arises from the interaction of a series of anelastic events, with anelastic events acting as potential element excitations in amorphous solids. The transition from anelasticity to plasticity is influenced by system size and loading strain, and the properties of avalanche statistics depend on the system size and the distinction between anelastic and plastic avalanches.
References
- [1] Schuh C, Hufnagel T and Ramamurty U. 2007 Acta Mater., 55, 4067
- [2] Wang W H. 2012 Prog. Mater. Sci, 57, 487
- [3] Hufnagel T, Schuh C, and Falk M. 2016 Acta Mater., 109, 375
- [4] Cheng Y Q and Ma E. 2011 Prog. Mater. Sci, 56, 379
- [5] Barrat J and Lemaitre A. 2011 Heterogeneities in amorphous systems under shear., (Oxford University Press) pp. 246
- [6] Nicolas A, Ferrero E, Martens K and Barrat J. 2018 Rev. Mod. Phys.,90, 045006
- [7] Argon A. 1979 Acta metallurgica, 27, 47
- [8] Shi Y F and Falk M. 2005 Phys. Rev. Lett., 95, 095502
- [9] Schall P, Weitz D and Spaepen F. 2007 Science, 318, 1895
- [10] Karmakar S, Lerner E and Procaccia I. 2010 Phys. Rev. E, 82, 055103
- [11] Lin J and Zheng W. 2017 Phys. Rev. E, 96, 033002
- [12] Lerner E and Procaccia I. 2009 Phys. Rev. E, 79, 066109
- [13] Maloney C and Lemaitre A. 2004 Phys. Rev. Lett., 93, 016001
- [14] Krisponeit J, Pitikaris S, Avila K, Küchemann S, Krüger A and Samwer K. 2014 Nat. Commun., 5, 3616
- [15] Antonaglia J, Wright W, Gu X J, Byer R, Hufnagel T, LeBlanc M, Uhl J and Dahmen K. 2014 Phys. Rev. Lett., 112, 155501
- [16] Lagogianni A, Liu C, Martens K and Samwer K. 2018 Eur. Phys. J. B, 91, 104
- [17] Shang B S, Rottler J, Guan P F and Barrat J. 2019 Phys. Rev. Lett., 122, 105501
- [18] Duan J, Wang Y J, Dai L H and Jiang M Q. 2023 Phys. Rev. Mater., 7, 013601
- [19] Argon A. 2013 Philos. Mag., 93, 3795
- [20] Xu B, Falk M, Li J F and Kong L T. 2017 Phys. Rev. B, 95, 144201
- [21] Richard D, Ozawa M, Patinet S, Stanifer E, Shang B S, Ridout S, Xu B, Zhang G, Morse P, Barrat J, Berthier L, Falk M, Guan P F, Liu A, Martens K, Sastry S, Vandembroucq D, Lerner E and Manning M. 2020 Phys. Rev. Mater., 4, 113609
- [22] Ebrahem F, Bamer F and Markert B. 2020 Phys. Rev. E, 102, 033006
- [23] Regev I, Weber J, Reichhardt C, Dahmen K and Lookman T. 2015 Nat. Commun., 6, 8805
- [24] Harmon J, Demetriou M, Johnson W, and Samwer K. 2007 Phys. Rev. Lett., 99, 135502
- [25] Wang W H. 2019 Prog. Mater. Sci, 106, 100561
- [26] Costa M, Londoño J, Blatter A, Hariharan A, Gebert A, Carpenter M , and Greer A. 2023 Acta Mater., 244, 118551
- [27] Tomida T and Egami T 1993 Phys. Rev. B, 48, 3048
- [28] Shang B S, Wang W H, and Guan P F. 2022 Acta Mater., 225, 117557
- [29] Regev I, Lookman T and Reichhardt C. 2013 Phys. Rev. E, 88, 062401
- [30] Fiocco D, Foffi G and Sastry S. 2014 Phys. Rev. Lett., 112, 025702
- [31] Barbot A, Lerbinger M, Hernandez-Garcia A, García-García R, Falk M, Vandembroucq D and Patinet S. 2018 Phys. Rev. E, 97, 033001
- [32] Thompson A, Aktulga H, Berger R, Bolintineanu D, Brown W, Crozier P, in t Veld J, Kohlmeyer A, Moore S, Nguyen T, Shan R, Stevens M, Tranchida J, Trott C and Plimpton S. 2022 Computer Physics Communications, 271, 108171
- [33] Stukowski A. 2009 Model. Simul. Mater. Sci. Eng., 18, 015012
- [34] Patinet S, Vandembroucq D and Falk M. 2016 Phys. Rev. Lett., 117, 045501
- [35] Mizuno H, Mossa S, and Barrat J. 2013 Phys. Rev. E, 87, 042306
- [36] Lerbinger M, Barbot A, Vandembroucq D and Patinet S. 2022 Phys. Rev. Lett., 129, 195501
- [37] Castellanos D, Roux S and Patinet S. 2021 Comptes Rendus. Physique, 22, 135
- [38] Castellanos D, Roux S and Patinet S. 2022 Acta Mater., 241, 118405
- [39] Lemaitre A and Maloney C. 2006 J. Stat. Phys., 123, 415
- [40] Blank-Burian M and Heuer A. 2018 Phys. Rev. E, 98, 033002
- [41] Wang Z and Wang W H. 2018 Natl. Sci. Rev., 6, 304