A study of extreme CIII]1908 & [OIII]88/[CII]157 emission in Pox 186: implications for JWST+ALMA (FUV+FIR) studies of distant galaxies
Abstract
Carbon spectral features are ubiquitous in the ultraviolet (UV) and far-infrared (FIR) spectra of galaxies in the epoch of reionization (EoR). We probe the ionized carbon content of a blue compact dwarf galaxy Pox 186 using the UV, optical, mid-infrared and FIR data taken with telescopes in space (Hubble, Spitzer, Herschel) and on the ground (Gemini). This local (z0.0040705) galaxy is likely an analogue of EoR galaxies, as revealed by its extreme FIR emission line ratio, [O iii]/[C ii] (10). The UV spectra reveal extreme C iii] 1907, 1909 emission with the strongest equivalent width (EW) = 35.85 0.73 Å detected so far in the local (z0) Universe, a relatively strong C iv 1548, 1550 emission with EW = 7.95 0.45Å, but no He ii 1640 detection. Several scenarios are explored to explain the high EW of carbon lines, including high effective temperature, high carbon-to-oxygen ratio, slope and upper mass of top-heavy initial mass function, hard ionizing radiation and in-homogeneous dust distribution. Both C iii] and C iv line profiles are broadened with respect to the O iii] 1660 emission line. Each emission line of C iv 1548, 1550 shows the most distinct double-peak structure ever detected which we model via two scenarios, firstly a double-peaked profile that might emerge from resonant scattering and secondly a single nebular emission line along with a weaker interstellar absorption. The study demonstrates that galaxies with extreme FIR emission line ratio may also show extreme UV properties, hence paving a promising avenue of using FIR+UV in the local (via HST+Herschel/SOFIA) and distant (via JWST+ALMA) Universe for unveiling the mysteries of the EoR.
keywords:
galaxies:dwarfs – galaxies:abundances – galaxies:high-redshift1 Introduction
Understanding the reionization of the Universe is one of the frontier goals of modern astronomy. Several theoretical and observational efforts have been made to answer the related pressing questions such as when and how first galaxies formed (e.g., Stark2016) and whether these first galaxies reionized the intergalactic medium (IGM; e.g., Robertson2010). A first step to answer these questions is to search for the early galaxies in the epoch of reionization (EoR) and characterize their properties.
Deep imaging campaigns have been quite successful in searching for such sources. For example, the Hubble Space Telescope (HST) allowed us to compile large samples of early galaxies via deep near-infrared (NIR) imaging programs such as the Great Observatories Origins Deep Survey (GOODS, Giavalisco2004), Extreme Deep Field (XDF, Illingworth2013) and Cosmic Assemble Near-Infrared Deep Extragalactic Legacy Survey (CANDELS, Grogin2011; Koekemoer2011). However, spectroscopy is essential to characterize the properties of these sources. Until the launch of the James Webb Space Telescope (JWST), the rest-frame ultraviolet (UV) spectroscopy was available for only a few EoR galaxies (e.g., Sobral2015; Stark2017; Topping2021; Hutchison2019). The JWST observations are significantly improving the dearth of UV spectroscopy for the EoR galaxies via the planned follow-up spectroscopic surveys of the Hubble deep fields (Robertson2021; Curtislake2022; Bunker2023). Similarly, the exquisite sensitivity of the Atacama Large Millimeter Array (ALMA) has made it possible to obtain the far-infrared (FIR) spectroscopy of EoR galaxies (e.g., Maiolino2015; Carniani2017; Smit2018; Bouwens2022; Witstok2022). The combined JWST+ALMA spectroscopic observations will significantly enhance our understanding of the EoR.
An indirect approach to probe the nature of reionization sources while efficiently using the two simultaneously-operating state-of-the-art facilities, JWST and ALMA, is to perform detailed studies of the physical processes operating in local galaxies which might resemble EoR galaxies. Several different criteria have been devised so far to identify the local analogues of high-redshift galaxies, including gas-phase metallicity, star-formation rate, compactness, stellar mass, UV luminosity, dust attenuation, Ly emission, colour, and ionization state among many others. Some established classes of local analogues of high-redshift galaxies are blue compact dwarf galaxies (BCD, SearleSargent1972), green peas (GP, Cardamone2009) and blueberries (Yang2017), though it is not clear whether these galaxy populations also resemble the EoR galaxies, mainly because of the dearth of data available on EoR galaxies so far.
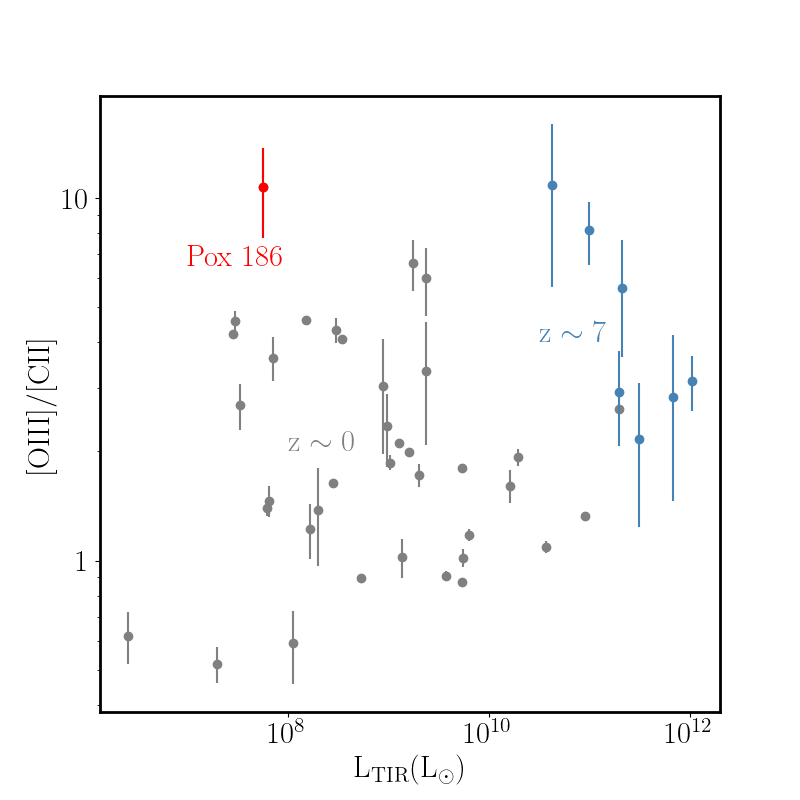
One of the goals of this paper is to demonstrate the use of FIR line ratio [O iii] /[C ii] for identifying the local analogues of the EoR galaxies. [O iii] originate from the ionized gas, [C ii] may originate from both the ionized as well as neutral interstellar medium (ISM), and their relative strengths (i.e. [O iii] /[C ii] line ratio) can potentially tell us about the porosity of ISM (Chevance2016; Polles2019). The ALMA observations of EoR galaxies (Figure 1, blue points) reveal that [O iii] /[C ii] line ratio may vary in the range 1–10, indicating a highly porous ISM which will facilitate the leakage of ionizing photons required for reionization of the neutral IGM. The Herschel Dwarf Galaxies Survey (Madden2013; Cormier2015) reveal a large population of local dwarf galaxies with [O iii] /[C ii] 1 (Figure 1, grey points), which are potentially the local analogues of EoR galaxies.
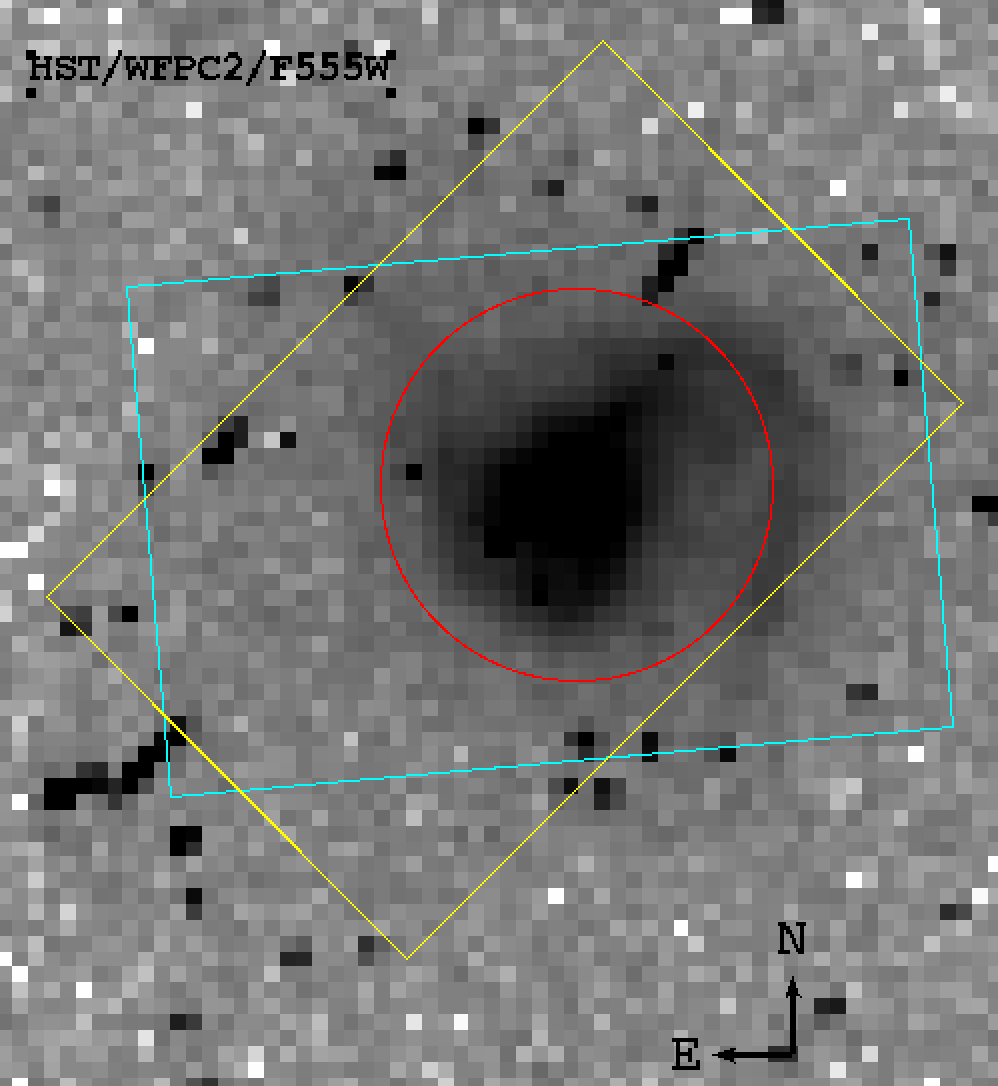
In an attempt to explore and establish using [O iii] /[C ii] as a criterion for identifying the EoR local analogues, we obtained HST UV and spatially-resolved optical spectroscopy of Pox 186, a unique dwarf galaxy showing the highest [O iii] /[C ii] ever detected in the local Universe (Figure 1, red point). Moreover, Ramambason2022 shows that this galaxy has an ionizing photon escape fraction of 40%, thus making it ideal for this study. Pox 186 was originally discovered in Kunth1981, and was thought to be a protogalaxy. Corbin2002 later shows that Pox186 is an ultra-compact galaxy still in the process of formation with a majority of star-formation concentrated in the central star cluster of mass 105 M⊙. Figure 2 shows a narrow-band optical image of Pox 186 taken with Wide Field Planetary Camera2 onboard HST, along with the field-of-view (FOV) of instruments of primary observations used in this work. Table 1 lists some of the main physical properties of Pox 186, along with information about the UV and optical observing strategy. A typical UV spectrum of star-forming galaxies is known to show prominent spectral features such as Ly 1215, C iv 1548, 1550, He ii 1640, O iii] 1660, 1666, [C iii] 1907 and C iii] 1909 111In the rest of the paper, we will refer the two carbon emission lines [C iii] 1907 and C iii] 1909 as C iii] 1907,1909, which is a popular notation in literature., which have been used to infer information regarding hardness of radiation fields, ionization conditions, metal-content, wind properties within galaxies at all redshifts (e.g., Shapley2003; Senchyna2017; Nakajima2018; Schmidt2021). In this paper, we mainly focus on the ionized carbon spectral features, C iv 1548, 1550 and C iii] 1907,1909, however, we complement the UV analysis with the spatially-resolved optical, mid-infrared (MIR) and FIR data.
The paper is organized as follows: Section 2 presents an overview of the data used in this work, including UV, optical, MIR and FIR. For UV and optical data, we explain the initial data reduction and processing. The MIR and FIR data are archival. In Section LABEL:section:results, we present the results of the multi-wavelength data analysis which includes the estimates of redshift, distance, flux and equivalent widths of detected emission lines and reddening. We also determine several physical properties of the ionized gas and the ionizing stellar population, such as electron temperature and density, gas-phase metallicity, ionization parameters, effective temperature and softness parameters. Section LABEL:section:discussion presents a discussion focusing on UV carbon features including their large equivalent widths, line profiles and relative chemical abundance. We also discuss the implication of this study on future JWST+ALMA studies of reionization-era galaxies. Section LABEL:sec:summary summarizes our main results.
In the rest of the paper, we assume a flat CDM cosmology with H0 = 70 km s-1Mpc-1, = 0.3. The gas-phase solar metallicity is assumed to be 12 + log(O/H)⊙ = 8.69 (Asplund2009).
| Pox 186 | ||
| Morphological type | BCD | |
| RA (J2000) | 13 25 48.641 | |
| Dec (J2000) | -11 36 37.94 | |
| Redshifta | 0.0040705 | |
| Distance (Mpc)a | 17.5 | |
| V (mag)b | 17.43 0.03 | |
| B (mag)b | 17.93 0.53 | |
| MHI (M⊙)c | 16.1 105 | |
| COS Setting | Central wavelength (Å) | Exposure time (s) |
| G130Md | 1291 | 5123.36 |
| G160Me | 1623 | 4528.064 |
| G185Me | 1913 | 13428.864 |
| Mirror A | – | 7 3f |
| GMOS gratings | Central wavelength (Å) | Exposure time (s) |
| B600+_G5307g | 4650 | 8703 |
| B600+_G5307g | 4700 | 8703 |
| R831+_G5302g | 6900 | 9502 |
| R831+_G5302g | 6950 | 9503 |
| R831+_G5302h | 8800 | 10003 |
| R831+_G5302h | 8900 | 10004 |
Notes: a: This work; b: Guseva2004; c: Begum2005; d: HST/COS PID 16445; e: HST/COS PID 16071; f: Target acquisition was done thrice using Mirror A, every time before taking COS/FUV and COS/NUV spectra; g: GMOS PID:GN-2020A-FT-105; h: GMOS PID: GN-2021A-FT-111.
| Emission lines | Observed Fluxes | ||||||
|---|---|---|---|---|---|---|---|
| [S iv] | 36.29 3.66 | ||||||
| [Ne ii] | 0.95 0.25 | ||||||
| [Ne iii] | 13.81 3.33 | ||||||
| [S iii] | 7.37 1.25 | ||||||
| [O iii] | 33.70 3.33 | ||||||
| [C ii] | 3.14 0.81 |
Notes: Fluxes are in 10-18 Wm-2.
| Emission lines | z | ||
|---|---|---|---|
| O iii] | 1660.81 | 1667.6 | 0.004086 |
| O iii] | 1666.15 | 1672.95 | 0.004079 |
| C iii] | 1906.68 | 1914.43 | 0.004066 |
| C iii] | 1908.73 | 1916.46 | 0.004051 |
| z (Mean Std)a | 0.0040705 0.000013 |
Notes: Mean and Std denote the mean and standard deviations of the redshifts estimated from the emission lines.
2 Observations
2.1 HST/UV spectroscopy
The HST/COS observations were taken as part of the General Observing programs in HST Cycles 27 and 28 (GO: 16071 and 16445, PI: N Kumari) at lifetime adjustment position 4 (LP=4). Before taking each UV spectrum, the NUV target acquisition image is taken using the Mirror A. The FUV and NUV spectra were taken with the 2.5 arcsec diameter Primary Science Aperture (PSA) using the medium resolution gratings, G130M, G160M and G185M centred at 1291Å, 1623Å and 1913Å, respectively. We used all FP-POS positions for better spectral sampling and increased signal-to-noise (S/N). Table 1 lists the exposure times for gratings and Mirror A used within the two HST programs. All HST/COS data were processed with the standard data reduction pipeline CALCOS version 3.4.0.
Figure LABEL:fig:NUV/Acq shows the HST/COS NUV target acquisition image where the red circle denotes the 2.5 arcsec COS spectroscopic aperture. The wavelength settings allow us to cover several spectral features consisting of ISM (red), photospheric (purple), wind (yellow) and nebular (brown) lines as shown in Figures LABEL:fig:uv_spectra1 and LABEL:fig:uv_spectra2.