Glassy relaxation in de Vries smectic liquid crystal consisting of bent-core molecules
Abstract
We report the experimental investigations on a liquid crystal comprised of thiophene-based achiral bent-core banana shaped molecules. The results reveal the presence of a short range nematic phase at high temperatures and a long-range SmA phase at lower temperatures, which transits to a SmC phase on further cooling the sample. Practically no layer contraction was observed across the SmA to SmC transition, indicating the de Vries nature of the SmA phase. Interestingly, the crystallization does not occur on cooling the sample till 223 K; instead, a glass transition at 271 K was observed. The dielectric spectroscopy studies carried out on the sample reveal the presence of a dielectric mode whose relaxation process is of the Cole-Cole type. The relaxation frequency of the mode was found to drop rapidly with decreasing temperature, further confirming the glassy behavior. The variation of relaxation frequency with temperature follows the Vogel-Fulcher-Tammann equation indicating the fragile glassy nature of the sample.
I Introduction
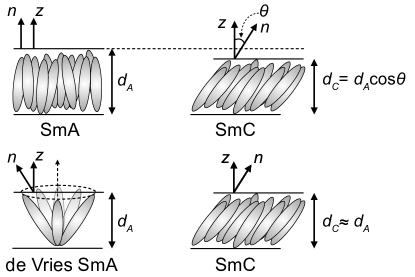
Liquid crystals (LCs) are comprised of molecules with strong shape anisotropy and they exhibit long-range orientational order with or without partial translation order. Thus LCs have the characteristics of crystals while retaining the fluidity of ordinary liquids [1]. The most commonly observed liquid crystalline phases are known as nematic and smectic phases. The nematic (N) phase has long range orientational order of the constituent molecules with no translational ordering. The average orientation of the molecular long axes is defined by the unit vector and is known as the director. In the lamellar smectic phases, the anisotropic molecules stack to form layers with translational order along the layer normal but fluid-like order in the layers. The nano-segregation of the electron-rich aromatic core and aliphatic chains of the constituent molecules give rise to such layered structures. In the smectic A (SmA) phase, the director is parallel to the layer normal with the layer spacing of the order of molecular length . In the smectic C (SmC) phase, the director tilts away from the layer normal by a tilt angle with a layer spacing less than the molecular length . The tilt angle is generally found to be temperature dependent in the SmC phase. There is usually a significant reduction of the layer spacing across the transition from the SmA to SmC phase, as depicted in figure 1. The SmA phase acquires a so called ‘bookshelf geometry’ when confined between parallel bounding plates treated for homogeneous planar alignment of the molecules. In the bookshelf geometry, the constituent molecules align homogeneously on the bounding plates, giving rise to the layers perpendicular to the plates. Across the SmA-SmC transition, the reduction of layer spacing in bookshelf geometry leads to the buckling of layers resulting in the so-called chevron structure [2]. The chevron structure originates due to a mismatch between the smectic layer spacing in bulk and at the surface [2, 3]. The chevron formation causes various types of defects, such as zig-zag defects, which have been a challenging problem for surface stabilized ferroelectric LC displays [2, 4, 5]. This issue can be addressed using materials with no layer contraction across the SmASmC transition. Such a SmA phase is known as the “de Vries smectic A” phase. Henceforth in our discussion, we shall denote the de Vries SmA phase as ‘dSmA’ phase. Adriaan de Vries first proposed a model structure for this type of SmA phase where molecules in a layer are tilted with respect to the layer normal but with random azimuthal tilt directions. The random distribution of the tilt direction makes this phase optically uniaxial about the layer normal as in the SmA phase. This model structure is termed as diffuse cone model of dSmA phase [6, 7]. Across the transition from the dSmA to the SmC phase, the already tilted molecules in the layers in the dSmA phase choose a particular azimuthal orientation as in the SmC phase with practically no layer contraction as shown in figure 1. A large number of materials consisting of calamatic (rod-like) molecules have been reported to exhibit the dSmA phase [5, 8, 9, 10, 11]. But only a few bent-core banana shaped molecules are found to exhibit dSmA phase [12, 13, 14, 15, 16].
Bent-core (BC) liquid crystals have attracted significant attention in recent years due to their remarkably distinct optical and electro-optical properties arising from the interplay between polarity and chirality [17, 18, 19, 20]. The bent shape enables the molecules to form a lamellar structure with aligned bending directions, giving rise to layer polarization and thus forming ferro- and antiferroelectric phases [17]. Apart from a potential candidate in electro-optic applications due to their fast response time [20], the BC molecules exhibit a rich variety of phases, such as orthogonal polar smectic SmAP phase [21, 22, 23], polarization modulated structures [24, 25, 26, 27], non polar undulated layer structure [28], dark conglomerate phase [29], and columnar phases [30, 31, 32].
A large number of studies can be found on glass formation and molecular dynamics studies for calamatic liquid crystals [40, 41, 42, 43, 44, 45, 46], but glass forming bent-core molecular system is rarely reported [47]. The formation of the glassy state is another intriguing dynamic slow-down process that retained the interest of scientists for several decades because of their ubiquitous role in technology and diverse applications [33, 34, 35, 36]. The glass formation can take place by many routes [37], a conventional one of which is rapid enough cooling of a liquid phase to avoid the nucleation and growth process of crystals. The liquid appears frozen on the time scale of experimental observation. Although rapid cooling is required for glass formation in many liquids, some organic liquids [38], polymers [37], and liquid crystals [39] can exhibit glass transition at a moderate cooling rate. In the glass-forming liquid crystal, the order can be frozen by preserving the director by external means, such as strong anchoring or applied electric/magnetic field, while cooling the system. This allows the formation of partially ordered glasses retaining all the qualitative features of the liquid crystal phase, which could be exploited in possible applications such as wave plates, holography, and optical storage [42]. Recently it has been pointed out that for some materials, a smectic transition from high temperature nematic phase can be frustrated or completely circumvented to produce glasses with tunable liquid crystalline order that can be utilized in organic electronic applications [48, 49].
In this paper, we investigate the physical properties of liquid crystalline phases of an achiral thiophene-based bent-core liquid crystal using various experimental techniques. The compound exhibits a high temperature short range nematic phase followed by two long range smectic phases. We report two key findings from our experimental studies. Firstly, we find that the higher temperature smectic phase is the dSmA phase which transits to the SmC phase on decreasing temperature with practically no layer contraction. Unlike the typical BC liquid crystals, both the smectic phases are non-polar with calamatic type phase behavior. Secondly, both the smectic phases show a dielectric relaxation mode whose relaxation frequency decreases sharply on lowering the temperature suggesting a glassy behavior. The dielectric relaxation of the mode is of Cole-Cole type, and the temperature variation of relaxation frequency follows the empirical Vogel-Fulcher-Tammann (VFT) equation. This suggests the fragile nature of the glass for our sample with fragility parameter 3 [37]. The calorimetric studies further confirmed the glass transition at a temperature of about 271 K, which qualitatively agrees with the dielectric studies. We propose a simple model structure for the dSmA phase to account for the experimental observations. To the best of our knowledge, this is the first report of a bent-core liquid crystal exhibiting a dSmA phase and also showing glassy behavior.
II Experimental
Polarized Optical Microscopy (POM) investigations of the sample were conducted using Olympus BX 50 microscope equipped with a hot stage (Linkam LTS420E) and a digital camera (Canon EOS 80D). For homeotropic alignment of the molecules, a thin sample was sandwiched between a clean glass slide and a glass cover slip. In addition, commercially available LC cells from (INSTEC Inc.) were employed for the planar and homeotropic alignment of the sample. The LC cells contain indium tin oxide (ITO) coated glass plates serving as an electrode for electro-optic and dielectric studies. The sample was introduced into the LC cell by capillary action in its isotropic phase using a hot plate. The electric polarization of the sample in the LC phases was investigated using a triangular wave voltage technique [50] with varying amplitudes and frequencies for planar as well as homeotropically aligned samples. The current response of the sample was measured by monitoring the voltage drop across a 1 k resistor connected in series with the sample cell.
To evaluate the effective birefringence of a planar aligned sample, we measured the variation of average intensity transmitted through the sample as a function of temperature. The planar aligned sample was kept on the microscope stage at an angle of maximum transmittance between crossed polarizers, and images were taken with varying temperatures by introducing a red filter of wavelength 700 nm in the light path. The average transmitted intensity was computed from the POM images using MATLAB.
The steady state field induced electro-optical response of a planar aligned sample was measured using a He-Ne laser with the application of a triangular AC voltage. The sample was kept between crossed polarizers at an orientation of maximum transmittance, and the transmitted intensity was recorded using a low-noise high gain photodiode connected to a mixed signal oscilloscope (Agilent Technologies MSO6012A). The intensity was normalized using , where is the measured transmitted intensity through the sample and is the mean value of the transmitted intensity.
Variable temperature x-ray diffraction (XRD) measurements were conducted using a DY 1042-Empyrean (PANalytical) diffractometer with CuKα radiation of wavelength 1.54 Å and a PIXcel 3D detector. The samples were filled in Lindemann capillary tubes with an outer diameter of 1 mm. The XRD intensity profiles were measured at different temperatures on cooling the sample from its isotropic phase.
Dielectric measurements were performed on the sample filled in commercially available LC cell using a high-performance impedance analyzer (Novocontrol Alpha-A) in the frequency range of 1 Hz to 10 MHz. The measurements were limited to 1 Hz due to the dominating charge current contribution at lower frequencies. A sinusoidal AC voltage with an rms amplitude of 0.5 Volts was used during the dielectric measurement without applying a bias voltage. The temperature of the sample was monitored using a homemade temperature controller with temperature stability of 0.1 K. To study the variation of the dielectric constant of the sample in the high temperature range, a complimentary homemade setup with a frequency range of 1 Hz to 100 kHz was also employed. The temperature of the sample was monitored by a microscope hot stage equipped with a temperature controller (INSTEC Inc.). In this setup, a sinusoidal AC voltage of rms amplitude 0.5 Volts was applied to the sample cell and a resistance of 1 k connected in series. A lock-in amplifier (Stanford Research SR830) was utilized to measure the amplitude and phase of the voltage drop across the 1 k resistance. The impedance analysis was used to determine the capacitance of the LC cell with and without the sample. The ratio of these measured capacitances gives the real part of the effective dielectric constant of the sample.
III Results and discussion
III.1 Phase sequence
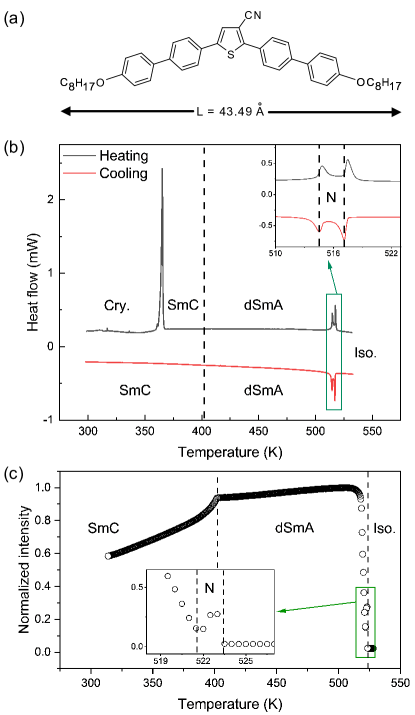
The sample used for our experimental studies is 2,5-bis(4′-(octyloxy)-[1,1′-biphenyl]-4-yl)thiophene-3-carbonitrile and is denoted as BTCN8. The chemical characterization and preliminary studies on this compound have already been published [51]. The molecule has a bent-core banana shape with a central thiophene ring, as depicted in Figure 2a. The opening angle and the molecular length, calculated from the energy minimized molecular structure, are about 143∘ and 43.5 Å, respectively. A strongly polar carbonitrile group attached to the central thiophene ring enhances the net dipole moment of the molecule at an angle to the long axis [51].
Differential Scanning Calorimetry (DSC) studies were performed on the sample to detect the various phase transitions in heating and cooling cycles at a rate of 5 K/min. The DSC thermograms of the sample are shown in figure 2b. The DSC thermogram reveals that the sample melts while heating at 365 K, which on further heating, shows two transition peaks at 515.9 K and 518.6 K and goes to the isotropic phase. On cooling from the isotropic phase, two transitions were observed at 517.4 K and 514.9 K, and no other transitions were observed on further cooling the sample till room temperature. The inset in figure 2b shows the expanded view of the two closely spaced transitions. Thus, the DSC thermogram clearly indicates the existence of two mesophases for the compound BTCN8 below its isotropic phase. However, detailed polarizing optical microscopy (POM) studies detect another transition at 402 K while cooling the sample. In POM studies, the optical transmittance through a planar aligned 5 m thick sample kept between crossed polarizers was measured while cooling from the isotropic phase. The rubbing direction of the sample cell was kept at an angle of 45∘ from the polarizer direction for maximum transmittance. Figure 2c displays the normalized transmitted intensity as a function of temperature, which clearly detects all the phase transitions. The inset of figure 2c shows the existence of the short-range nematic phase. The discontinuous change in the slope of the transmitted intensity curve at 402 K corresponds to an additional phase transition. Based on the experimental studies, we identify the following phase sequence for the compound BTCN8 on cooling till room temperature:
| Isotropic 517.4 K→ N 514.9 K→ de Vries SmA 402 K→ SmC |
All the observed mesophases are found to be enantiotropic. The absence of a DSC peak across the dSmA to SmC phase transition indicates the second-order nature of this transition. The SmC phase became increasingly viscous on lowering the temperature while retaining the fluidity till room temperature. The sample did not crystallize on cooling. Instead, a glass transition was observed at 271 K, which will be discussed later.
III.2 X-ray diffraction studies
The variable temperature x-ray diffraction (XRD) studies were carried out at various temperatures to investigate the molecular organization in the observed liquid crystalline phases.
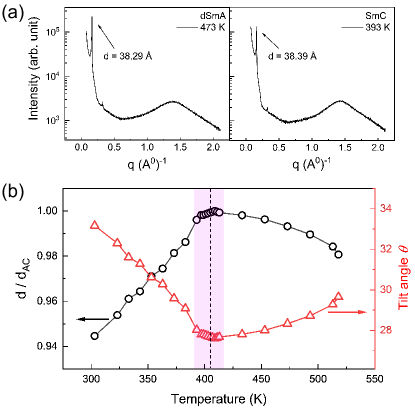
In the highest temperature short range nematic phase, a single diffuse peak was observed in the wide angle region with no sharp peak at the small angle region, which is characteristic of the Nematic phase. In the dSmA and SmC phases, the XRD intensity profiles as a function of the scattering vector are shown in figure 3a. In both of these phases, two sharp peaks were observed in the small angle region at values in the ratio of 1:2. In addition, a diffused broad peak was observed in the wide angle region centered about Å-1 and Å-1 in the dSmA and SmC phases, respectively. The shifting of the maximum of the wide angle diffuse peak towards a higher value of on cooling is due to increased molecular packing density. The XRD results indicate a lamellar molecular organization with liquid-like order within the layers. The layer spacings calculated from the XRD data in the dSmA and SmC phases are 38.39 Å and 38.29 Å, respectively, which do not vary appreciably with temperature. The molecular length of the compound BTCN8 is 43.5 Å, which is significantly larger than the observed layer spacing in both the smectic phases. This indicates that the molecules are tilted within the layers. The tilt angle with respect to the layer normal can be estimated using . The temperature variation of the tilt angle is shown in figure 3b. The tilt angle varies slightly across the whole temperature range and attains a shallow minimum value of about 28∘ near the dSmA to SmC transition. Figure 3b also shows the temperature variation of the normalized layer spacing , where is the maximum value of layer spacing in the dSmA phase close to the transition. It is clear from figure 3b that the layer spacing does not change appreciably across the transition from the dSmA to the SmC phase. The layer contraction in the SmC phase at 10 K below the dSmA-SmC transition temperature is only about 0.07%. These observations confirm that the higher temperature smectic phase is a de Vries-type SmA phase. In the dSmA phase, the molecules are tilted within the layers having their tilt directions distributed uniformly in the azimuthal plane giving rise to optically uniaxial texture about the layer normal. In contrast to the conventional SmA phase, the layer spacing in the dSmA phase is significantly less than the molecular length. The large opening angle of the bent structure of the BTCN8 molecules and a strong dipole moment due to the polar cyano group projecting in the lateral direction perhaps favor the tilted non-polar molecular organization in the layers [52].
Across the transition from the dSmA to the SmC phase, the random directions of the already tilted molecules get correlated, giving rise to a uniformly tilted configuration with no considerable change in the layer thickness. It can be seen from figure 3b that the layer spacing is maximum near the dSmA-SmC transition and decrease slightly from this value in the dSmA phase at higher temperatures and in the SmC phase at lower temperatures. The increase in the layer thickness in the dSmA phase with decreasing temperature can be attributed to the stretching of the alkyl chain with increasing packing density. This trend of negative thermal expansion of the layer spacing in the dSmA phase has also been observed in other materials exhibiting de Vries-type SmA phases [9, 11]. In our sample, a slight decrease in layer spacing was observed in the SmC phase at lower temperatures. However, the observed layer contraction in the whole temperature range of about 225 K in the dSmA and the SmC phases is only about 5%. The POM studies discussed in the following section further confirmed the de Vries nature of the SmA phase.
III.3 POM and electro-optic measurements
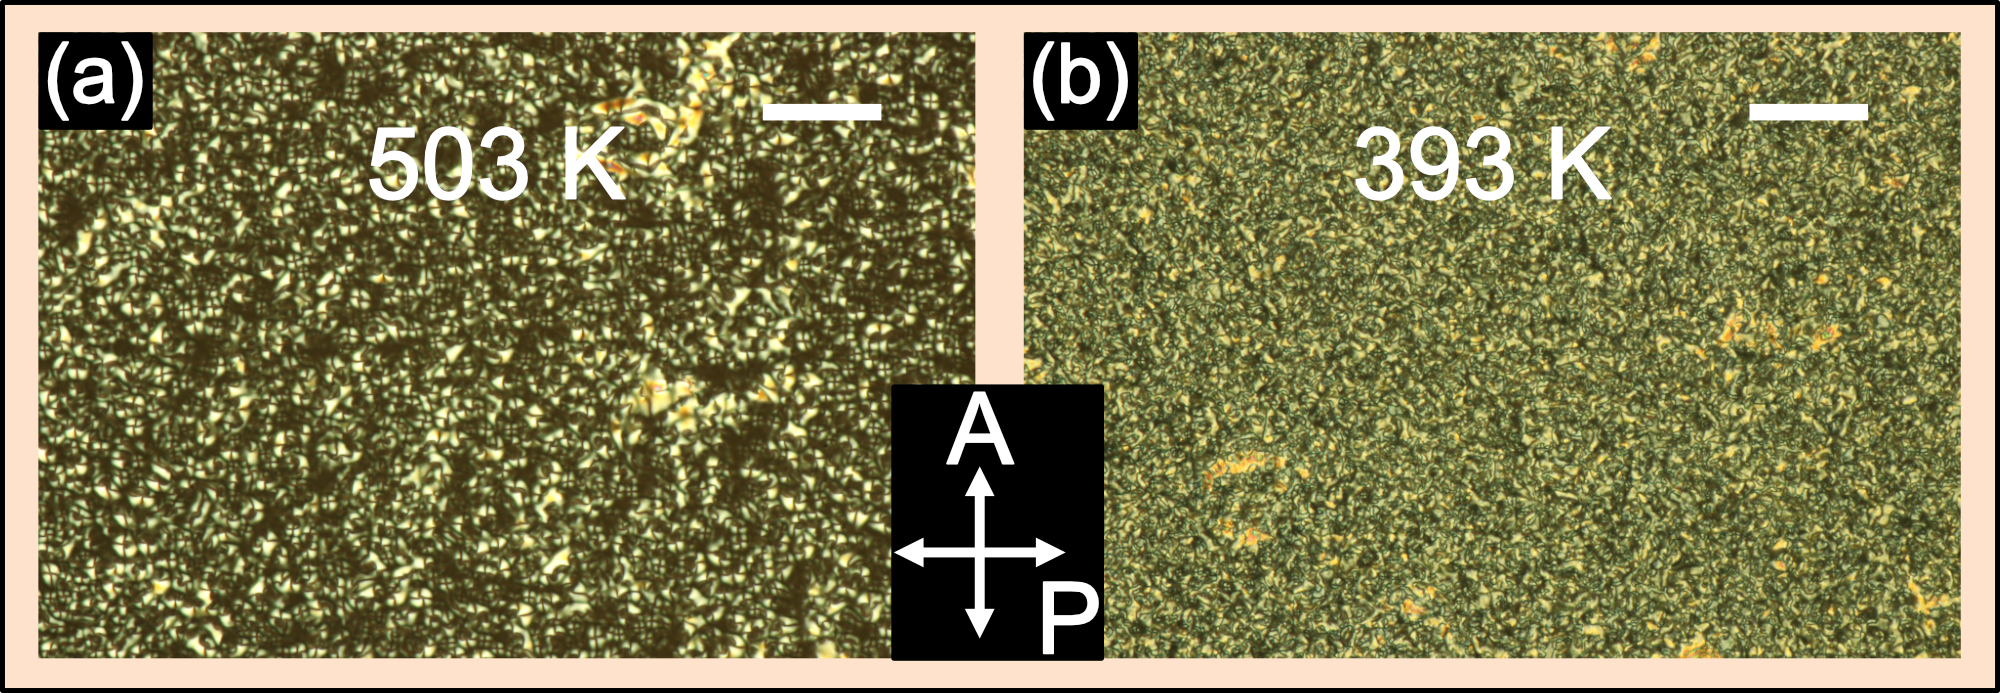
The POM observations were carried out on thin samples to further characterize the different phases. The POM textures were observed between crossed polarizers while cooling the sample from the isotropic phase. A thin sample sandwiched between a clean glass plate and a cover slip tends to align homeotropically. The nematic phase below the isotropic phase exhibits a characteristic schlieren texture as shown in figure 4a. Upon cooling to the dSmA phase, the molecules align homeotropically, and the texture appears completely dark, as shown in figure 4b. The dark texture remains invariant on rotating the sample on the microscope stage, confirming the uniaxial nature of the dSmA phase. This observation and the intralayer molecular tilt observed in the XRD studies discussed earlier confirm the de Vries nature of the SmA phase. On further cooling, a birefringent schlieren texture was observed in the lower temperature SmC phase as shown in figure 4c. The birefringent schlieren texture in this homeotropic geometry and the tilted molecular organization in the layers observed in XRD studies suggest the tilted smectic order. Only unit strength defects were observed in the schlieren texture of this SmC phase, indicating the synclinic organization of the molecules in the layers.
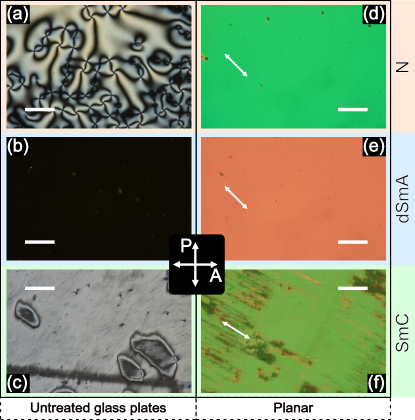
In a planar aligned LC cell, the sample aligns homogeneously along the rubbing direction in the nematic and dSmA phase. The textures in the nematic and the dSmA phase are brightest when the rubbing direction is kept at 45∘ with respect to the polarizer, as shown in figure 4d and 4e, respectively. In the dSmA phase, the layers are perpendicular to the glass plates adopting a so-called bookshelf geometry with an optic axis along the layer normal. The smooth texture of the dSmA phase breaks down into two types of domains as shown in figure 4f in the lower temperature SmC phase. The degeneracy in the azimuthal tilt orientations of the molecules in the dSmA phase is lifted during the transition to the SmC phase. It leads to the formation of two surface stabilized regions with symmetrically opposite optical tilt, as shown in figure S1 of Supplementary Information (SI).
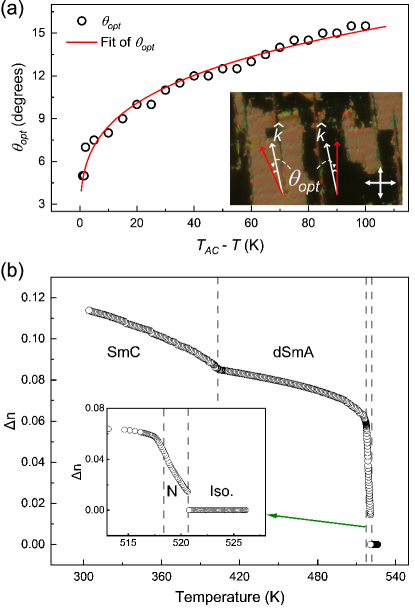
Though the layer thickness and hence the molecular tilt does not change appreciably across the dSmA to SmC transition, the increasing correlation of the molecular tilt direction in the SmC phase gives rise to an optic axis away from the layer normal. The angle between the optic axis and the layer normal is defined as the optical tilt angle . The of a given domain of a 5 m thick planar aligned sample in the SmC phase was measured using POM as a function of temperature. Figure 5a shows the variation of as a function of , where is the dSmA to SmC transition temperature and is the measured temperature. The inset of figure 5a depicts the POM texture of two opposite tilted domains under crossed polarizers at 287 K. The rotation angle between dark states in domains of opposite tilt orientations is 2. As can be seen from the figure 5a, the value of increases continuously from zero and tend to saturate at lower temperatures. Thus, can be treated as an order parameter for the dSmA to SmC transition, which is expected to vary as
| (1) |
in the SmC phase according to the generalized Landau theory of phase transition. Here, is the tilt exponent related to the nature of the phase transition. The generalized Landau theory predicts for second-order transition, whereas for a tricritical point corresponding to crossover from second- to first-order transition. The solid line in figure 5a shows the fit to the experimental data using eqn. 1 with exponent for our sample. The obtained value suggests that the dSmA to SmC transition in our sample is close to the tricritical point. The absence of a DSC peak associated with this transition in our sample suggests that the transition is of second order in nature but close to tricriticality. Similar exponent values have also been reported for other materials exhibiting dSmA to SmC phase transition [53, 54].
We also measured the effective birefringence of a planar aligned sample of thickness 5 m as a function of temperature in the liquid crystalline phases. The birefringence was measured by monitoring the transmitted intensity through the sample between crossed polarizers using POM. The transmitted intensity through the sample can be written as,
| (2) |
where is the intensity of the incident light, is the angle between the local optic axis and the polarizer, and is the phase difference introduced by the sample between the ordinary and extraordinary rays. Here, is the sample thickness, is the wavelength of the incident light, and is the effective birefringence of the sample. In our experiments, the angle was set to 45∘ for maximum transmittance. The details of the experimental method to measure the transmitted intensity are described in section II, and the effective birefringence was calculated using eqn. 2. The variation of as a function of temperature is shown in figure 5b. While cooling from the isotropic phase, a discontinuous jump in the was observed at the Isotropic-N transition temperature. The value of continued to increase in the N phase, and a slope change at the N-dSmA transition temperature was observed. The value increases slightly with decreasing temperature and tends to saturate at lower temperatures in the dSmA phase. The again started to increase with decreasing temperature from the dSmA to SmC transition temperature. The low value of the birefringence in the dSmA phase ( 0.08) compared to that of the SmC phase supports the de Vries nature of the SmA phase [5].
The spontaneous electric polarization of the sample in the dSmA and SmC phase was investigated using a triangular wave voltage technique [50]. A voltage of amplitude 50 V was applied across the planar aligned sample of thickness 5 m. The current responses of the sample are shown in figure S2 of SI. No current peak associated with polarization reversal was observed, indicating that the layers in both the smectic phases do not possess spontaneous polarization.
Despite the absence of polarization, a clear reversible field-induced change in the texture was observed in the SmC phase for a planar aligned sample (see figure S3 of SI). The electro-optical response of the planar aligned sample kept between crossed polarizers was measured in the SmC phase under the application of a triangular wave voltage. The observed optical response was found to be at twice the frequency of applied voltage (see figure S4 of SI). This observation also suggests the absence of polarization in the layers. The observed electro-optical response arises due to the quadratic coupling between the applied electric field and the dielectric anisotropy of the sample. No such optical response was found in the dSmA phase with an applied field as high as 20 V/m.
III.4 Dielectric studies
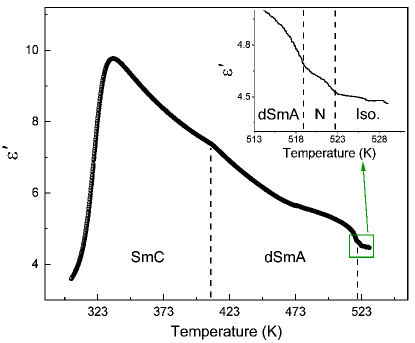
The dielectric properties of the samples were investigated using the LC cells for planar alignment. The methods used for the dielectric measurements are described in section II. The real part of the dielectric constant () was measured by applying a sinusoidal AC voltage of rms amplitude 0.5 V and frequency 5641 Hz while cooling the sample from its isotropic phase. Figure 6 shows the temperature variation of in the observed liquid crystalline phase of the sample, which clearly detects the transitions between the phases. The observed transition temperatures agree with the DSC and POM measurements. The increase of in the planar aligned nematic phase while cooling from the isotropic phase suggests negative dielectric anisotropy of the sample. The continued to increase on further decreasing the temperature till 333 K and sharply decreased below it. This sharp decrease does not correspond to a phase transition. Rather, it occurs due to dielectric relaxation, as discussed later.
To study the dielectric relaxation behavior of the samples, the dielectric permittivity was measured as a function of frequency in the range of 1 Hz to 10 MHz at different temperatures for planar aligned samples. The frequency dependent complex dielectric permittivity of the sample can be written as,
| (3) |
where and are real and imaginary parts of the complex dielectric permittivity, respectively, and being the frequency of the applied field.
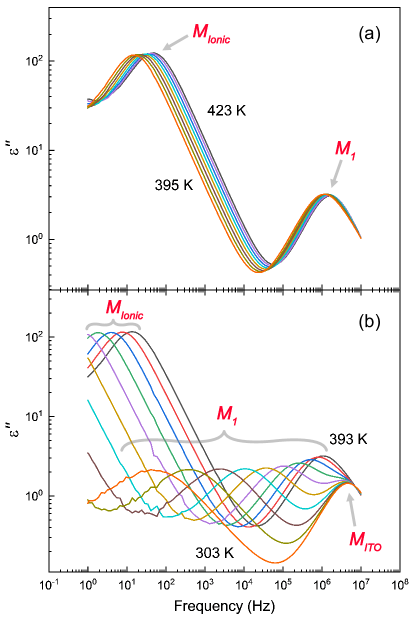
The frequency dependence of at different temperatures in the dSmA and SmC phases are shown in figure 7. The observed peaks in curve correspond to the relaxation frequency of different dielectric modes of the sample. Figure 7a illustrates the frequency dependence of in the high temperature range from 423 K to 393 K with a temperature step of 4 K. The sample is in the dSmA phase at 423 K, and the transition to the SmC phase occurs at about 403 K. The relaxation peaks in the small frequency range below 100 Hz with relatively high dielectric strength are arising due to the ionic conductivity of the sample and will be ignored in further discussions. Another mode with the relaxation frequency in the MHz range was found in this temperature range, which is denoted as in the figure 7a. The intensity of these relaxation peaks remained almost constant, and the peak frequency gradually decreased upon lowering the temperature. The mode was found to exist in both dSmA and SmC phases and does not vary appreciably across the transition, as can be seen from figure 7a. The frequency dependence of in the lower temperature range from 393 K to 303 K with a temperature step of 10 K is shown in figure 7b. At lower temperatures, the relaxation frequency of mode started to decrease rapidly with decreasing temperature and attained a value of about 50 Hz at ambient temperature. In this lower temperature range, another weak relaxation peak at about 50 MHz was clearly visible, which did not vary with temperature as shown in figure 7b. This peak, denoted as , arises due to the finite sheet resistance of the ITO coating used in the LC cell and is masked by the mode in the higher temperature range.
Similar experiments were carried out on a homeotropically aligned sample, and one relaxation mode was found to exist in the same temperature range as in the planar aligned sample. The temperature variation of for the homeotropic and the planar aligned sample is shown in figure S5 of SI. In the homeotropic LC cell, the molecules acquired a quasi-homeotropic alignment with a non-uniform dark texture between crossed polarizers, as shown in figure S6 of SI. This non-uniform alignment is probably due to the incompatibility of the strong homeotropic anchoring and the diffuse cone structure of the dSmA phase. The quasi-homeotropic alignment of the molecules in the homeotropic cell can be attributed to the presence of mode . Thus the sample exhibit one dielectric relaxation mode present in both alignments. The dielectric strength in the homeotropic aligned sample is significantly lower compared to that in the planar cells, indicating that the mesophases possess negative dielectric anisotropy.
In order to analyze the measured dielectric relaxation processes, the dielectric spectra were fitted using the Havriliak-Negami (HN) equation [55, 56]. This empirical equation expresses the frequency-dependent complex permittivity in terms of the various relaxation processes given by,
| (4) |
In this equation, represents the dielectric strength of the th relaxation process, represents the corresponding relaxation time, represents the high-frequency limit of permittivity, and , are shape parameters. These parameters describe the broadness and asymmetry of the dielectric loss spectra, respectively, and satisfy the conditions and . The term is related to the conductivity, where is the direct current (DC) conductivity, is the permittivity of free space and is a fitting parameter that determines the slope of the conductivity. In the case of pure Ohmic conductivity, , while could be observed in the case of additional influence due to electrode polarization [57]. The HN response reduces to the Cole-Davidson response [58] when , and to the Cole-Cole response [59] when . The process under discussion is termed Debye relaxation for both and equal to unity.
| T [K] | |||
|---|---|---|---|
| 303 | 0.65 0.02 | 1 0.08 | 6.69 0.17 |
| 308 | 0.68 0.01 | 1 0.06 | 6.50 0.16 |
| 313 | 0.74 0.02 | 0.95 0.03 | 6.44 0.21 |
| 318 | 0.67 0.01 | 0.99 0.06 | 7.33 0.07 |
| 323 | 0.68 0.01 | 1 0.06 | 7.23 0.06 |
| 328 | 0.67 0.02 | 1 0.08 | 7.23 0.07 |
| 333 | 0.68 0.02 | 1 0.09 | 7.12 0.08 |
| 338 | 0.69 0.02 | 1 0.12 | 7.06 0.11 |
The dielectric spectra for our sample could be fitted well using eqn. 4. Figure 8a shows the variation of as a function of frequency at 333 K along with the fitted curve. The fitting parameters obtained for some temperatures are listed in table 1. The asymmetry parameter for our sample remains almost constant at varying temperatures. This implies that the shape of the dielectric loss peak is symmetric, and the relaxation process is of the Cole-Cole type. The Cole-Cole parameter was found to be close to at lower temperatures and tends to decrease slightly with increasing temperature. This indicates that the width of the dielectric loss spectrum tends to increase with decreasing temperature, as can also be seen from figure 7b. The deviation of experimental data from the fitted curve at higher frequencies in figure 8a is due to the overlap of the relaxation peak with the additional peak at about 50 MHz arising from the ITO coating of the LC cell.
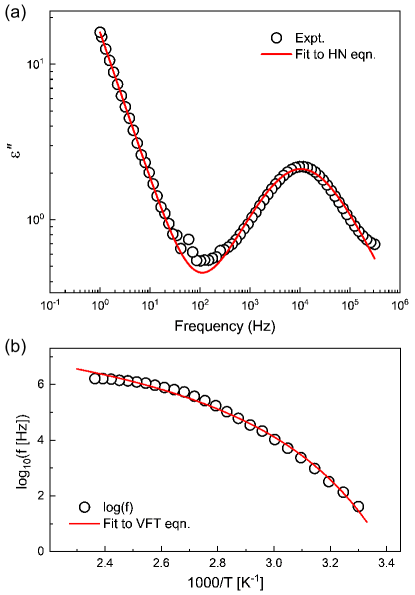
The temperature dependence of relaxation frequency provides a useful classification of glassformers along a ‘strong’ to ‘fragile’ scale [37, 36]. The former shows an Arrhenius dependence, whereas the latter deviates from the Arrhenius behavior. The temperature variation of the relaxation frequency for the mode of our compound can be fitted well with the modified Vogel-Fulcher-Tammann (VFT) equation [37] given by,
| (5) |
where is the pre-exponential constant, is Vogel temperature, and is a constant that determines the deviation of the system away from the Arrhenius behavior, i.e., the fragility of the system. The measured relaxation frequency as a function of temperature along with its fit to eqn. 5 is shown in Figure 8b. The fitting parameters are K, log, and . Such a large value indicates the highly fragile glassy nature of our sample. These fragile glasses have also been found for some polymeric systems [60]. The deviation of VFT fit from the experimental data in the higher temperature range can be attributed to the increasing overlap of the relaxation peak with the ITO-induced peak. It has also been reported that a poorer fit to the experimental data is expected for more fragile liquid [37].
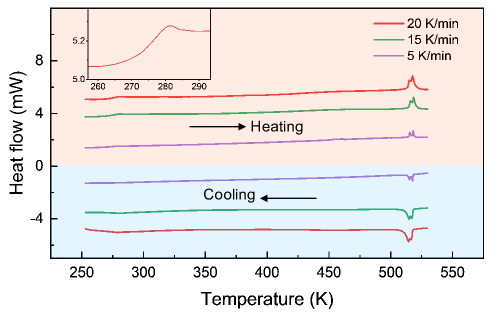
The DSC measurements were carried out to measure the possible glass transition in the cooling and heating cycle of the sample at different rates. The observed DSC thermograms are shown in figure 9. A step change in the DSC thermogram corresponding to the glass transition was detected on both the cooling and heating cycle. The vitrification temperature () on cooling at a rate of 20 K/min was 271 K, and the corresponding glass softening temperature on heating was 268 K. These temperatures were determined from the inflection point of the DSC thermogram corresponding to the half height of the step in the heat flow curve. The difference between calorimetric glass transition temperature and Vogel temperature is about 18 K for our sample, which is considered to be low as expected for highly fragile systems [37]. This difference tends to zero for magnetic relaxation in spin glasses [61].
Now we discuss the possible origin of the observed mode in our sample. The dielectric relaxation processes can be divided broadly into two categories: non-collective and collective dynamics of the molecules. The liquid crystal molecules themselves can exhibit two dielectric relaxation mechanisms associated with the rotation of the molecules about their long and short axes. When the rotational dynamics of the individual molecules are not correlated, the resulting non-collective dielectric relaxation processes usually occur in the GHz or higher frequency range for typical rod-like molecules. The observed mode in our sample has a much lower relaxation frequency and is expected to be not associated with these non-collective rotational dynamics of the molecules. Thus, the mode must arise from the collective movement of the constituent molecules. Although the BTCN8 molecules have non-zero dipole moments, our experimental studies confirmed the absence of spontaneous polarization in the observed smectic phases. Furthermore, we didn’t find experimental evidence of Langevin-type ordering of the dipole moments in the smectic layers [14]. Hence, mode is not associated with the collective polar ordering of the molecules in our sample.
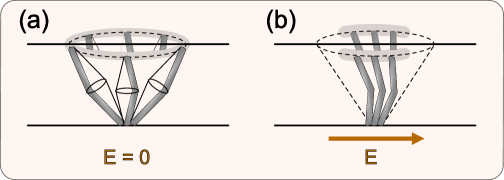
Based on the molecular configuration in the dSmA and the SmC phases, we propose the following mechanism that gives rise to the mode. In the dSmA phase, the long axes of the molecules are distributed uniformly on a cone about the layer normal (see figure 10a). Under the application of a small electric field in the plane of the smectic layers, the molecules reorient azimuthally on the cone resulting in a weak biaxiality in the system. Due to the strong transverse component of the dipole moment of the molecules, the sample has negative dielectric anisotropy, and the field tends to redistribute the molecules on the cone along the directions perpendicular to the applied field as shown in figure 10b. The observed relaxation mode in our sample can be attributed to this collective redistribution of the molecules on the cone. In the SmC phase, the molecular distribution around the cone is peaked at a preferred azimuthal angle giving rise to a nonzero optical tilt. The optical tilt increases with decreasing temperature in the SmC phase. However, the molecules still have a broad distribution along the azimuthal direction. This is also supported by the fact that the optical tilt angle in the SmC phase is about 15∘ at ambient temperature, which is significantly smaller than the corresponding intralayer molecular tilt measured from XRD studies ( 33∘). Hence, a similar molecular redistribution confining them in the plane perpendicular to the applied field is expected to occur in the planar aligned SmC phase. Thus, the relaxation frequency of the mode varies continuously across the transition from the dSmA to the SmC phase and persists throughout the SmC phase. The relaxation frequency of mode decreases gradually with decreasing temperature, indicating that this molecular redistribution about the cone tends to be frozen. The relaxation frequency starts to decline rapidly in the lower temperature region of the SmC phase because of the experimentally confirmed glassy behavior of our sample.
The broad molecular distribution on the tilt cone also explains the increase in birefringence of the SmC phase under the application of a relatively higher field of about 2 V/m, as observed in POM studies (see figure S3 of SI). The applied field confines the molecules in the plane of the LC cell. This results in increased order parameters and hence the birefringence of the sample. This field induced change is reversible as the molecules relax back to their original distribution after removal of the field.
The constituent molecules of the compound BTCN8 have a central thiophene ring which gives rise to an opening angle of about 143∘, which is larger than 120∘ typically found for bent-core molecules. This perhaps can be attributed to the absence of net polarization in the observed smectic phases. We do not see any sign of the B2 phase typically exhibited by bent-core molecules. Rather, the observed phases are calamatic phases generally observed for rod-like molecules.
IV Conclusion
We report the experimental studies on a compound consisting of bent-core banana shaped molecules, which exhibits enantiotropic liquid crystalline phases following the sequence Isotropic Nematic dSmA SmC on cooling. The dSmA to the SmC transition is accompanied by minimal layer contraction. The layers do not possess spontaneous polarization in both the smectic phases. A dielectric relaxation mode was observed due to the reorientation of the molecules on the tilt cone in the dSmA phase and it persists in the lower temperature SmC phase. The relaxation frequency decreases rapidly following the VFT equation indicating a fragile glassy behavior of our sample. The DSC measurements confirmed the glass transition at a temperature of about 271 K, which do not have significant dependence on the cooling rate. We have proposed a model for the observed dielectric mode in the dSmA phase to account for experimental results. Interestingly, the studied bent-core compound has the unique property of exhibiting a de Vries SmA phase along with the glassy behavior.
Acknowledgements.
We thank Ms. Vasudha K. N. for her help in acquiring DSC and XRD data. We also thank Dr. T. Narasimhaswamy for his support in the chemical synthesis of the compound.References
- Chandrasekhar [1992] S. Chandrasekhar, Liquid Crystals, 2nd ed. (Cambridge University Press, 1992).
- Rieker et al. [1987] T. P. Rieker, N. A. Clark, G. S. Smith, D. S. Parmar, E. B. Sirota, and C. R. Safinya, “chevron” local layer structure in surface-stabilized ferroelectric smectic- cells, Phys. Rev. Lett. 59, 2658 (1987).
- Limat and Prost [1993] L. Limat and J. Prost, A model for the chevron structure obtained by cooling a smectic A liquid crystal in a cell of finite thickness, Liquid Crystals 13, 101 (1993).
- Clark and Lagerwall [1980] N. A. Clark and S. T. Lagerwall, Submicrosecond bistable electro‐optic switching in liquid crystals, Appl. Phys. Lett. 36, 899 (1980).
- Lagerwall and Giesselmann [2006] J. P. F. Lagerwall and F. Giesselmann, Current Topics in Smectic Liquid Crystal Research, ChemPhysChem 7, 20 (2006).
- De Vries et al. [1979] A. De Vries, A. Ekachai, and N. Spielberg, Why the Molecules are Tilted in all Smectic A Phases, and How the Layer Thickness Can be Used to Measure Orientational Disorder*, Mol. Cryst. Liq. Cryst. 49, 143 (1979).
- de Vries [1979] A. de Vries, The description of the smectic A and C phases and the smectic A–C phase transition of TCOOB with a diffuse‐cone model, J. Chem. Phys. 71, 25 (1979).
- Prasad et al. [2009] S. K. Prasad, D. S. S. Rao, S. Sridevi, C. V. Lobo, B. R. Ratna, J. Naciri, and R. Shashidhar, Unusual dielectric and electrical switching behavior in the de vries smectic phase of two organosiloxane derivatives, Phys. Rev. Lett. 102, 147802 (2009).
- Roberts et al. [2010] J. C. Roberts, N. Kapernaum, Q. Song, D. Nonnenmacher, K. Ayub, F. Giesselmann, and R. P. Lemieux, Design of Liquid Crystals with “de Vries-like” Properties: Frustration between SmA- and SmC-Promoting Elements, J. Am. Chem. Soc. 132, 364 (2010).
- Yoon et al. [2011] H. Yoon, D. M. Agra-Kooijman, K. Ayub, R. P. Lemieux, and S. Kumar, Direct observation of diffuse cone behavior in de vries smectic- and - phases of organosiloxane mesogens, Phys. Rev. Lett. 106, 087801 (2011).
- Schubert et al. [2017] C. P. J. Schubert, C. Müller, A. Bogner, F. Giesselmann, and R. P. Lemieux, Design of liquid crystals with ‘de Vries-like’ properties: structural variants of carbosilane-terminated 5-phenylpyrimidine mesogens, Soft Matter 13, 3307 (2017).
- Ocak et al. [2011] H. Ocak, B. Bilgin-Eran, M. Prehm, S. Schymura, J. P. F. Lagerwall, and C. Tschierske, Effects of chain branching and chirality on liquid crystalline phases of bent-core molecules: blue phases, de Vries transitions and switching of diastereomeric states, Soft Matter 7, 8266 (2011).
- Sreenilayam et al. [2016] S. P. Sreenilayam, Y. P. Panarin, J. K. Vij, V. P. Panov, A. Lehmann, M. Poppe, M. Prehm, and C. Tschierske, Spontaneous helix formation in non-chiral bent-core liquid crystals with fast linear electro-optic effect, Nat. Comm. 7, 11369 (2016).
- Green et al. [2019] A. A. S. Green, M. R. Tuchband, R. Shao, Y. Shen, R. Visvanathan, A. E. Duncan, A. Lehmann, C. Tschierske, E. D. Carlson, E. Guzman, M. Kolber, D. M. Walba, C. S. Park, M. A. Glaser, J. E. Maclennan, and N. A. Clark, Chiral incommensurate helical phase in a smectic of achiral bent-core mesogens, Phys. Rev. Lett. 122, 107801 (2019).
- Panarin et al. [2020] Y. P. Panarin, S. P. Sreenilayam, V. Swaminathan, C. Tschierske, and J. K. Vij, Observation of an anomalous sma-smc-sma phase sequence in a bent-core liquid crystal derived from 4-cyanoresorcinol, Phys. Rev. Res. 2, 013118 (2020).
- Kaur et al. [2022] S. Kaur, A. Barthakur, G. Mohiuddin, S. P. Gupta, S. Dhara, and S. K. Pal, Observation of “de vries-like” properties in bent-core molecules, Chem. Sci. 13, 2249 (2022).
- Niori et al. [1996] T. Niori, T. Sekine, J. Watanabe, T. Furukawa, and H. Takezoe, Distinct ferroelectric smectic liquid crystals consisting of banana shaped achiral molecules, J. Mater. Chem. 6, 1231 (1996).
- Link et al. [1997] D. R. Link, G. Natale, R. Shao, J. E. Maclennan, N. A. Clark, E. Körblova, and D. M. Walba, Spontaneous Formation of Macroscopic Chiral Domains in a Fluid Smectic Phase of Achiral Molecules, Science 278, 1924 (1997).
- Jákli et al. [2018] A. Jákli, O. D. Lavrentovich, and J. V. Selinger, Physics of liquid crystals of bent-shaped molecules, Rev. Mod. Phys. 90, 045004 (2018).
- Takezoe and Eremin [2019] H. Takezoe and A. Eremin, Bent-Shaped Liquid Crystals: Structures and Physical Properties (CRC Press, Boca Raton, 2019).
- Sekine et al. [1997] T. Sekine, Y. Takanishi, T. Niori, and J. W. Takezoe, Ferroelectric Properties in Banana-Shaped Achiral Liquid Crystalline Molecular Systems, Jpn. J. Appl. Phys. 36, L1201 (1997).
- Eremin et al. [2001] A. Eremin, S. Diele, G. Pelzl, H. Nádasi, W. Weissflog, J. Salfetnikova, and H. Kresse, Experimental evidence for an achiral orthogonal biaxial smectic phase without in-plane order exhibiting antiferroelectric switching behavior, Phys. Rev. E 64, 051707 (2001).
- Reddy et al. [2011] R. A. Reddy, C. Zhu, R. Shao, E. Korblova, T. Gong, Y. Shen, E. Garcia, M. A. Glaser, J. E. Maclennan, D. M. Walba, and N. A. Clark, Spontaneous ferroelectric order in a bent-core smectic liquid crystal of fluid orthorhombic layers, Science 332, 72 (2011).
- Coleman et al. [2003] D. Coleman, J. Fernsler, N. Chattham, M. Nakata, Y. Takanishi, E. Körblova, D. R. Link, R.-F. Shao, W. Jang, J. Maclennan, et al., Polarization-modulated smectic liquid crystal phases, Science 301, 1204 (2003).
- Vaupotič et al. [2007] N. Vaupotič, M. Čopič, E. Gorecka, and D. Pociecha, Modulated structures in bent-core liquid crystals: Two faces of one phase, Phys. Rev. Lett. 98, 247802 (2007).
- Yoon et al. [2010] D. K. Yoon, R. Deb, D. Chen, E. Körblova, R. Shao, K. Ishikawa, N. V. S. Rao, D. M. Walba, I. I. Smalyukh, and N. A. Clark, Organization of the polarization splay modulated smectic liquid crystal phase by topographic confinement, Proceedings of the National Academy of Sciences 107, 21311 (2010).
- Chattham et al. [2015] N. Chattham, M.-G. Tamba, R. Stannarius, E. Westphal, H. Gallardo, M. Prehm, C. Tschierske, H. Takezoe, and A. Eremin, Leaning-type polar smectic- phase in a freely suspended bent-core liquid crystal film, Phys. Rev. E 91, 030502 (2015).
- Mishra et al. [2023] V. D. Mishra, H. T. Srinivasa, and A. Roy, Leaning induced layer undulated tilted smectic phase of asymmetric bent-core liquid crystals, J. Chem. Phys. 158, 074906 (2023).
- Hough et al. [2009] L. E. Hough, M. Spannuth, M. Nakata, D. A. Coleman, C. D. Jones, G. Dantlgraber, C. Tschierske, J. Watanabe, E. Körblova, D. M. Walba, J. E. Maclennan, M. A. Glaser, and N. A. Clark, Chiral isotropic liquids from achiral molecules, Science 325, 452 (2009).
- Takanishi et al. [1999] Y. Takanishi, T. Izumi, J. Watanabe, K. Ishikawa, H. Takezoe, and A. Iida, Field-induced molecular reorientation keeping a frustrated structure in an achiral bent-shaped liquid crystal, J. Mater. Chem. 9, 2771 (1999).
- Pelz et al. [2003] K. Pelz, W. Weissflog, U. Baumeister, and S. Diele, Various columnar phases formed by bent-core mesogens, Liquid Crystals 30, 1151 (2003).
- Folcia et al. [2006] C. L. Folcia, J. Etxebarria, J. Ortega, and M. B. Ros, Structural study of a bent-core liquid crystal showing the - transition, Phys. Rev. E 74, 031702 (2006).
- Blanshard and Lillford [1993] J. M. V. Blanshard and P. Lillford, The glassy state in foods (Nottingham Univ. Press, Loughborough, England, 1993).
- Greer [1995] A. L. Greer, Metallic Glasses, Science 267, 1947 (1995).
- Crowe et al. [1998] J. H. Crowe, J. F. Carpenter, and L. M. Crowe, The role of vitrification in anhydrobiosis, Annual Review of Physiology 60, 73 (1998).
- Debenedetti and Stillinger [2001] P. G. Debenedetti and F. H. Stillinger, Supercooled liquids and the glass transition, Nature 410, 259 (2001).
- Angell [1995] C. A. Angell, Formation of Glasses from Liquids and Biopolymers, Science 267, 1924 (1995).
- Dyre [2006] J. C. Dyre, Colloquium: The glass transition and elastic models of glass-forming liquids, Rev. Mod. Phys. 78, 953 (2006).
- Elschner et al. [1999] R. Elschner, R. Macdonald, H. J. Eichler, S. Hess, and A. M. Sonnet, Molecular reorientation of a nematic glass by laser-induced heat flow, Phys. Rev. E 60, 1792 (1999).
- Zeller [1982] H. R. Zeller, Dielectric relaxation and the glass transition in nematic liquid crystals, Phys. Rev. Lett. 48, 334 (1982).
- Rzoska et al. [2003] S. J. Rzoska, M. Paluch, S. Pawlus, A. Drozd-Rzoska, J. Ziolo, J. Jadzyn, K. Czuprynski, and R. Dabrowski, Complex dielectric relaxation in supercooling and superpressing liquid-crystalline chiral isopentylcyanobiphenyl, Phys. Rev. E 68, 031705 (2003).
- Dierking [2008] I. Dierking, Experimental investigations of a chiral smectic glass‐forming liquid crystal, Liquid Crystals 35, 1015 (2008).
- Wu et al. [2011] J. Wu, T. Usui, and J.-i. Hanna, Synthesis of a novel smectic liquid crystalline glass and characterization of its charge carrier transport properties, J. Mater. Chem. 21, 8045 (2011).
- Tarnacka et al. [2013] M. Tarnacka, K. Adrjanowicz, E. Kaminska, K. Kaminski, K. Grzybowska, K. Kolodziejczyk, P. Wlodarczyk, L. Hawelek, G. Garbacz, A. Kocot, and M. Paluch, Molecular dynamics of itraconazole at ambient and high pressure, Phys. Chem. Chem. Phy. 15, 20742 (2013).
- Jasiurkowska-Delaporte et al. [2016] M. Jasiurkowska-Delaporte, S. Napolitano, J. Leys, E. Juszyńska-Gałazka, M. Wübbenhorst, and M. Massalska-Arodź, Glass Transition Dynamics and Crystallization Kinetics in the Smectic Liquid Crystal 4-n-Butyloxybenzylidene---octylaniline (BBOA), J. Phys. Chem. B 120, 12160 (2016).
- Deptuch et al. [2022] A. Deptuch, S. Lalik, M. Jasiurkowska-Delaporte, E. Juszyńska-Gałazka, A. Drzewicz, M. Urbańska, and M. Marzec, Comparative study of electrooptic, dielectric, and structural properties of two glassforming antiferroelectric mixtures with a high tilt angle, Phys. Rev. E 105, 024705 (2022).
- Rauch et al. [2004] S. Rauch, C. Selbmann, P. Bault, H. Sawade, G. Heppke, O. Morales-Saavedra, M. Y. M. Huang, and A. Jákli, Glass forming banana-shaped compounds: Vitrified liquid crystal states, Phys. Rev. E 69, 021707 (2004).
- Teerakapibal et al. [2018] R. Teerakapibal, C. Huang, A. Gujral, M. D. Ediger, and L. Yu, Organic glasses with tunable liquid-crystalline order, Phys. Rev. Lett. 120, 055502 (2018).
- Chen et al. [2020] Z. Chen, J. Yu, R. Teerakapibal, L. Meerpoel, R. Richert, and L. Yu, Organic glasses with tunable liquid-crystalline order through kinetic arrest of end-over-end rotation: the case of saperconazole, Soft Matter 16, 2025 (2020).
- Miyasato et al. [1983] K. Miyasato, S. Abe, H. Takezoe, A. Fukuda, and E. Kuze, Direct method with triangular waves for measuring spontaneous polarization in ferroelectric liquid crystals, Jpn. J. Appl. Phy. 22, L661 (1983).
- Pratap et al. [2019] G. Pratap, D. Malkar, E. Varathan, N. P. Lobo, A. Roy, and T. Narasimhaswamy, 3-cyano thiophene-based -conjugated mesogens: Xrd and 13c nmr investigations, Liquid Crystals 46, 680 (2019).
- Govind and Madhusudana [2001] A. S. Govind and N. V. Madhusudana, A simple molecular theory of smectic-C liquid crystals, Europhysics Letters 55, 505 (2001).
- Song et al. [2013] Q. Song, D. Nonnenmacher, F. Giesselmann, and R. P. Lemieux, Tuning ‘de Vries-like’ properties in siloxane - and carbosilane-terminated smectic liquid crystals, J. Mater. Chem. C 1, 343 (2013).
- Kumar Singh et al. [2016] H. Kumar Singh, S. Kumar Singh, R. Nandi, D. S. Shankar Rao, S. Krishna Prasad, R. K. Singh, and B. Singh, Observation of exceptional ‘de Vries-like’ properties in a conventional aroylhydrazone based liquid crystal, RSC Advances 6, 57799 (2016).
- Havriliak and Negami [1966] S. Havriliak and S. Negami, A complex plane analysis of -dispersions in some polymer systems, Journal of Polymer Science Part C: Polymer Symposia 14, 99 (1966).
- Havriliak and Negami [1967] S. Havriliak and S. Negami, A complex plane representation of dielectric and mechanical relaxation processes in some polymers, Polymer 8, 161 (1967).
- Kremer and Schönhals [2003] F. Kremer and A. Schönhals, eds., Broadband Dielectric Spectroscopy (Springer, 2003).
- Davidson and Cole [1951] D. W. Davidson and R. H. Cole, Dielectric Relaxation in Glycerol, Propylene Glycol, and n‐Propanol, J. Chem. Phys. 19, 1484 (1951).
- Cole and Cole [1941] K. S. Cole and R. H. Cole, Dispersion and Absorption in Dielectrics I. Alternating Current Characteristics, J. Chem. Phys. 9, 341 (1941).
- Angell et al. [1990] C. A. Angell, L. Monnerie, and L. M. Torell, Strong and Fragile Behavior in Liquid Polymers, MRS Online Proceedings Library 215, 3 (1990).
- Souletie [1990] J. Souletie, The glass transition: dynamic and static scaling approach, Journal de Physique 51, 883 (1990).
Appendix A Optical tilt
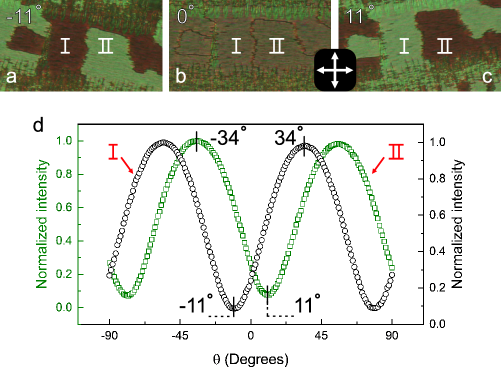
The optical tilt in the SmC phase of compound BTCN8 is the angle between the optic axis and the layer normal. In the SmC phase, two oppositely tilted domains were observed for a planar aligned sample of thickness 5 m in POM between crossed polarizers. These domains appear optically identical when the rubbing direction of the LC cell is parallel, i.e., to the analyzer as shown in figure S1b. On rotating the sample stage clockwise (anticlockwise), domain I (domain II) becomes darkest when the rubbing direction makes an angle of about 11∘ with respect to the analyzer as shown in figure S1a (S1c). A domain appears darkest when the local optic axis aligns with the analyzer, and the corresponding rotation angle gives the optical tilt angle . Figure S1d shows the detailed variation of normalized intensity as a function of the rotation angle in domains I and II. The two domains appear optically identical at angles -90∘, -45∘, 0∘, 45∘, and 90∘ due to the symmetric optical tilt in opposite directions in the two domains. The minima of the curves near give the , and the brightest positions occur at an angle of 45∘ from the darkest positions in the respective domains.
Appendix B Polarization current measurements
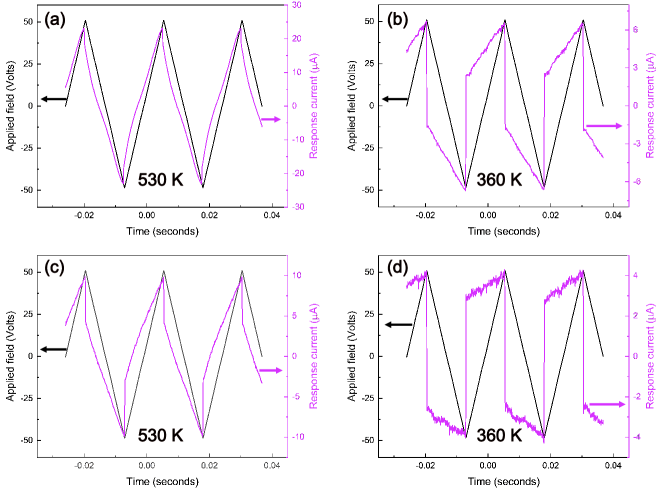
The triangular wave technique [50] was utilized in order to determine the state of spontaneous polarization in the de Vries SmA (dSmA) and SmC phases of our compound. A triangular wave voltage of amplitude 50 V at frequency 40 Hz was applied across the sample. The current response of a 5 m thick planar-aligned sample in the dSmA and SmC phase are shown in figure S2a and S2b, respectively. The absence of peaks corresponding to polarization reversal current in both phases confirms that the layers do not possess spontaneous polarization. Similar experiments were performed on a 9 m thick homeotropically aligned sample. The current response for this alignment in the dSmA and SmC phase are shown in figure S2c and S2d, respectively. No polarization reversal current was observed again, confirming the apolar nature of the layers.
Appendix C Electro-optical measurements
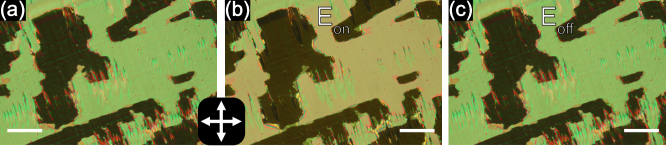
The textural changes in the dSmA and SmC phases were observed with the application of a triangular wave voltage. The texture in the dSmA phase does not change appreciably with the applied field, even at an amplitude of about 10 V/m. On the other hand, the color of the texture changes slightly in the lower temperature SmC phase even at a small field of about 2 V/m as shown in figure S3a and S3b. The changes in the color indicate a slight increase in the birefringence of the sample, which arises due to more localized molecular distribution on the tilt cone, as described in the main text. This field-induced transformation is reversible in nature as the original texture can be retrieved after removing the field, as shown in figure S3c.
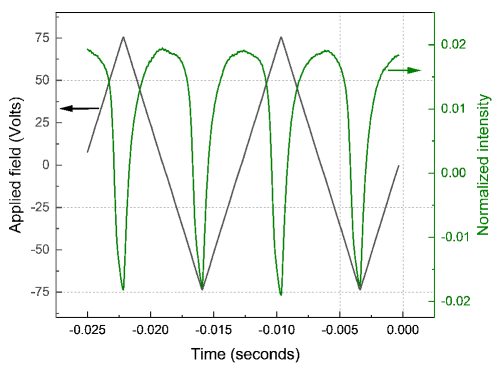
The optical transmittance of the sample in the SmC phase was measured as a function of time under the application of a triangular wave voltage of amplitude 75 V and frequency 80 Hz. The details of the experimental setup are given in the main text. The steady-state normalized optical transmittance through a planar aligned sample kept between crossed polarizers at 393 K is shown in figure S4. The figure S4 also depicts the time trace of the applied triangular wave voltage. The optical signal has a 2 response with respect to the applied electric field, suggesting a quadratic coupling between the field and the dielectric anisotropy of the sample. This result also indicates the absence of polarization in the SmC phase. As seen from figure S4, the transmitted intensity is maximum at zero fields and decreases with increasing magnitude of the field. This is due to the optical phase difference () lying between and for our 5 m thick sample.
Appendix D Dielectric studies
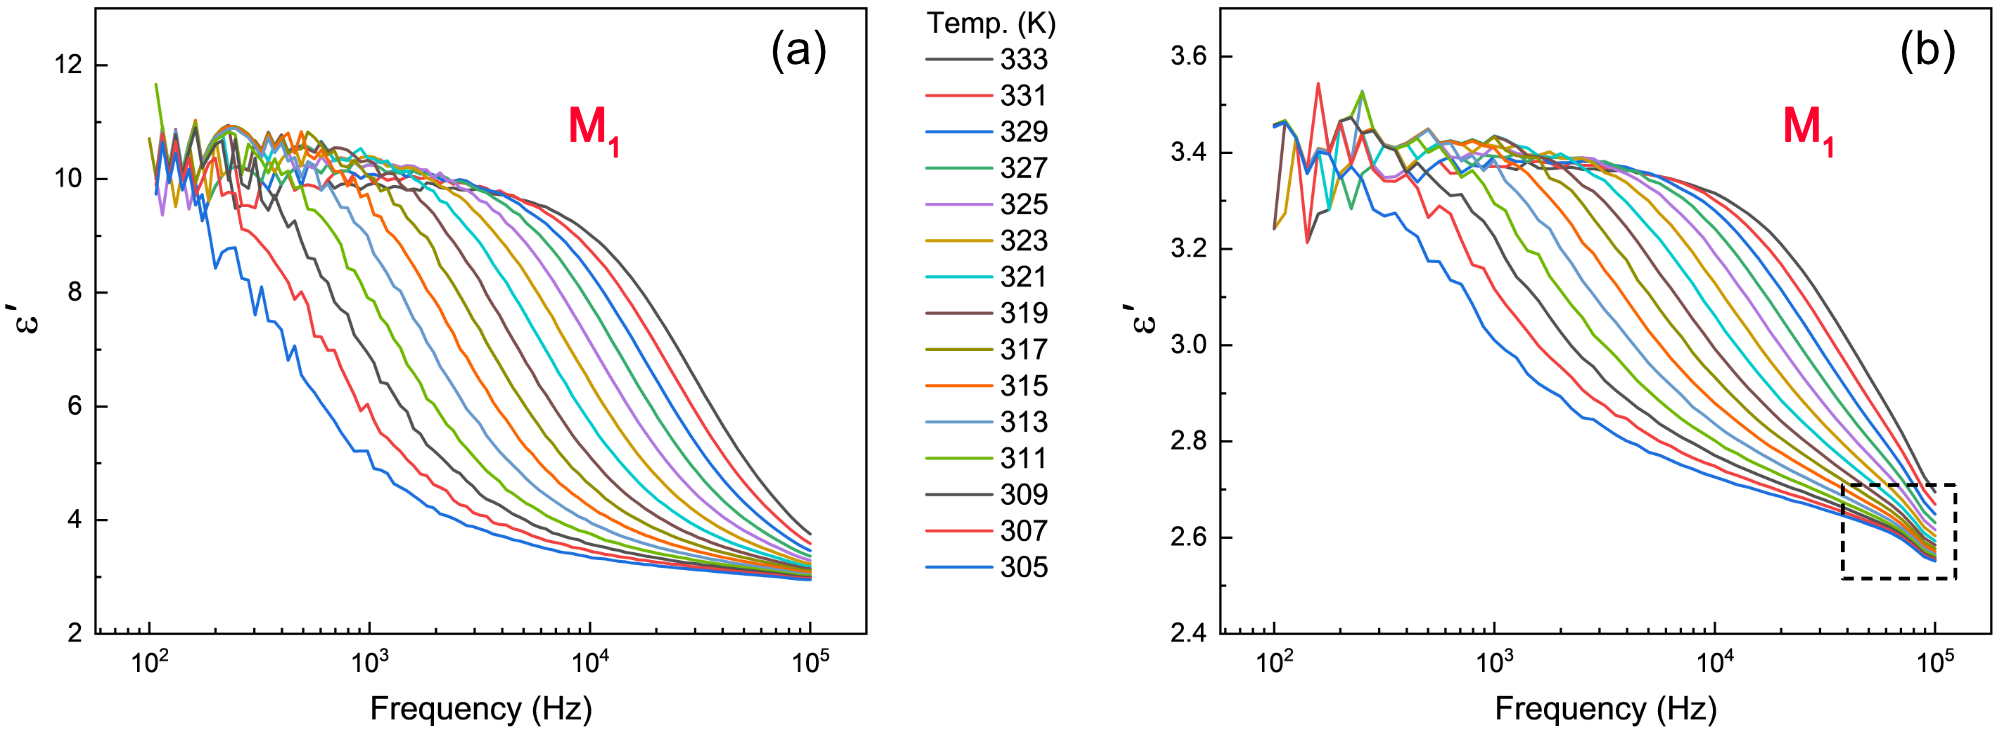
The real part of the dielectric constant was also measured in a homemade custom setup as a function of frequency for planar as well as homeotropic aligned samples at various temperatures. For the planar aligned sample, the dielectric relaxation shown in figure S5a agrees very well with the measurements performed using a commercially available setup (Novocontrol Alpha A). This further confirms that the relaxation process arises from the sample. In commercially available homeotropic LC cells of thickness 9 m, the molecular alignment is found to be quasi-homeotropic with a large number of bright spots in the POM texture between crossed polarizers, as shown in figure S6. The dielectric measurements in this homeotropic cell also show the presence of the relaxation mode with much reduced dielectric strength (see figure S5b). This clearly indicates the negative dielectric anisotropy of the sample in the observed smectic phases. However, the presence of the mode in the homeotropic sample is not expected; it perhaps arises due to the quasi-homeotropic nature of the molecular alignment in the cell.
The POM textures of the sample in a homeotropic cell of thickness 9 m under crossed polarizers are shown in figure S6. While cooling the sample to the dSmA phase, the molecules tend to align homeotropically, having a dark texture interspersed with numerous bright spots, as shown in figure S6a. This texture indicates a quasi-homeotropic alignment of the molecules. In the SmC phase at lower temperatures, the sample acquires an inhomogeneous grainy texture, as shown in figure S6b, instead of an expected schlieren texture.