Ab initio insights on the ultrafast strong-field dynamics of anatase TiO2
Abstract
Electron dynamics of anatase TiO2 under the influence of ultrashort and intense laser field is studied using the real-time time-dependent density functional theory (TDDFT). Our findings demonstrate the effectiveness of TDDFT calculations in modeling the electron dynamics of solids during ultrashort laser excitation, providing valuable insights for designing and optimizing nonlinear photonic devices. We analyze the perturbative and non-perturbative responses of TiO2 to 30 fs laser pulses at 400 and 800 nm wavelengths, elucidating the underlying mechanisms. At 400 nm, ionization via single photon absorption dominates, even at very low intensities. At 800 nm, we observe ionization through two-photon absorption within the intensity range of to W/cm2, with a transition from multiphoton to tunneling ionization occurring at W/cm2. We observe a sudden increase in energy and the number of excited electrons beyond W/cm2, leading to their saturation and subsequent laser-induced damage. We estimate the damage threshold of TiO2 for 800 nm to be 0.1 J/cm2. In the perturbative regime, induced currents exhibit a phase shift proportional to the peak intensity of the laser pulse. This phase shift is attributed to the intensity-dependent changes in the number of free carriers, indicative of the optical Kerr effect. Leveraging the linear dependence of phase shift on peak intensities, we estimate the nonlinear refractive index () of TiO2 to be cm2/W.
I Introduction
Time-dependent density-functional theory (TDDFT) [1] describes the quantum dynamics of electrons under the influence of a time-dependent external potential [2, 3, 4, 5, 6, 7]. TDDFT calculations are used to study ultrashort laser-matter interactions including high-harmonic generation (HHG) [8, 9, 10], nonlinear current injection [11, 12], formation of Floquet-Bloch states [13, 14], laser ablation [15, 16]. TDDFT computations have also been utilized to distinguish between the purely electronic and phononic contribution to non-equilibrium dynamics in metals caused by lasers [17]. Furthermore, TDDFT has been applied to study the influence of the laser pulse widths in the formation of Nitrogen-Vacancy centers in the diamond lattice [18].
The strong-field response in solids has become an area of renewed interest due to recent experimental evidence that dielectrics can survive electric fields approaching their critical fields when exposed to laser pulses shorter than the electronic relaxation time scales [19, 20, 21]. Initiating, driving, and probing the nonlinear electron dynamics in crystalline materials is now possible with optical sub-cycle resolutions, opening the door for optical field-effect devices operating within single optical cycles and petahertz signal processing [22, 23, 24, 20, 25, 26, 21, 27, 28]. For instance, a reversible energy exchange at sub-30-attosecond timescales was observed in fused silica by Sommer et al. [27]. Under the influence of strong electric fields, it has been shown that the AC conductivity of fused silica increases by 18 orders of magnitude within one femtosecond [23] and is completely reversible. TDDFT calculations have shown that electron tunneling is the fundamental mechanism of carrier injection in silica under few-cycle extreme ultraviolet (XUV) illumination [26]. Materials undergo dynamic metallization [29, 22, 30, 31] when irradiated with optical pulses of amplitude as large as 1 V/Å. This observation was also supported by TDDFT calculations [11].
TDDFT calculations of ultrashort laser-induced electron dynamics for nonlinear photonic applications have so far been focused on Si [26, 15], SiO2 [31, 4, 15], linear carbon chain [32], diamond [33, 2, 34, 35], phospherene [36], MoS2 [37]. Titanium dioxide (TiO2), commonly used as a saturable absorber in passively Q-switched fiber lasers [38, 39], has great potential for enabling nonlinear photonics. The nonlinear optical response of anatase TiO2 has a typical recovery period of approximately 1.5 ps [40]. The nonlinear index () of bulk and thin-film of TiO2 ranges from 0.8–3 cm2/W [41, 42, 43], which is greater than the nonlinear index of silica fiber (2.48 10-16 cm2/W [44]). Moreover, the two-photon absorption of TiO2 at 800 nm is minimal, making it ideal for waveguides operating near 800 nm [45]. TiO2 can be formed at low temperatures (400 ∘C) and offers advantages over silicon nitride with its higher refractive index (2.4 vs. 2.0) and more than three times stronger Kerr non-linearity [41, 46, 47]. These properties enable back-end integration with silicon micro photonic devices. Existing estimates of of TiO2 are either from femtosecond z-scan measurements or by fitting the nonlinear pulse propagation simulations (based on the nonlinear Schrodinger equation) to the experimental data [48]. A systematic analysis of ultrafast nonlinear optical interactions in TiO2 from a microscopic perspective has yet to be explored.
This study uses first-principle simulations to examine the microscopic electron dynamics of crystalline anatase TiO2 modulated by an ultrashort and intense laser fields. We employ TDDFT calculations as implemented in the software package OCTOPUS [49]. We explore the response of anatase TiO2 to 800 nm and 400 nm laser pulses with intensities spanning from the perturbative to strong-field regimes (non-perturbative). Different regimes of nonlinear interactions with the external electric field are characterized, and various underlying mechanisms are analyzed. The evolution of photoinduced current and energy transfer during the interaction is studied. We determine the nonlinear refractive index and optical damage threshold of anatase TiO2, and our results are in excellent agreement with previously reported experimental data.
The paper is organized as follows. Section II describes the computational methods employed for determining the photoinduced current and the energy dynamics of TiO2. The results and analysis of our study are discussed in Section III, where we also compare them with the existing experimental data. We conclude the paper with a summary in Sec. IV.
II Computational Methods
II.1 Time-dependent Density Functional Theory
The electron dynamics in a unit cell of a periodic crystal driven by a time-dependent electric field is described in terms of the time-dependent Kohn-Sham (KS) equations
| (1) |
where denotes KS orbitals with the band index , the electron wave vector , and is the KS potential with denoting the external ionic potential, the Hartree potential, and the exchange-correlation (XC) potential. Furthermore, p is the momentum operator and is the vector potential composed of the applied vector potential and an XC contribution [50]. The applied vector potential represents an applied electromagnetic field, such as a laser pulse, and is related to the applied electric field by . Note that the laser pulse can be treated as spatially uniform under the dipole approximation. Solving the time-dependent KS equations with the exact XC potential and XC vector potential yields the exact time-dependent electron density . However, in practice approximations are used, e.g., a particular approximation is used to express the XC potential [51], the adiabatic approximation is applied, and the is often neglected. We follow the general practice by applying these approximations as detailed below. Note that we adopt Hartree atomic units, i.e., .
Another useful quantity is the microscopic current density which is determined in the outlined framework as
| (2) |
where the summation runs over the occupied bands. The macroscopic current density along the laser polarization direction is obtained by averaging over the unit cell with volume ,
| (3) |
The polarization density corresponding to is . The time-resolved energy density transferred between the field and the material is evaluated by
| (4) |
Its resultant value at the end of the laser pulse determines the total amount of energy dissipated during the light-matter interaction. The number of electrons excited from the valence band to the conduction band per unit cell is calculated using [52]
| (5) |
Here is the KS orbital of the initial state, is the time-dependent KS orbital, and is the Kronecker delta function.
We use the real-space, real-time code Octopus [49] to carry out the TDDFT calculations. The laser-induced dynamics of valence electrons are calculated in a unit cell of anatase TiO2. Anatase TiO2 crystallizes with a tetragonal unit cell having a lattice spacing Å and . We treat the interaction between valence electrons and the ionic core by the Kleinman-Bylander pseudopotential [53]. The generalized gradient approximation (GGA) based on the Perdew-Burke-Ernzerhof functional (PBE) [54] is employed for the XC potential. KS orbitals are represented on the discretized real-space grid with Å and Å. It is equivalent to a plane-wave cut-off at 900 eV. The time-dependent KS equations are solved on a uniform grid with grid points. The Brillouin zone is uniformly sampled by Monkhorst-Pack grids [55]. The discretization consists of 363 symmetry-reduced k-points for polarized light. With this setup, the system’s total energy converges to within 1 meV.
First, the ground state of TiO2 is calculated, which will be used as the initial state for the time-dependent calculations. We then time-propagate the KS orbital by solving Eq. (1) in the time domain. The time evolution is calculated with the approximated enforced time-reversal symmetry (AETRS) [56] as the time-evolution propagator with a time step . The total simulation duration is 30 fs (1240 atomic units with a step size of 0.02 a.u., i.e., 64000 time steps). Note that, during the time evolution, ions are at their equilibrium positions in the ground state. Furthermore, the adiabatic approximation [57] is used which means that the time dependence of the XC potential is approximated by evaluating a ground-state XC functional at the time-dependent density.
We calculate the response of TiO2 to a linearly polarized laser pulse, which is represented by the spatially-uniform electric field through the corresponding vector potential
| (6) |
where is the central frequency of the laser pulse and is the amplitude of the time-dependent electric field , which is related to the laser peak intensity .
III Results
The following section presents the electron dynamics of crystalline anatase TiO2 excited by 800 nm and 400 nm laser pulses represented by Eq. (6). The duration of the pulse is set to T =30 fs (12 fs at the FWHM of the envelope.), while the amplitude of the pulse is varied from to W/cm2. The laser field is polarized along the -axis.
III.1 Energy Transfer Dynamics
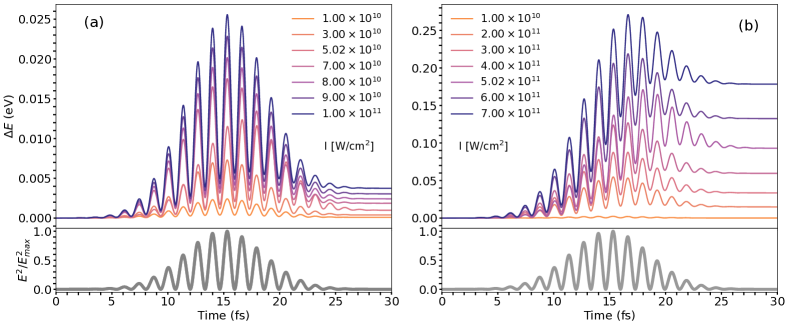
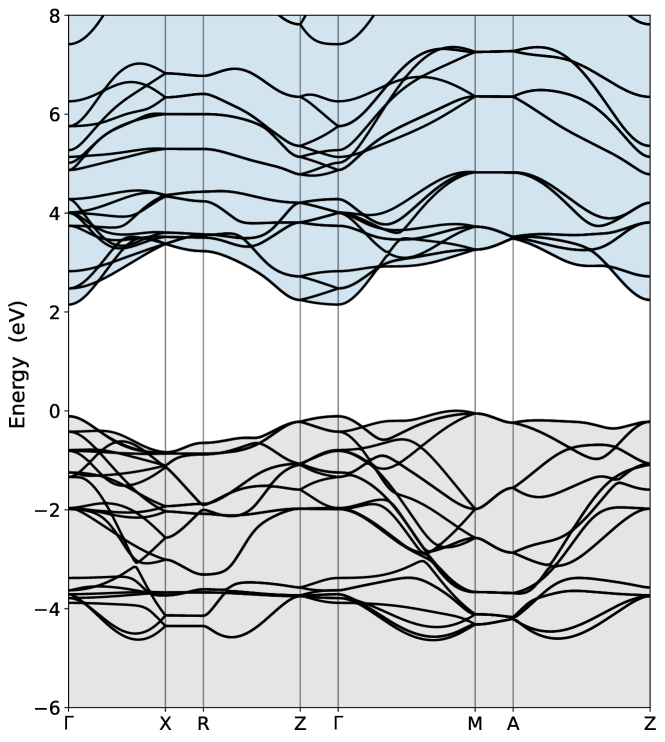
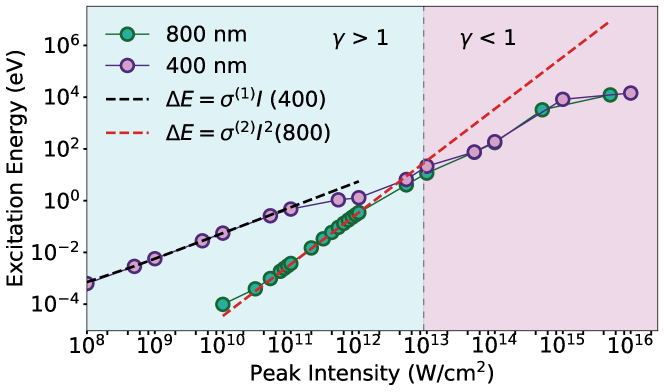
The energy transferred from the applied electric field to anatase TiO2 is evaluated by Eq. (4). Fig. 1 shows the resultant energy dynamics for incident laser pulses at 800 nm ( eV) with different peak intensities. The central frequency of the pulse corresponds to energy lower than the direct gap (2.25 eV) [58], leading to two general types of temporal energy transfer profiles. The first type is non-resonant excitation. The transferred energy, in this case, oscillates synchronously with the , and the system almost returns to the ground state at the end of the pulse. This represents a virtual energy transfer from the laser pulse to the electrons. Such dynamics is observed in Fig. 1(a) for peak intensities from to W/cm2. This behavior is typical when the frequency is below the bandgap, and the intensity is very low.
The second kind of response is resonant excitation, where, along with the virtual oscillations, the transferred energy gradually increases during the pulse and persists beyond the pulse width. Given the pulse energy is below the bandgap, this occurs when the field is strong enough to induce real excitation through multi-photon absorption. Fig. 1(b) illustrates the energy transfer for this scenario, observed for intensities ranging from to W/cm2. The permanent energy transfer is related to creating electron-hole pairs, corresponding to the population transfer from valence bands to conduction bands.
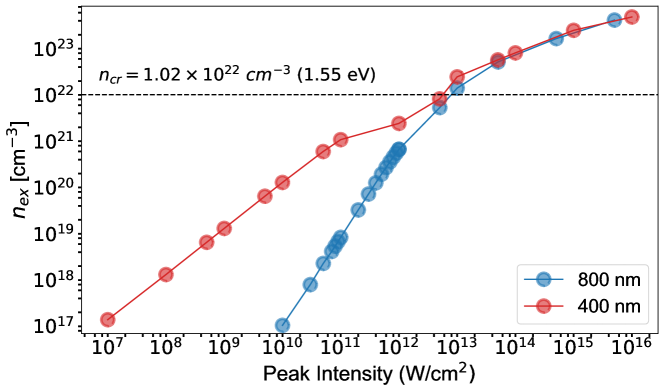
Figure 2 illustrates the residual excitation energy in anatase TiO2 after interacting with 800 and 400 nm laser pulses at different peak intensities. The energy absorbed at a wavelength of 400 nm is directly related to the intensity of the light and can be accurately described by the equation governing single-photon absorption, where is a constant coefficient. This relationship holds true for light intensities lower than W/cm2. This linear absorption behavior at 400 nm is expected since the single photon (3.10 eV) bridges the direct gap of anatase TiO2. Conversely, single photon absorption below the direct bandgap is unlikely at 800 nm, and hence, no permanent energy transfer for intensities below W/cm2. As the intensity increases from W/cm2 upto W/cm2, the deposited energy increases and closely follows a quadratic dependence on intensity (Fig. 2).
At approximately W/cm2 intensity, the excitation energies of 400 nm and 800 nm wavelengths combine to form a single curve. Below the intersection point, the excitation energy displays a perturbative behavior that can be effectively modeled by , where represents the laser intensity, and corresponds to the number of photons required to exceed the bandgap energy. At intensities above the intersection region, the excitation energy is independent of laser frequency, and the curve’s slope decreases compared to the region below the intersection [4]. It suggests that there is a saturation-like behavior occurring in the material’s response. The similarity of the number density of excited electrons for both 800 nm and 400 nm beyond W/cm2 also indicates the saturation effects [59]. For intensities higher than W/cm2, the energy transfer exhibits an abrupt increase, indicating the onset of material laser-induced dielectric breakdown, as outlined in Sec. III.4
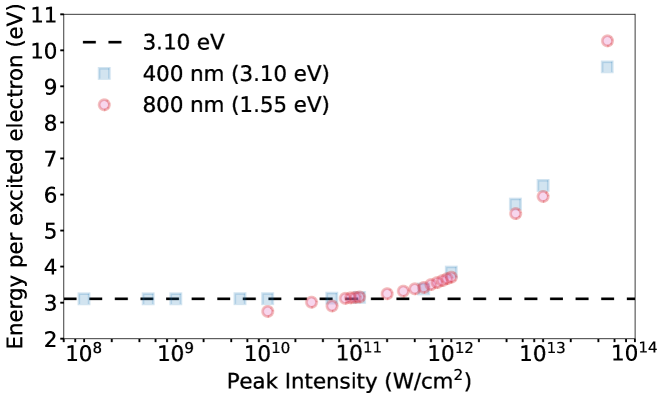
Next, we analyze the energy of excited electrons at 800 nm and 400 nm beyond the pulse duration. The residual energy per excited electron () is obtained by dividing the energy (Fig. 1) by the number of excited electrons [59] at their saturation values. The results are shown in Fig. 3. At 400 nm, is approximately 3.10 eV for intensities up to W/cm2, indicating single photon absorption. At 800 nm, no excited electrons are observed until the intensity reaches W/cm2. However, it approaches twice the photon energy (3.10 eV) for intensities ranging from W/cm2 to W/cm2, indicating ionization by two-photon absorption. gradually increases above 3.10 eV reference line for intensities larger than W/cm2 in Fig. 3, potentially due to higher-order multiphoton absorption and secondary excitation of excited electrons [60, 61].
The Keldysh parameter, denoted by , serves as an approximate measure to determine the type of strong field ionization [60]. The Keldysh parameter for the interaction of a laser pulse of frequency and field amplitude with a material of energy gap is given by
| (7) |
where , is the peak intensity of the laser pulse and and are the charge and mass of electron, respectively. The condition represents multi-photon ionization being the primary mechanism of ionization whereas indicates that tunneling ionization dominates. As the intensity of the laser pulse increases, a transition from multi-photon absorption to tunneling ionization can be observed. The Keldysh parameter at 800 nm is calculated at different peak intensities. Based on the value of , the intensities over which multiphoton or tunneling ionization dominate are highlighted in Fig. 2. When W/cm2, the Keldysh parameter assumes a value of 1. It indicates that, for 800 nm, below an intensity of W/cm2, the ionization is predominantly via multiphoton absorption and tunneling ionization above it.
III.2 Saturation of photo-induced current at 400 nm
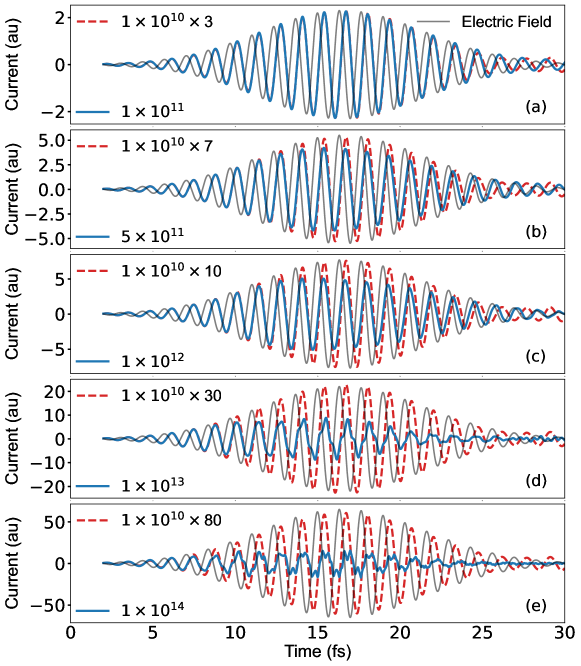
Figure 4 shows the induced current for a laser pulse at 400 nm and a pulse duration of 30 fs with peak intensities ranging from W/cm2 to W/cm2. We take the current profile at W/cm2 as the reference (weak) current to discuss the dynamics. In Figs. 4 (a-e), the reference current is multiplied by a suitable factor so that the difference between currents at weak and strong field strengths indicates the nonlinear interaction. When the response is linear, the currents for weak and strong intensities will coincide and show similar profiles.
In Fig. 4(a), the temporal evolution of the current at W/cm2 follows the driving laser field, and it coincides with the reference current, indicating a linear response. The response is dielectric-like: the current is phase shifted with the electric field . For W/cm2 (Fig. 4(b-e)), the induced current is initially very close to that of the reference current. However, as the electric field of the pulse increases, the induced current gradually becomes weaker than expected from the linear response. This nonlinear effect of suppression of induced current occurs due to the bleaching of valence band electrons by absorption at 400 nm [7, 5]. The majority of valence electrons are already excited, and the conduction bands are mostly filled, resulting in the suppression of further electron excitation. Additionally, because the frequency of the applied laser pulse is higher than the bandgap value, a significant current remains after the incident pulse has ended.
III.3 The Nonlinear Refractive Index Change
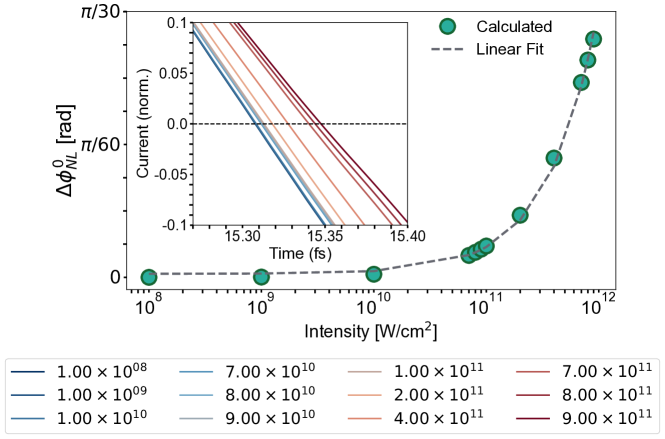
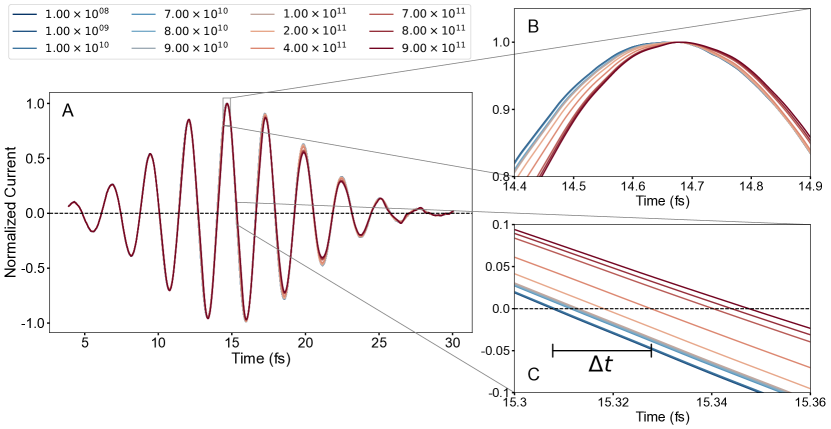
The phase shift of light-induced current at 800 nm is depicted for various intensities in Fig. 5 with the current at W/cm2 taken as the reference. For a pulse of given peak intensity, the induced current in the initial part of the pulse is in phase with the reference current. However, as the electric field of the pulse increases, the induced current starts accumulating a phase shift. The accumulated phase shift calculated from the temporal shift at the zero-crossing after the peak of the pulse () [62] in Fig. 5 increases as the peak intensity is increased. The phase shift can be related to the optical Kerr effect where the optical material density is proportional to the intensity envelope of the driving field [27, 63]. The increase in phase shift can be described as a linear rise with intensity , with cm2/W. From the relation , where and Å, the propagation length, the nonlinear refractive index cm2/W can be extracted for 800 nm, 30 fs pulses.
III.4 Onset of dielectric breakdown
In Fig. 6, we present the time evolution of current, energy, and excited electron density for three different peak intensities, and W/cm2. The laser frequency is eV (800 nm), and the pulse duration is fs. The time profiles of the electric field and the induced current are depicted in Fig. 6 A(I-III). The electric field profile is normalized with respect to the peak of the induced current at a given peak intensity to enable a comparison of the relative phase. Fig. 6 B(I-III) present the number of excited electrons calculated using Eq. (5), while Fig. 6 C(I-III) depicts the excitation energy defined in Eq. (4) as a function of time.
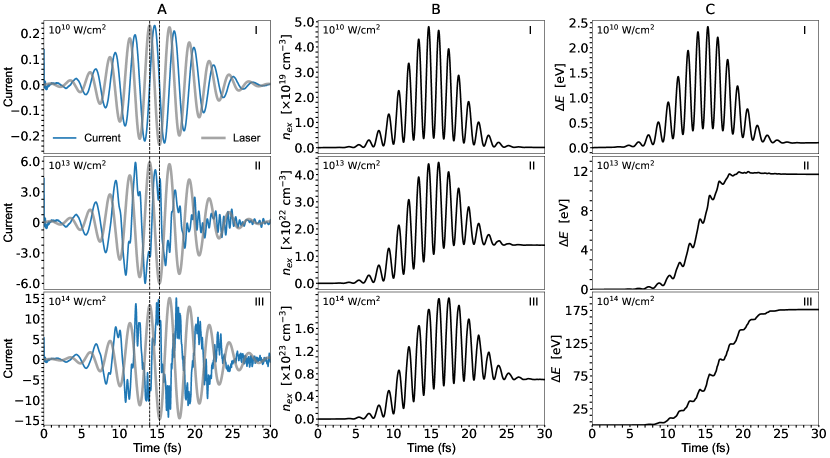
The induced current at intensities W/cm2 (Fig. 6 A(I)) follows the pulse’s electric field with a phase shift of , indicating a linear dielectric response. The excited electron density (Fig. 6 B(I)) and excitation energy (Fig. 6 C(I)) at this intensity oscillate synchronously with the electric field and the ground state conditions are restored after the interaction. The situation changes significantly at intensities of W/cm2 and W/cm2. The induced current during the interaction is distorted (Fig. 6 A(II) and A(III)), and the phase difference between the applied electric field and the induced current deviates from . For W/cm2, the current and the electric field become nearly out-of-phase, indicating a strongly nonlinear response of electrons to the incident field [4]. Starting from about 10 fs, the number of excited electrons and the excitation energy increase rapidly at W/cm2 (Fig. 6 B(II) and C(II)) and W/cm2 (Fig. 6 B(III) and C(III)). By 20 fs, these quantities reach saturation values. Even after the laser pulse ends, the oscillation of the induced current persists, which is a clear indication of the onset of optical breakdown [52]. This behavior is consistent with the abrupt increase in energy discussed in Sec. III.1 due to resonant energy transfer at the breakdown. However, such oscillations will eventually decay due to dissipative processes such as electron-phonon coupling, impurity, and disorder scattering on longer time scales ( fs) [11].
Electrons excited into the conduction band exhibit a metallic response, resulting in collective plasmon mode. The plasma frequency corresponding to an electron density can be estimated by
| (8) |
where is the dielectric constant of anatase TiO2 ( = 5.82) [64], and are the mass and charge of the electron respectively.
At an intensity W/cm2, the final number of excited electrons (Fig. 6 B(II)) is cm-3. This corresponds to a plasma frequency of eV, slightly higher than the frequency of the applied laser pulse ( eV). As the intensity of the applied field increases, the density of electrons excited via the two-photon and tunneling mechanisms in the conduction band also gradually increases. When the electron density reaches a threshold where the plasma and laser frequencies are in resonance, a significant energy transfer occurs from the laser to the electrons. The low-amplitude coherent oscillations of the induced current observed on the trailing edge of the laser pulse (Fig. 6 A(II) and A(III)) results from the partial coherence between the involved non-stationary states left by the laser field. It is characteristic of plasmonic metal systems [65]. This ultrafast and dissipative strong-field transition to plasmonic metal-like behavior is known as dynamic metallization [22, 66, 67]. Based on the dynamics presented in Fig. 2 and in Fig. 6, W/cm2 can be identified as the intensity at which the laser-induced damage starts. For 30 fs pulses (11.7 fs FWHM), this intensity corresponds to a damage threshold of 0.1 J/cm2.
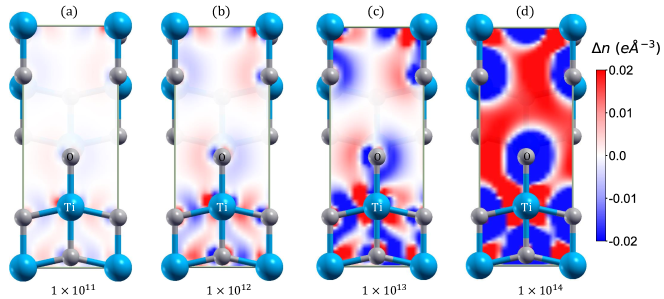
The dynamics outlined in the preceding section are represented by the change in electron density induced by the laser pulse in Fig. 7. The snapshots displayed here for various peak intensities indicate the difference in electron density between the perturbed and unperturbed systems at the instant when the electric field of the pulse reaches zero right after its peak value. The positive (increase from the ground state) and the negative (reduction from the ground state) variations in the density are denoted in Figs. 7 (c) and (d) by red and blue, respectively. When the laser is weak [Figs. 7 (a) and (b)], the variation of electron density around ionic cores is uniform corresponding to a linear and adiabatic response. At higher laser intensity [Figs. 7 (c) and (d)], the charge distribution extends into the interstitial region, indicating the laser-induced population of delocalized conduction band levels [33].
III.5 Comparison with experiments
| (cm2/W) | (nm) | Pulse width | Ref. |
|---|---|---|---|
| 532, 780 | 35 fs | [68] | |
| 800 | 50 fs | [69] | |
| 800 | 50 fs | [43] | |
| 800 | 60 fs | [70] | |
| 800 | 250 fs | [40] | |
| 800 | 250 fs | [71] | |
| 532 | 5 ns | [72] | |
| 532 | 7 ns | [73] | |
| 800 | 30 fs | This Work |
| LIDT (J/cm2) | (nm) | Pulse width | Ref. |
|---|---|---|---|
| 0.5 | 800 | 50 fs | [74] |
| 0.6 | 800 | 220 fs | [74] |
| 1.43 | 532 | 10 ns | [75] |
| 2.09 | 1064 | 10 ns | [75] |
| 0.1 | 800 | 30 fs | This Work |
Now let’s compare the figures estimated in the current work for TiO2’s nonlinear refractive index () and laser-induced damage threshold (LIDT) with those found in the literature. The measured value of of TiO2 reported in the literature is summarised in Table 1. The calculated value of for 30 fs pulses at 800 nm in the current work is about three orders of magnitude greater than that measured using identical wavelength and pulse widths [68]. The variability of experimental data of presented in Table 1 shows that the duration and frequency of the laser pulse have a significant impact on the observed value of . Moreover, the measured value of vary due to a variety of factors, including nonlinear refraction dispersion, different sizes and volume fractions of synthesized materials, the effect of structure confinement in the case of nanostructured compounds, etc. The simulations described here are for the bulk phase of TiO2, whereas the majority of the reported was for thin films of TiO2. Additionally, the collisional relaxation not taken into account in the current work, becomes significant for laser pulses longer than fs.
Table 2 presents the experimental literature for the laser-induced damage threshold (LIDT) of TiO2. We calculated the damage threshold using the critical density criterion, similar to that measured in experiments with comparable parameters. The damage threshold depends on the frequency and duration of the laser pulse and dynamics toward thermal distribution. The thermal effects probably can be neglected in our case because an ultra-short pulsed laser ( fs) was used. The bandgap of TiO2 in the present study is underestimated due to the GGA functionals [76]. Using more accurate functionals leads to a larger bandgap. This would lead to a higher damage threshold in agreement with the trend of the experimental data [77].
IV Summary
We presented a systematic investigation of perturbative and non-perturbative electron dynamics of TiO2 to 30 fs laser pulses at 400 nm and 800 nm using ab initio time-dependent density functional theory. The mechanism of nonlinear optical interaction of TiO2 at different intensities is discussed. We can see the onset of laser-induced material damage and the accompanying plasmon dynamics from first-principles. The trends of the value of the nonlinear refractive index () and laser-induced damage threshold obtained from the simulations are consistent with the experimental data in the literature. Non-resonant, perturbative interactions at 800 nm and the accompanying nonlinear phase shift observed in TiO2 well below the damage threshold hold promises incorporating TiO2 in optical switches. The present study could guide the further exploration of laser parameters and structural and defect engineering of TiO2 with tailored properties for specific applications, potentially leading to improved performance in nonlinear photonics devices. By pursuing these directions, researchers can advance the understanding and utilization of TiO2 and similar materials for nonlinear photonics applications.
V Acknowledgments
This work was in part supported by the Center for Advanced Systems Understanding (CASUS) which is financed by Germany’s Federal Ministry of Education and Research (BMBF) and by the Saxon state government out of the State budget approved by the Saxon State Parliament.
References
- Runge and Gross [1984] E. Runge and E. K. Gross, Density-functional theory for time-dependent systems, Physical review letters 52, 997 (1984).
- Bertsch et al. [2000] G. F. Bertsch, J.-I. Iwata, A. Rubio, and K. Yabana, Real-space, real-time method for the dielectric function, Physical Review B 62, 7998 (2000).
- Yabana et al. [2012] K. Yabana, T. Sugiyama, Y. Shinohara, T. Otobe, and G. F. Bertsch, Time-dependent density functional theory for strong electromagnetic fields in crystalline solids, Phys. Rev. B 85, 045134 (2012).
- Yamada and Yabana [2019] A. Yamada and K. Yabana, Energy transfer from intense laser pulse to dielectrics in time-dependent density functional theory, Eur. Phys. J. D 73, 87 (2019).
- Uemoto et al. [2019] M. Uemoto, Y. Kuwabara, S. A. Sato, and K. Yabana, Nonlinear polarization evolution using time-dependent density functional theory, The Journal of chemical physics 150, 094101 (2019).
- Uemoto et al. [2021] M. Uemoto, S. Kurata, N. Kawaguchi, and K. Yabana, First-principles study of ultrafast and nonlinear optical properties of graphite thin films, Physical Review B 103, 085433 (2021).
- Hashmi et al. [2022] A. Hashmi, S. Yamada, A. Yamada, K. Yabana, and T. Otobe, Nonlinear dynamics of electromagnetic field and valley polarization in wse2 monolayer, Applied Physics Letters 120, 051108 (2022).
- Tancogne-Dejean et al. [2017] N. Tancogne-Dejean, O. D. Mücke, F. X. Kärtner, and A. Rubio, Impact of the Electronic Band Structure in High-Harmonic Generation Spectra of Solids, Phys. Rev. Lett. 118, 087403 (2017).
- Floss et al. [2018] I. Floss, C. Lemell, G. Wachter, V. Smejkal, S. A. Sato, X.-M. Tong, K. Yabana, and J. Burgdörfer, Ab initio multiscale simulation of high-order harmonic generation in solids, Phys. Rev. A 97, 011401 (2018).
- Otobe [2012] T. Otobe, First-principle description for the high-harmonic generation in a diamond by intense short laser pulse, J. Appl. Phys. 111, 093112 (2012).
- Wachter et al. [2014] G. Wachter, C. Lemell, J. Burgdörfer, S. A. Sato, X.-M. Tong, and K. Yabana, Ab initio simulation of electrical currents induced by ultrafast laser excitation of dielectric materials, Physical review letters 113, 087401 (2014).
- Wachter et al. [2015] G. Wachter, S. A. Sato, I. Floss, C. Lemell, X.-M. Tong, K. Yabana, and J. Burgdörfer, Controlling ultrafast currents by the nonlinear photogalvanic effect, New J. Phys. 17, 123026 (2015).
- De Giovannini et al. [2016] U. De Giovannini, H. Hübener, and A. Rubio, Monitoring Electron-Photon Dressing in WSe2, Nano Lett. 16, 7993 (2016).
- Hübener et al. [2017] H. Hübener, M. A. Sentef, U. De Giovannini, A. F. Kemper, and A. Rubio, Creating stable Floquet–Weyl semimetals by laser-driving of 3D Dirac materials, Nat. Commun. 8, 1 (2017).
- Sato et al. [2015] S. A. Sato, K. Yabana, Y. Shinohara, T. Otobe, K.-M. Lee, and G. F. Bertsch, Time-dependent density functional theory of high-intensity short-pulse laser irradiation on insulators, Phys. Rev. B 92, 205413 (2015).
- Sato and Yabana [2016] S. A. Sato and K. Yabana, First-principles calculations for initial electronic excitation in dielectrics induced by intense femtosecond laser pulses, in Proceedings Volume 10014, Laser-Induced Damage in Optical Materials 2016, Vol. 10014 (SPIE, 2016) pp. 155–161.
- Niedermayr et al. [2022] A. Niedermayr, M. Volkov, S. A. Sato, N. Hartmann, Z. Schumacher, S. Neb, A. Rubio, L. Gallmann, and U. Keller, Few-Femtosecond Dynamics of Free-Free Opacity in Optically Heated Metals, Phys. Rev. X 12, 021045 (2022).
- Shimotsuma et al. [2023] Y. Shimotsuma, K. Kinouchi, R. Yanoshita, M. Fujiwara, N. Mizuochi, N. Mizuochi, M. Uemoto, M. Shimizu, and K. Miura, Formation of NV centers in diamond by a femtosecond laser single pulse, Opt. Express 31, 1594 (2023).
- Ghimire et al. [2011] S. Ghimire, A. D. DiChiara, E. Sistrunk, P. Agostini, L. F. DiMauro, and D. A. Reis, Observation of high-order harmonic generation in a bulk crystal, Nat. Phys. 7, 138 (2011).
- Schultze et al. [2013] M. Schultze, E. M. Bothschafter, A. Sommer, S. Holzner, W. Schweinberger, M. Fiess, M. Hofstetter, R. Kienberger, V. Apalkov, V. S. Yakovlev, et al., Controlling dielectrics with the electric field of light, Nature 493, 75 (2013).
- Schubert et al. [2014] O. Schubert, M. Hohenleutner, F. Langer, B. Urbanek, C. Lange, U. Huttner, D. Golde, T. Meier, M. Kira, S. W. Koch, et al., Sub-cycle control of terahertz high-harmonic generation by dynamical bloch oscillations, Nature photonics 8, 119 (2014).
- Durach et al. [2011] M. Durach, A. Rusina, M. F. Kling, and M. I. Stockman, Predicted ultrafast dynamic metallization of dielectric nanofilms by strong single-cycle optical fields, Physical Review Letters 107, 086602 (2011).
- Schiffrin et al. [2013] A. Schiffrin, T. Paasch-Colberg, N. Karpowicz, V. Apalkov, D. Gerster, S. Mühlbrandt, M. Korbman, J. Reichert, M. Schultze, S. Holzner, et al., Optical-field-induced current in dielectrics, Nature 493, 70 (2013).
- Lucchini et al. [2016] M. Lucchini, S. A. Sato, A. Ludwig, J. Herrmann, M. Volkov, L. Kasmi, Y. Shinohara, K. Yabana, L. Gallmann, and U. Keller, Attosecond dynamical franz-keldysh effect in polycrystalline diamond, Science 353, 916 (2016).
- Apalkov and Stockman [2013] V. Apalkov and M. I. Stockman, Metal nanofilm in strong ultrafast optical fields, Physical Review B 88, 245438 (2013).
- Schultze et al. [2014] M. Schultze, K. Ramasesha, C. Pemmaraju, S. Sato, D. Whitmore, A. Gandman, J. S. Prell, L. Borja, D. Prendergast, K. Yabana, et al., Attosecond band-gap dynamics in silicon, Science 346, 1348 (2014).
- Sommer et al. [2016] A. Sommer, E. Bothschafter, S. Sato, C. Jakubeit, T. Latka, O. Razskazovskaya, H. Fattahi, M. Jobst, W. Schweinberger, V. Shirvanyan, et al., Attosecond nonlinear polarization and light–matter energy transfer in solids, Nature 534, 86 (2016).
- Sederberg et al. [2020] S. Sederberg, D. Zimin, S. Keiber, F. Siegrist, M. S. Wismer, V. S. Yakovlev, I. Floss, C. Lemell, J. Burgdörfer, M. Schultze, et al., Attosecond optoelectronic field measurement in solids, Nature communications 11, 1 (2020).
- Durach et al. [2010] M. Durach, A. Rusina, M. F. Kling, and M. I. Stockman, Metallization of nanofilms in strong adiabatic electric fields, Physical review letters 105, 086803 (2010).
- Apalkov and Stockman [2012] V. Apalkov and M. I. Stockman, Theory of dielectric nanofilms in strong ultrafast optical fields, Physical Review B 86, 165118 (2012).
- Kwon et al. [2016] O. Kwon, T. Paasch-Colberg, V. Apalkov, B.-K. Kim, J.-J. Kim, M. I. Stockman, and D. Kim, Semimetallization of dielectrics in strong optical fields, Sci. Rep. 6, 1 (2016).
- Su et al. [2016] G. Su, L. Jiang, F. Wang, L. Qu, and Y. Lu, First-principles simulations for excitation of currents in linear carbon chains under femtosecond laser pulse irradiation, Phys. Lett. A 380, 2453 (2016).
- Zhang et al. [2017] X. Zhang, F. Wang, L. Jiang, and Y. Yao, Manipulation of the dielectric properties of diamond by an ultrashort laser pulse, Physical Review B 95, 184301 (2017).
- Kazempour et al. [2021] A. Kazempour, T. Morshedloo, and F. Wang, Transient non-linear optics of diamond under ultrashort excitation pulses, Appl. Phys. A 127, 44 (2021).
- Wang et al. [2013] C. Wang, L. Jiang, X. Li, F. Wang, Y. Yuan, L. Qu, and Y. Lu, Nonlinear ionization mechanism dependence of energy absorption in diamond under femtosecond laser irradiation, J. Appl. Phys. 113, 143106 (2013).
- Shinde and Singh [2018] R. Shinde and A. K. Singh, Nonlinear Polarization and Low-Dissipation Ultrafast Optical Switching in Phosphorene, J. Phys. Chem. C 122, 19146 (2018).
- Su et al. [2017] X. Su, L. Jiang, F. Wang, G. Su, L. Qu, and Y. Lu, Electron dynamics and optical properties modulation of monolayer MoS2 by femtosecond laser pulse: a simulation using time-dependent density functional theory, Appl. Phys. A 123, 476 (2017).
- Rusdi et al. [2017] M. F. M. Rusdi, A. A. Latiff, M. C. Paul, S. Das, A. Dhar, H. Ahmad, and S. W. Harun, Titanium dioxide (tio2) film as a new saturable absorber for generating mode-locked thulium-holmium doped all-fiber laser, Optics & laser technology 89, 16 (2017).
- Ahmad et al. [2015] H. Ahmad, S. A. Reduan, Z. A. Ali, M. A. Ismail, N. E. Ruslan, C. S. J. Lee, R. Puteh, and S. W. Harun, C-Band Q-Switched Fiber Laser Using Titanium Dioxide (TiO 2) As Saturable Absorber, IEEE Photonics J. 8, 1 (2015).
- Elim et al. [2003] H. Elim, W. Ji, A. H. Yuwono, J. Xue, and J. Wang, Ultrafast optical nonlinearity in poly (methylmethacrylate)-tio 2 nanocomposites, Applied physics letters 82, 2691 (2003).
- Evans et al. [2012] C. C. Evans, J. D. B. Bradley, E. A. Martí-Panameño, and E. Mazur, Mixed two- and three-photon absorption in bulk rutile (TiO2) around 800 nm, Opt. Express 20, 3118 (2012).
- Hashimoto et al. [1994] T. Hashimoto, T. Yoko, and S. Sakka, Sol–gel preparation and third-order nonlinear optical properties of tio2 thin films, Bulletin of the Chemical Society of Japan 67, 653 (1994).
- Castillo-Matadamas et al. [2010] H. A. Castillo-Matadamas, R. M. Lima-García, and R. Quintero-Torres, Ultrafast nonlinear optical properties of TiO2 nanoclusters at 850 nm, J. Mod. Opt. 57, 1100 (2010).
- Milam [1998] D. Milam, Review and assessment of measured values of the nonlinear refractive-index coefficient of fused silica, Appl. Opt. 37, 546 (1998).
- Reshef et al. [2015] O. Reshef, K. Shtyrkova, M. G. Moebius, S. Griesse-Nascimento, S. Spector, C. C. Evans, E. Ippen, and E. Mazur, Polycrystalline anatase titanium dioxide microring resonators with negative thermo-optic coefficient, J. Opt. Soc. Am. B, JOSAB 32, 2288 (2015).
- Bradley et al. [2012] J. D. B. Bradley, C. C. Evans, J. T. Choy, O. Reshef, P. B. Deotare, F. Parsy, K. C. Phillips, M. Lončar, and E. Mazur, Submicrometer-wide amorphous and polycrystalline anatase TiO2 waveguides for microphotonic devices, Opt. Express 20, 23821 (2012).
- Choy et al. [2012] J. T. Choy, J. D. B. Bradley, P. B. Deotare, I. B. Burgess, C. C. Evans, E. Mazur, and M. Lončar, Integrated TiO2 resonators for visible photonics, Opt. Lett. 37, 539 (2012).
- Evans et al. [2013] C. C. Evans, K. Shtyrkova, J. D. B. Bradley, O. Reshef, E. Ippen, and E. Mazur, Spectral broadening in anatase titanium dioxide waveguides at telecommunication and near-visible wavelengths, Opt. Express 21, 18582 (2013).
- Tancogne-Dejean et al. [2020] N. Tancogne-Dejean, M. J. Oliveira, X. Andrade, H. Appel, C. H. Borca, G. Le Breton, F. Buchholz, A. Castro, S. Corni, A. A. Correa, et al., Octopus, a computational framework for exploring light-driven phenomena and quantum dynamics in extended and finite systems, The Journal of chemical physics 152, 124119 (2020).
- Vignale and Kohn [1996] G. Vignale and W. Kohn, Current-dependent exchange-correlation potential for dynamical linear response theory, Physical review letters 77, 2037 (1996).
- Rappoport et al. [2005] D. Rappoport, N. R. M. Crawford, F. Furche, and K. Burke, Approximate Density Functionals: Which Should I Choose?, in Encyclopedia of Inorganic Chemistry (John Wiley & Sons, Ltd, Chichester, England, UK, 2005).
- Otobe et al. [2008] T. Otobe, M. Yamagiwa, J.-I. Iwata, K. Yabana, T. Nakatsukasa, and G. Bertsch, First-principles electron dynamics simulation for optical breakdown of dielectrics under an intense laser field, Physical Review B 77, 165104 (2008).
- Kleinman and Bylander [1982] L. Kleinman and D. Bylander, Efficacious form for model pseudopotentials, Physical Review Letters 48, 1425 (1982).
- Perdew et al. [1996] J. P. Perdew, K. Burke, and M. Ernzerhof, Generalized gradient approximation made simple, Physical review letters 77, 3865 (1996).
- Monkhorst and Pack [1976] H. J. Monkhorst and J. D. Pack, Special points for Brillouin-zone integrations, Phys. Rev. B 13, 5188 (1976).
- Castro et al. [2004] A. Castro, M. A. Marques, and A. Rubio, Propagators for the time-dependent kohn–sham equations, The Journal of chemical physics 121, 3425 (2004).
- Thiele et al. [2008] M. Thiele, E. K. U. Gross, and S. Kümmel, Adiabatic Approximation in Nonperturbative Time-Dependent Density-Functional Theory, Phys. Rev. Lett. 100, 153004 (2008).
- S_f [a] See supplemental material at (a), the GGA (PBE) electronic bandstructure of anatase TiO2.
- S_f [b] See supplemental material at (b), the number of excited electrons in TiO2 at their saturation values created when interacting with 800 nm and 400 nm laser pulses at different peak intensities.
- Keldysh et al. [1965] L. Keldysh et al., Ionization in the field of a strong electromagnetic wave, Sov. Phys. JETP 20, 1307 (1965).
- Reiss [1980] H. R. Reiss, Effect of an intense electromagnetic field on a weakly bound system, Physical Review A 22, 1786 (1980).
- S_f [c] See supplemental material at (c), the phase shift of photo-induced current accumulated during the interaction of TiO2 with 800 nm pulses of different peak intensities.
- Sommer [2016] A. M. Sommer, Ultrafast strong field dynamics in dielectrics (Springer, 2016).
- Gonzalez et al. [1997] R. Gonzalez, R. Zallen, and H. Berger, Infrared reflectivity and lattice fundamentals in anatase tio 2 s, Physical Review B 55, 7014 (1997).
- Zhang et al. [2020] X. Zhang, F. Wang, Z. Liu, X. Feng, and S. Pang, Controlling energy transfer from intense ultrashort light pulse to crystals: A comparison study in attosecond and femtosecond regimes, Physics Letters A 384, 126710 (2020).
- Stockman et al. [2002] M. I. Stockman, S. V. Faleev, and D. J. Bergman, Coherent control of femtosecond energy localization in nanosystems, Physical review letters 88, 067402 (2002).
- Stockman and Hewageegana [2007] M. Stockman and P. Hewageegana, Absolute phase effect in ultrafast optical responses of metal nanostructures, Applied Physics A 89, 247 (2007).
- Guo et al. [2017] L.-H. Guo, Y.-W. Wang, Y.-Q. Jiang, S. Xiao, and J. He, Dependence of Nonlinear Optical Response of Anatase TiO2 on Shape and Excitation Intensity, Chin. Phys. Lett. 34, 077803 (2017).
- Long et al. [2009] H. Long, A. Chen, G. Yang, Y. Li, and P. Lu, Third-order optical nonlinearities in anatase and rutile tio2 thin films, Thin Solid Films 517, 5601 (2009).
- Portuondo-Campa et al. [2008] E. Portuondo-Campa, A. Tortschanoff, F. van Mourik, and M. Chergui, Ultrafast nonresonant response of TiO2 nanostructured films, J. Chem. Phys. 128, 10.1063/1.2949517 (2008).
- Yuwono et al. [2004] A. H. Yuwono, B. Liu, J. Xue, J. Wang, H. I. Elim, W. Ji, Y. Li, and T. J. White, Controlling the crystallinity and nonlinear optical properties of transparent TiO2–PMMA nanohybrids, J. Mater. Chem. 14, 2978 (2004).
- Watanabe et al. [1995] Y. Watanabe, M. Ohnishi, and T. Tsuchiya, Measurement of nonlinear absorption and refraction in titanium dioxide single crystal by using a phase distortion method, Appl. Phys. Lett. 66, 3431 (1995).
- Irimpan et al. [2008] L. Irimpan, B. Krishnan, V. P. N. Nampoori, and P. Radhakrishnan, Luminescence tuning and enhanced nonlinear optical properties of nanocomposites of ZnO–TiO2, J. Colloid Interface Sci. 324, 99 (2008).
- Yao et al. [2008] J. Yao, Z. Fan, Y. Jin, Y. Zhao, H. He, and J. Shao, Investigation of damage threshold to TiO2 coatings at different laser wavelength and pulse duration, Thin Solid Films 516, 1237 (2008).
- Kumar et al. [2020] S. Kumar, A. Shankar, N. Kishore, C. Mukherjee, R. Kamparath, and S. Thakur, Laser-induced damage threshold study on TiO2/SiO2 multilayer reflective coatings, Indian J. Phys. 94, 105 (2020).
- Sruthil Lal S et al. [2022] B. Sruthil Lal S, D. Murali, M. Posselt, A. A. S. Devi, and A. Sharan, Modified HSE06 functional applied to anatase TiO2: influence of exchange fraction on the quasiparticle electronic structure and optical response, Electron. Struct. 4, 045001 (2022).
- Lee et al. [2014] K.-M. Lee, C. Min Kim, S. A. Sato, T. Otobe, Y. Shinohara, K. Yabana, and T. Moon Jeong, First-principles simulation of the optical response of bulk and thin-film -quartz irradiated with an ultrashort intense laser pulse, J. Appl. Phys. 115, 053519 (2014).
Supplemental Material