Residual Feature Pyramid Network for Enhancement of Vascular Patterns
Idiap Research Institute, Switzerland
ketan.kotwal@idiap.ch
&Sébastien Marcel
Idiap Research Institute, Switzerland
University of Lausanne, Switzerland
sebastien.marcel@idiap.ch
Abstract
The accuracy of finger vein recognition systems gets degraded due to low and uneven contrast between veins and surroundings, often resulting in poor detection of vein patterns. We propose a finger-vein enhancement technique, ResFPN (Residual Feature Pyramid Network), as a generic preprocessing method agnostic to the recognition pipeline. A bottom-up pyramidal architecture using the novel Structure Detection block (SDBlock) facilitates extraction of veins of varied widths. Using a feature aggregation module (FAM), we combine these vein-structures, and train the proposed ResFPN for detection of veins across scales. With enhanced presentations, our experiments indicate a reduction upto 5% in the average recognition errors for commonly used recognition pipeline over two publicly available datasets. These improvements are persistent even in cross-dataset scenario where the dataset used to train the ResFPN is different from the one used for recognition.
1 Introduction
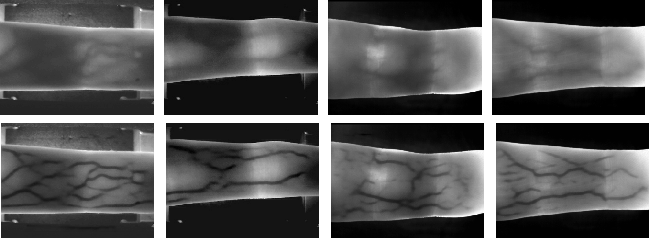
Use of vascular patterns as the biometric recognition trait is becoming more prevalent due to its distinctive advantages such as high recognition accuracy, difficulty in spoofing, and less interference of external factors. Typically, veins of finger(s), palm, and wrist are popular biometric modalities. In this work, we consider only finger vein (FV) as the biometric modality. The reflection-based FV scanners can be constructed in a contactless manner—which makes them an attractive biometric modality offering a better user experience and alleviating hygiene concerns (that may occur in enclosure or touch-based vein scanners). The performance of FV recognition pipeline is strongly correlated to the quality of the FV presentation acquired by the near-infrared (NIR) sensor (i.e. camera). These blood vessels lie beneath the skin of the subject and therefore do not always appear prominent in the acquired presentation. Figure 1 shows (see top row) some samples of FV presentations where the vein structures are not clearly visible across the region. Due to lack of contrast and uneven illumination, these presentations often suffer from poor feature extraction, and subsequently result in low and incorrect matching scores impeding the performance of the overall FV recognition system. In this work, we propose a deep learning (DL)-based technique for enhancement of vein structures in the presentations acquired in the NIR spectra. The proposed technique is independent module that can be plugged into an existing FV recognition pipeline at the preprocessing stage.
An overall FV recognition pipeline can be built from conventional image processing techniques or it can be based on a deep convolutional neural network (CNN). Typically, in both cases, the NIR presentation is first preprocessed for cropping, resizing, and orientation correction. The conventional processing pipeline employs feature extraction block to generate a feature descriptor (it acts as reference or template for enrolment data), followed by the matching block that computes similarity metric between feature descriptor of the test sample (also known as probe) and predefined templates. The DL-based FV recognition pipelines usually combine both blocks by modeling the recognition task as an -class classification problem. A cascade of convolutional and pooling layers learns vein-related features which are then transformed into class probabilities by one or more fully connected layers. For any pipeline, conventional or DL-based, efficient extraction or learning of relevant features from input presentations is the key to build a highly accurate recognition system. Popular feature extraction methods such as repeated line tracking [3], wide line detector [4], and maximum curvature (MC) [5] are based on computation of the local gradient or cross-sectional profile of pixels as the first step. The efficacy of these quantities (gradient or profile) is directly proportional to the contrast in the image. The deep CNNs, as well, are susceptible to distortion in the quality of input images such as noise, blur, and contrast [6, 7, 8]. This essentially reinforces the importance of good contrast (between vein structures and surroundings) in designing a highly accurate FV recognition pipeline. It may be noted that the publicly available FV datasets are relatively much smaller (in the range of 2000–3000 total presentations), furthermore, only a fraction of entire dataset is used for training purposes. Since training deep CNNs with small amount of data is challenging, improving the quality of the input presentations– by enhancing the vein structures– can be of significant assistance in training as well as inference. From the existing literature, it appears that the problem of enhancement of vein structures, particularly using learning-based methods, has not received much attention despite its apparent usefulness.
Using the presentations as captured by the NIR sensor without the aforementioned enhancement has two serious shortcomings: (1) Due to variable width of blood vessels and variable local contrast (because of presence of tissues around vessels), the feature extraction may detect fewer vein-structures from the presentation. The subtle vein structures– that may carry subject-specific discriminatory information– may remain undetected. Alternatively, one has to extensively experiment with parameters of feature extractor or CNN to obtain good recognition accuracy. (2) Since the parameters of pipeline are tuned for specific dataset or sensor, the FV recognition system can suffer from poor generalization across different datasets. In case of change of NIR sensor, which is a quite common real life use-case, one has to rely on expensive and time-consuming solution of capturing new dataset to tune the parameters or train the CNN.
To address these concerns, we propose a deep CNN-based method for enhancement of vein structures from the FV presentations acquired in NIR channel. Our network accepts an NIR presentation in the form of single channel image; and generates an image consisting of vein-like structures. This result is combined with the input to obtain the enhanced presentation which can then be processed by any FV recognition pipeline. Samples of enhanced images obtained from our work are shown in (the bottom row of) Figure 1 where the appearance of veins is much sharper, clearer, and visibly darker as compared to their unprocessed/ original versions. With good contrast around veins, these presentations are less sensitive to the parameters of feature extraction method or model. We train our model using the vein annotations (manually generated binary labels) as the target.
As vein structures exhibit variable width or thickness, the choice of spatial resolution (or scale) is crucial in designing the enhancement network. Our network consists of structure detection blocks at multiple resolutions akin to the feature pyramid networks (FPNs)[9]. The vein structures (or their parts) detected at each level are combined through a feature aggregation module (FAM) to get a fused output. We design a structure detection block (SDBlock) as the basic unit of our network—that detects vein structures and also generates a set of feature maps, at reduced resolution, for processing by subsequent blocks. Through residual architecture, our network is able to extract FV structures across scales and fuse those to obtain an enhanced FV presentation. The contributions of our work can be summarized as follows:
-
•
We have designed a fully convolutional Residual FPN (ResFPN) for enhancement of vein structures. This architecture, consisting of only 600 parameters, efficiently detects vein structures of varied thickness without need for any specific tuning.
-
•
We have introduced a novel unit for structure detection, SDBlock. Through the SDBlock, we are able to achieve two objectives simultaneously: extraction of vein structures and generation of input for next layers/blocks.
-
•
Through indirect assessment of work, we demonstrate the efficacy of the proposed enhancement technique: the average error rate of FV recognition performance on publicly available datasets reduced upto 5% after enhancing the presentations by ResFPN. This improvement has been validated in intra- and cross-dataset testing scenarios.
2 Related Work
Kumar and Zhou [10] generated an average background image for a sub-block of input FV presentation, followed by local histogram equalization. A combination of edge preserving filtering, elliptic highpass filtering and histogram equalization was proposed by Pi et al. [11]. The contrast limited adaptive histogram equalization (CLAHE) has been considered towards enhancement of vein region by several works [10, 12, 13]. The use of Gabor wavelets at various scales and orientations for enhancement of venous regions has been proposed by Yang and Shi [14]. They have also devised a scattering removal method for better visibility of the acquired presentation. Methods in [15, 16] also advocate the use of Gabor filters for enhancement of FV presentations.
Peng et al. proposed a non-local means (NLM)-based technique for enhancement of veins in the NIR presentation [17]. Their work is based on the availability of several local patches with similar vein structures. These multiple patches have been exploited to enhance the vein-structures. A recent work by Zhang et al. combines the guided filter and tri-Gaussian model for FV image enhancement [18].
All aforementioned approaches for enhancement of vein regions are based on conventional image processing techniques. Despite success of deep CNNs in enhancement or restoration of images, very few works have studied DL-based approaches for this task. In [19], a fully convolutional network (FCN) has been developed to enhance the vein patterns, more specifically to recover the missing segments within vein patterns. The training data were created by randomly cropping some pixels from the FV images, and the corresponding FCN was trained using MSE (mean square error) loss between the output of the FCN and original image. Recently, Bros et al. proposed a deep autoencoder-based method for enhancement of FV presentations [20]. They used presentations enhanced with vein-annotations to train their network by reducing the MSE loss.
3 ResFPN for Vein Enhancement
In this section, we first describe the architecture of the proposed ResFPN for FV enhancement along with our rationale in designing its building blocks. Subsequently we provide details of training procedure and formulation of loss function.
3.1 Network Architecture
Learning features at all scales from a combination of bottom-up pathway,
top-down pathway, and lateral connections– also known as feature pyramid
network (FPN)– has been shown to be efficient generic feature
extractor [9, 21]. When analyzed locally, vein pattern is a
structure of variable thickness; and extracting such a structure would require
learning a set of convolutional filters at different spatial resolutions or
scales. Based on the idea of FPN [9], we construct a multi-level
bottom-up pathway to extract vein features at different scales.
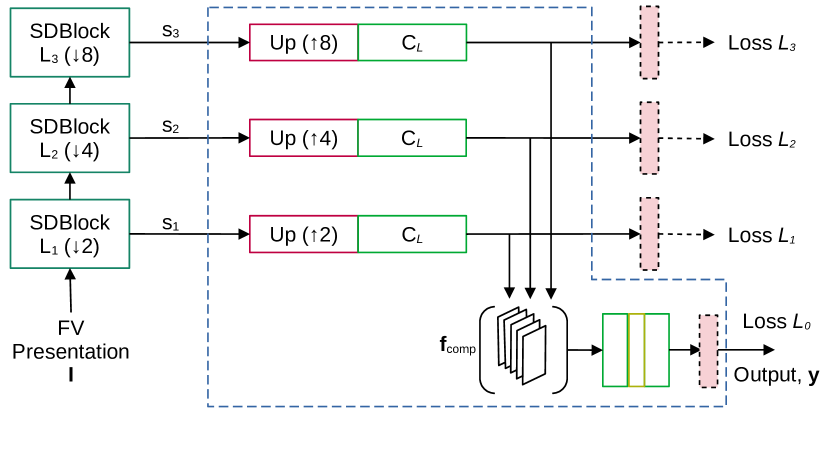
Figure 2(a) shows the overall architecture of the proposed ResFPN.
We call each unit of this pathway as the structure detection block
(SDBlock)—which will be described later in this section. At each
successive level, the SDBlock extracts vein-like structures from
larger receptive fields as the spatial dimensions (resolution) of the
corresponding feature maps gradually reduce. Vein structures so-obtained from
each SDBlock are then combined by a feature aggregation module (FAM)
which normalizes them in terms of resolution and number of feature maps. As
each SDBlock extracts only a part of overall vein pattern (depending on its
width or thickness), we combine the normalized outputs of FAM into a single
channel representation of the extracted structures. The vein-enhanced
presentation is obtained by a linear combination of the output of our network
and the original input presentation.
Structure Detection Block (SDBlock):
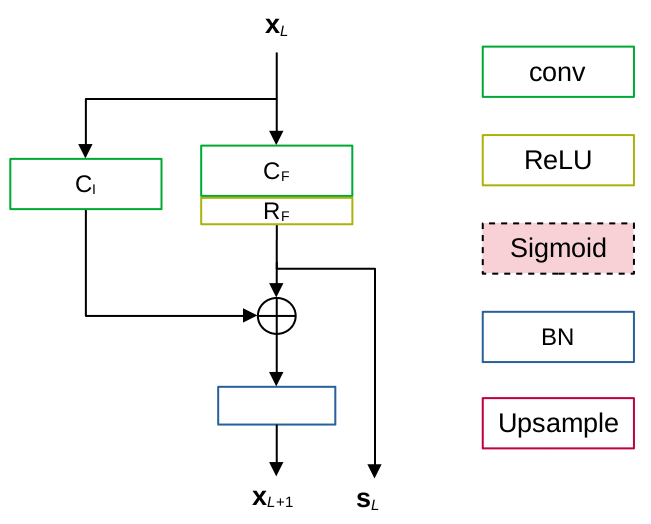
The architecture of SDBlock– the fundamental unit for extraction of vein-like structures– is shown in Figure 2(b). Detection of thin and subtle vein-structures is accomplished by learning a set of convolutional kernels, followed by a non-linear activation such as ReLU. (In Figure 2(b) corresponding convolutional and ReLU layers are represented as and , respectively.) The size of kernels can be calculated by analyzing the nominal width of vein structures at original resolution. We employ a stride of 2 across the layer which implicitly reduces the spatial dimensions, while no explicit spatial-level feature pooling is used. The outputs of are structure features () extracted by the -th SDBlock.
Given the nature of vein structures, the feature extraction process is akin to learning a set of bandpass filters. The output of such filters strongly suppresses or removes the information content beyond their effective bandwidth. Therefore, using these outputs () directly for detection of structures (that are predominantly present in the possibly suppressed frequency bands) is likely to render ineffective results. Therefore, we propose to implement the shortcut (using the ResNet terminology) by adding the input of the SDBlock to the output of . The input is passed through a convolutional layer to align its dimensions (spatial dimensions and number of feature maps) to those of structure features, . After the addition of shortcut, the corresponding output () is normalized at batch level () which may then be fed to the next SDBlock.
If is the input to the SDBlock, which could be the FV presentation () or feature maps generated by previous SDBlock, the functioning of the -th SDBlock is summarized below.
| (1) | ||||
| (2) |
The SDBlock, thus, accepts feature maps (or the input presentation), and
generates two outputs: (1) the residual structure features– to be processed by
the FAM for output, and (2) normalized feature maps– to be processed by the
SDBlock at next level. The process of detection of features
operates in different frequency bands for each SDBlock. The proposed
architecture simplifies these objectives using shortcut connections: the
residual component is trained to learn structures in the feature maps; while
the combined/ summed component, boosted with detected features, is suitable for
similar processing at the next scale.
Feature Aggregation Module (FAM):
The FAM receives structure features, , from each SDBlock; and as the first step normalizes them through upsampling and convolutions. For each SDBlock, the structure features are computed on successively reduced scale (spatial resolution) of feature maps. We use nearest neighbor-based interpolation to upsample the structure features to the scale of original input presentations. Thus, no learning parameters are involved at upsampling stage. Using convolutions, we convert the feature maps of each SDBlock into the same channel-dimension, say , and refer to them as .
As each is upsampled to the resolution of input presentation, the upsampling factor of is determined accordingly. If the network consists of SDBlocks, we obtain a composite feature map with channels whose spatial dimensions are same as that of the input presentation. This composite feature map, , represents the aggregation of vein features learnt across multiple scales. We fuse the individual feature maps of into a single channel output, , using two layers of convolutional layers with an intermittent ReLU activation. The final output, , is obtained through sigmoidal activation of .
The functions of the FAM are summarized below.
| (3) | |||
| (4) | |||
The enhanced presentation, , is obtained by linear combination of the output, , and the input presentation, using a predefined weight as .
3.2 Loss Function
We formulate the problem of detection of vein structures as a binary classification problem that assigns a probability of being a (part) of vein to each pixel. The loss function, therefore, is defined as the binary cross entropy (BCE) between the vein-annotations (a binary image with vein marking) and the output, , of the ResFPN. The outputs of each SDBlock post dimensional normalization, are expected to have extracted parts of vein pattern. Therefore, we also propose to calculate loss over each of normalized feature maps, . These feature maps are passed through a sigmoidal activation, the BCE loss is computed for each of feature maps, and then averaged to yield a scalar value. The overall loss function, , is defined as summation of losses computed over each of levels, and the loss computed on final output. If we denote the vein-annotations as , then the expression for overall loss function is provided by Equation 5.
| (5) |
3.3 Training Procedure
A small size of vein dataset and cumbersome task of manual annotation of vein structures drastically limit the scope of training large deep networks. In addition to designing a deep network with relatively fewer parameters, we have incorporated data augmentation by flipping it along horizontal and vertical axes. Each input presentation generates 4 samples (2 by horizontal flip and 2 by vertical flip) which are then shuffled during training. Note that each presentation is flipped to create data contrary to typical augmentation strategies where either original or flipped data are considered (flipping takes place randomly). The input presentations are rescaled to a fixed size ( in our case) to ensure consistency across different datasets. The vein-annotations, acting as targets, were also processed in the same manner. For training the ResFPN, we have chosen the Adam optimizer with a learning rate of 1.0e-4. To generate the enhanced presentation, we have used to combine the vein-structures with input.
4 Experiments and Results
We begin this section with details of the FV datasets and the protocols designed for our experiments. Since there are no direct methods to access the performance of enhancement, we have considered indirect assessment of our work by measuring the difference in the performance of overall FV recognition without and with application of our enhancement technique. We employ a conventional FV recognition pipeline that consists of preprocessing functions (cropping, orientation correction, resizing, etc.), followed feature extraction using Maximum Curvature (MC) technique [5]. The Miura Matching technique [3] is used to compute the similarity or matching score between the probe and model. We calculate the performance of FV recognition using the measures described in Section 4.2. Then we have provided results of our experiments on conventional FV recognition pipeline. The python code to reproduce the experimental results will be released publicly.111Repository of Python code for experiments described in this work: https://gitlab.idiap.ch/bob/bob.paper.resfpn_cvprw
4.1 Datasets and Protocols
For experiments, we have used two publicly available datasets: SDUMLA [1] and UTFVP [2]. The SDUMLA dataset consists of FV images of 6 fingers (3 finger of each hand) from 106 individuals. This collection has been repeated 6 times (called as sessions) to obtain a total of 3,816 FV presentations with pixels in size. As we consider each finger as a separate entity for our experiments, the SDUMLA dataset is considered to have clients. It should be also noted that vein annotations are available only for session-I. We require this dataset for two tasks: (1) to train and validate the ResFPN for enhancement; and (2) to validate the overall FV recognition pipeline. The first task requires a split of presentations to train the CNN, and to validate its performance over training epochs. The second task requires two disjoint sets of data: one to obtain score-related thresholds (dev), and another to evaluate the performance of FV recognition using these score thresholds (eval). In each subset, a further split of samples is required to enroll (i.e., to build models), and samples to probe. We have created a Nom (Normal Operative Mode) protocol where both tasks and their subtasks are allocated samples without any overlap of samples or clients. The data from session-I has been used for training and validating the ResFPN by splitting in the ratio of 0.8:0.2. Thus, 508 FV presentations from session-I of SDUMLA were used to train the ResFPN, while remaining 128 presentations were used to evaluate the performance of the ResFPN over each training epoch. Hereafter we do not use the presentations from first 80% clients as these have been seen by the network. The remaining 20% data is split into equal halves for dev (development set) and eval (evaluation or test set). In either case, the presentations from sessions II and III are used for enrollment and those from sessions IV, V and VI are used for probing. The protocol is summarized in Table 1.
| Identities | Sessions | ||
| I | II / III | IV / V / VI | |
| 1 | |||
| 508 (80%) | A training preprocessing | unused | |
|---|---|---|---|
| 572 (10%) | C development enrollment | D development probes | |
| 636 (10%) | B validation preprocessing | E evaluation enrollment | F evaluation probes |
The UTFVP dataset consists of 6 fingers (3 for each hand) from 60 individuals captured twice in 2 sessions. The dataset, thus, consists of 1,440 FV presentations with pixels. Considering each finger as a separate identity, we have a total of unique fingers in the UTFVP dataset. For experiments, we consider the Nom (Normal Operative Mode) protocol which is similar to the one implemented for the SDUMLA dataset.222The details of Nom protocol as devised by Idiap Research Institute: https://www.idiap.ch/software/bob/docs/bob/bob.db.utfvp/master Here, the unique fingers from first 10 clients are considered towards training the ResFPN. Due to small size of training set, we do not split it further for validation, and rather the performance of model is evaluated on the training data itself (no cross-validation for ResFPN). FV presentations from clients 11–28 constitute the dev set, and remaining presentations from clients 29–60 are included in the eval set. We omit further details of this protocol for the brevity of space.
| Measure | Baseline (No Enhancement) | Enhanced with ResFPN (SDUMLA) | Enhanced with ResFPN (UTFVP) | |||
| dev | eval | dev | eval | dev | eval | |
| Test dataset: SDUMLA | ||||||
| FMR | 12.1 (6856/56718) | 11.4 (5922/51876) | 7.2 (4110/56718) | 8.3 (4309/51876) | 9.2 (5206/56718) | 10.4 (5401/51876) |
| FNMR | 12.1 (50/414) | 15.4 (61/396) | 7.2 (30/414) | 8.6 (34/396) | 9.2 (38/414) | 8.6 (34/396) |
| HTER | 12.1 | 13.4 | 7.2 | 8.4 | 9.2 | 9.5 |
| Test dataset: UTFVP | ||||||
| FMR | 1.2 (274/23112) | 1.1 (807/73344) | 0.5 (107/23112) | 0.3 (209/73344) | 0.5 (107/23112) | 0.3 (218/73344) |
| FNMR | 1.4 (3/216) | 3.6 (14/384) | 0.5 (1/216) | 2.3 (9/384) | 0.5 (1/216) | 2.9 (11/384) |
| HTER | 1.3 | 2.4 | 0.5 | 1.3 | 0.5 | 1.6 |
4.2 Evaluation Measures
We have reported the performance of the overall FV recognition pipeline using False Match Rate (FMR) and False Non-Match Rate (FNMR). The FMR is the ratio of number of impostor attempts incorrectly classified as genuine matches to the total number of impostor attempts. The FNMR is defined as the percentage of genuine matches that are incorrectly rejected. We used the equal error rate (EER) on the dev set to compute the score threshold, where FMR FNMR. The Half-Total Error Rate (HTER)– average of FMR and FNMR on the eval set– is also reported.
4.3 Results
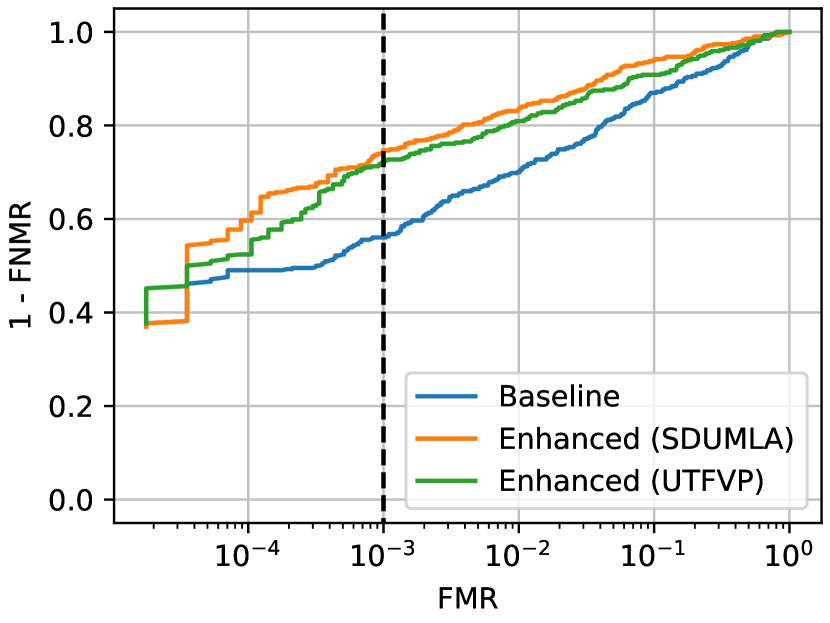
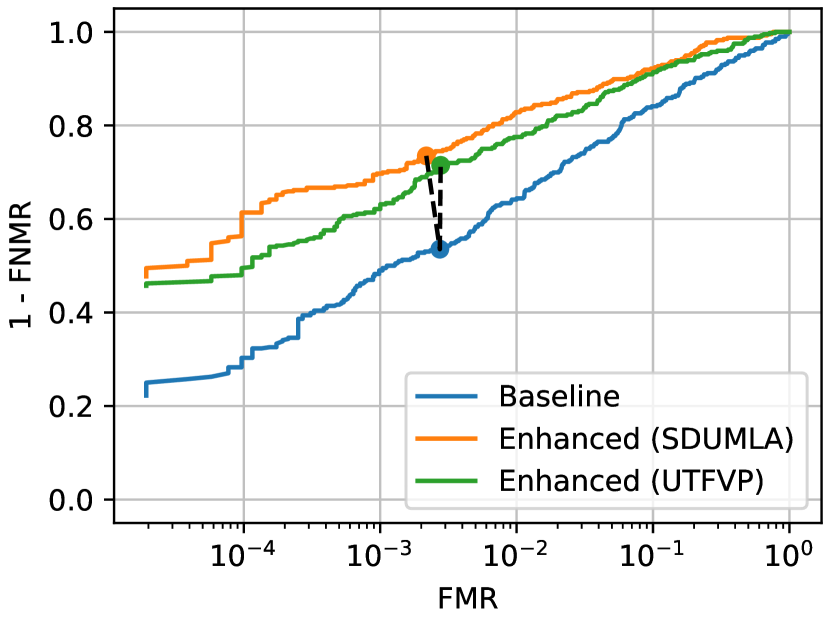
Baselines: The recognition performances of eval sets of SDUMLA as well as UTFVP datasets without applying the proposed enhancement technique are considered as the baselines for each dataset. For SDUMLA dataset, we obtained 12.1% EER on its dev set, and 13.4% HTER on the eval set. For the UTFVP dataset, these numbers were 1.3% and 2.4%, respectively. The results are summarized in Table 2. The Receiver Operating Characteristics (ROC) plots for SDUMLA and UTFVP baselines are shown in Figures 3 and 4, respectively (indicated by blue lines).
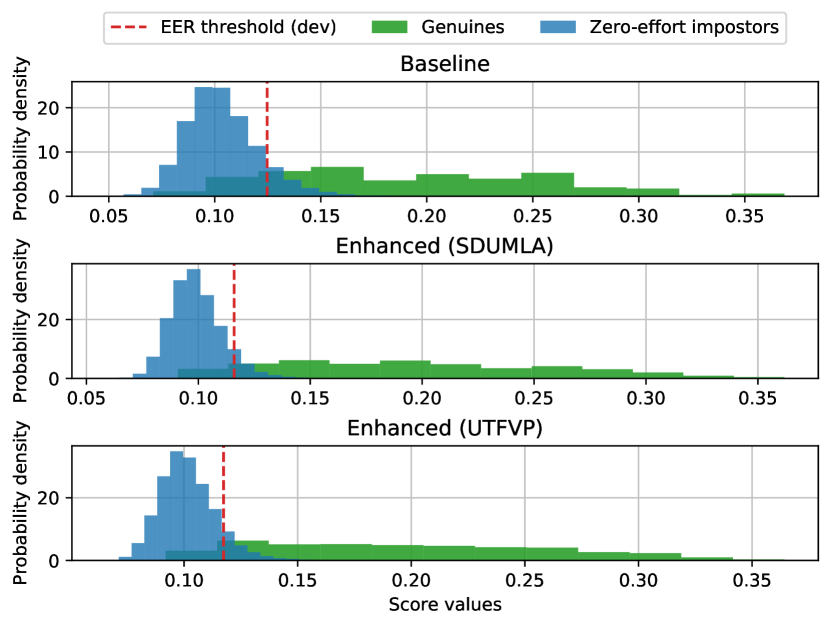
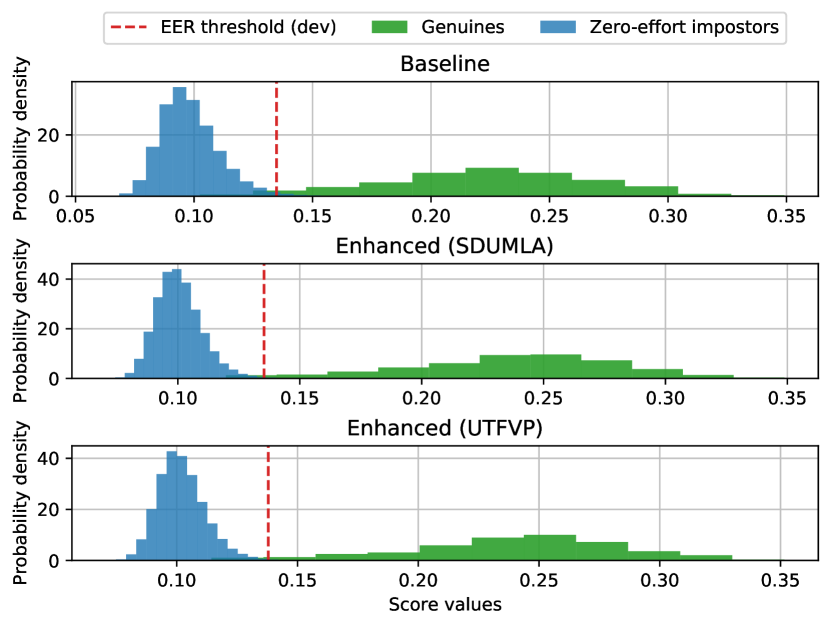
Experiments on SDUMLA dataset: The ResFPN trained on (the train set of) SDUMLA dataset was used to enhance the presentations of dev and eval sets of the SDUMLA dataset. This intra-dataset experiment, however, does not have any overlapped samples or clients across partitions. On enhanced FV presentations, we obtained the EER of 7.2% on the dev set where 4,140 matches out of 57,132 were incorrectly classified. For the eval set, the HTER was 8.4% with 4,343 incorrect results out of 52,272 matches. The reduction in the overall classification error on the dev as well as eval set is around 5% after applying the vein-enhancement at preprocessing stage. The number of falsely matched impostors reduced from 5,922 to 4,309 (i.e., nearly 27% less) on the eval set of the SDUMLA. This improvement is particularly important since it was observed on the subset of the data that was unseen by the ResFPN and FV recognition system. For the cross-dataset testing, we have enhanced the FV presentations from SDUMLA using the ResFPN trained on the UTFVP dataset. Compared to the baseline, we observed an average improvement of 3% on the dev set for this experiment. For the eval set, the number of falsely matched impostors reduced by nearly 500 samples, and the number of incorrectly rejected genuine matches reduced to 34 from 61. In terms of HTER, the use of vein-enhancement resulted in an improvement of 4.9% over the baseline. For both experiments, the performance measures are provided in Table 2 and ROC plots are shown in Figure 3. It may be observed from the ROCs that the performance of the FV recognition using enhanced presentations is consistently better than the baseline (without enhancement) over a complete range of FMR. This relative improvement is highlighted even more on the ROC of eval set at lower values of FMR. For enhanced presentations, the score histograms of the eval set (Figure 3(c)) indicate a better separation between scores of both classes, and also lowered mean and lesser variance of the scores of the impostor comparisons.
Experiments on UTFVP dataset: The Nom protocol of the UTFVP dataset comprises 73,344 impostor comparisons and 384 genuine comparisons on the eval set. When the presentations were enhanced using the proposed ResFPN (trained on the SDUMLA, i.e. cross-dataset), 209 impostor comparisons were incorrectly classified as genuine. This number is approximately 1/4-th of the same metric obtained for non-enhanced version of same presentations. On the dev set, we observed 40% reduction for this metric with respect to the baseline. The FNMR and, thus, HTER on both sets of the UTFVP dataset also improved by 0.8–1.3% when the performance of FV recognition was evaluated in the cross-dataset scenario as detailed in Table 2.
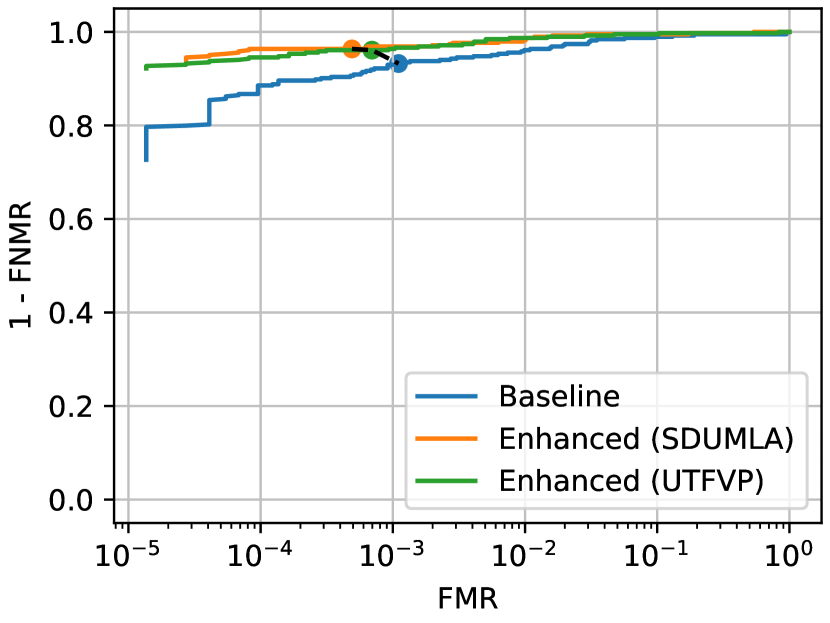
Interestingly, when the FV presentations were enhanced using ResFPN trained on the other (disjoint) partition of UTFVP, we observed the improvement, in terms of FMR/FNMR, to be similar to the aforementioned cross-dataset experiment. The total number of misclassifications on the dev set of the UTFVP reduced from 277 (in baseline) to 108 for both experiments of vein enhancement. This improvement was even better for the eval set where misclassifications reduced from 821 to 218–229 after enhancement of the input. While it may appear that the ResFPN trained on the subset of UTFVP has performed relatively poorer than the network trained on the SDUMLA dataset, it may be noted that the train set of UTFVP consists of only 388 presentations, which is much smaller than its SDUMLA counterpart.
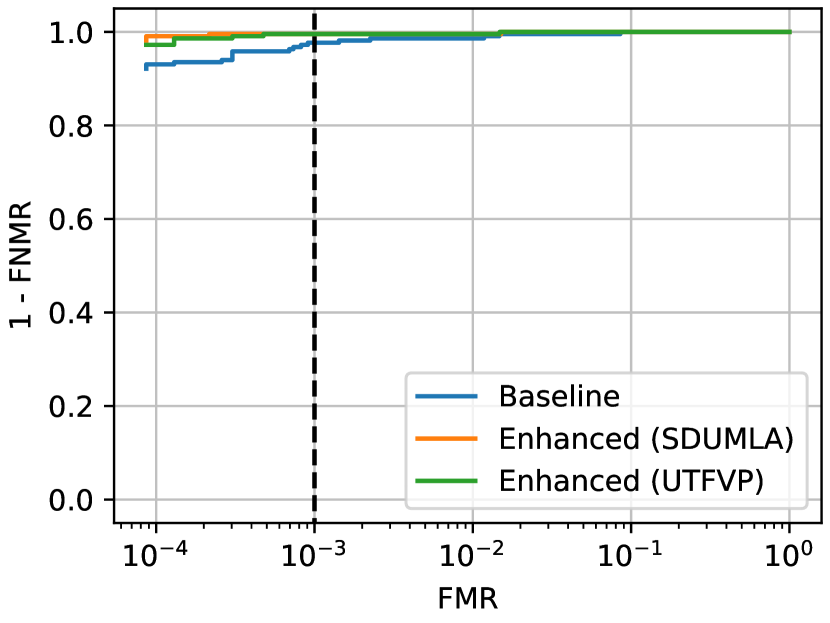
The ROC plots for the dev set are near-perfect for both enhancement experiments as indicated by almost horizontal curves in Figure 4(a). While the performance of baseline experiment slowly degrades for FMR , the recognition of the enhanced presentations remains consistently accurate. On the eval set, one can observe that the improvement in FV recognition, brought by the ResFPN, is similar for models trained on SDUMLA as well as UTFVP. Figure 4(c) shows the overall increase in the genuine scores of the enhanced presentations which improves separability of genuine comparisons from the impostor attempts.
5 Conclusions
In this work, we have proposed a ResFPN (Residual Feature Pyramid Network) for enhancement of vascular patterns in the FV presentations acquired in NIR. This network can be integrated into a standard recognition pipeline as a part of preprocessing module. With its peculiar SDBlock and FAM architectures, the proposed network is able to detect vein-structures at various scales and combine them efficiently to generate an enhanced presentation. With usage of enhanced data, the performance of recognition system has improved in terms of FMR, FNMR, and HTER– over different datasets as demonstrated by our results. Thus, the resultant recognition systems are more accurate and secure.
We have introduced a novel network architecture for detection of vein-structures. Further work in this direction mainly includes better generalization across variety of recognition methods, and efficiently processing size-independent presentations.
Acknowledgement
The authors would like to thank InnoSuisse for the project CANDY, and the Swiss Center for Biometrics Research and Testing for their support.
References
- [1] Y. Yin, L. Liu, and X. Sun, “Sdumla-hmt: a multimodal biometric database,” in Chinese Conference on Biometric Recognition, pp. 260–268, Springer, 2011.
- [2] B. T. Ton and R. N. J. Veldhuis, “A high quality finger vascular pattern dataset collected using a custom designed capturing device,” in International Conference on Biometrics (ICB), pp. 1–5, 2013.
- [3] N. Miura, A. Nagasaka, and T. Miyatake, “Feature extraction of finger-vein patterns based on repeated line tracking and its application to personal identification,” Machine Vision and Applications, vol. 15, pp. 194–203, 10 2004.
- [4] B. Huang, Y. Dai, R. Li, D. Tang, and W. Li, “Finger-vein authentication based on wide line detector and pattern normalization,” in International Conference on Pattern Recognition, pp. 1269–1272, 2010.
- [5] N. Miura, A. Nagasaka, and T. Miyatake, “Extraction of finger-vein patterns using maximum curvature points in image profiles,” IEICE TRANSACTIONS on Information and Systems, vol. 90, no. 8, pp. 1185–1194, 2007.
- [6] S. Dodge and L. Karam, “Understanding how image quality affects deep neural networks,” in International Conference on Quality of Multimedia Experience (QoMEX), pp. 1–6, 2016.
- [7] H. Hosseini, B. Xiao, and R. Poovendran, “Google’s cloud vision api is not robust to noise,” in IEEE International Conference on Machine Learning and Applications (ICMLA), pp. 101–105, 2017.
- [8] S. Dodge and L. Karam, “A study and comparison of human and deep learning recognition performance under visual distortions,” in International Conference on Computer Communication and Networks (ICCCN), pp. 1–7, 2017.
- [9] T.-Y. Lin, P. Dollár, R. Girshick, K. He, B. Hariharan, and S. Belongie, “Feature pyramid networks for object detection,” in Proceedings of the IEEE conference on computer vision and pattern recognition, pp. 2117–2125, 2017.
- [10] A. Kumar and Y. Zhou, “Human identification using finger images,” IEEE Transactions on image processing, vol. 21, no. 4, pp. 2228–2244, 2011.
- [11] W. Pi, J. Shin, and D. Park, “An effective quality improvement approach for low quality finger vein image,” in International Conference on Electronics and Information Engineering, vol. 1, pp. V1–424–V1–427, 2010.
- [12] A. Banerjee, S. Basu, S. Basu, and M. Nasipuri, “Artem: a new system for human authentication using finger vein images,” Multimedia Tools and Applications, vol. 77, 03 2018.
- [13] C. Kauba, J. Reissig, and A. Uhl, “Pre-processing cascades and fusion in finger vein recognition,” in International Conference of the Biometrics Special Interest Group (BIOSIG), pp. 1–6, 2014.
- [14] J. Yang and Y. Shi, “Towards finger-vein image restoration and enhancement for finger-vein recognition,” Information Sciences, vol. 268, pp. 33–52, 2014. New Sensing and Processing Technologies for Hand-based Biometrics Authentication.
- [15] K. Y. Shin, Y. H. Park, D. T. Nguyen, and K. R. Park, “Finger-vein image enhancement using a fuzzy-based fusion method with gabor and retinex filtering,” Sensors, vol. 14, no. 2, pp. 3095–3129, 2014.
- [16] T. D. Pham, Y. H. Park, D. T. Nguyen, S. Y. Kwon, and K. R. Park, “Nonintrusive finger-vein recognition system using nir image sensor and accuracy analyses according to various factors,” Sensors, vol. 15, no. 7, pp. 16866–16894, 2015.
- [17] J. Peng, Q. Li, N. Wang, A. A. Abd El-Latif, and X. Niu, “An effective preprocessing method for finger vein recognition,” in Fifth International Conference on Digital Image Processing (ICDIP 2013), vol. 8878, pp. 32–36, SPIE, 2013.
- [18] L. Zhang, X. Wang, X. Dong, L. Sun, W. Cai, and X. Ning, “Finger vein image enhancement based on guided tri-gaussian filters,” ASP Transactions on Pattern Recognition and Intelligent Systems, vol. 1, no. 1, pp. 17–23, 2021.
- [19] H. Qin and M. A. El-Yacoubi, “Deep representation-based feature extraction and recovering for finger-vein verification,” IEEE Transactions on Information Forensics and Security, vol. 12, no. 8, pp. 1816–1829, 2017.
- [20] V. Bros, K. Kotwal, and S. Marcel, “Vein enhancement with deep auto-encoders to improve finger vein recognition,” in 2021 International Conference of the Biometrics Special Interest Group (BIOSIG), pp. 1–5, 2021.
- [21] B. Wang, S. Chen, J. Wang, and X. Hu, “Residual feature pyramid networks for salient object detection,” The Visual Computer, vol. 36, no. 9, pp. 1897–1908, 2020.