A multiphase-field model for simulating the hydrogen-induced multi-spot corrosion on the surface of polycrystalline metals: Application to uranium metal
Abstract
Hydrogen-induced multi-spot corrosion on the surface of polycrystalline rare metals is a complex process, which involves the interactions between phases (metal, hydride and oxide), grain orientations, grain boundaries and corrosion spots. To accurately simulate this process and comprehend the underlying physics, a theoretical method is required that includes the following mechanisms: i) hydrogen diffusion, ii) phase transformation, iii) elastic interactions between phases, especially, the interactions between the oxide film and the hydride, iv) elastic interactions between grains, and v) interactions between hydrogen solutes and grain boundaries. In this study, we report a multiphase-field model that incorporates all these requirements, and conduct a comprehensive study of hydrogen-induced spot corrosion on the uranium metal surface, including the investigation of the oxide film, multi-spot corrosion, grain orientation, and grain boundary in the monocrystal, bicrystal, and polycrystal systems. The results indicate that the oxide film can inhibit the growth of hydrides and plays a crucial role in determining the correct morphology of the hydride at the triple junction of phases. The elastic interaction between multiple corrosion spots causes the merging of corrosion spots, and promotes the growth of hydrides. The introduction of grain orientations and grain boundaries results in a variety of intriguing intracrystalline and intergranular hydride morphologies. The model presented here is generally applicable to the hydrogen-induced multi-spot corrosion on the any rare metal surface.
pacs:
81.65.Kn, 05.70.Np, 81.40.NpI Introduction
Corrosion refers to the process of loss and destruction of materials through chemical and/or electrochemical reactions with their surrounding mediamccafferty2010introduction . Most metals resist general corrosion by forming an oxide film (also called a passive film). However, there are some environments where oxide films are not effective in protecting metals, such as pitting corrosion of stainless steel in an electrolyteszklarska1971review ; frankel1998pitting , or hydrogen corrosion of rare metals, such as ceriumknowles2013morphology ; brierley2014microstructure ; brierley2015probing , gadoliniumbrill2002effects ; benamar2009very ; benamar2010heat , holmiumbloch1982types ; bloch2008hydriding , plutonium haschke2000surface ; brierley2016anisotropic ; mcgillivray2011plutonium , and uraniumowen1966microscope ; bingert2004microtextural ; hill2013filiform ; jones2013surface ; stitt2015effects ; banos2016effect ; appel2018influence ; banos2018review ; banos2019corrosion1 ; banos2019corrosion2 ; ji2019mechanism ; banos2020kinetics . These rare metals are vulnerable to hydrogen attack when exposed to the low levels hydrogen over extended periods. Hydrogen penetrates cracks and voids within the oxide film and react with the internal metal to form the stable metal hydride phasekorst1966rare ; mintz1974phase . Hydrogen corrosion significantly accelerates the degradation of rare metal integrity and durability, ultimately resulting in mechanical failure. Consequently, the investigation of the hydride growth mechanism is particularly important to support the reliable design and accurate assessment of the service life of such metals in hydrogen atmospheres.
Hydrogen corrosion on the surfaces of rare metals often manifests as localized attacks resembling “spots”, known as hydrogen-induced spot corrosionsheng2022phase , characterized by four distinct stages: the incubation period, early growth, oxide cracking, oxide spalling, and continued growth. The early growth stage is particularly significant for studying the morphology and kinetics of hydride precipitation, as well as the mechanism behind oxide film deformation and even rupture. Morphological anisotropybingert2004microtextural ; jones2013surface and surface bulgesbingert2004microtextural ; jones2013surface are two critical features observed during this stage. These features have garnered significant attention from researchersbingert2004microtextural ; banos2018review ; ji2019mechanism . Previous experimental observationsowen1966microscope ; bingert2004microtextural ; hill2013filiform ; jones2013surface ; stitt2015effects ; banos2016effect ; appel2018influence ; banos2018review ; banos2019corrosion1 ; banos2019corrosion2 ; ji2019mechanism ; banos2020kinetics have indicated that the formation of these features involves hydrogen diffusion, phase transformation, as well as elastic interactions among the oxide film, metal matrix, and hydride precipitate, internal stresses in the material, and interactions between hydrogen solutes and grain boundaries. However, solely relying on experiments presents challenging in revealing the dynamic effects of these diverse factors and capturing the mesoscopic evolution of hydrogen-induced spot corrosion on metal surfaces. Therefore, to advance the research on hydrogen-induced spot corrosion morphology and kinetics, an indispensable tool is a mesoscopic numerical model that effectively couples these factors and accurately predicts the evolution of hydrogen-induced spot corrosion.
Considerable efforts have been made in the development of numerical methods for surface localized corrosion. According to the characterization of the corrosion interface, these techniques can be categorized into two different groups of methods: the sharp interface methods, including the finite volume methodsscheiner2007stable ; scheiner2009finite , the arbitrary Lagrangian-Eulerian methodssun2014arbitrary , the level set methodssethian1996fast and the diffuse interface method, represented by the phase-field (PF) methodsteinbach2009phase ; ansari2021phase ; yang2021explicit . The PF method could avoid tracking the moving interface by constructing the diffuse interfaceyang2021explicit , and has been actively used because of its thermodynamic consistency and convenient coupling of many different physical effectschen2002phase ; li2017review . Recently, Mai et al.mai2016phase proposed a simplified PF model for pitting corrosion in steel, capable of reproducing various corrosion kinetics associated with activation-controlled, diffusion-controlled, and mixed-controlled corrosion kinetics. Building upon this work, Ansari et al.ansari2018phase ; ansari2019modeling further extended the PF model by considering electrode reactions to pitting corrosion in steel. Mai and Soghratimai2018new , Chadwick et al.chadwick2018numerical , and Tsuyuki et al.tsuyuki2018phase developed the PF model incorporating the effects of ionic species concentration in the electrolyte and electric field strength. These models show promise in simulating mass transport in hydrogen-induced spot corrosion. However, in the hydrogen-induced spot corrosion of rare metals, the elastic interactions between phases need to be further considered in order to adequately apply these models. To address this objective, our previous worksheng2022phase introduced a simplified PF model coupled with elastic strain free energy and hydrogen diffusion to investigate hydrogen-induced spot corrosion on uranium surfaces, successfully capturing anisotropic morphologies and surface bulges. Regrettably, for the sake of simplicity, our previous model did not consider the role of the oxide film as a mechanical barrier between the hydride and the environment. In this regard, one idea given by Yang et al. yang2021hydride was to introduce the oxide film through the multiphase-field (MPF) model. Although this model successfully replicated the corrosion morphology in the metal cerium, it failed to capture surface bulges due to fixed boundary conditions. Furthermore, most of the reported PF models do not take into account real polycrystalline materials with multiple grain boundaries and multiple orientations. Therefore, there is an urgent need to develop a suitable, effective, and accurate polycrystalline MPF model to simulate hydrogen-induced spot corrosion on the surfaces of polycrystalline metals coated with oxide films.
The present work aims to develop and implement a polycrystalline MPF model for approximating the morphology evolution during the hydrogen-induced spot corrosion. Based on the (KKS) assumptionkim1999phase ; kim2004phase , we propose a polycrystalline MPF model coupling with oxide film, metal, hydride phases, hydrogen concentration, grain boundaries and grain orientation. To verify the validity of the model, the hydride growth on the surface of monocrystal, bicrystal and polycrystal uranium with an exisiting oxide film is simulated. In the monocrystal case, important factors such as oxide film thickness, multi-spot corrosion, and grain orientation are considered to be the key factors to reconstruct spot corrosion morphologies. In addition, we introduce a grain boundary (GB) into monocrystal to form bicrystal structure, allowing us to investigate the influence of GB and multiple grain orientations on the corrosion morphology and internal stress of the material. Finally, we conduct simulations of complex corrosion morphologies in real polycrystalline materials, considering multiple grain boundaries, various grain orientations, and the occurrence of multi-spot corrosion.
The remainder of this work is organized as follows. Section II presents a comprehensive description of the MPF model utilized in the simulations, including the governing equations of the model and the total free energy of the system. Section III provides a variety of numerical simulation results to validate the accuracy and demonstrate the applicability of the proposed model. Finally, section IV concludes the paper by summarizing the key findings and contributions of this study.
II The PF model of the hydrogen-induced spot corrosion
II.1 Problem description
Consider a corrosion systemsheng2022phase consisting of a polycrystalline uranium (U) solid phase coated with an oxide film (mainly UO2)allen1973surface ; harker2013altering ; banos2018review in the hydrogen atmosphere, and the resulting corrosion product is -UH3 at the temperature (513 K) in this work. Fig. 1 illustrates the schematic diagram depicting the process of hydrogen-induced spot corrosion on the surface of U metal in the hydrogen atmospherebrierley2016anisotropic ; banos2018review . The hydrogen-induced spot corrosion on the metal surface undergoes the following four distinct stagesbrierley2016anisotropic ; sheng2022phase :
(I). Incubation period: Under normal conditions, the metal surface is covered with an oxide film. Hydrogen molecules undergo physical adsorption on the surface of the oxide film, followed by either diffusion or dissociation chemisorption of two H atoms and/or ionsbanos2018review . Subsequently, hydrogen permeates the oxide film in the form of molecules, atoms, or ions, reaching the oxide-metal interface. At the interface, hydrogen accumulates and approaches the hydride solubility limit, leading to the formation of initial hydride nucleationowen1966microscope ; bloch1997kinetics ; glascott2003hydrogen .
(II). Early growth: The initial precipitate gradually grows in size as a result of the reaction between the metal and hydrogen at the metal-hydride interface. This growth process is accompanied by an outward expansion strain caused by the lattice mismatch between the hydride and the metal, resulting in the formation of a bulge on the metal surfacejones2013surface ; brierley2016anisotropic . Additionally, it has been observed that the hydride tends to nucleate and grow at the grain boundaries (GBs)banos2016effect ; brierley2016anisotropic .
(III). Oxide cracking: The outward expansion strain caused by the growing hydride precipitate exceeds the tensile strength of the oxide film, resulting in its deformation and subsequent cracking.
(IV). Oxide spalling and continued growth: The oxide film on the metal surface undergoes flaking or delaminationjones2013surface , resulting in direct exposure of the hydride precipitates to the corrosive environment. This direct contact accelerates the growth of existing hydride precipitates and promotes the formation of new hydride precipitatesbrierley2016anisotropic .
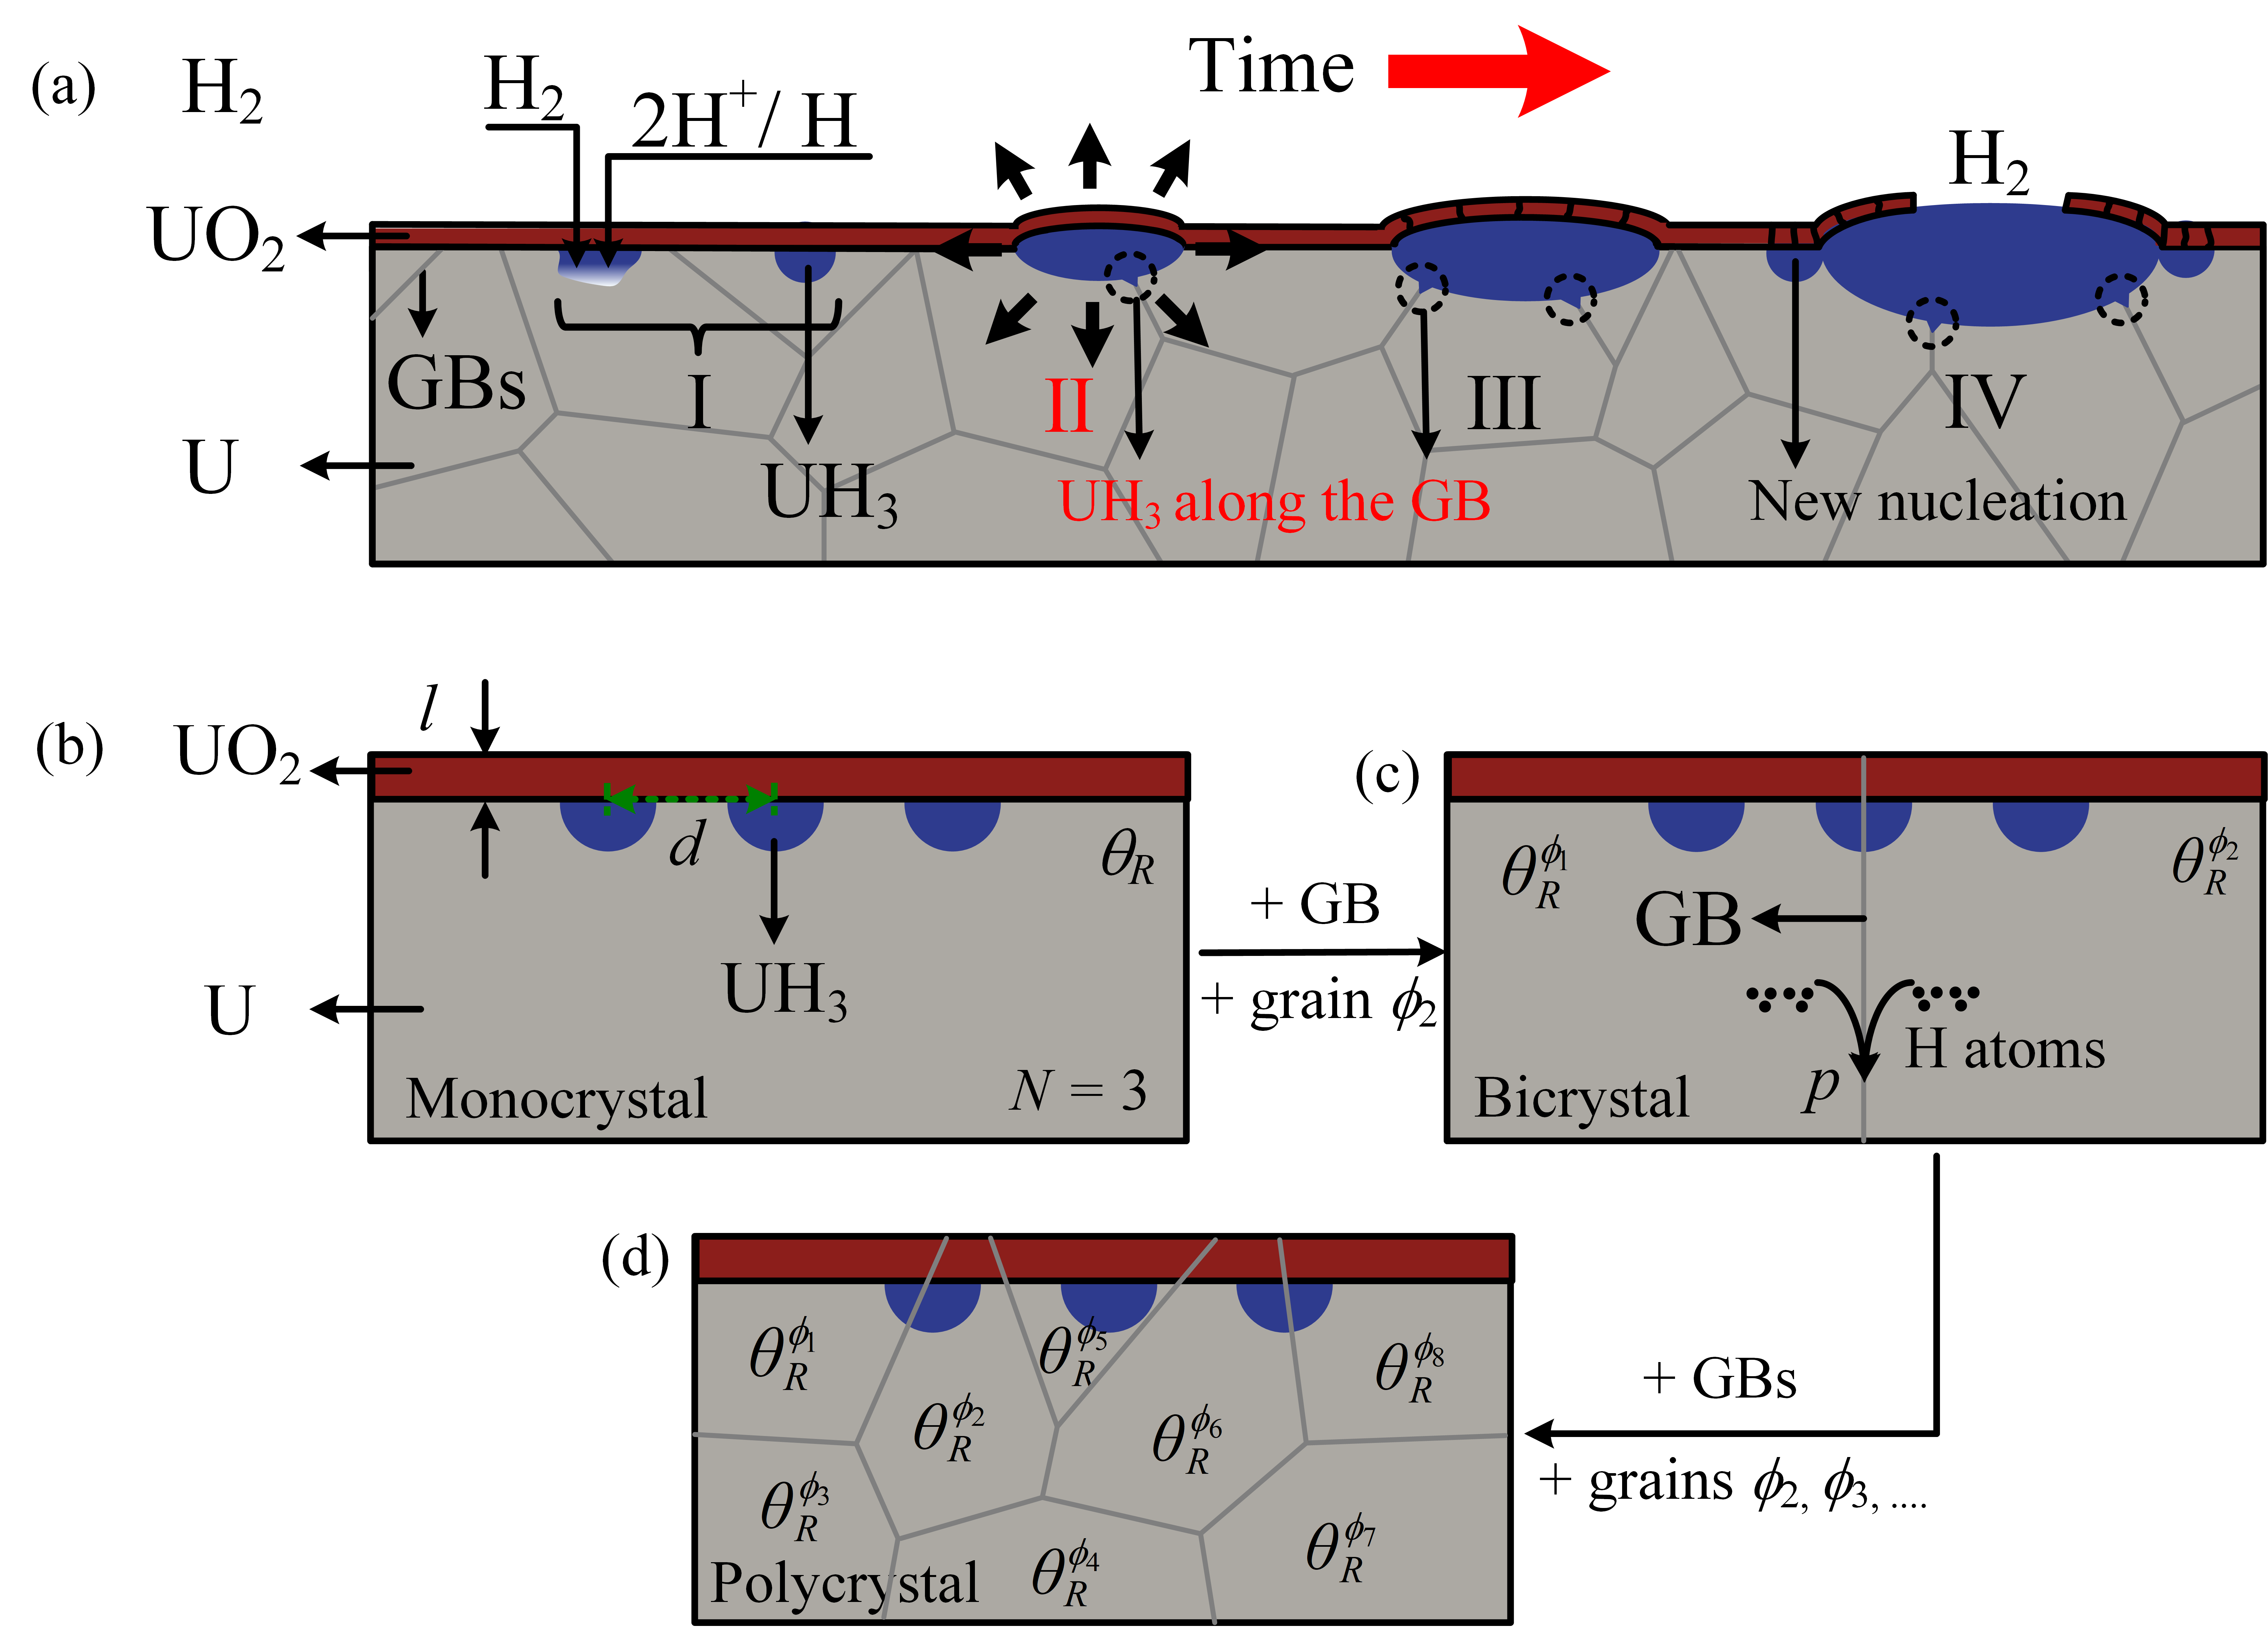
In the present work, our main focus is to investigate the growth of existing hydride precipitates during the early growth stage. Figs. 1(b)-(c) show some key factors to consider during this stage of the hydrogen-induced spot corrosion in the monocrystal, bicrystal and polycrystal U metals. In the case of the simple monocrystal, our study focuses on examining the morphology and stress of spot corrosion while considering the influence of several key factors. These factors include the thickness of the oxide film (), the number of corrosion spots (), the distance between corrosion spots (), and the effect of grain orientation (represented by the grain rotation angle with respect to the global coordinate system). Subsequently, we introduce a GB and a grain to form a bicrystal configuration. For the bicrystal, two additional factors come into play: the hydrogen-GB interaction strength () and the interaction between the grain orientation and the GB. Finally, we extend our analysis to polycrystalline U metal by introducing multiple grains and GBs. By considering all of the above factors, we demonstrate the ability of the MPF model to handle complex grain structures in realistic polycrystalline U metal.
II.2 MPF governing equation
II.2.1 General governing equation
Hydrogen-induced spot corrosionsheng2022phase on polycrystalline U with a pre-existing oxide film is a complex process involving five major coupled processes: i) hydrogen diffusion, ii) phase transformation, iii) elastic interactions between phases, iv) elastic interactions between grains, and v) interactions between hydrogen solutes and grain boundaries. To account for and simulate these processes, three types of field variables are required: hydrogen concentration (), phase order parameter (), and grain order parameter (). The hydrogen concentration is quantified using the atom fraction for mathematical convenience in describing the hydrogen concentration variation of the system. The phase order parameters require three structural order parameters to characterize the different phases present in the system: the U metal matrix (), UH3 hydride precipitate (), and UO2 oxide film () phases. In order to simplify the modeling approach, static grain order parameters are employed. These parameters are necessary for describing the elastic interactions between grains as well as the interactions of concentration with grain boundaries. Note that we use the different indices (and ) and for the structural order parameters to identify the phase and grain order parameters in the system, respectively.
In this MPF model, the total free energy functional of this hydrogen-induced spot corrosion system consists of the interface gradient energy , the bulk free energy , the solute-GB interaction energy and the elastic energy , which is given by:
| (1) |
where and being the number of phases and grains in the considered system. is the gradient energy density due to the diffuse interface and is the bulk free energy density depending on the specific materials, is the solute-GB interaction energy density, and the elastic energy density is a function of displacement and phase order parameters .
The gradient energy density could be formulated as a function of the gradient of the field variables , as followsvillanueva2008multicomponent :
| (2) |
where are the gradient energy coefficients for the phase .
The solute-GB interaction energy density denotes the thermodynamically-consistent solute-GB interactionchen1994computer ; heo2011phase ; heo2019phase , which can be written as:
| (3) |
where is the interaction parameter that controls the interaction strength between solute atoms and grain boundaries, and is the phenomenological Landau polynomial function of grain order parameters that determines the topology of the solute-GB interaction potential, which is non-zero only at the grain boundaries.
Within the general MPF frameworknestler2005multicomponent ; wang2015phase ; wang2018phase , the evolution of the phase order parameter is to minimize the free energy functional of the system and can be derived from the functional via variational derivatives as followsfolch2005quantitative ; bollada2012new :
| (4) |
where is a Lagrange multiplier ensuring the constraint , and . Here, is the kinetic coefficient diagonal matrix and in this paper.
II.2.2 Simplified case ()
The primary focus of this work is to investigate the hydrogenation of U metals coated with a pre-existing oxide film in a hydrogen atmosphere. Due to the absence of oxygen in the environment, metals and hydrides do not transform into new oxides. Therefore, the oxide film phase does not undergo chemical evolution to increase its thickness in the environment. Consequently, the oxide film phase order parameter is also a static phase order parameter similar to the grain order parameter. In the future, we will incorporate the effect of oxidation to develop a more comprehensive MPF model that accounts for the oxidation of metal and hydride.
For this static phase order parameter , its governing equation corresponds to a steady state condition, i.e. . Substituting the Eq.(II.2.1) into the steady state condition, a equation can be derived as follows:
| (5) |
where is used in the last step.
Applying the above equation helps to simplify the MPF model, the governing equations of the phase order parameters and can be rewritten as:
| (6) | ||||
| (7) |
where is used in the derivation. In fact, the governing equation of the phase parameters and is are equivalent to the conventional PF equationbollada2012new ; sheng2022phase , but they are expressed in the MPF framework because of the presence of the third phase in the system.
According to the variational principle wang2015phase , we can derive the variational derivatives of the total free energy over and , as follows:
| (8) | |||
| (9) |
For the governing equation of hydrogen concentration, it could also be derived by minimizing the total free energy via variational derivatives as the following:
| (10) |
where is the mobility. is the interpolated diffusion coefficient, and is the interpolated polynomial function. Here, we employed , where are all differentfolch2005quantitative ; choudhury2013quantitative . These polynomial functions are chosen to satisfy the constraint , ensuring that the total diffusion coefficient accurately represents the contribution from each phase. For the more specific properties of the interpolated polynomial function, the reader is referred to Plapp et al.’s workfolch2005quantitative .
II.3 Bulk free energy density
For the bulk free energy density, we employ the thermodynamic description of the KKS modelkim1999phase ; kim2004phase . In the KKS model, each material point is regarded as a mixture of all different phases, and a local equilibrium of chemical potential between all different phases is always satisfied. In this MPF model, these assumptions could be expressed as follows:
| (11) | |||
| (12) |
where represent the atom fraction of hydrogen in the -phase, and , and in Eq. (12) are the free energy density curves of U metal matrix, UH3 hydride precipitate and UO2 oxide film phase, respectively. The bulk free energy density could be expressed by a method similar to the concentration assumption in Eq. (11) as follows:
| (13) |
where is the energy barrier parameter for the phase and is the potential barrier function folch2005quantitative for the phase , which can be formulated as .
Following the work of Bair et al.bair2017formation , the free energy density curves , and are constructed based on the parabolic approximation. It is assumed that the free energy density curves , and could be written assheng2022phase ; wu2022phase :
| (14) | |||
| (15) | |||
| (16) | |||
| (17) | |||
| (18) |
Where and are the concentrations of maximum hydrogen solubility in the U metal matrix and UO2 oxide film phases respectively; is the decreasing free energy caused by hydrogen dissolution in the UO2 oxide film phase. is the concentration of hydrogen in the UH3 hydride precipitate; is the free energy of formation per unit volume of the UH3 hydride precipitate; is the molar volume of the systembanos2018review and is the molar Gibbs free energy of formation of the UH3 hydride precipitatechiotti1980hu . The is a small parameter that regulates the magnitude of the thermodynamic driving forcebair2017formation ; sheng2022phase . The constants , and in Eqs. (14), (15) and (16) control the bulk contribution to the interface energy and the tangents between different phasesbair2017formation . These constants could be determined by constructing the common tangent between the free energy density curves of the UH3 hydride precipitate, the UO2 oxide film and the U metal matrix (see Sec. I of the Supplementary Materials). A total of two common tangent lines are required: , common tangent lines. The parameter can also be determined by the common tangent line.
The maximum hydrogen solubility in the U metal matrix phase is usually less than 5 at.%hansen1958constitution ; massalski1986binary . For UO2 oxide film, its monocrystal has a smaller maximum hydrogen solubility (about -g H2/g UO2)wheeler1971diffusion than the U metal matrix, but its internal defects may trap the hydrogen atoms to locally exceed the maximum hydrogen solubility. We assume that the maximum hydrogen solubility of U metal matrix and oxide film are about at.%morrell2013uranium and at.% in this work.
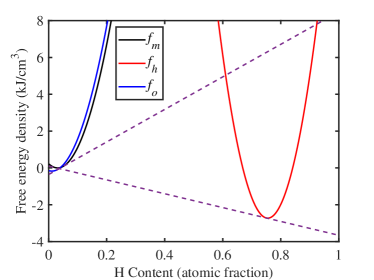
Fig. 2 shows the free energy density curves , and constructed in this work, where the black solid line corresponds to , the red solid line corresponds to , the blue solid line corresponds to . The dotted line represents the common tangent line. The detailed parameters of the free energy density curves can be found in the Table 1.
| Symbol | Value | Symbol | Value |
|---|---|---|---|
| 513 K | 207.6 GPafisher1966temperature | ||
| J/m | 50.6 GPafisher1966temperature | ||
| J/m | 24.5 GPafisher1966temperature | ||
| J/m | 185.9 GPafisher1966temperature | ||
| J/m3 | 102.7 GPafisher1966temperature | ||
| J/m3 | 242.7 GPafisher1966temperature | ||
| J/m3 | 108.4 GPafisher1966temperature | ||
| J/m3 | 55.7 GPafisher1966temperature | ||
| m3/(J·s) | 63.2 GPafisher1966temperature | ||
| 0.019exp(-5840/T) cm2/s powell1973mass | 222 GPazhang2012electronic | ||
| 0.019exp(-5840/T) cm2/s powell1973mass | 70 GPazhang2012electronic | ||
| 0.037exp(-7199/T) cm2/s wheeler1971diffusion | 58 GPazhang2012electronic | ||
| 235.09 kJ/cm3 | 395 GPawachtman1965elastic | ||
| 368.77 kJ/cm3 | 121 GPawachtman1965elastic | ||
| 220.99 kJ/cm3 | 64.1 GPawachtman1965elastic | ||
| 3.12 at.%morrell2013uranium | 0.0145 blaxland2015involvement | ||
| 75 at.% | 0.0145blaxland2015involvement | ||
| 1.12 at.% | 0.0093blaxland2015involvement | ||
| 0.5 at.% | 0.1259 | ||
| -0.1715 kJ/cm3 | 0.1259 | ||
| 12.64 cm3/molbanos2018review | 0.3777 |
II.4 Elastic energy density
The formation of hydride precipitate within the metal matrix is accompanied by a large volume expansion due to the lower density of the hydride precipitate compared to the metal matrix. The mechanical stresses and strains arising from this volume expansion play a critical role in determining the thermodynamics and kinetics of the phase transformation in hydrogen-induced spot corrosion. To calculate the elastic energy associated with the volumetric changes during hydride formation, we write the elastic energy density based on the Khachaturyan microelasticity theorymorris2010khachaturyan as the following:
| (19) |
where and are stress and elastic strain respectively. The Einstein summation convention is used here and thereafter. Using the additive decomposition theorem for strain under the assumption of small strain and ignoring the plastic strain, the elastic strain is given by:
| (20) | |||
| (21) |
where is the microscopic heterogeneous strain, is the stress-free strain associated with the eigenstrain and grain orientation.
To account for the heterogeneous elastic responses in the polycrystalline metal matrix containing the hydride precipitate and oxide film, we adapted the stress-free strain models as the following:
| (22) |
where is the grain shape function identifying the -th grain ( within the -grain and outside)heo2019phase , and and are the components of a rotation transformation matrix for the rotation from the global reference coordinate system to the local coordinate system defined on the given -th grain bair2016phase ; heo2019phase . and are the two kinds of eigenstrains in determining the degree of volume expansion during the phase transformation from the metal to hydride and oxide, respectively. Eq. (22) implies that the eigenstrain exists only in the hydride precipitate and the oxide film phases. The rotation (or orientation) of the -th grain is represented by , in two-dimensional (2D) systems, with
| (23) |
In the Lagrangian finite-strain theorylubliner2008plasticity , the eigenstrains are related to the deformation gradient tensor by the volumetric strain from the metal matrix to the hydride precipitate. To obtain these vital parameter, we made certain assumptions based on the available experimental data. In the hydrogen-induced spot corrosion experiment of the U metal system, the morphology of hydride precipitate exhibits certain characteristics. Specifically, the hydride precipitates demonstrate approximate isotropy in the - planebloch1997kinetics and anisotropy in the directionjones2013surface , resembling a round plate shapebingert2004microtextural ; banos2018review . Moreover, the corrosion depth along the or direction is approximately 3 timesblaxland2015involvement greater than that along the direction. These observations serve as the basis for our simple assumptions regarding the eigenstrain and deformation gradient tensor. In this work, we assume the eigenstrain and the deformation gradient tensors as the following:
| (24) | |||
| (25) | |||
| (26) | |||
| (27) |
where is a strain parameter that needs to be determined next.
The deformation gradient tensors determine the volume expansion and depict the morphological variation in the phase transformation. For this deformation gradient tensor, we should evaluate whether it properly estimates the volumetric strain in order to correctly account for the transformation elastic energy contribution involving the large volume change. Thus, the determinant of must satisfy the following equation:
| (28) |
where is the volume change of phase transformation from the U metal matrix to UH3 hydride precipate, banos2018review . Using the Eq. (27) to solve (28), we can determine the starin .
To evaluate the mechanical response during the phase transformation, we assume that the mechanical equilibrium is established much faster than the diffusion and phase transformationsheo2019phase , and the displacement is obtained by solving the following mechanical equilibrium equation:
| (29) |
For simplicity, we consider the linear elastic behavior of the metal matrix, hydride precipitate, and oxide film phases. Therefore, the relationship between stress and elastic strain can be described as follows:
| (30) | |||
| (31) | |||
| (32) |
where is the global elastic constantheo2019phase associated with the all phases and all grains , is the elastic constant of the phase in the grain and is the reference elastic constants of the phase in the global coordinate system.
II.5 Growth model
According to the classical nucleation growth theoryporter2021phase , the growth of the hydride precipitate is governed by the total driving force between the metal and the hydride, which is expressed asshen2006effect ; shen2007effect ; han2019phase :
| (33) |
where and are the chemical driving force and the elastic interaction energy between the metal and the hydride, respectively.
The chemical driving force can be calculated directly from the vertical distance between the parallel tangents of the respective free energy density curves, as followshan2019phase ; yang2021hydride :
| (34) |
where and are the free energy density curves of U metal matrix and UH3 hydride.
The elastic interaction energy represents the mechanical contribution part of the total driving force, which can be calculated as followsshen2006effect ; shen2007effect ; han2019phase :
| (35) |
where is the local stress field near the uranium hydride precipitate, and are the corresponding rotational transformation matrices for the grain , is the grain shape function and is the egienstrain of UH3 hydride precipitate.
Substituting the Eq. (35) to Eq. (33), we can determine the contribution of elastic interaction to the total driving force. A positive value indicates that the elastic interaction has a negative contribution to the total driving force, suppressing the growth of the hydride precipitate. Conversely, a negative value suggests that the elastic interaction has a positive contribution to the total driving force, promoting the growth of the hydride precipitatehan2019phase . This relationship between the sign of the elastic interaction and its impact on the total driving force is crucial in understanding the growth behavior of hydride precipitates in the context of hydrogen-induced spot corrosion.
II.6 Numerical implementation
To facilitate the numerical simulation, we employ a nondimensionalized form by defining the characteristic energy ( J), length (5 nm) and time (1 s) for the system. This allows us to express all model parameters in dimensionless units. For solving the evolution equations, the Multiphysics Object Oriented Simulation Environment (MOOSE) based on the Finite Element Method (FEM) is adoptedschwen2017rapid ; bair2017formation ; lin2019modeling ; dykhuis2019phase . The FEM offers greater flexibility than the finite differencewheeler1993computation and spectral methodsli2017review ; yang2021hydride , allowing a wide range of boundary conditions, domain shapes, and coupling to other physicsschwen2017rapid . It proves to be an effective approach for solving the PF problem with diverse boundary conditions encountered in this study.
To ensure the accuracy of the numerical simulation and to provide computational efficiency, adaptive meshing is utilized to ensure a fine mesh at the interfaces and a large mesh within the phases. In the monocrystal and bicrystal simulations, the interface region contains at least 11 square elements with a size of approximately 2.6 nm to properly approximate the phase order parameters and hydrogen concentration, and the largest mesh size within phases is around 42 nm. For polycrystal simulations, the adaptive mesh adopts the square elements with the smallest mesh size of about 0.65 nm inside the interface and the largest mesh size of about 5 nm inside the phases.
In the concrete simulation, an approach similar to Mai et al.’s workmai2016phase is adopted. Initially, one or more semicircular initial hydride precipitates with a radius of 70 nm are placed at the top of the rectangular region (0.5 m 2.5 m). This region consists of the metal matrix and the oxide film, where the oxide film has a thickness of . The hydrogen concentration in the initial precipitate is set to 75 at.%, and those of the metal matrix and oxide film are set to 3.12 at.% and 1.12 at.%, respectively. Unless otherwise stated, the values of the parameters used for performing the simulations presented in the following sections are selected from Table 1. For the phase field, all boundaries are set to zero flux boundary conditions. For the hydrogen concentration field, the top boundary represents a fixed concentration boundary condition (2 at.%), simulating the entry of hydrogen from the environment into the phases, while the other boundaries have zero flux boundary conditions. The top boundary of the displacement field is set as free, while the other boundaries are constrained. In the simulation, we define the global reference coordinate system ( and ) of the simulation domain along the [100], [001]-directions of the U metal matrix, respectively. The (001) surface of the U metal matrix is exposed to the environment, as previous studies have indicated that the (001) surface is particularly susceptible to hydrogen absorption and hydrogen-induced spot corrosiontaylor2008evaluation ; taylor2009ab . For the bicrystal and polycrystal simulations, the grain rotation angle is used to describe the local coordinate system within each grain. The simulation is carried out under the assumption of plane stress.
III Results and Discussion
III.1 Simulation in the uranium monocrystal
A monocrystal system serves as a fundamental and essential model for studying the internal mechanisms of corrosion. Pre-simulation of the hydrogen-induced spot corrosion in the monocrystal can provide valuable insights into the fundamental processes and establish a foundation for investigating bicrystal and polycrystal systems. In this section, we explore the effects of oxide film thickness, the interaction of multiple corrosion spots, and grain orientation on the corrosion morphology and mechanical properties on the surface of U monocrystal. These results validate and demonstrate the accuracy of our MPF model.
III.1.1 Effect of oxide film on corrosion morphology
During the early growth of the hydride precipitate, the oxide film located between the hydride and the external environment acts as a mechanical barrier, impeding the growth of the hydride precipitatebanos2018review . However, as hydrogen corrosion progresses, the continuous expansion of the hydride could make the failure of the oxide film, leading to the loss of its barrier functionbrierley2016anisotropic . Therefore, it is important to investigate the mechanical interaction between the oxide film and the hydride to accurately estimate the morphology of the hydride and elucidate the fracture mechanism of the oxide film.
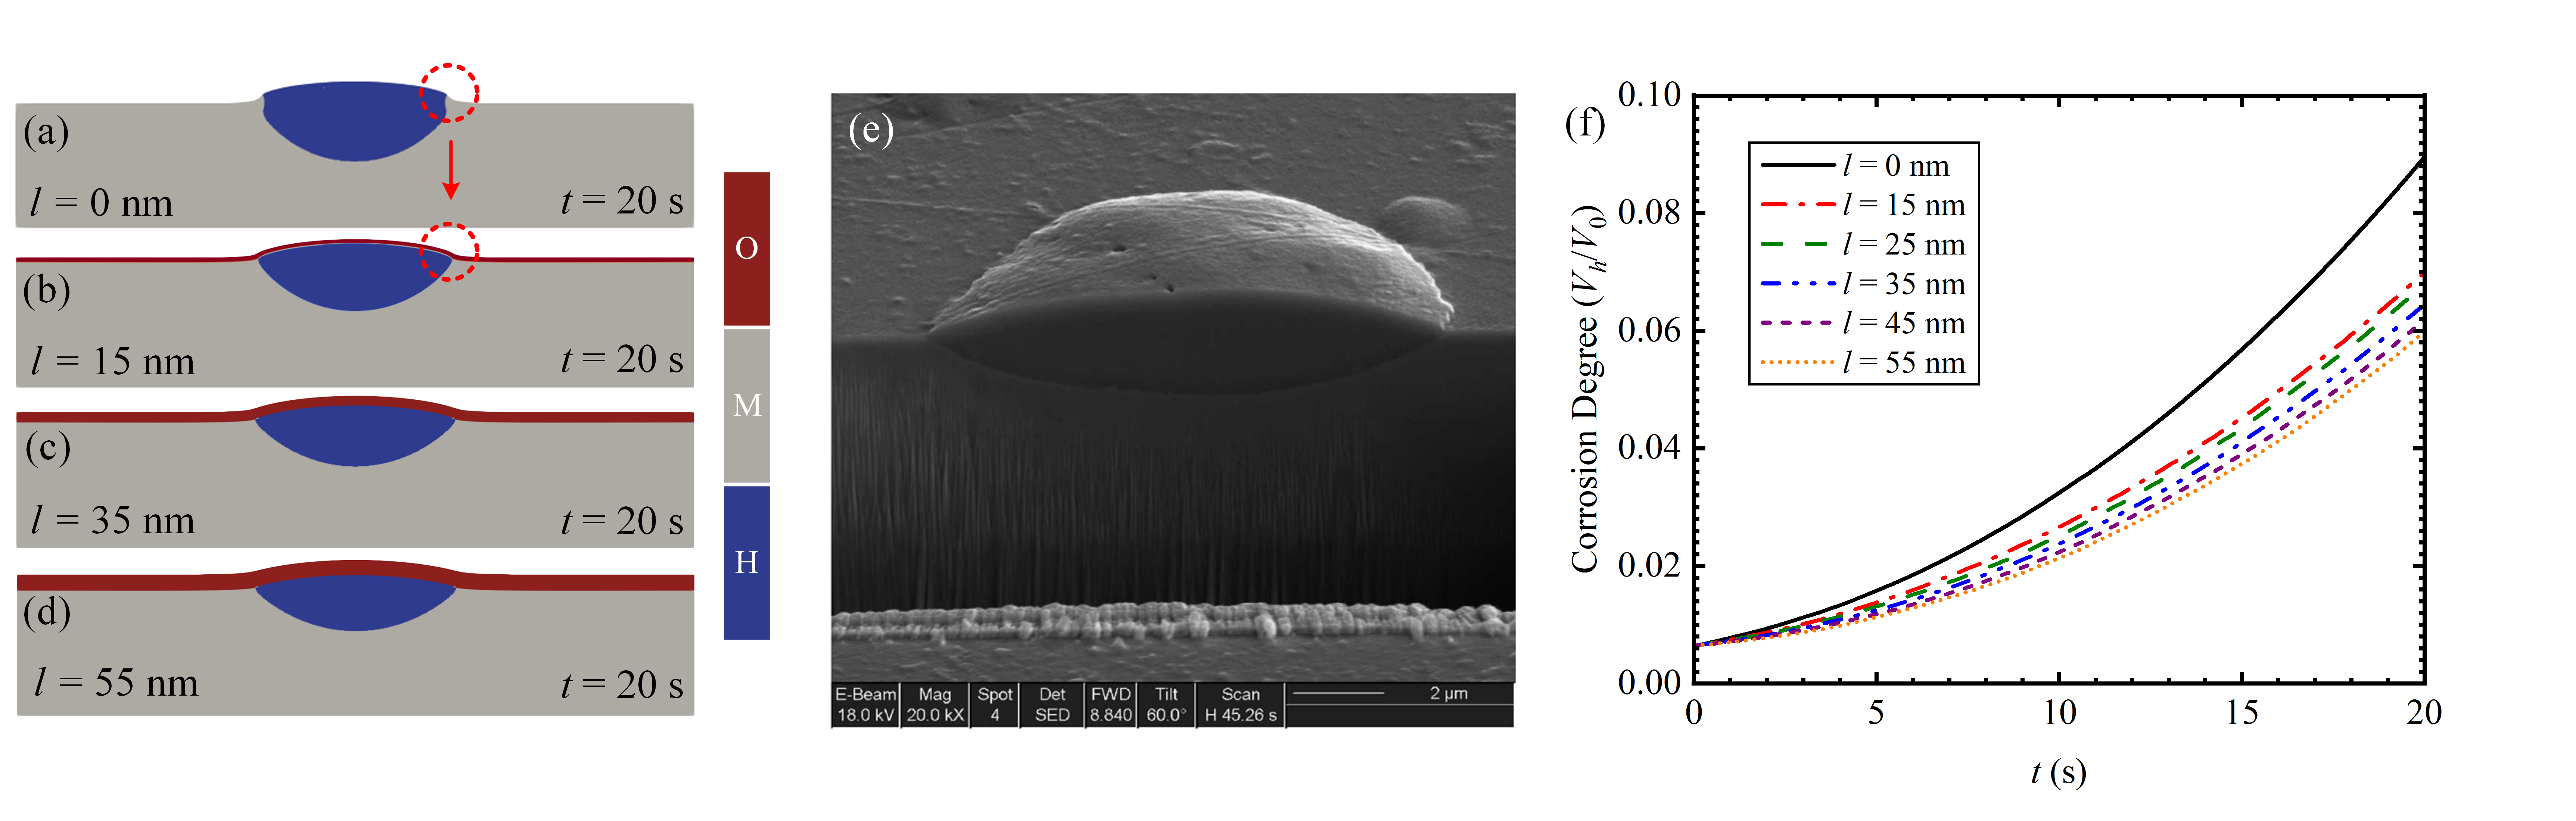
In the Sec. II A of the Supplementary Materials, we show the evolution of the corrosion morphology under different oxide film thicknesses. As the hydride precipitates expand and grow, the oxide film phase gradually bulges. The hydride precipitate exhibits an anisotropic growth behavior, forming a flat shape. Figs. 3(a)-(d) show the influence of oxide film thicknesses () on the flat shape corrosion morphology in the U monocrystal at s. The metal matrix, hydride precipitate, and oxide film phases are represented by the gray, blue, and red colors, respectively. Fig. 3(a) presents the result simulated using the conventional PF modelsheng2022phase , while Figs. 3(b)-(d) show that results obtained using the current MPF model. Increasing the thickness of the oxide film inhibits the longitudinal growth of the hydride precipitate, resulting in a corrosion morphology closer to the plate-like shape. Furthermore, as indicated by the red circles in Figs. 3(a) and (b), the introduction of the oxide film phase leads to the manifestation of hydride with sharp edges near the triple junction of the phases. These results are consistent with the secondary electron images in the experiments by Bingert et al.bingert2004microtextural in Fig. 3(e). Fig. 3(f) shows the variation of the corrosion degree () of the metal matrix as a function of time under various oxide film thicknesses, where represents the volume of the hydride precipitate and is the initial volume of the system. The results demonstrate that increasing the thickness of the oxide film can decelerate the overall corrosion rate of the metal matrix.
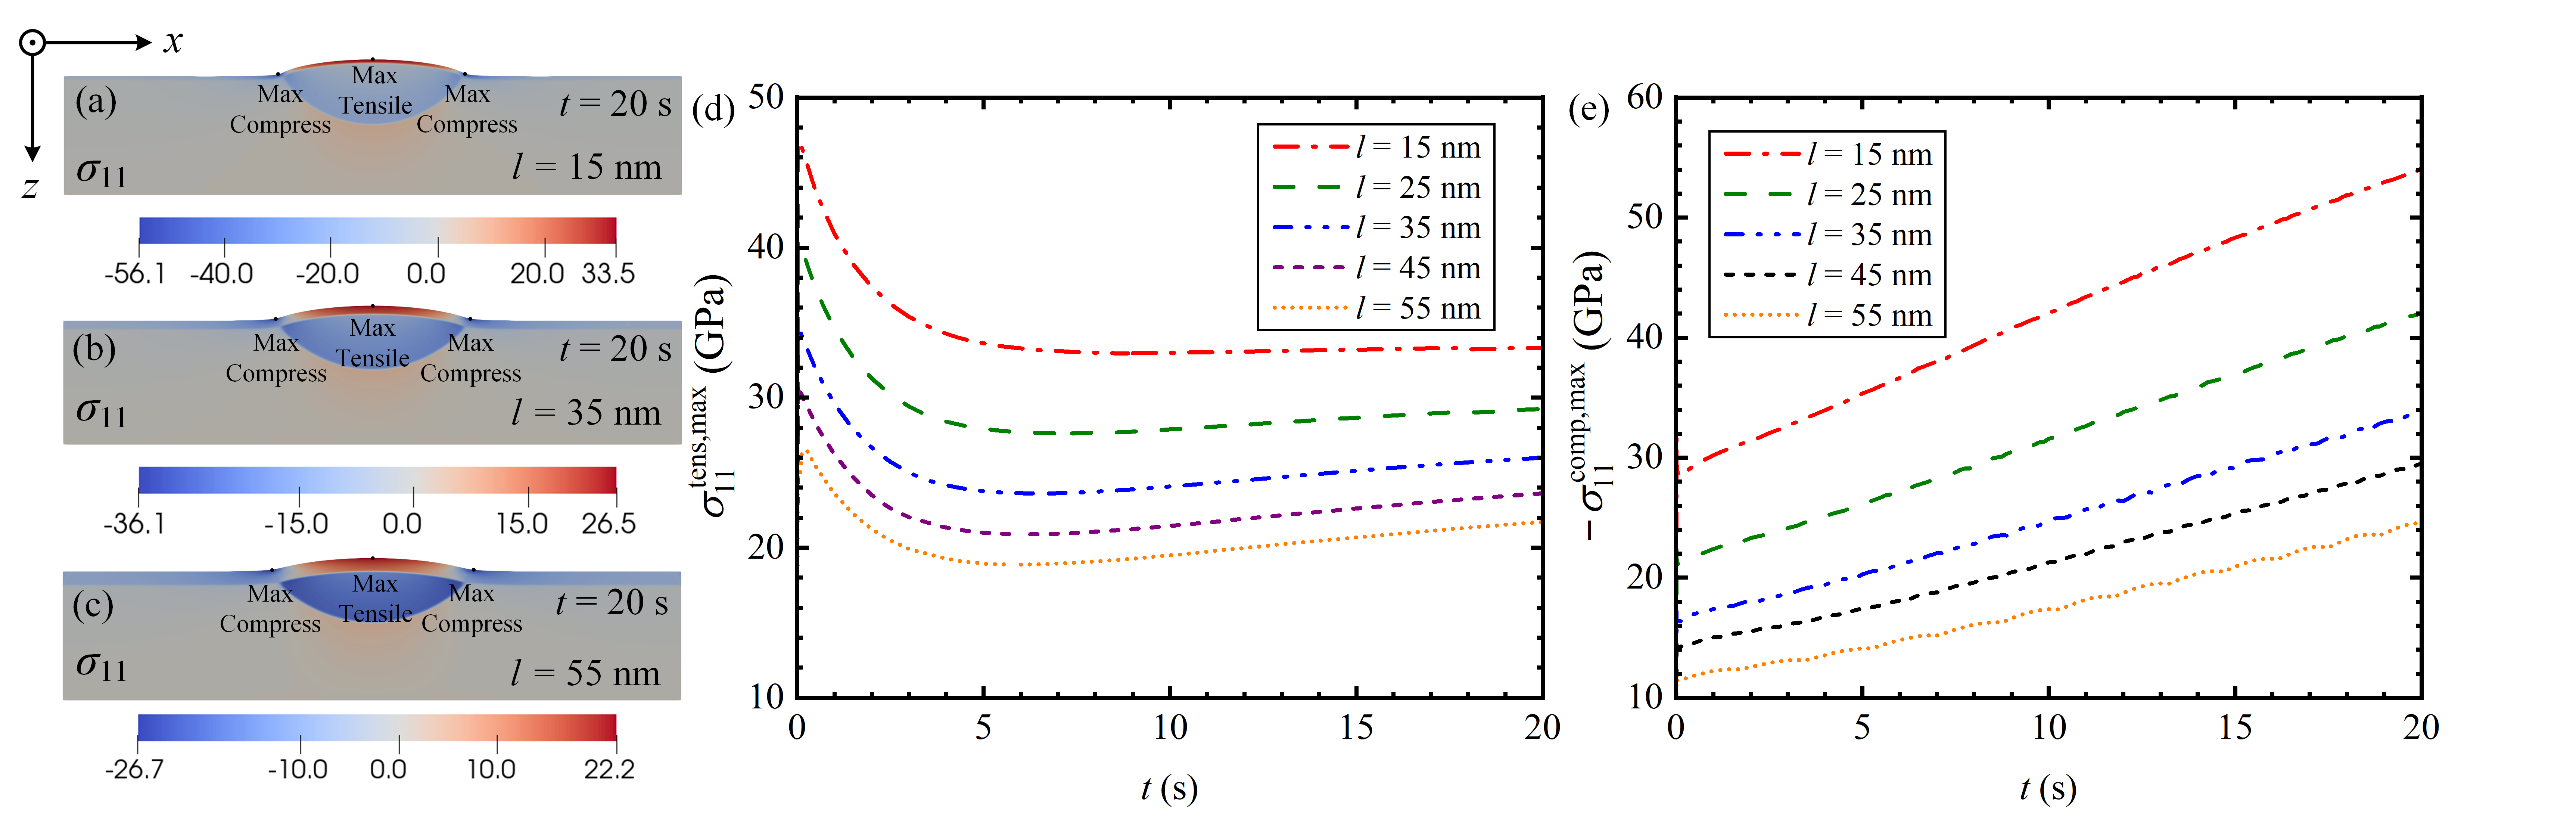
In our previous worksheng2022phase on hydrogen-induced spot corrosion of U metals with the absence of an oxide film, we observed significant tensile and compressive stresses on the surface of U metals and speculated that these stresses could influence the fracture mechanism of the oxide film. Hence, in this work, we focus on characterizing the stresses within the oxide film. We examine the distribution of stress during hydrogen corrosion under different oxide film thicknesses, as depicted in Figs. 4(a)-(c). The formed hydride is compressively stressed, which is a consistent result with previous workheo2019phase ; sheng2022phase . In addition, compressive stress also occurs in the oxide film near the metal interface, while tensile stress occurs in the film above the hydride. These stresses observed within the oxide film can be attributed to two main factors: i) the lattice mismatch between the oxide film and the metal matrix induces a uniform compressive stress in the oxide filmlin2020mechanical applied by the metal matrix; ii) the growth and expansion of hydrides lifts the surface oxide film, applying tensile stress to the center of the oxide film and compressive stress near the edge of the hydridesheng2022phase . The maximum tensile stress is concentrated in the center of the oxide film, while the maximum compressive stresses are observed within the oxide film near the hydride edge, indicating a higher risk of fracture in these regions.
Figs. 4(d) and (e) illustrate these maximum stresses within the oxide film as a function of time under different oxide film thicknesses. We observe that a decrease in the maximum tensile stress during the initial stages of corrosion, which is associated with the decrease in the elastic energy density within the oxide film induced by the morphological transformation of the hydride (see the Sec. II B of the Supplementary Materials). Subsequently, the maximum tensile and compressive stresses increase continuously due to the continuous growth of the hydride. We also note that increasing the thickness of the oxide film can mitigate the maximum tensile and compressive stresses.
In short, these simulation results demonstrate the potential of our MPF model to simulate more accurate corrosion morphology and reveal the mechanical interaction between the metal, hydride and oxide film. Moreover, our MPF model effectively captures the stress concentration induced by hydride growth and compression within the oxide film, providing insights into the fracture behavior of the oxide film.
III.1.2 Effect of multiple corrosion spots on corrosion morphology
The above simulations have focused on the growth of a single corrosion spot, but in reality, several corrosion spots can start adjacent to each other and thus interact with each other as their evolution, forming a larger hydride precipitate. While previous work by Yang et al. yang2021hydride has explored the influence of spot interaction on corrosion morphology, the underlying mechanism behind the merging of corrosion spots has not been elucidated. In this section, we investigate the effects on corrosion morphology and stress distribution within the material by varying the number of corrosion spots () and the distance between corrosion spots ().
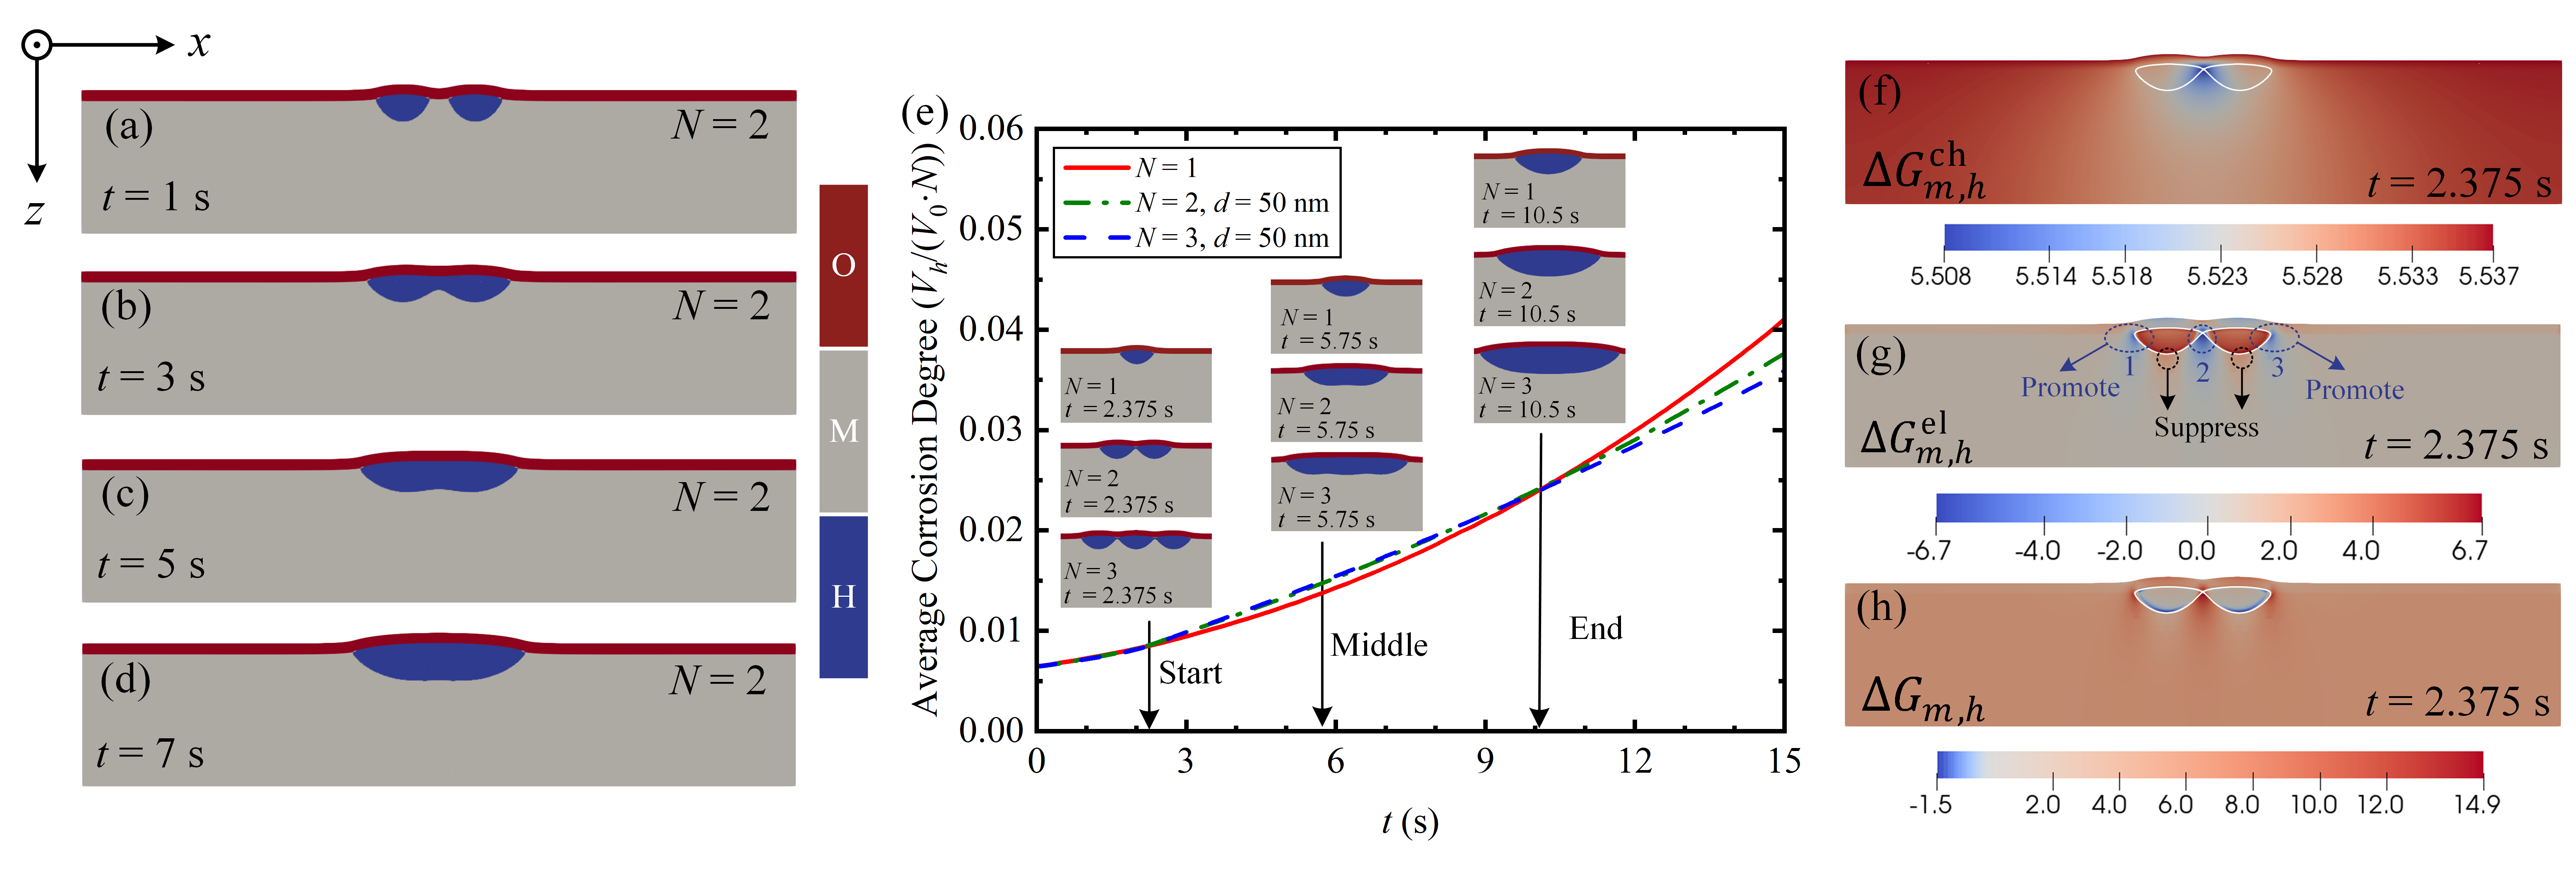
The evolution of the corrosion morphology in the case of multi-spot corrosion with is depicted in Figs. 5(a)-(d). At the beginning of the simulation, the distance between two identical semicircular corrosion spots is set to 50 nm. At s, the corrosion spots have interacted and merged, while at s, the merging of these spots leads to the formation of a larger and more flattened hydride precipitate. The effect of the distance between corrosion spots on the merging of corrosion spots is shown in the Sec. II C of the Supplementary Materials.
The influence of the number of corrosion spots on the average corrosion degree of the metal matrix is shown in Fig. 5(e). The insets divide the multi-point corrosion process into three stages. Prior to the interaction between corrosion spots , each corrosion spot exhibits a similar average corrosion degree curve for both single-spot and multi-spot corrosion. During the interaction period , the merging of multi-spot corrosion accelerates the average corrosion rate. Subsequently, following the completion of the interaction , the average corrosion rate of multi-spot corrosion is lower than that of single-spot corrosion, and the higher the number of corrosion spots, the lower the average corrosion rate. It should be noted that the average corrosion degree solely represents the contribution of each spot to the total corrosion degree , and the total corrosion degree for multi-spot corrosion remains significantly higher than that for single-spot corrosion.
In order to elucidate the merging mechanism of corrosion spots and explain its impact on the average corrosion degree, a comprehensive analysis is conducted on the distribution of the chemical driving force , elastic interaction energy , and total driving force , as illustrated in Figs. 5(f)-(h). Given the uniform distribution of the chemical driving force, the non-uniform elastic interaction energy becomes the dominant factor influencing the corrosion morphology and the merging of corrosion spots. The negative elastic interaction energy (location 2 in Fig. 5(g)) between adjacent corrosion spots contributes positively to the total driving force, thereby promoting the merging of corrosion spots and accelerating the average corrosion rate. However, after the merging, the total corrosion degree of multi-point corrosion is less than N times that of single-spot corrosion, resulting in a decrease in the average corrosion rate.
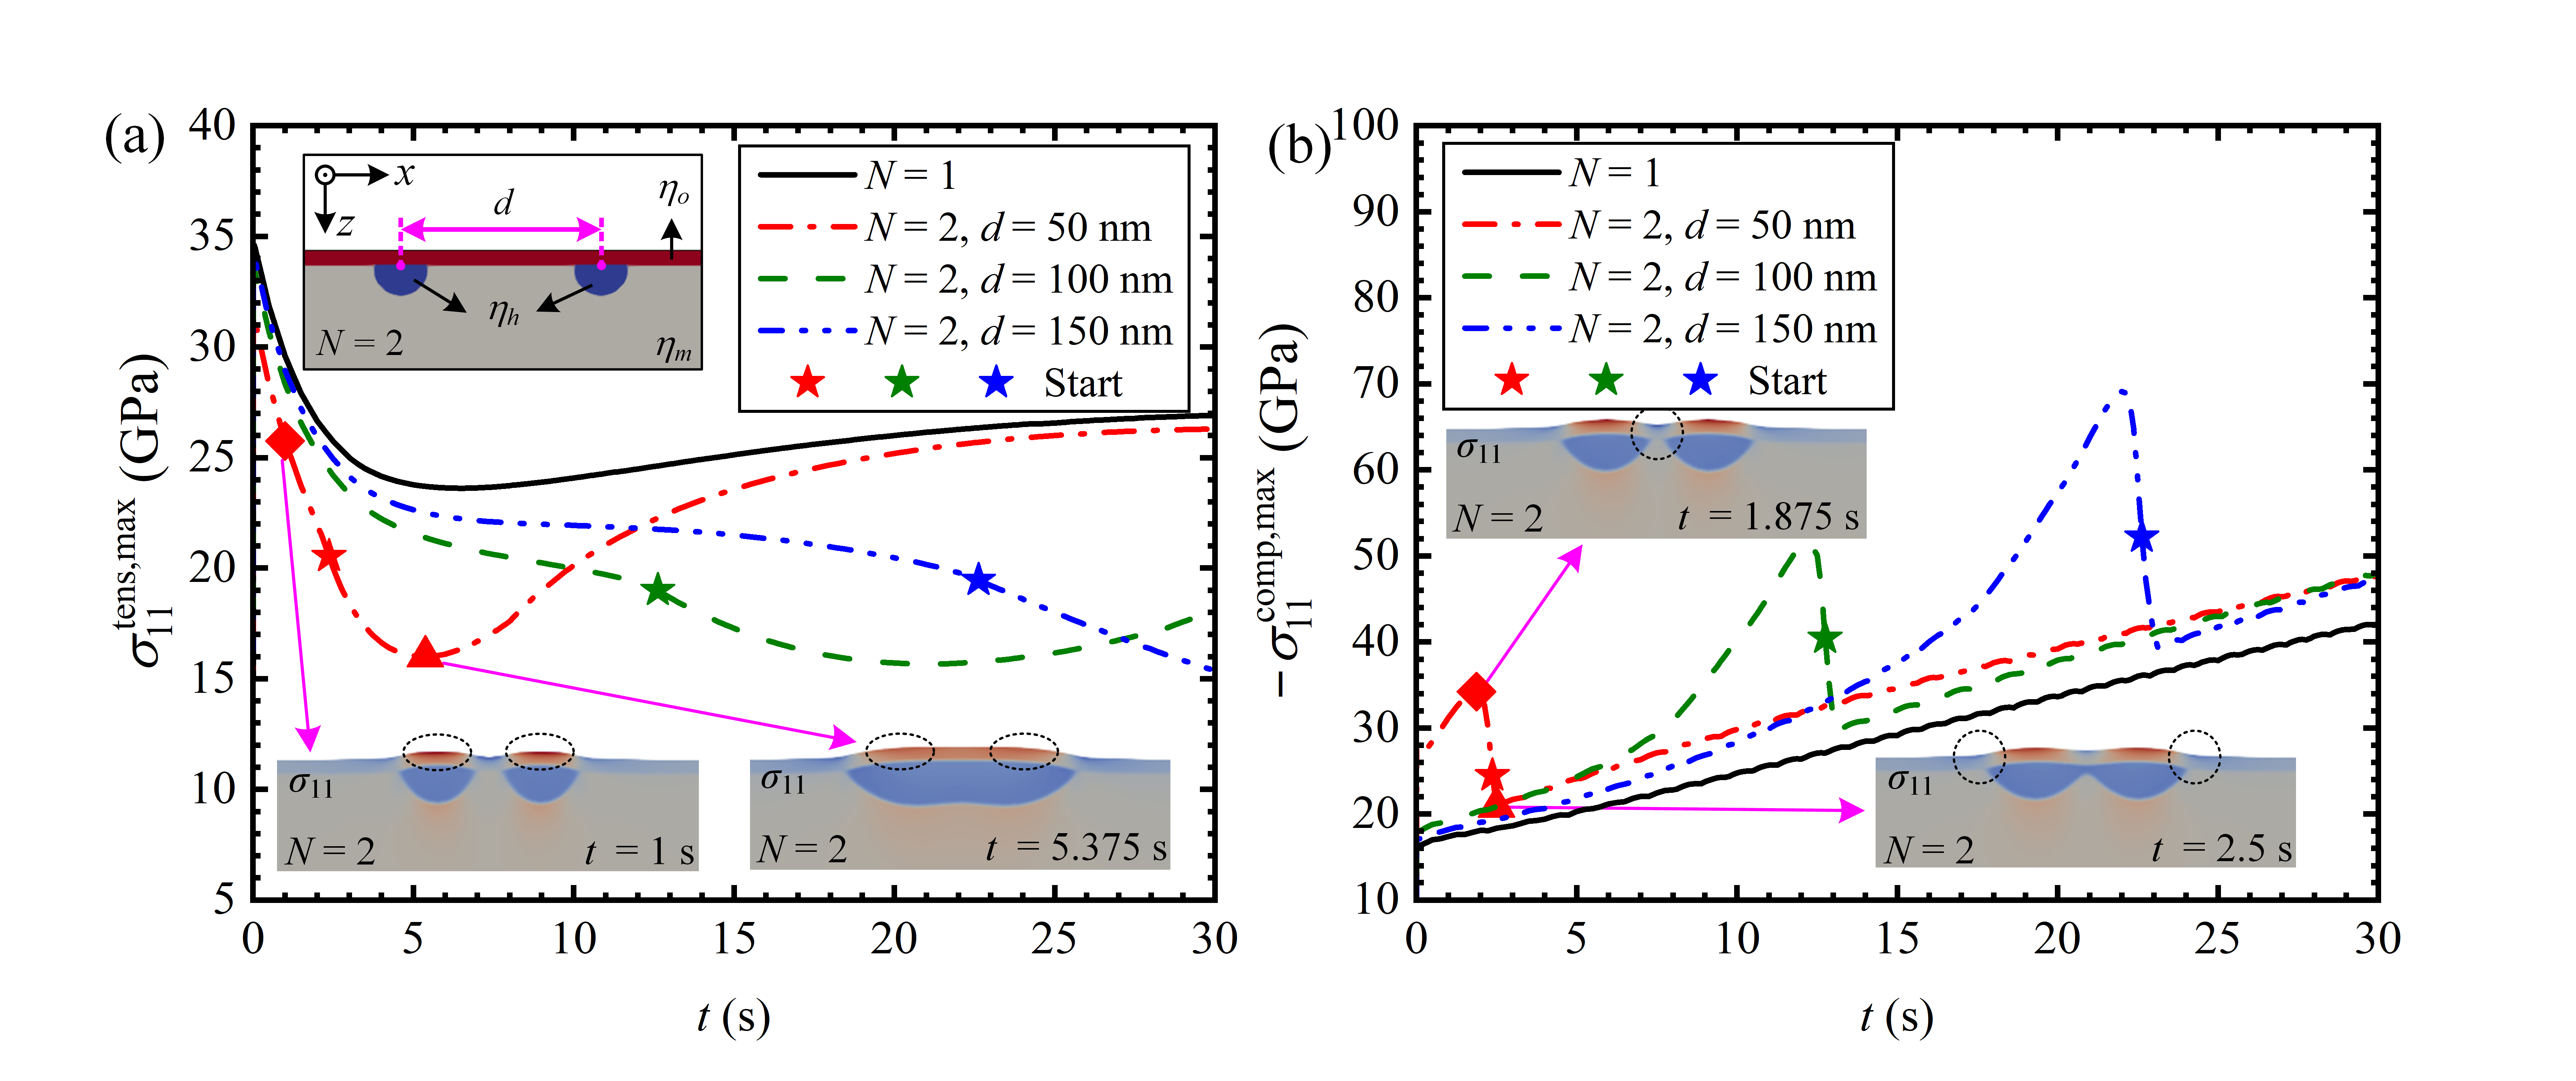
We also investigate the influence of corrosion spot merging on the maximum tensile and compressive stress of the oxide film, as shown in Figs. 6(a) and (b), respectively. The different colored pentagrams indicate the start of the corrosion spot interaction. Several insets show the stress distribution of triangle and rhombus points on the stress curve, and the dashed circles in the insets show where the maximum stress is located. The maximum tensile stress initially decreases due to the shape change of the hydride, further decreases as a result of the merging of corrosion spots, and subsequently exhibits a continuous increase after the merging due to the hydride growth. As the distance between the corrosion spots increases, the corrosion spots require a longer growth time to contact and interact, and the further reduction in the maximum tensile stress caused by the merging of the corrosion spots is delayed accordingly. In addition, the merging of corrosion spots can relieve the compressive stress between them. Prior to the merging of corrosion spots, the maximum compressive stress of the oxide film is concentrated between adjacent corrosion spots (the inset when s). However, during the merging process, the maximum compressive stress between adjacent corrosion spots is alleviated and shifts towards the oxide film near the hydride edges (the inset when s). Increasing the distance between corrosion spots can also delay the release of compressive stress.
Interestingly, Figs. 6(a) and (b) reveal that the maximum tensile stress and compressive stress within the oxide film for the multi-spot corrosion can revert to the stress levels observed for the single spot corrosion after the merging of corrosion spots. After the merging of the corrosion spots, the maximum compressive stress quickly returns to the stress level seen for the single spot corrosion (compare the red, green, and blue curves with the black curve). In contrast, the recovery of the maximum tensile stress takes a longer duration. This is due to the fact that the hydride needs time to grow sufficiently to produce a larger bulge, ultimately leading to the positional relocation of the maximum tensile stress toward the center of the oxide film.
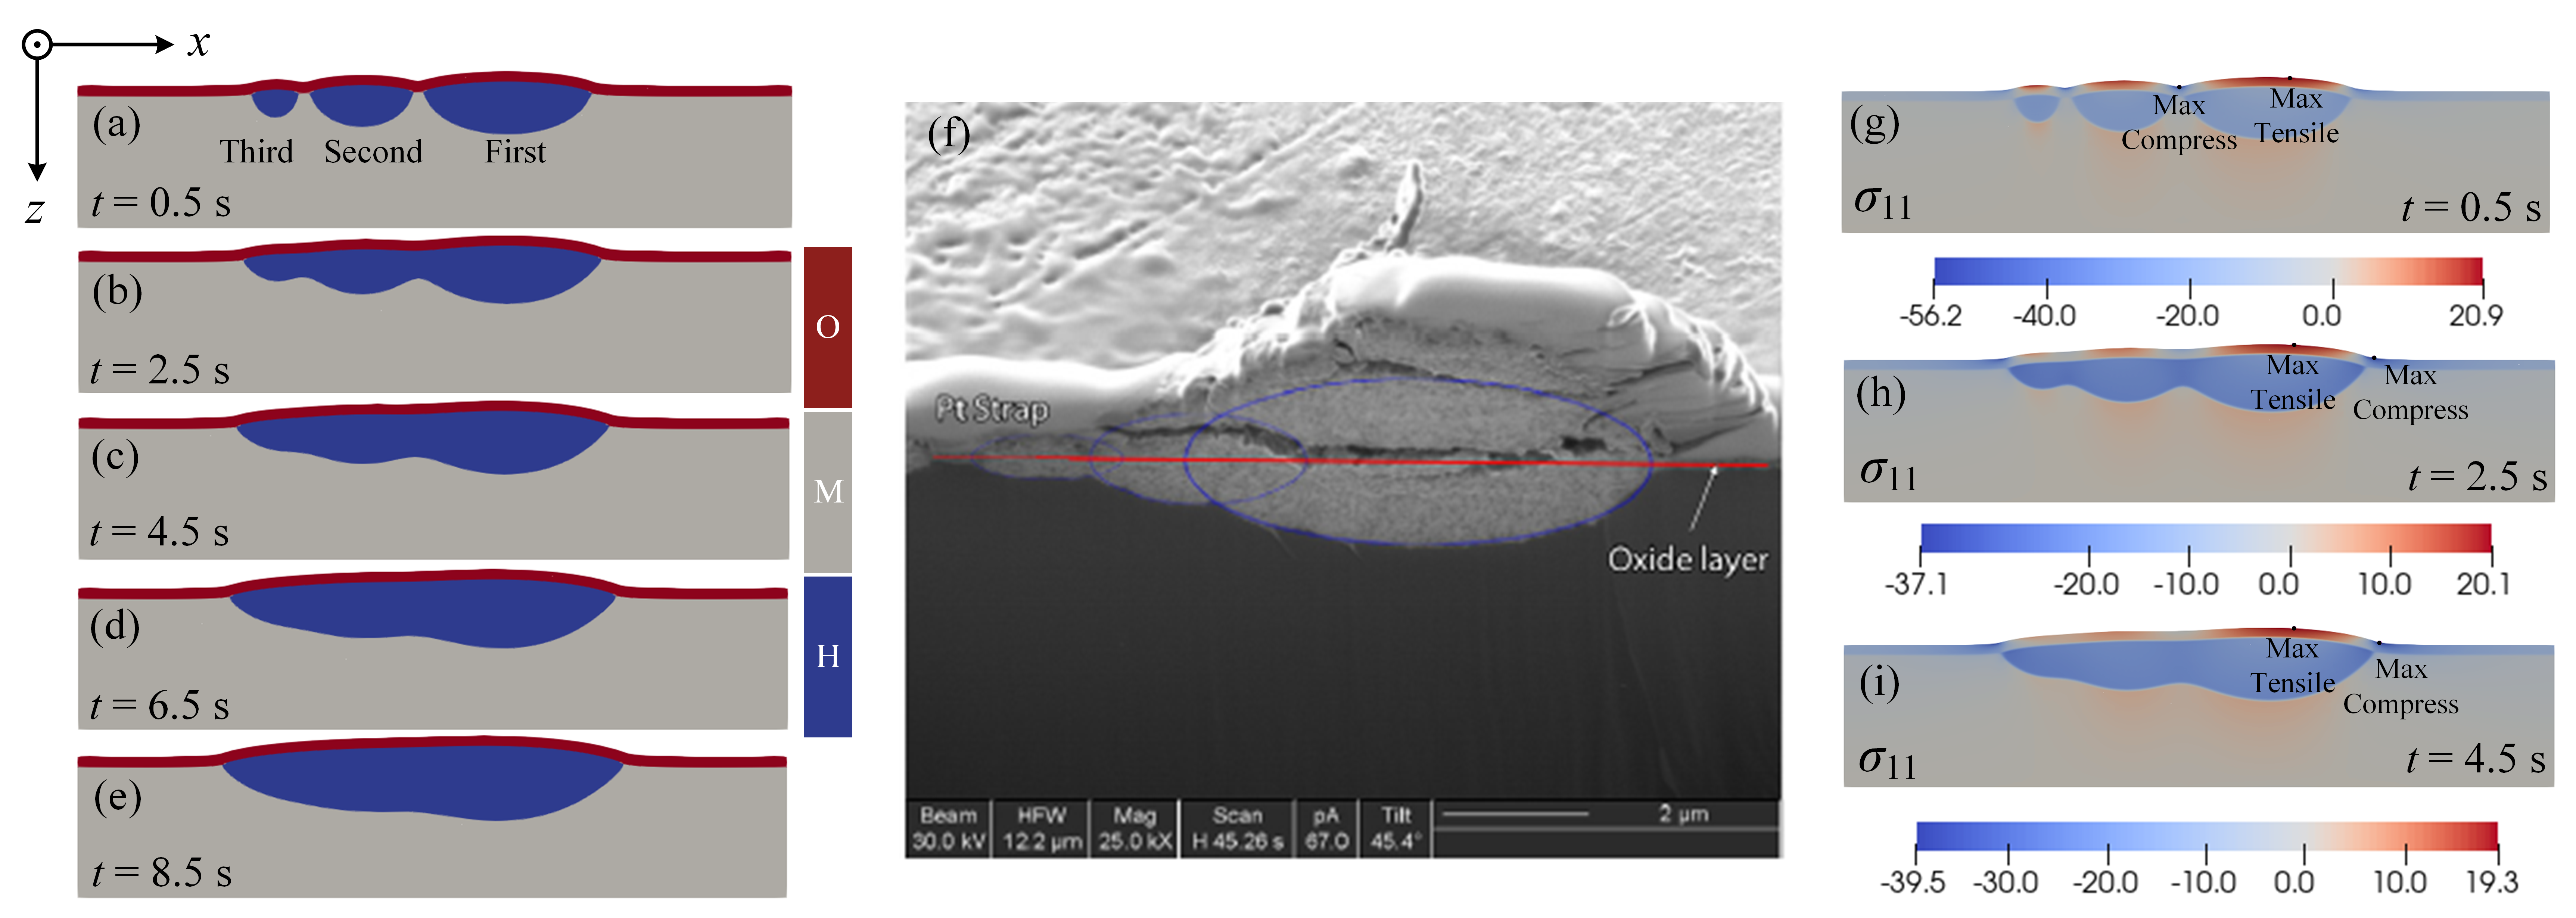
Figs. 7(a)-(e) present a simulation illustrating the merging of non-simultaneous nucleation corrosion spots, resulting in an asymmetric corrosion pattern. The results are in good agreement with the secondary electron images from experiments by Jones et al.jones2013surface in Fig. 7(f). This morphology is formed by the merging of three adjacent corrosion spots that nucleated at different times, and the nucleation sequence of the corrosion spots is indicated.
Figs. 7(f)-(h) show the distribution of stress in the asymmetric corrosion pattern. The maximum tensile stress is consistently located in the center of the oxide film above the largest of the three corrosion spots due to the largest bulge of the oxide film above the largest corrosion spot. However, the maximum compressive stress appears initially between adjacent corrosion spots, and as the corrosion spots merge, it shifts to the oxide film near the location of the largest corrosion spot.
The above results show that the merging of corrosion spots accelerates the corrosion rate. The closer the distance between the corrosion spots, the faster the merger occurs. The merging of multiple adjacent corrosion spots that nucleated at different times can induce the formation of asymmetric morphology. This merging phenomenon highlights the significance of corrosion spot interaction in influencing the overall corrosion morphology, corrosion rate and material stress.
III.1.3 Effect of grain orientation on corrosion morphology
In studies of hydrides within the zirconium metal, it has been observed that the growth morphology of hydride precipitates varies with grain orientation, as previously reportedhan2019phase ; heo2019phase . Grain rotation alters the mechanical symmetry (i.e. eigenstrains and elastic constants) near the metal surface, thereby influencing the corrosion morphology. To accurately assess the corrosion resistance of metallic materials based on their grain microstructure and optimize their performance, it is essential to investigate and understand the impact of grain orientation on the growth of hydride precipitates in hydrogen-induced spot corrosion of metal surfaces. Therefore, we utilize the MPF model to examine the effect of grain orientations on the corrosion morphology during the spot corrosion process of the U monocrystal. To start the simulation, the grain is rotated clockwise by a small angle , and the stress-free strains (Eq. (22)) and elastic constants (Eq. (32)) are adjusted accordingly. The other simulation settings are the same as before.
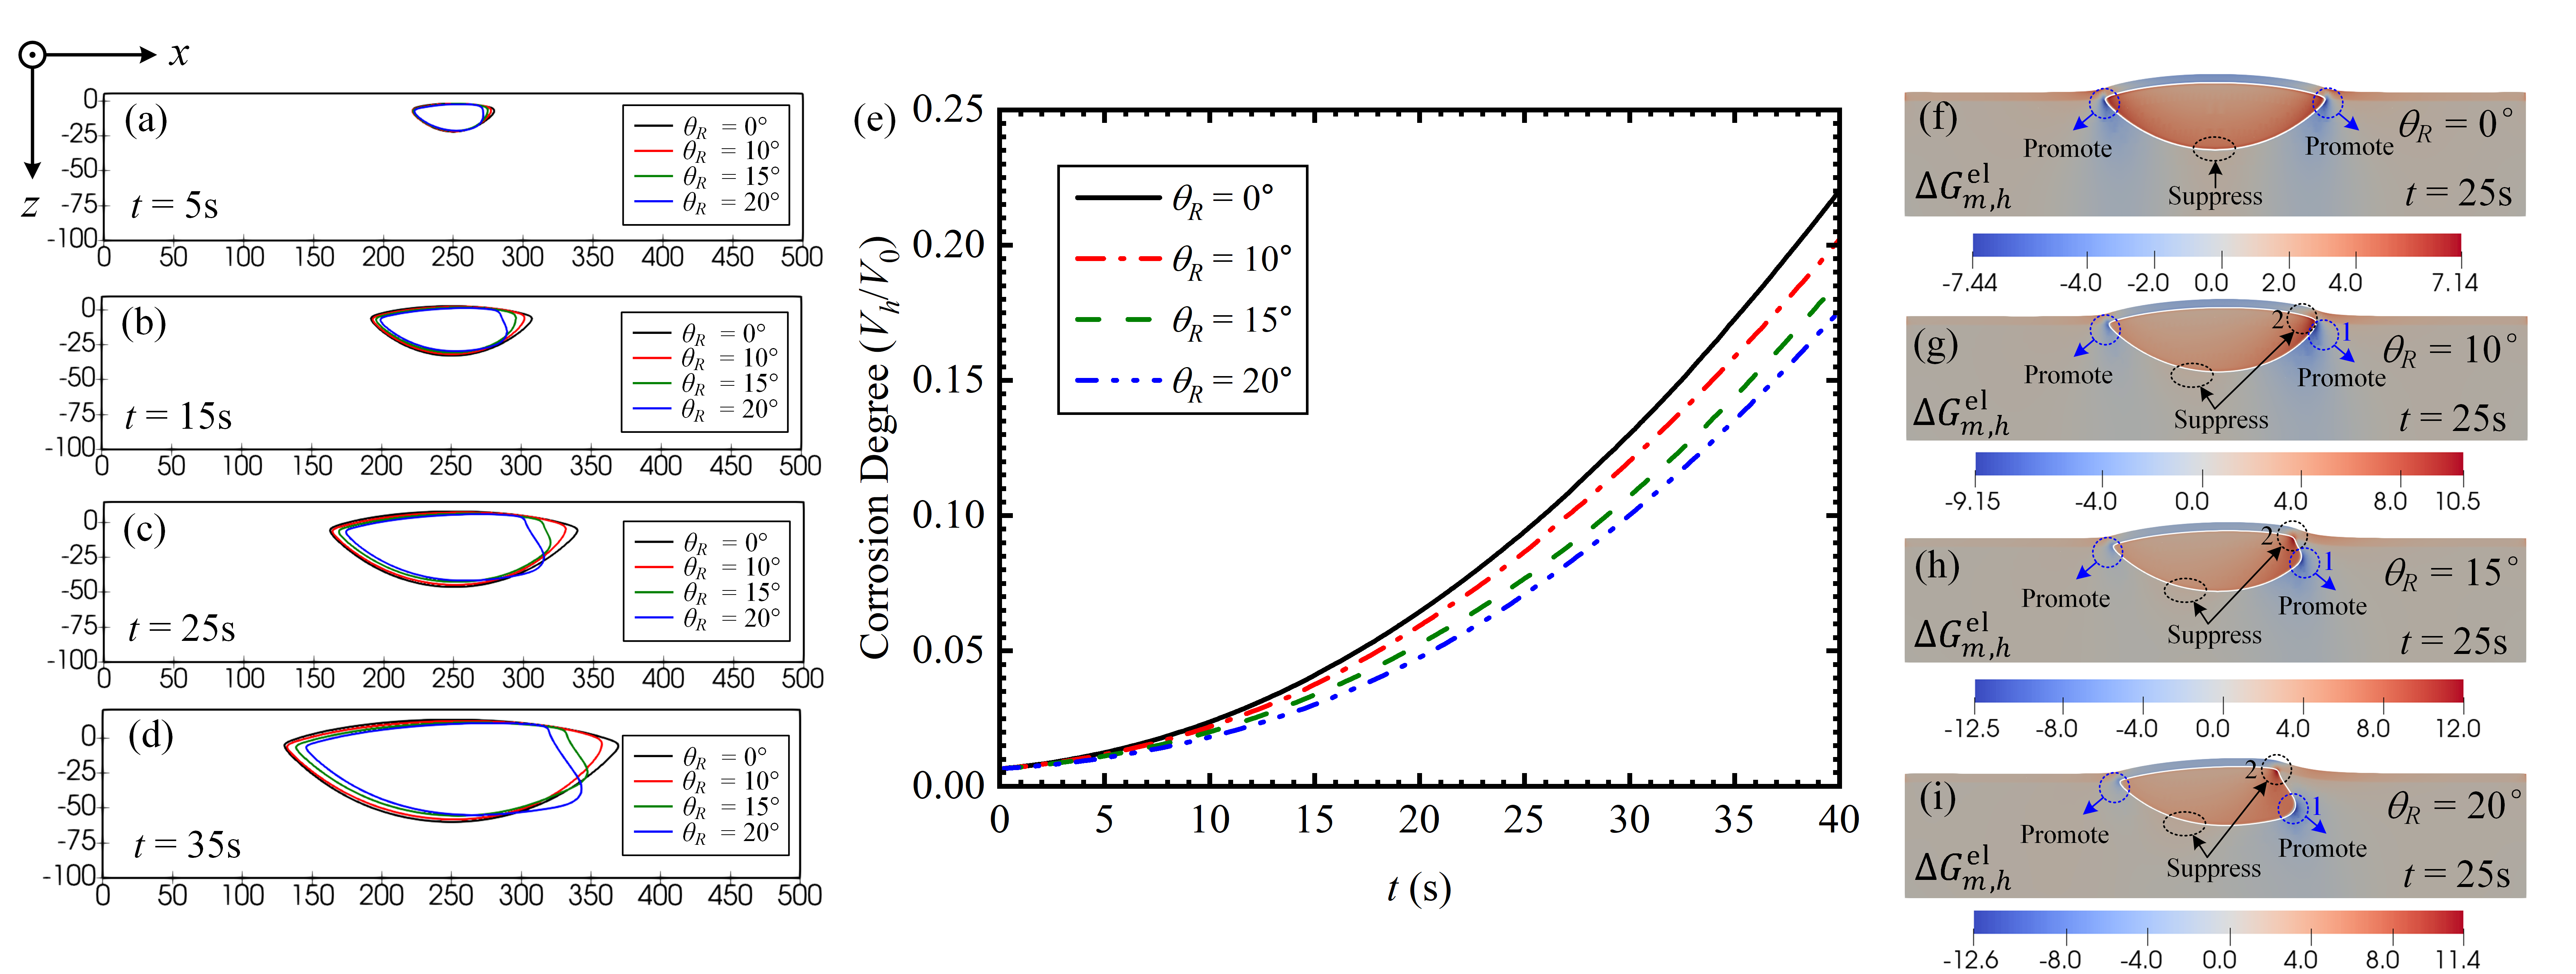
Figs. 8(a)-(d) illustrate the effect of grain orientation on the morphology outline during the growth of hydride precipitates. Fig. 8(e) shows the variation of the corrosion degree () of the metal matrix as a function of time under different grain orientations. Grain rotation exerts an influence on the preferred growth pattern of hydridesheo2019phase , inhibiting the lateral growth in the vicinity of the oxide-hydride interface, decreasing the corrosion degree of metal. The effect of grain orientation on the corrosion degree can be seen in the Sec. II D of the Supplementary Materials. Figs. 8(e)-(h) show the distribution of the elastic interaction energy between the metal and hydride at s in the monocrystal for different grain rotation angles. As a result of the rotation, the right-side negative elastic interaction (location 1) is rotated into the lower-right metal, promoting the growth of the hydride into the metal interior, and the positive elastic interaction region (location 2) near the hydride-oxide interface suppresses the hydride growth along the metal-oxide interface.
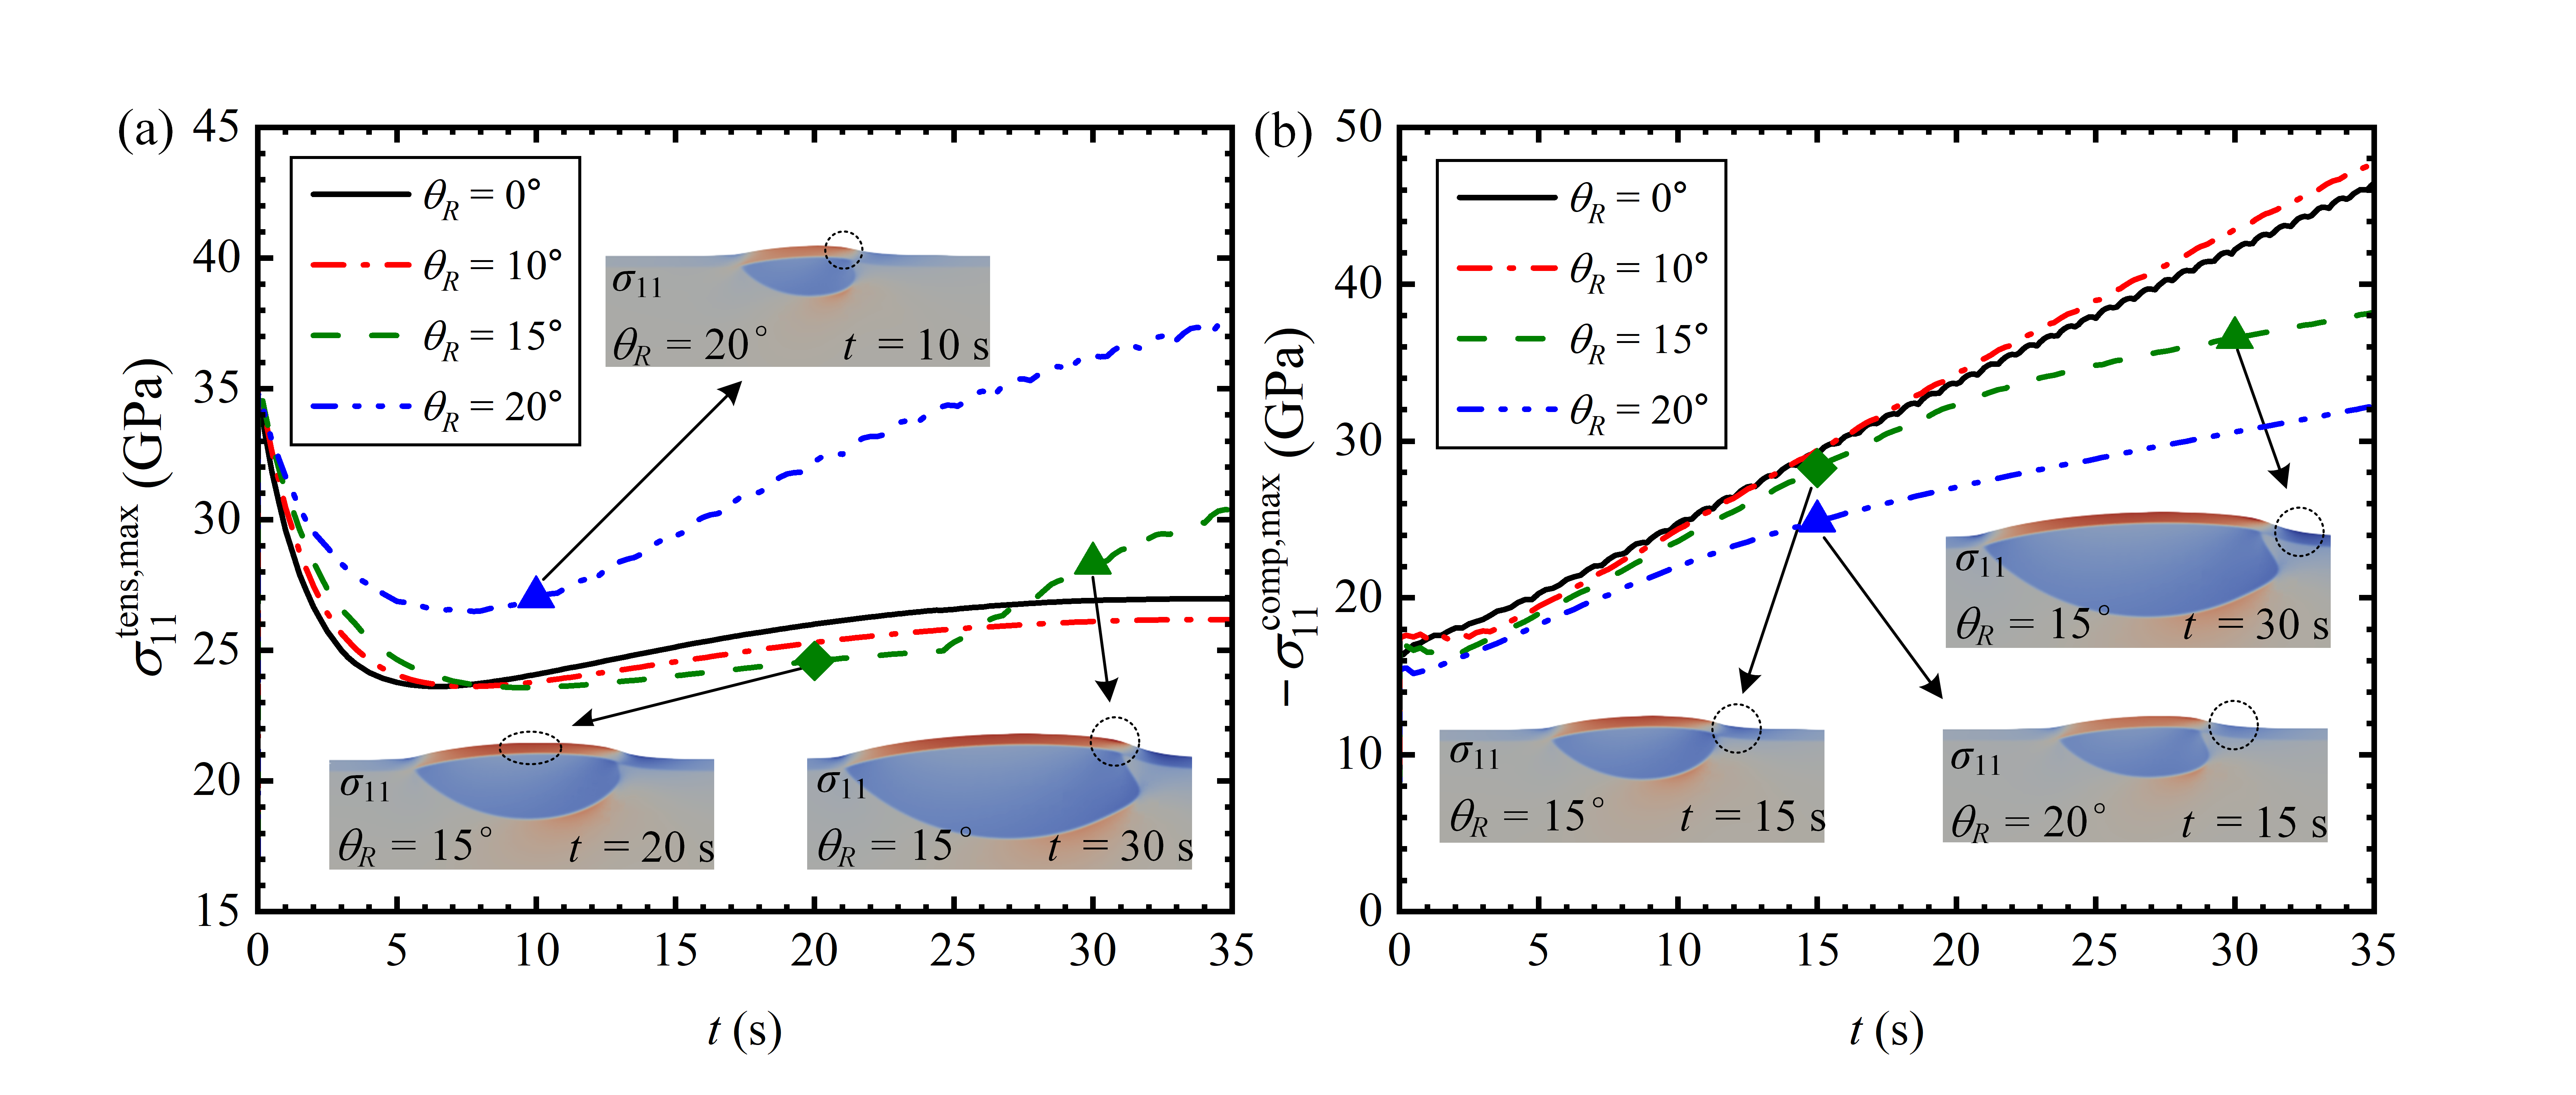
Furthermore, we investigate the influence of grain orientation on the maximum tensile and compressive stresses within the oxide film, as shown in Fig. 9. Several insets show the stress distribution of triangle and rhombus points on the stress curve, and the dashed circles in the insets show where the maximum stress is located. As the hydride growth progresses, the maximum tensile stress of the oxide film shifts from the center to the vicinity of the slowest point of hydride growth (see the inset when s in Fig. 9(a)). For small grain rotation angles (), grain rotation has little effect on the maximum tensile and compressive stresses within the oxide film. However, as the grain rotation angle increases, the influence of grain rotation on these stress parameters gradually becomes significant. For larger angles (), grain rotation further amplifies the maximum tensile stress while reducing the maximum compressive stress. This behavior is directly associated with the variation in hydride morphology induced by grain orientation.
The simulation results reveal that grain rotation induces an asymmetric distribution of elastic interaction energy, which in turn influences the preferred direction of hydride growth and leads to the development of an asymmetric and anisotropic hydride morphology. This morphological change also affects the magnitude and location of the maximum tensile and compressive stresses within the oxide film.
III.2 Simulation in the uranium bicrystal
So far, we have considered hydrogen-induced spot corrosion in the U monocrystal, whereas in the actual metal there are many grains separated by GBs. Experimental evidence suggests that initial hydride nucleation and rapid growth occur at GBs, resulting in the formation of intergranular corrosionscott2007ud3 ; banos2018review ; banos2016effect ; brierley2016anisotropic . Furthermore, the passage of hydrides through GBs induces interesting morphological transformationswang2019microstructure . Therefore, GBs play a critical role in the hydrogen-induced spot corrosion of actual metal materials. In this section, to isolate the interaction of multiple GBs, we investigate the behavior of hydride growth in a U bicrystal containing a pre-existing oxide film and a GB. We explore the infulence of the hydrogen-GB interaction strength () and the interaction between grain orientation and the GB on the corrosion morphology and stress in the U bicrystal.
III.2.1 Effect of GB on intergranular corrosion morphology
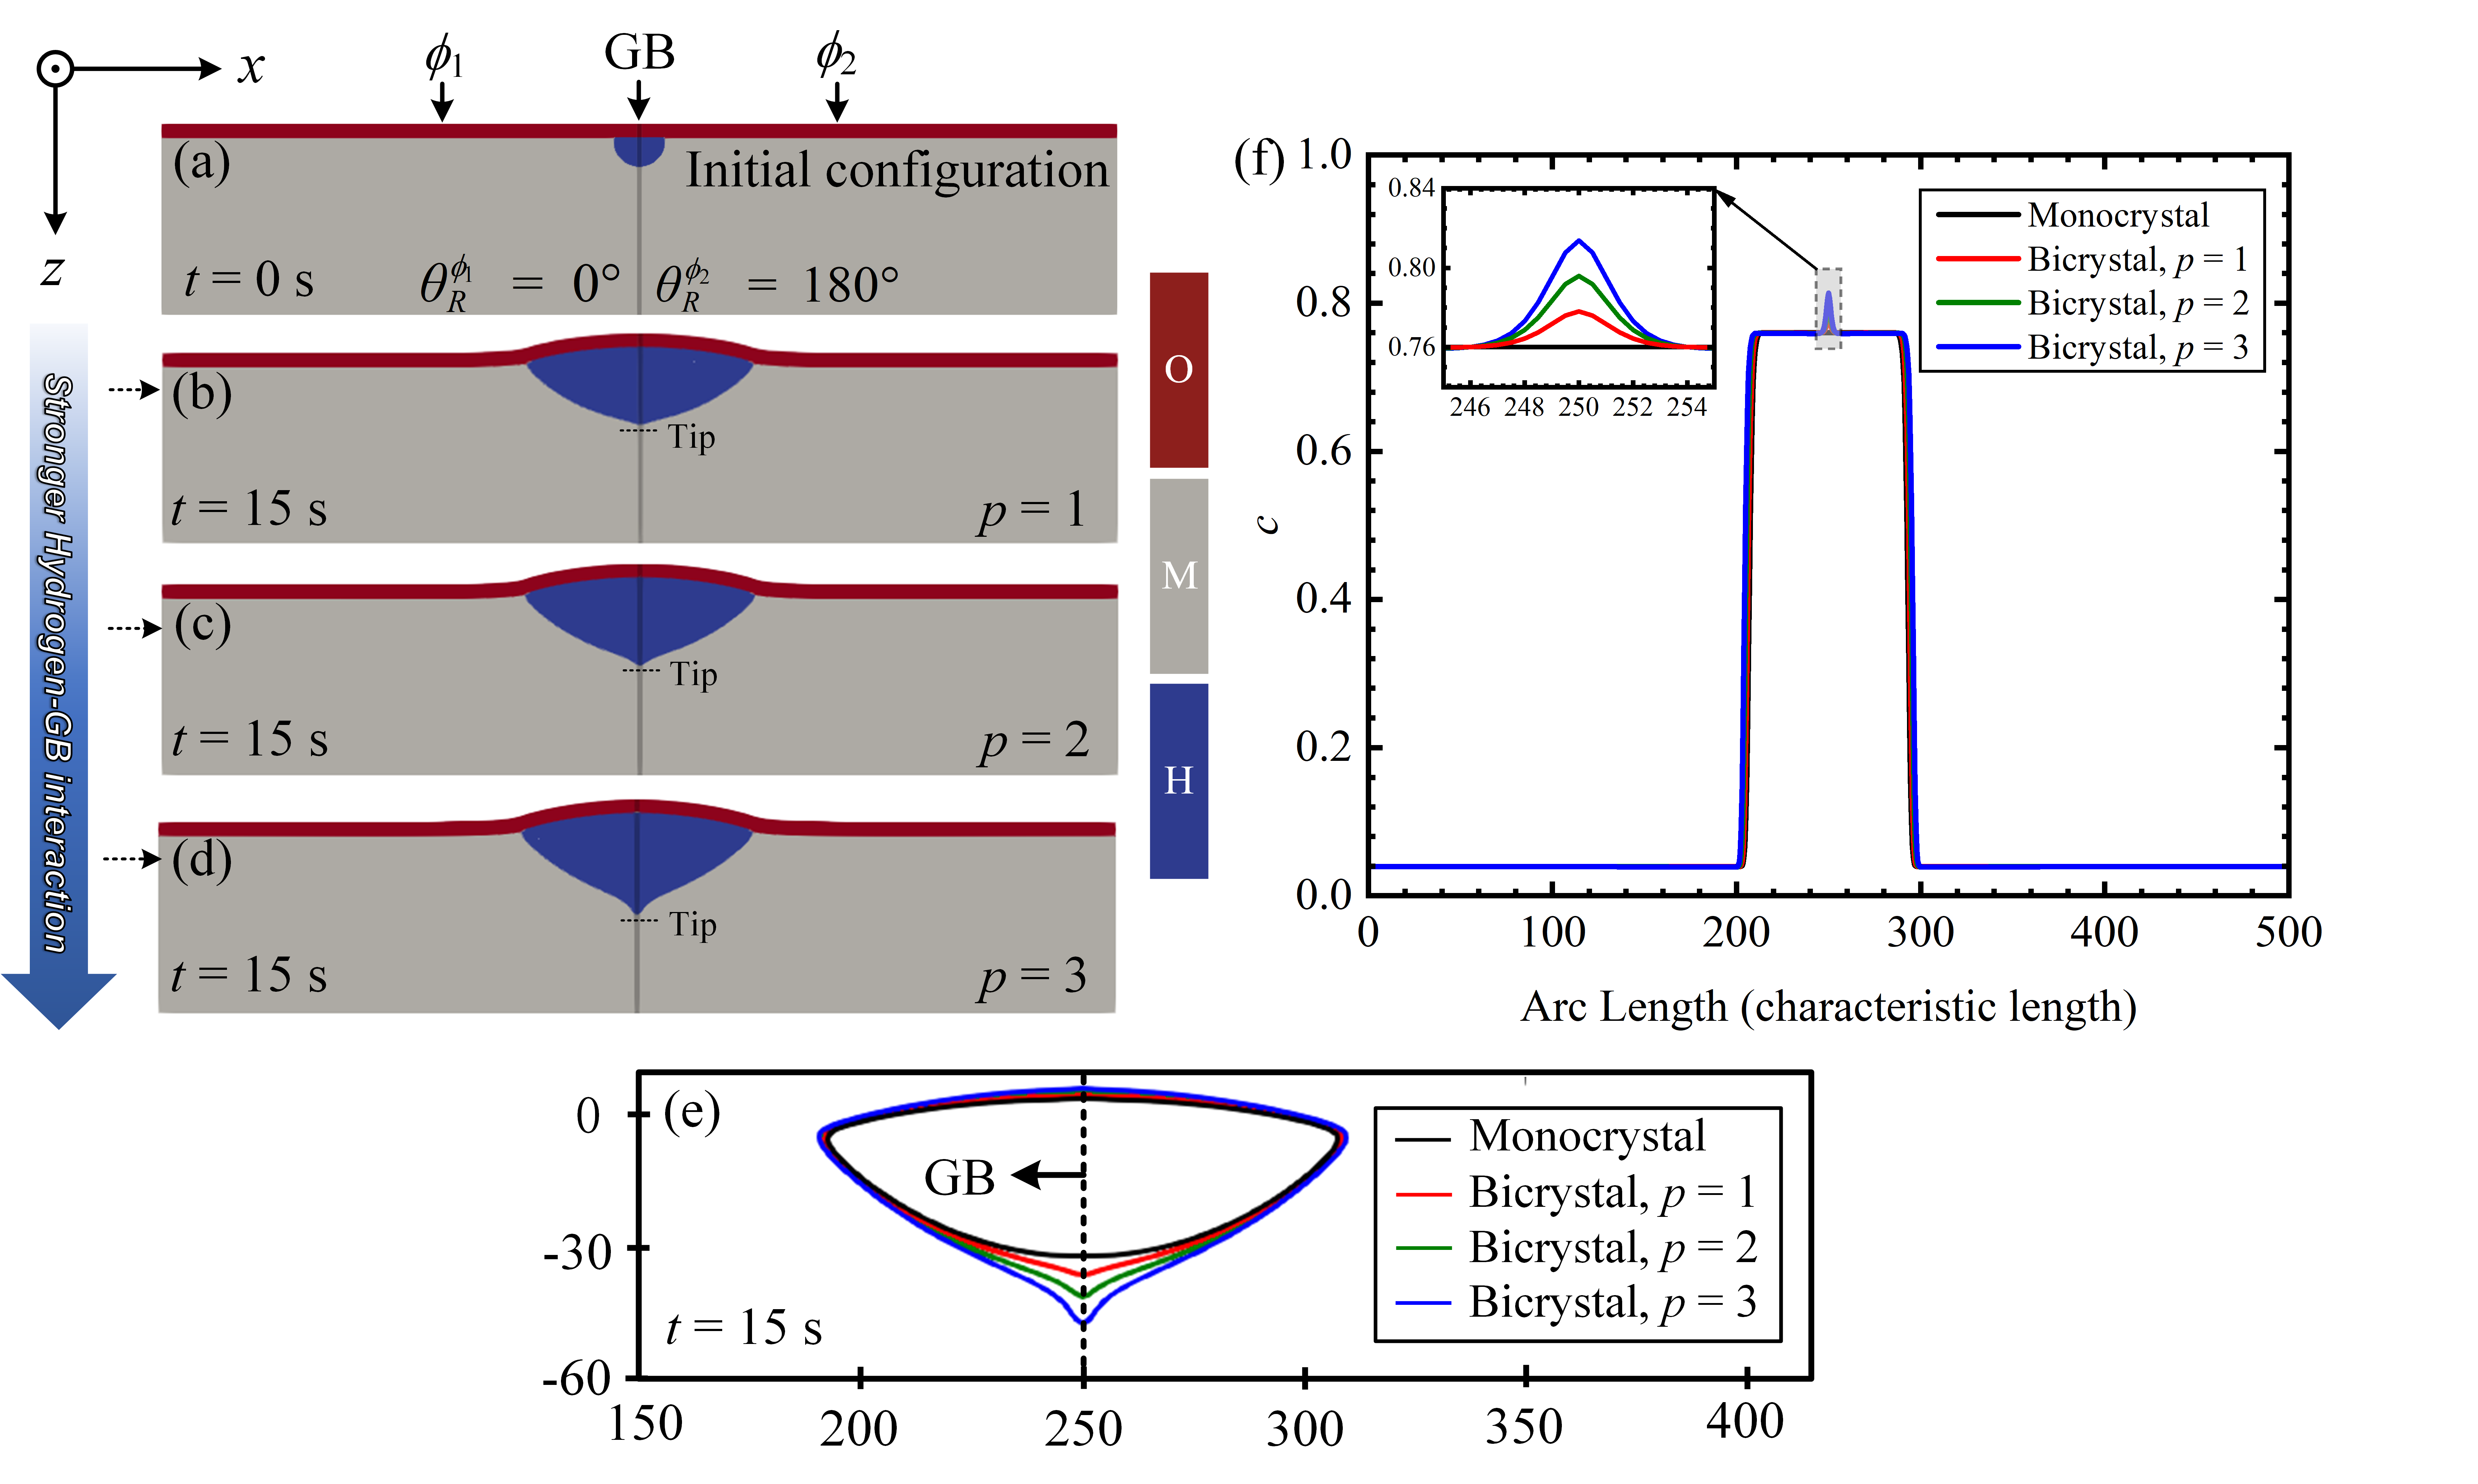
To study GB separately and exclude the interaction between grain orientation and GB, we adopt a method similar to that employed by Heo et al.heo2019phase . Specifically, the bicrystal system consists of two grains, denoted as and . We set the rotation angles of the two grains in the bicrystal as and , respectively. This approach allows us to investigate the effects of the GB independently on the intergranular corrosion behavior while minimizing the influence of grain orientation.
Fig. 10(a) illustrates the initial conditions of the bicrystal simulation, where a semicircle of initial intergranular hydride precipitation is placed at the GB between adjacent grains. Figs. 10(b)-(e) show the effect of the hydrogen-GB interaction parameter () on the intergranular corrosion morphology. The intergranular hydride precipitate in the bicrystal exhibits a distinctive “tip” morphology at the GB compared to that observed in the monocrystal. As the hydrogen-GB interaction becomes stronger, this “tip” feature becomes more pronounced. Fig. 10(f) displays the distribution of hydrogen concentration along the transverse section indicated by the dotted arrow in Fig. 10(b)-(d). The hydrogen concentration is enriched at the GB and exceeds the equilibrium concentration of the hydride inside the grain. In fact, this phenomenon of solute atoms deviating from the equilibrium concentration value inside the GB is called GB segregation. The interaction parameter is related to the GB segregation potential, which is determined by the GB energy variation with segregating hydrogen at a GB. A stronger hydrogen-GB interaction corresponds to a higher GB segregation potential.
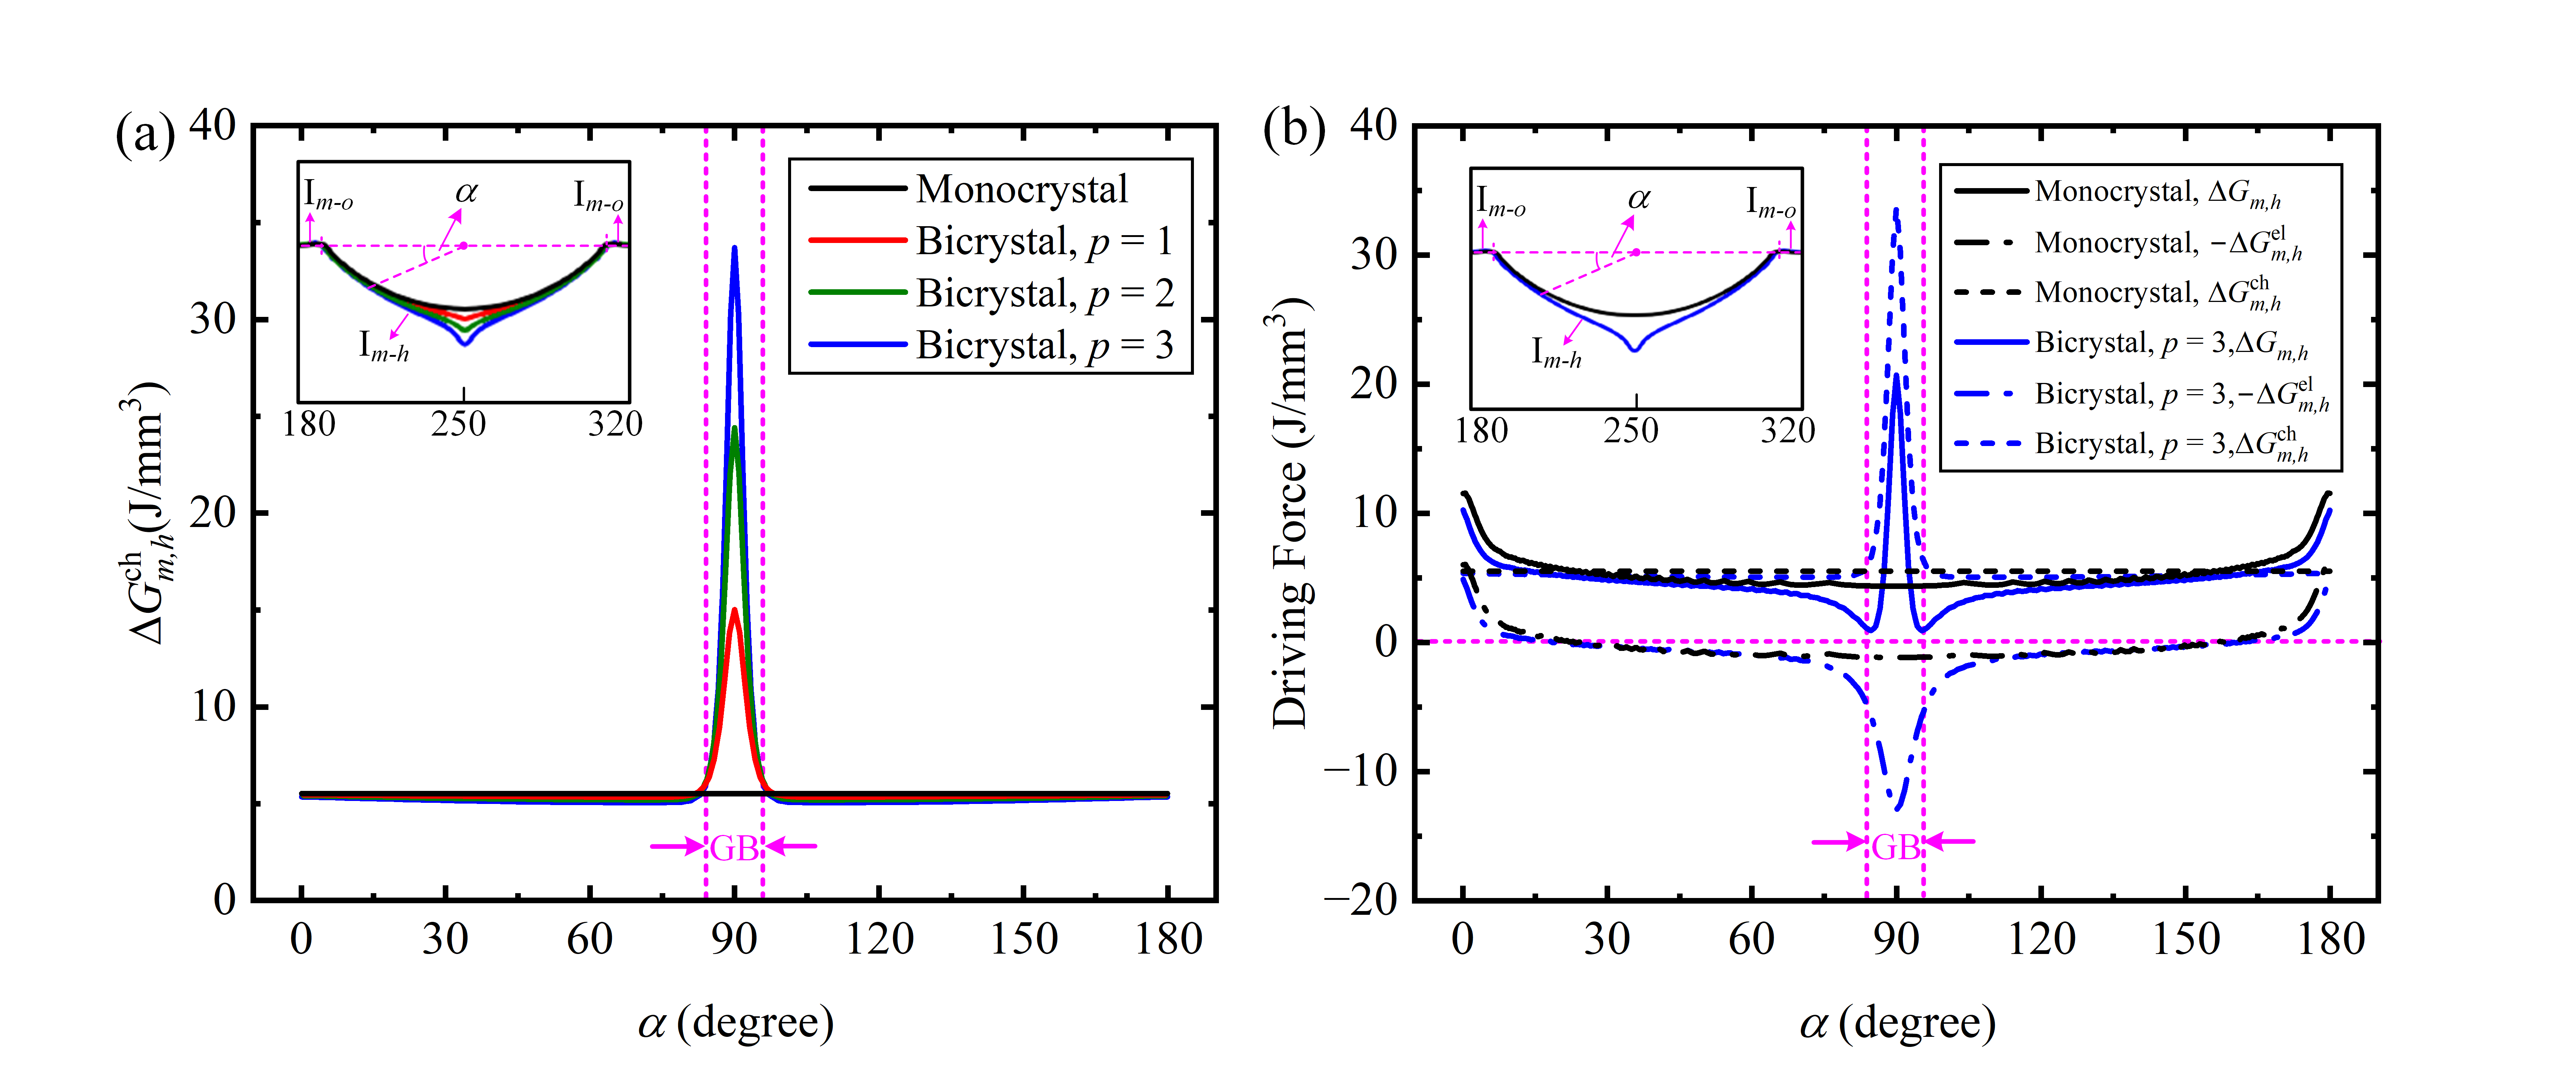
To determine the relationship between the formation of the distinctive “tip” morphology at GB and GB segregation, an analysis of the driving forces along the metal-hydride interface is conducted. We define an angle to describe the distribution of driving forces along the metal-hydride interface. Fig. 11(a) illustrates the effect of the hydrogen-GB interaction parameter on the chemical driving forces at s. The chemical driving force within the GB, induced by the GB segregation, is significantly higher than that inside the grain. Moreover, the chemical driving force within the GB increases with a stronger hydrogen-GB interaction (higher GB segregation potential). Fig. 11(b) shows the distribution of the chemical driving force , elastic interaction energy , and total driving force along the metal-hydride interface at s, comparing the bicrystal and monocrystal scenarios. The total driving force within the GB is higher than that within the grain, primarily due to the higher chemical driving force outweighing the elastic interaction energy, leading to the rapid hydride growth within the GB and the formation of the characteristic “tip” morphology.
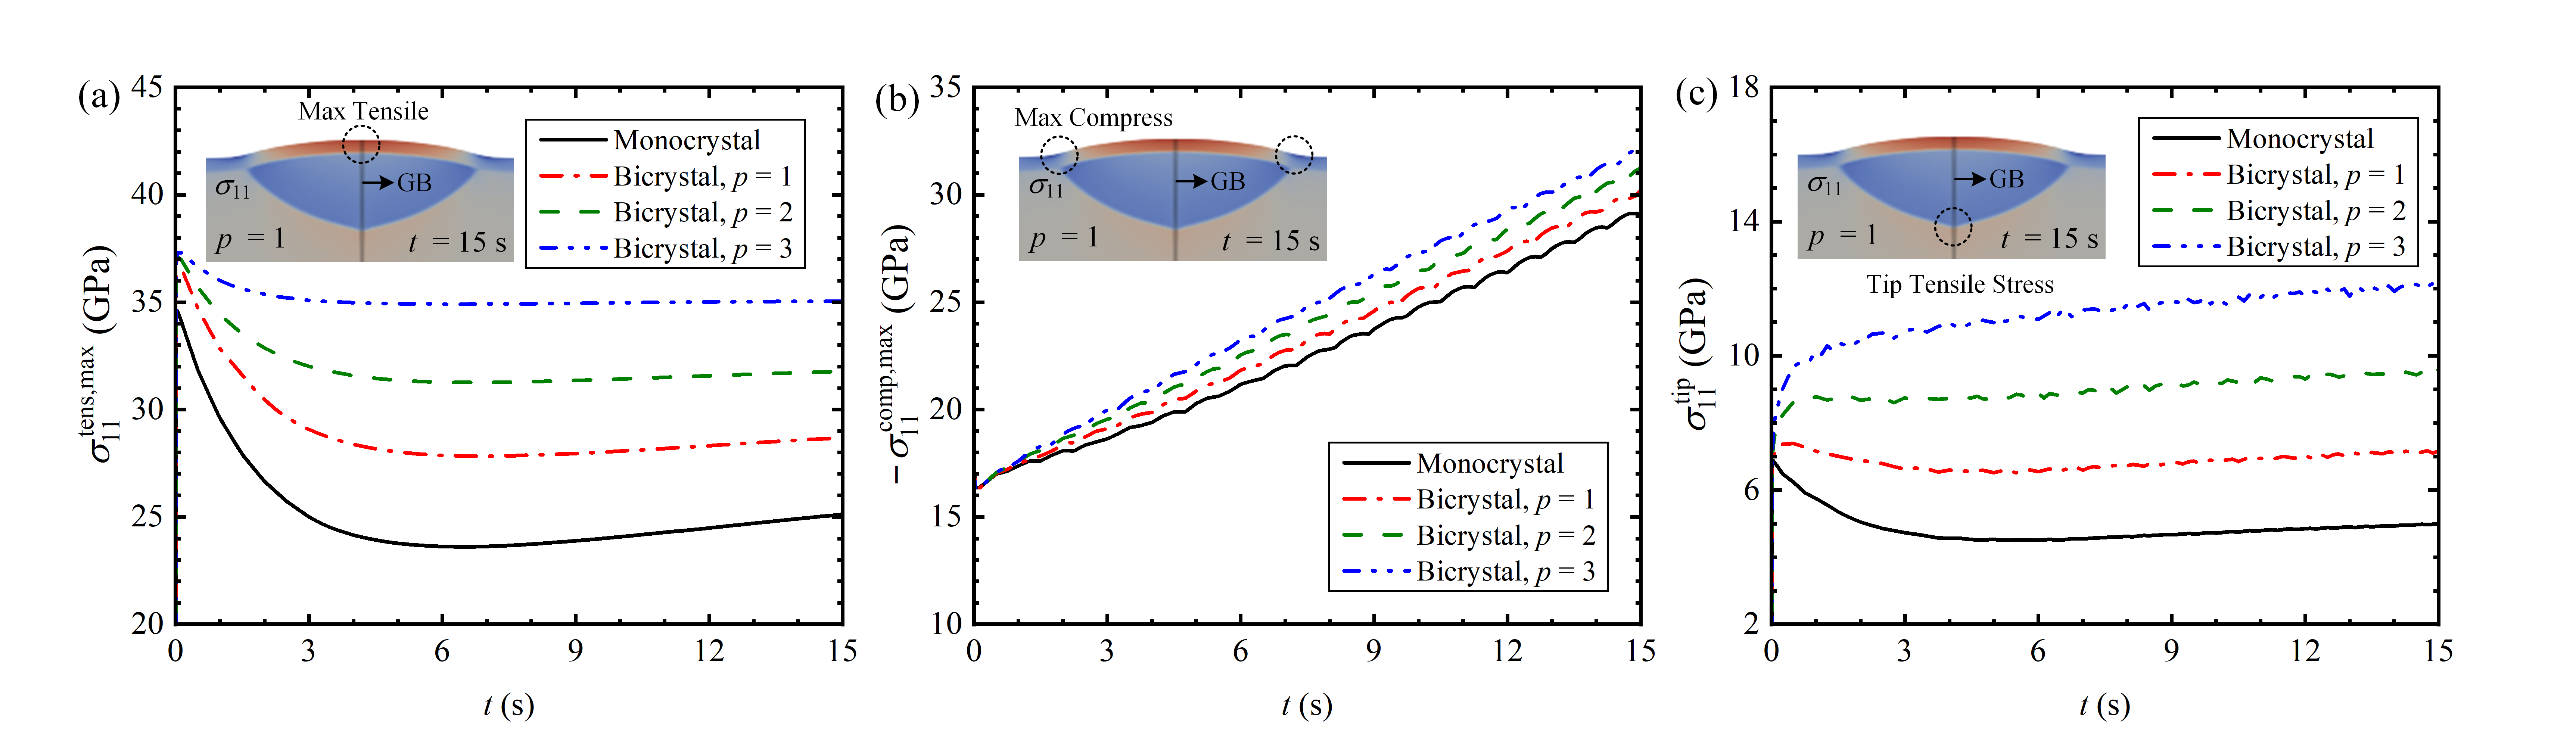
Figs. 12(a) and (b) depict the effect of the GB on the maximum tensile and compressive stresses within the oxide film, respectively. The introduction of GB increases the maximum tensile and compressive stresses within the oxide film. Moreover, a higher hydrogen-GB interaction parameter increases the maximum tensile stress. Higher interaction parameter values also imply enhanced disorder and mismatch within GBs, leading to increased stress concentration, especially within the GBs of the oxide film. Fig. 12(c) illustrates that the “tip” morphology enhances the concentration of tip tensile stress at the bottom of the intergranular hydride precipitate. In addition, experimental evidence suggests that hydride precipitates serve as preferred paths for metal crack growth due to their brittlenessbriottet2019industrial ; jones2013surface . Therefore, the concentration of tensile stress near the “tip” morphology may play a crucial role in the transition from intergranular spot corrosion to crack corrosion.
Briefly, these simulation results demonstrate that intergranular hydrides located at GBs exhibit a pronounced “tip” morphology. Furthermore, the presence of GB increases the maximum tensile and compressive stresses within the oxide film, while the “tip” morphology enhances the concentration of tensile stress at the bottom of the hydride precipitate. These results highlight the critical role of GB in the intergranular corrosion behavior.
III.2.2 Effect of the interaction between grain orientation and GB on intergranular corrosion morphology
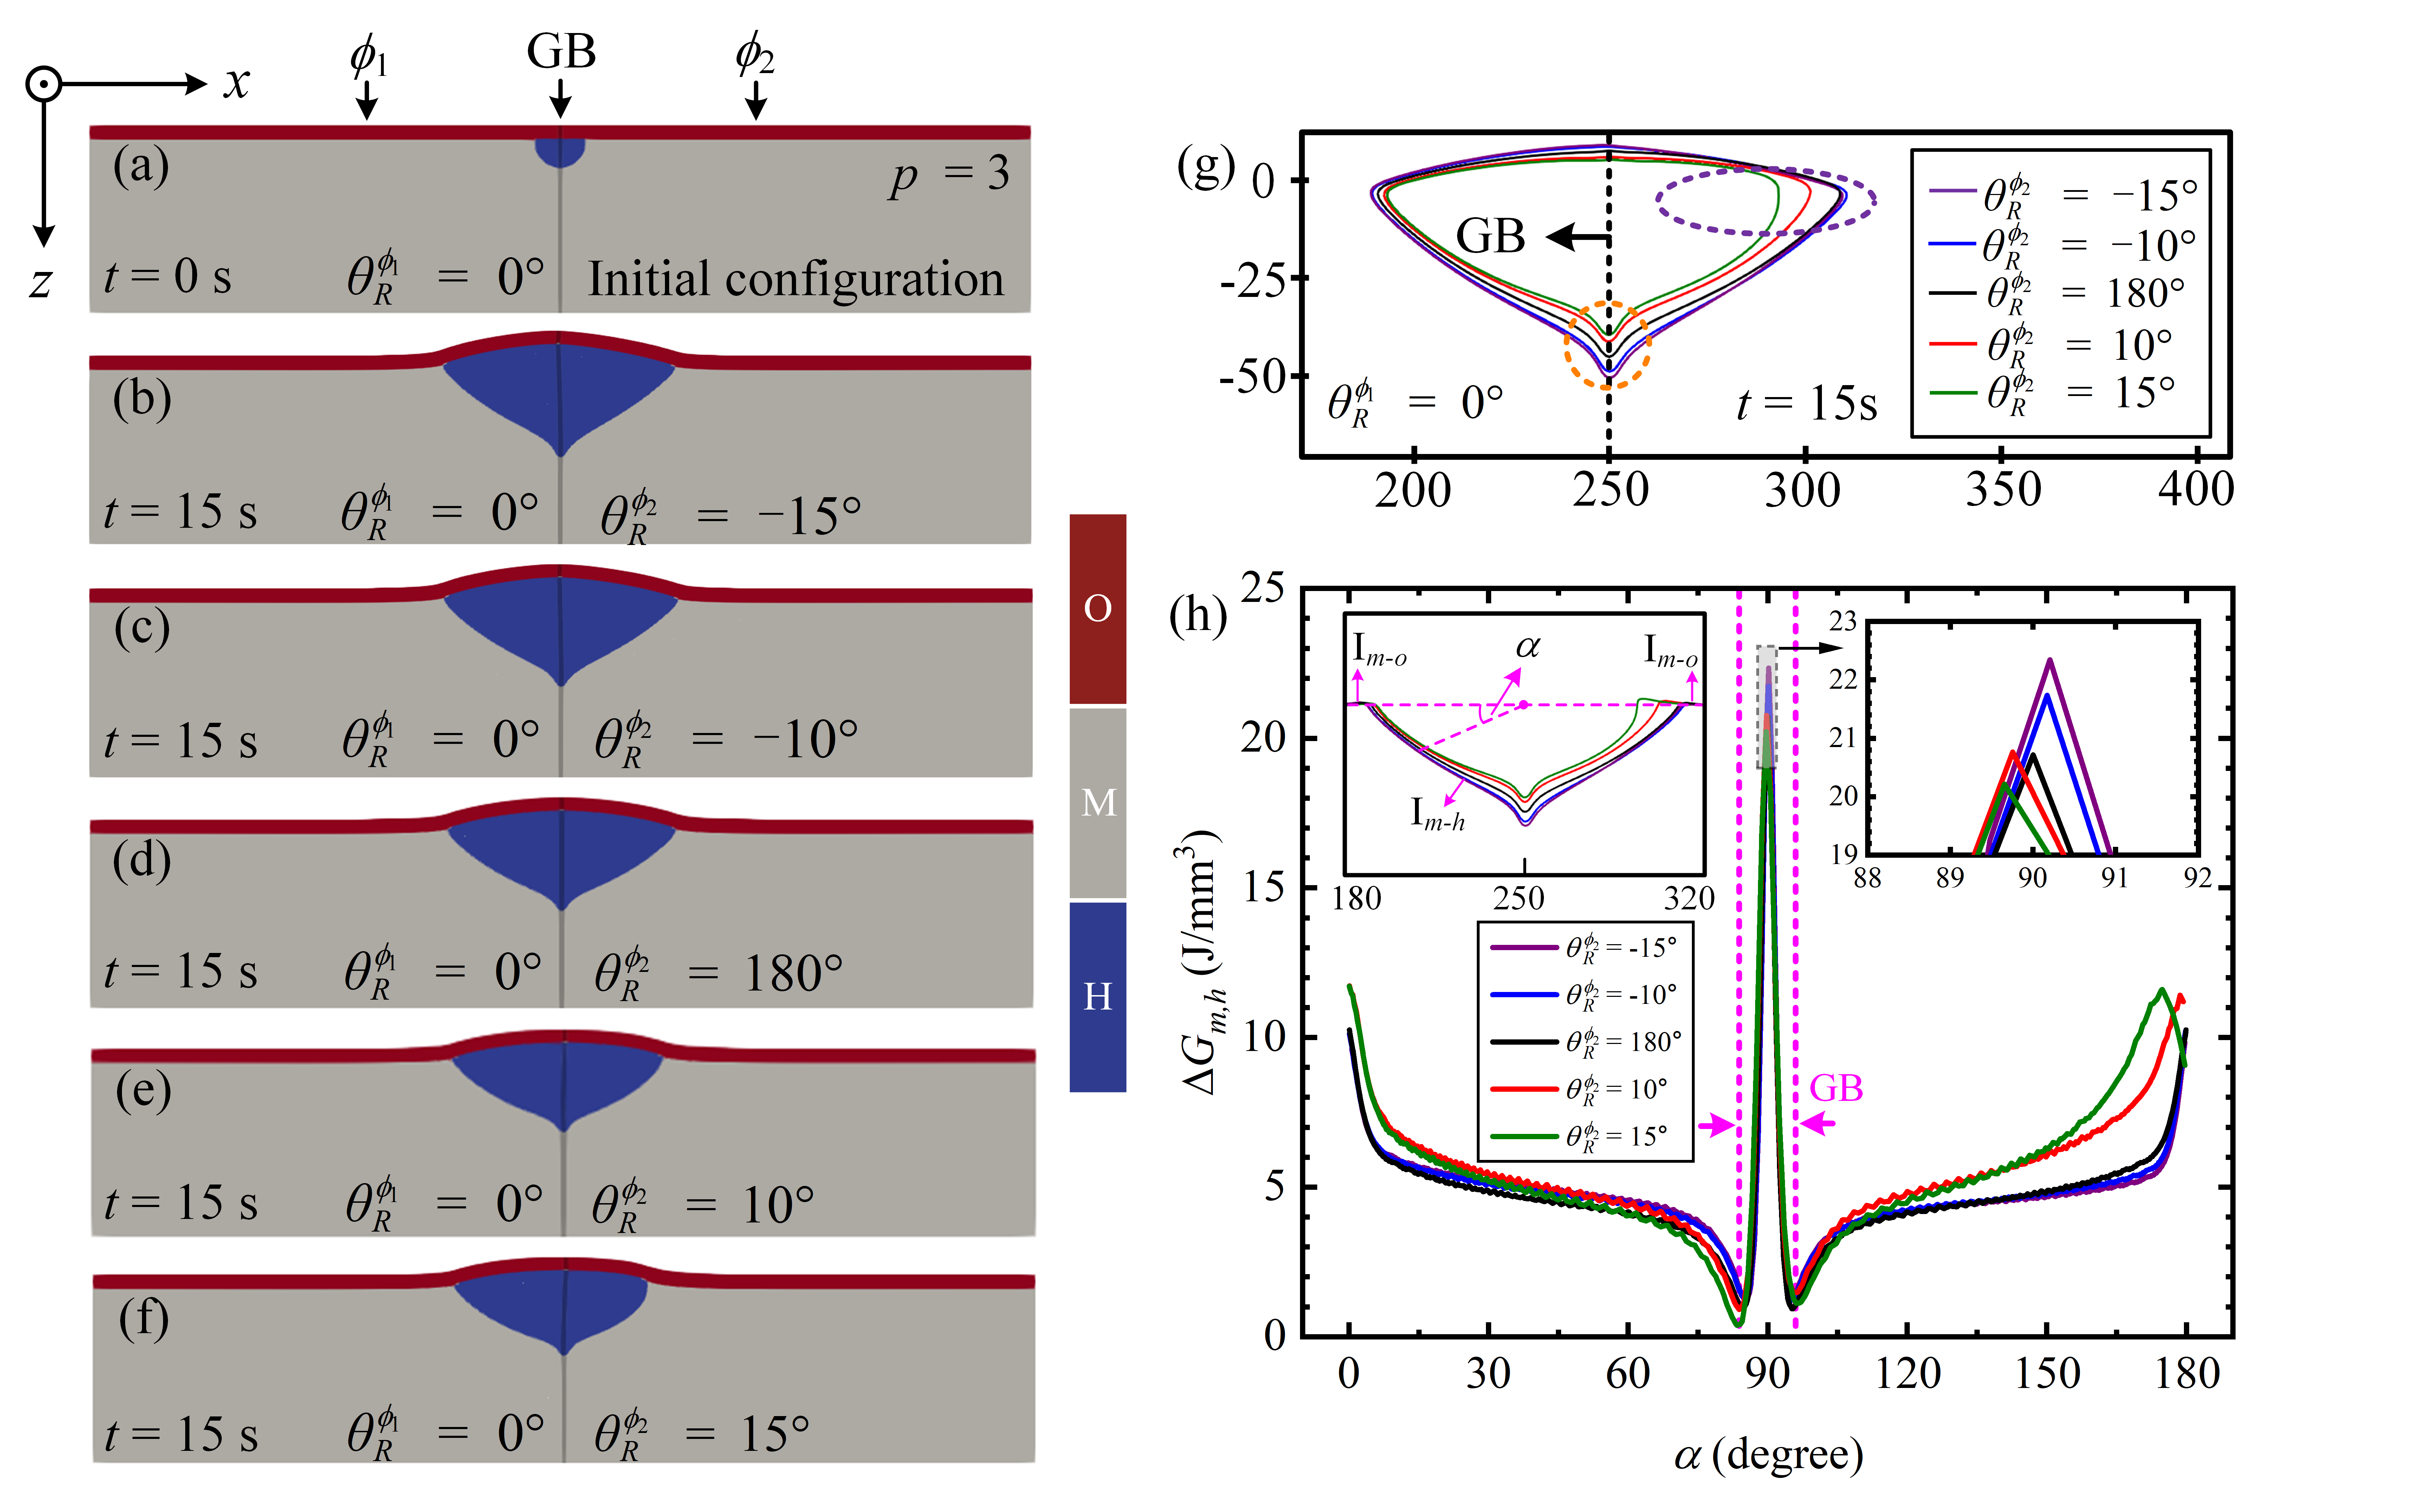
In the following simulation, we extended the investigation by adjusting the grain orientation to simulate the influence of the interaction between different grain orientations and GB on the intergranular hydride growth. In the bicrystal system, the rotation angle of grain remains constant, grain is rotated clockwise by different angles (). This approach allows for an examination of the effect of the interaction between grain orientation and GB on the intergranular corrosion behavior of the system.
Figs. 13(a)-(f) illustrate the effect of the interaction between different grain orientations and GB on the intergranular corrosion morphology. The corresponding hydride precipitate outlines for images (b)-(f) are displayed in Fig. 13(g). Two important features can be observed from the results: 1) The grain rotation changes the symmetry of the intergranular hydride morphology similar to the moncrystal case, as indicated by the purple dashed ellipse in Fig. 13(g); 2) The growth rate of intergranular hydrides inside the GB is accelerated for counterclockwise grain rotation () and decelerated for clockwise grain rotation (), as shown by the orange dashed circle in Fig. 13(f).
The formation of the two significant features mentioned above is attributed to the modification of the distribution of total driving forces along the metal-hydride interface induced by the grain orientation and its interaction with GB. We examine the distribution of the total driving force along the metal-hydride interface at s, as shown in Fig. 13(h). The angle is adopted as a variable to describe the distribution of driving forces along the interface. The rotation of grain leads to a distinct difference in the distribution of the total driving force along the metal-hydride interface within this grain compared to the adjacent grain . Consequently, an overall asymmetric distribution of the total driving force is formed along the metal-hydride interface, thereby resulting in the intergranular hydride exhibiting pronounced asymmetry. The asymmetry is particularly pronounced for the clockwise rotated grains (see Fig. 13(g)). Moreover, the interaction between grain orientation and GB adjusts the magnitude of the total driving force within the GB, as observed in the magnified view of Fig. 13(h). Counterclockwise grain rotation () leads to an increase in the total driving force at , amplifying the prominence of tip morphology. Conversely, when the grain rotates clockwise () at , the total driving force decreases, resulting in a slower growth rate of the tip morphology. These findings emphasize the significance of grain orientation and its interaction with GB in modifying the morphology of intergranular hydrides.
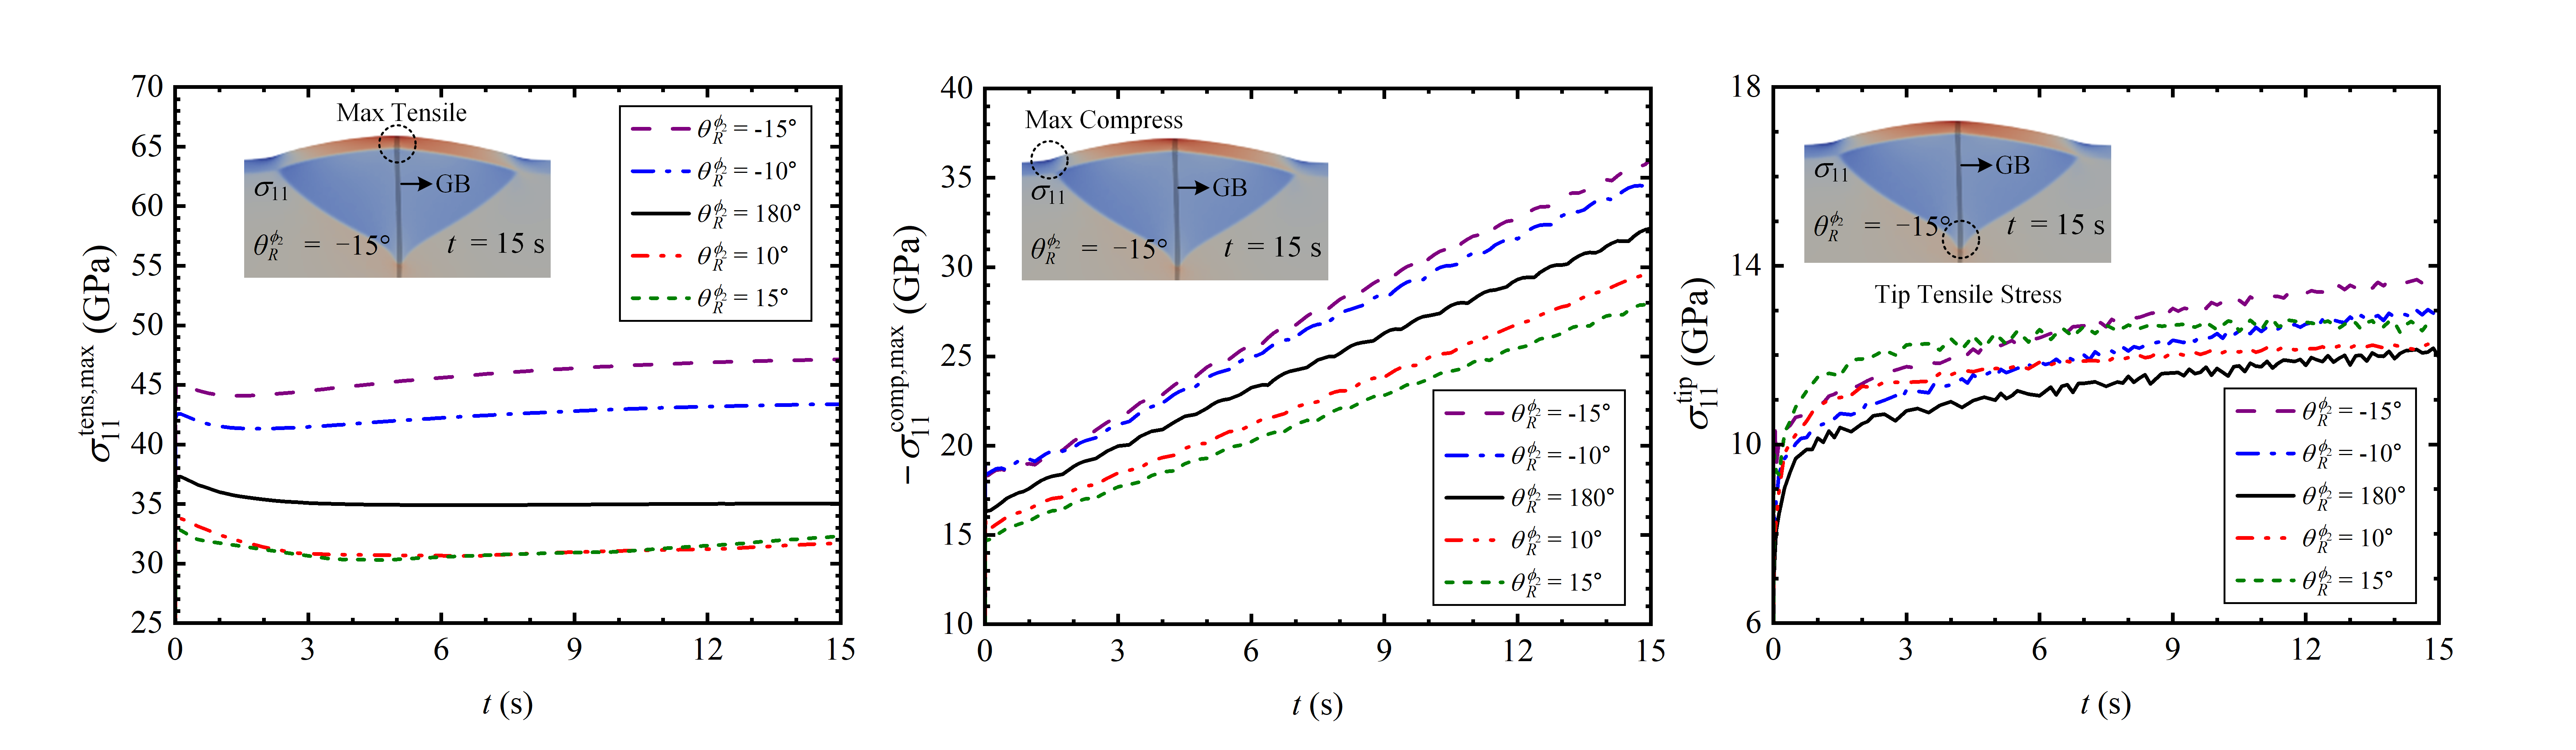
Fig. 14 shows the influence of the interaction between different grain orientations and GB on the stresses within the oxide film. This interaction leads to an increase in both the maximum tensile and compressive stresses for counterclockwise grain rotation (), while it decreases these stresses for clockwise grain rotation (). Additionally, the interaction results in an increase in the tip tensile stress within the metal. The increase in tip tensile stress caused by clockwise grain rotation is less than that caused by counterclockwise grain rotation.
From the results, the grain orientation and its interaction with the GB not only lead to the formation of asymmetric intergranular hydride morphology, but also affect the growth rate of hydrides inside the GB and the stresses in the oxide film. Counterclockwise grain rotation accelerates hydride growth at the GB and increases the tensile and compressive stresses, while clockwise grain rotation decelerates hydride growth and decreases these stresses. These observations highlight the important influence of the mismatch direction and angle between the grain orientations on the intergranular corrosion morphology and stress distribution, and provide valuable insights into the understanding of intergranular corrosion mechanisms.
| Grain | Rotation Angle |
|---|---|
| gr0 | |
| gr1 | |
| gr2 | |
| gr3 | |
| gr4 |
III.3 Simulation in the uranium polycrystal
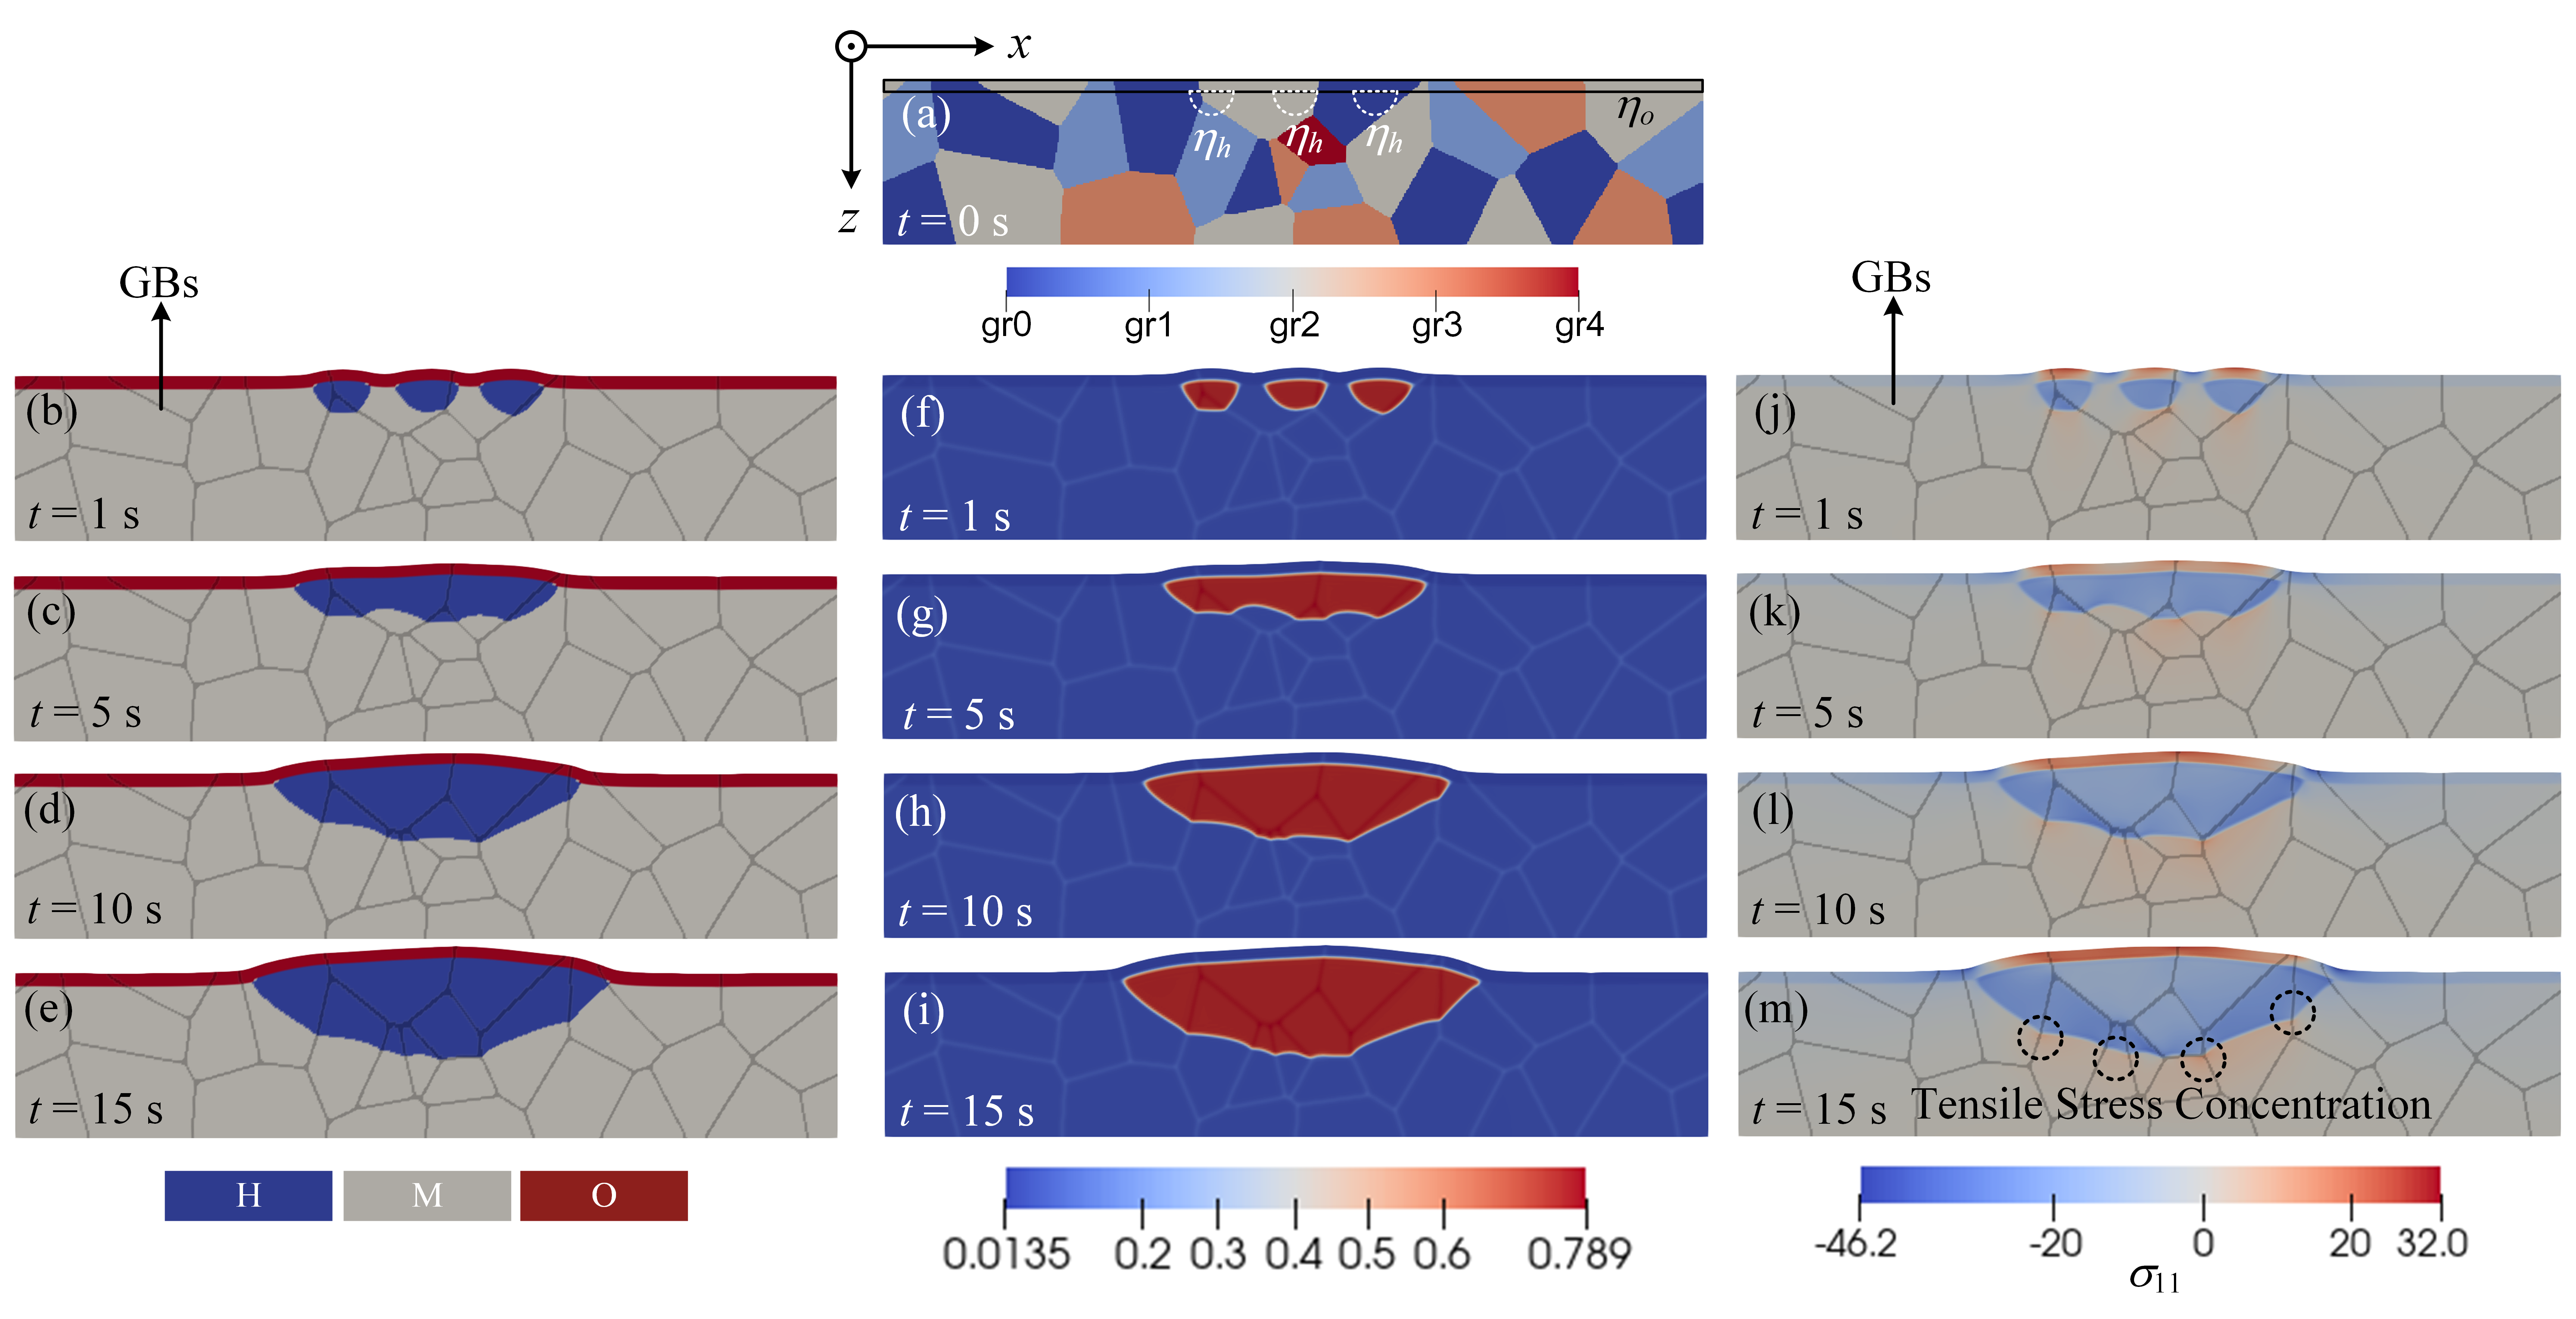
Finally, we perform more complex polycrystalline simulations that are closer to the real situation, and compare the corrosion degree and the material’s internal stresses in polycrystals with the bicrystal and monocrystal counterparts. For simplicity, the grain orientation of the compared monocrystal is , and the grain orientations of the compared bicrystal are and . The grain structure diagram shown in Fig. 15(a) is employed for the polycrystalline simulation, with the rotation angles specified for each grain in Table 2. At the beginning of the simulation, three identical semicircular initial hydride precipitates are positioned at the top of the U polycrystal. Note that the average grain size of the grain structure in our computational domain is smaller than that of realistic polycrystalline U metals. However, we also note that the generated grain structure is sufficient for the purpose of conducting demonstrative simulations as it encompasses all the key physical factors discussed above.
The evolution of the multi-spot corrosion morphology within the U polycrystal is demonstrated in Figs. 15(b)-(e). The increased number of GBs and grain orientations contribute to the emergence of more “tip” and irregular morphology, which is close to the real corrosion morphology in the experimentsbrierley2016anisotropic ; ji2019mechanism . These “tip” morphologies emerge as a result of the enhanced chemical driving force induced by GB segregation at the GBs, as illustrated in Figs. 15(f)-(i). In addition, Figs. 15(j)-(m) display the monitoring of internal stress during multi-spot corrosion. The presence of more “tips” creates more tensile stress concentrations in the metal matrix, while the irregular bulge of the oxide film results in multiple tensile stress concentration locations within the oxide film. These stresses may play a critical role in the degradation and eventual fracture of the oxide film at multiple local locations, ultimately culminating in the overall exfoliation of the oxide film.
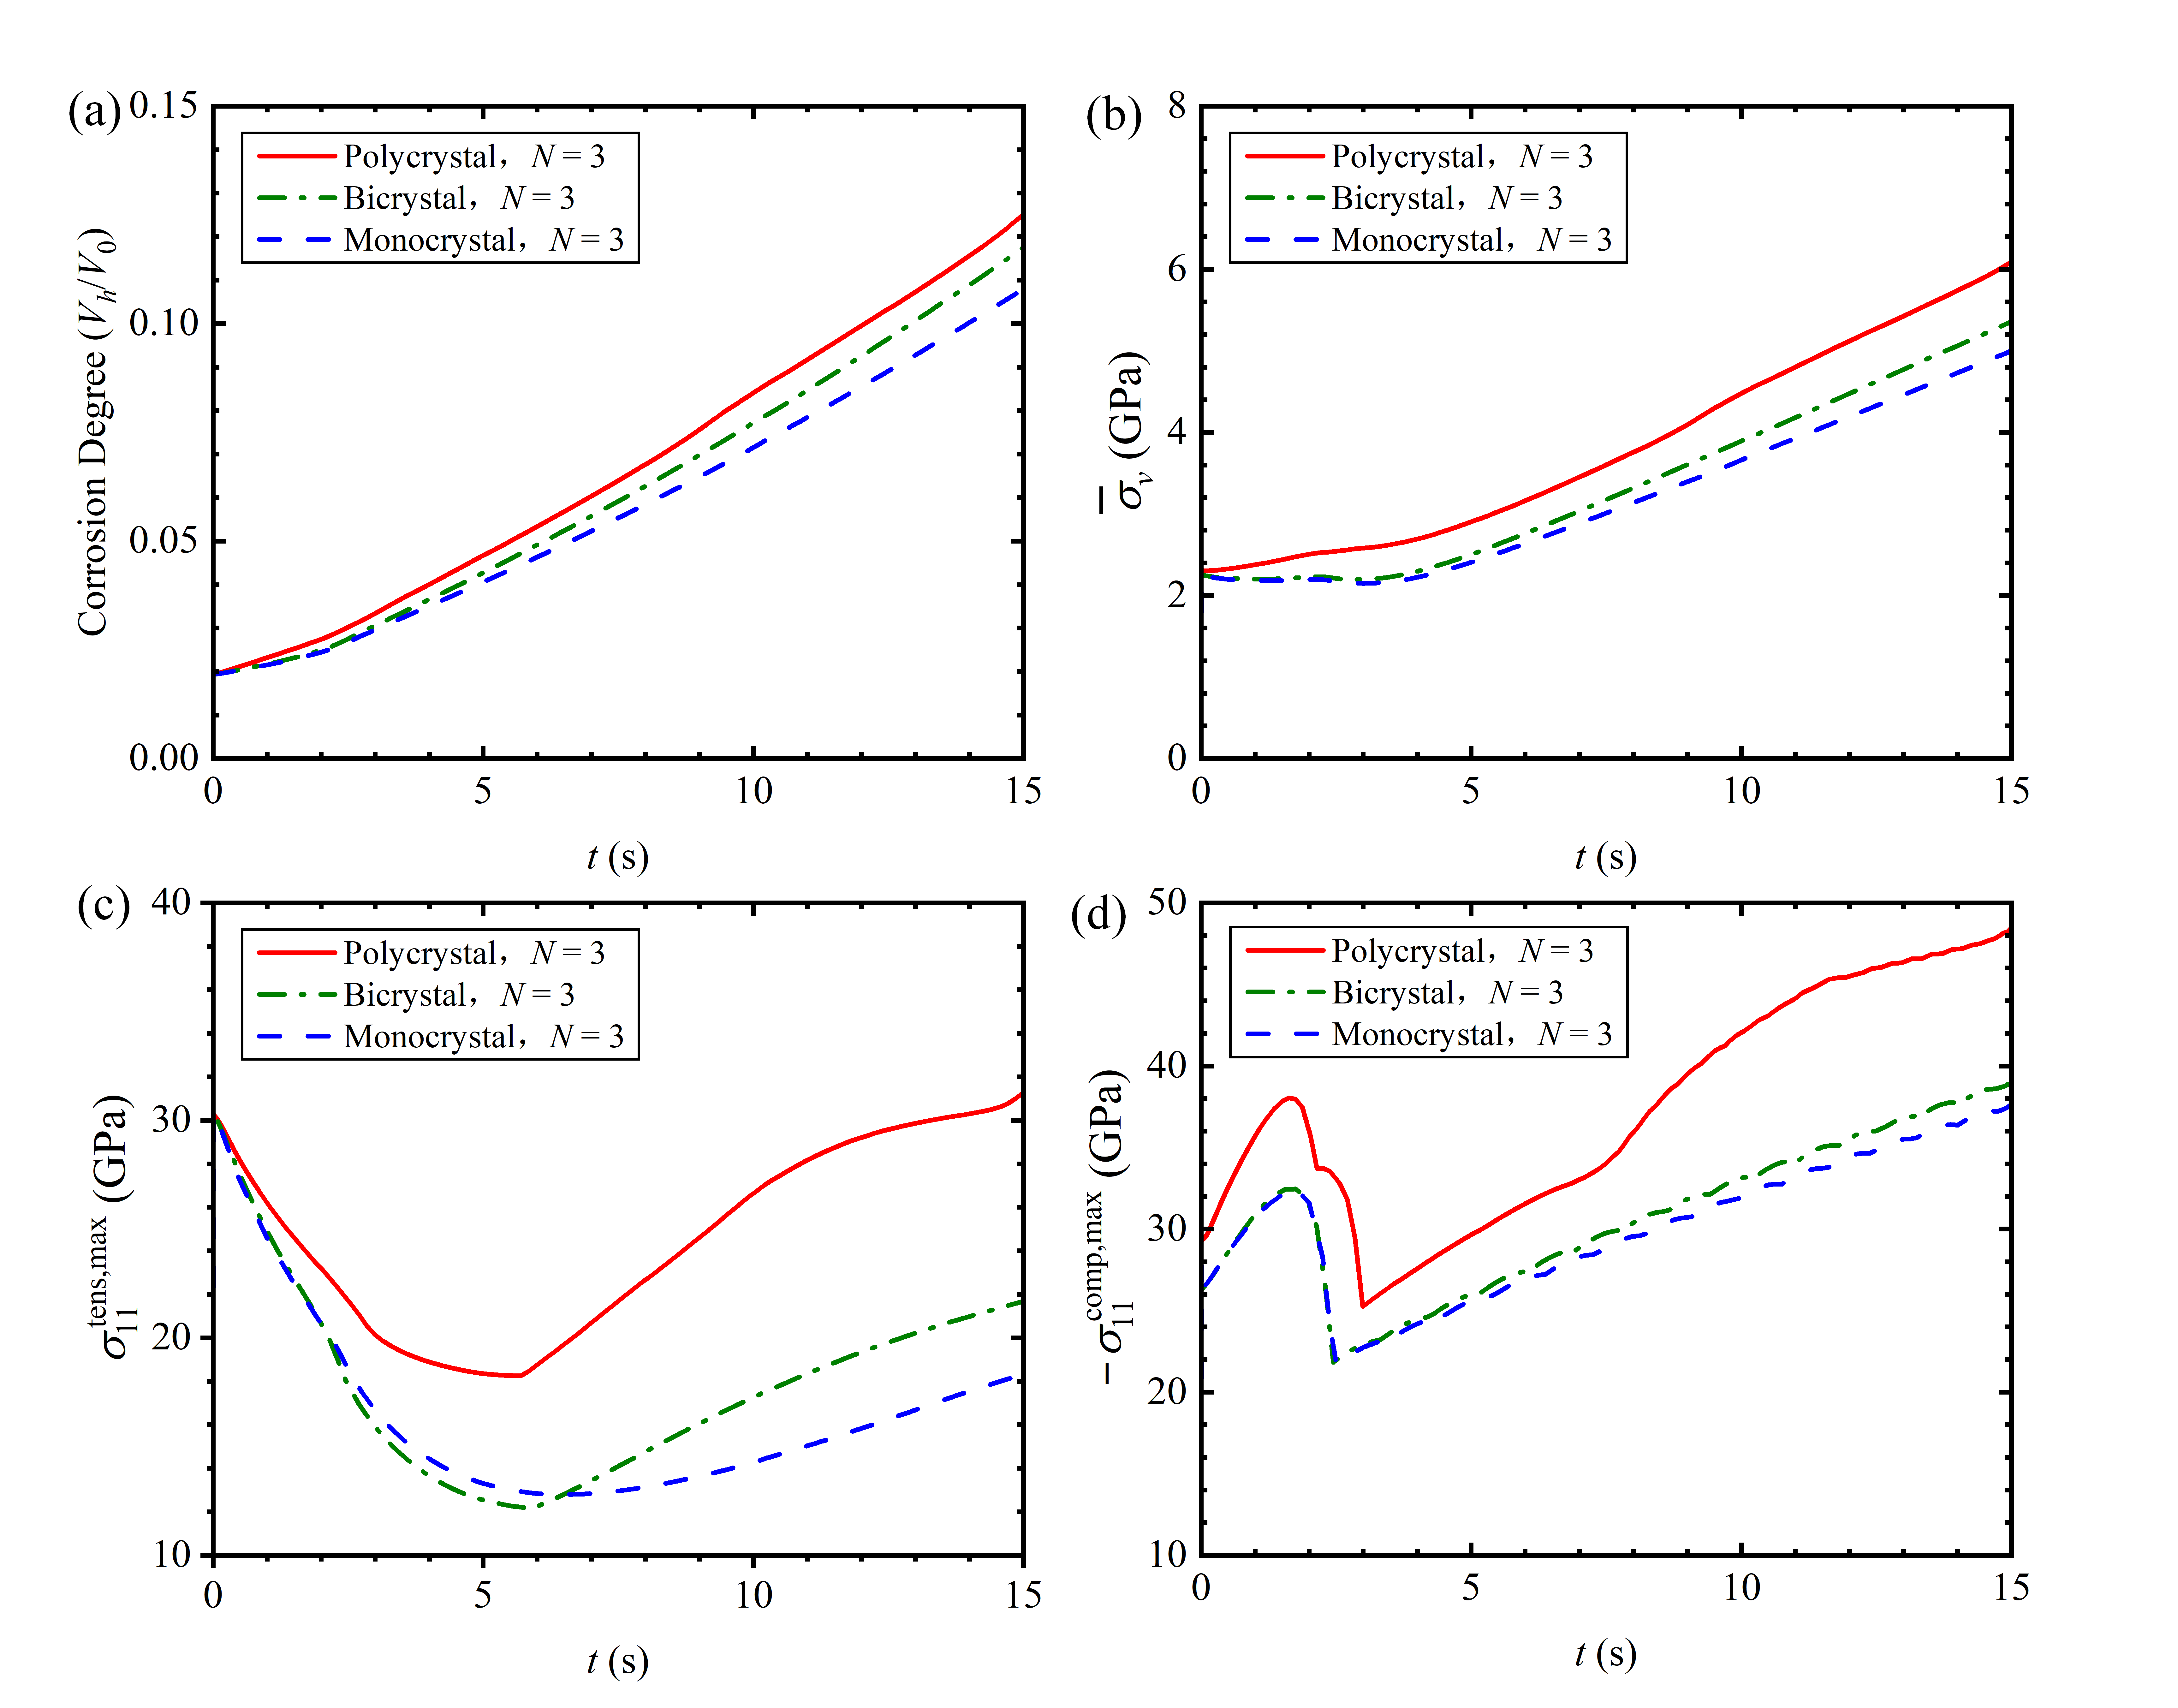
The variation of the corrosion degree and the volume average von Mises stress of the system as a function of time are illustrated in Figs. 16(a) and (b), respectively. The calculated corrosion degree and the volume average von Mises stress in the polycrystalline system are higher than those in the bicrystal and monocrystal cases. This disparity can be attributed to the presence of a large number of GBs and diverse grain orientations in the polycrystal, which accelerate the corrosion process. Figs. 16(c) and (d) provide detailed information on the maximum tensile and compressive stresses in the oxide film as a function of time, respectively. The oxide film in the polycrystal exhibits higher stresses compared to the monocrystal and bicrystal cases, which may increase the fracture susceptibility of the oxide film in the polycrystal. This phenomenon is attributed to the irregular bulge of the oxide film induced by the multiple grain orientations. The irregular bulge increase the stress level within the oxide film, resulting in intensified stress concentration near the GBs within the oxide film. These findings highlight the role of complex microstructures in determining the stress evolution during corrosion and the corrosion behavior in polycrystalline materials.
Our simulations successfully reproduced intricate and irregular spot morphologies and captured the dynamic stress changes within the materials. These results demonstrate the comprehensiveness and effectiveness of our MPF model in addressing complex corrosion phenomena.
IV Conclusion
In conclusion, we develop a comprehensive MPF model incorporating i) hydrogen diffusion, ii) phase transformations, iii) elastic interactions between phases, iv) elastic interactions between grains, and v) interactions between hydrogen solutes and GBs for simulating hydrogen-induced spot corrosion in the rare metal surface. This MPF model can address the limitations of conventional PF models by introducing the oxide film phase, resulting in more accurate and realistic hydride morphologies with sharp edges, which aligns well with experimental observations. Moreover, this MPF model also includes multiple grains and GBs, allowing for the simulation of multi-spot corrosion in polycrystals with complex textures to obtain an irregular corrosion morphology that is closer to the real situation. Our MPF model provides a valuable tool for studying the complex hydrogen-induced spot corrosion behavior, contributing to a better understanding of the corrosion process in practical materials.
We apply the model to the study of hydrogen-induced spot corrosion in the U metal surface with a pre-existing oxide film, and systematically investigate the microscopic mechanisms affecting the spot corrosion morphology and the internal stress state of materials. In the monocrystalline system, we investigate the effects of oxide film thickness, merging of corrosion spots, and grain orientation on the corrosion morphology and stress.
1) It was observed that a thick oxide film slows down the hydride growth, reduces the tensile stress in the center of the oxide film, and reduces compressive stress in the film near the edge of the hydride. This is attributed to the lower elastic energy and higher deformation resistance of the thick oxide film.
2) Negative elastic interaction between adjacent corrosion spots leads to the merging of corrosion spots, which reduces the maximum tensile stress in the oxide film and releases compressive stress between adjacent spots.
3) Grain rotation influences the preferred growth direction of hydrides, with lateral growth inhibited near the oxide-hydride interface, resulting in a shift of the maximum stress point from the center of the oxide film to the inhibition point. This is attributed to the effect of grain rotation on the elastic interaction energy distribution.
In the bicrystal study, we investigated the effects of GB and multiple grain orientations on the intergranular corrosion morphology and internal stresses.
1) We observed the enrichment of the hydrogen concentration at the GB, producing the GB segregation. As a result, the intergranular hydride grows rapidly along the GB, forming a “tip” morphology at the GB.
2) Grain orientation and its interaction with the GB induce the formation of asymmetric intergranular hydride and influence the hydride growth rate insdie the GB. In addition, this interaction increases the tensile and compressive stresses in the oxide film for counterclockwise grain rotation, while slowing the growth rate and decreasing these stresses for clockwise grain rotation.
Finally, in the polycrystalline study, we consider the comprehensive effects of these phenomena and factors. The results demonstrate that the complex and irregular morphology in polycrystalline materials leads to higher stress levels and corrosion degree compared to the monocrystal and bicrystal cases. This is attributed to the presence of a large number of GBs and diverse grain orientations in polycrystals. These findings emphasize the role of complex microstructures in determining stress and corrosion behavior in polycrystalline materials.
These obtained results serve to validate the efficacy and accuracy of the MPF model within the hydrogen-induced spot corrosion, offering potential applications in corrosion mitigation and control strategies. However, the current MPF model primarily focuses on the corrosion morphology and stress distribution in the early growth stage of hydrogen-induced spot corrosion, without explicitly considering the plastic strain of metal and fracture process of the oxide film during the corrosion process. To fully capture the metal plasticity and fracture behavior of the oxide film for extending the model to the oxide cracking stage of hydrogen-induced spot corrosion, the metal plastic hardening and dynamic fracture mechanisms of the oxide film can be considered into the MPF model in future studies.
V Acknowledgement
We thank Yuan-Ji Xu, Xing-Yu Gao, Dan Jian, Li-Fang Wang and Le Zhang for the help with basic knowledge and properties of uranium. We thank Chao Yang and Guo-Min Han for the help in the method of modeling. We thank Bei-Lei Liu, Kai-Le Chen, Ji-De Zou, Yu Song for helpful discussions. The work is supported by the National Key R&D Program of China (No. 2021YFB3501503), the National Natural Science Foundation of China (No. 12004048), the Science Challenge Project (No. TZ2018002) and the Foundation of LCP. We thank the Tianhe platforms at the National Supercomputer Center in Tianjin.
VI Author Contributions
H.-F. Song and Y. Liu conceived and supervised the project. J. Sheng performed the numerical simulations. All authors analyzed and discussed the results. J. Sheng, Y. Liu, X.-M. Shi, Y.-C. Wang and H.-F. Song wrote the manuscript, with contributions from all the authors.
VII Data availability
The data that support the findings of this study are available from the corresponding author upon reasonable request. The copyright of the experimental images has been applied for on the corresponding journal website.
References
- (1) E. McCafferty, Introduction to corrosion science, Springer Science & Business Media, 2010.
- (2) Z. Szklarska-Smialowska, Review of literature on pitting corrosion published since 1960, Corrosion 27 (6) (1971) 223–233.
- (3) G. Frankel, Pitting corrosion of metals: a review of the critical factors, Journal of the Electrochemical society 145 (6) (1998) 2186.
- (4) J. P. Knowles, G. Rule, M. Brierley, The morphology and anisotropic growth kinetics of cerium hydride reaction sites, Corrosion science 77 (2013) 31–36.
- (5) M. Brierley, J. Knowles, N. Montgomery, M. Preuss, Microstructure of surface cerium hydride growth sites, Journal of Vacuum Science & Technology A: Vacuum, Surfaces, and Films 32 (3) (2014) 031402.
- (6) M. Brierley, J. Knowles, Probing the cerium/cerium hydride interface using nanoindentation, Journal of Alloys and Compounds 645 (2015) S148–S151.
- (7) M. Brill, J. Bloch, M. Mintz, Effects of pre-dissolved hydrogen on the precipitation and growth kinetics of gadolinium hydride on polycrystalline gadolinium surfaces, Journal of alloys and compounds 330 (2002) 492–497.
- (8) G. Benamar, D. Schweke, J. Bloch, T. Livneh, M. Mintz, The very initial stage of hydride formation on polycrystalline gadolinium, Journal of alloys and compounds 477 (1-2) (2009) 188–192.
- (9) G. Benamar, D. Schweke, N. Shamir, S. Zalkind, T. Livneh, A. Danon, G. Kimmel, M. Mintz, Heat pretreatment-induced activation of gadolinium surfaces towards the initial precipitation of hydrides, Journal of alloys and compounds 498 (1) (2010) 26–29.
- (10) J. Bloch, M. H. Mintz, Types of hydride phase development in bulk uranium and holmium, Journal of Nuclear Materials 110 (2-3) (1982) 251–255.
- (11) J. Bloch, The hydriding kinetics of bulk metallic holmium under 1 bar H2 and below 570 K, Journal of alloys and compounds 465 (1-2) (2008) 190–196.
- (12) J. M. Haschke, T. H. Allen, L. A. Morales, Surface and corrosion chemistry of plutonium, Los Alamos Sci 26 (2) (2000) 252–273.
- (13) M. Brierley, J. P. Knowles, A. Sherry, M. Preuss, The anisotropic growth morphology and microstructure of plutonium hydride reaction sites, Journal of Nuclear Materials 469 (2016) 145–152.
- (14) G. W. McGillivray, J. P. Knowles, I. M. Findlay, M. J. Dawes, The plutonium/hydrogen reaction: The pressure dependence of reaction initiation time and nucleation rate controlled by a plutonium dioxide over-layer, Journal of nuclear materials 412 (1) (2011) 35–40.
- (15) L. Owen, R. Scudamore, A microscope study of the initiation of the hydrogen-uranium reaction, Corrosion Science 6 (11-12) (1966) 461–468.
- (16) J. Bingert, R. Hanrahan Jr, R. Field, P. Dickerson, Microtextural investigation of hydrided -uranium, Journal of alloys and compounds 365 (1-2) (2004) 138–148.
- (17) M. Hill, R. Schulze, J. Bingert, R. Field, R. McCabe, P. Papin, Filiform-mode hydride corrosion of uranium surfaces, Journal of nuclear materials 442 (1-3) (2013) 106–115.
- (18) C. P. Jones, T. B. Scott, J. R. Petherbridge, J. Glascott, A surface science study of the initial stages of hydrogen corrosion on uranium metal and the role played by grain microstructure, Solid State Ionics 231 (2013) 81–86.
- (19) C. Stitt, C. Paraskevoulakos, N. Harker, C. Jones, T. Scott, The effects of metal surface geometry on the formation of uranium hydride, Corrosion Science 98 (2015) 63–71.
- (20) A. Banos, C. Stitt, T. Scott, The effect of sample preparation on uranium hydriding, Corrosion Science 113 (2016) 91–103.
- (21) O. Appel, L. Rogel, E. Malka, Y. Levy, S. Zalkind, R. Shneck, M. Mintz, The influence of external stress/strain on the uranium-hydrogen reaction, Journal of Nuclear Materials 510 (2018) 123–130.
- (22) A. Banos, N. Harker, T. Scott, A review of uranium corrosion by hydrogen and the formation of uranium hydride, Corrosion Science 136 (2018) 129–147.
- (23) A. Banos, K. Hallam, T. Scott, Corrosion of uranium in liquid water under vacuum contained conditions. Part 1: The initial binary U H2O(l) system, Corrosion Science 152 (2019) 249–260.
- (24) A. Banos, K. Hallam, T. Scott, Corrosion of uranium in liquid water under contained conditions with a headspace deuterium overpressure. Part 2: The ternary U H2O D2 system, Corrosion Science 152 (2019) 261–270.
- (25) H. Ji, H. Wu, Q. Pan, D. Cai, X. Meng, X. Chen, P. Shi, X. Wang, Mechanism of surface uranium hydride formation during corrosion of uranium, npj Materials Degradation 3 (1) (2019) 9.
- (26) A. Banos, T. Scott, The kinetics and mechanism of the uranium hydride-water vapour system under ambient conditions, Scientific Reports 10 (1) (2020) 1–12.
- (27) W. L. Korst, J. C. Warf, Rare earth-hydrogen systems. I. Structural and thermodynamic properties, Inorganic Chemistry 5 (10) (1966) 1719–1726.
- (28) M. Mintz, Z. Hadari, M. Bixon, Phase transformations in some rare earth-hydrogen systems, Journal of the Less Common Metals 37 (3) (1974) 331–335.
- (29) J. Sheng, Y.-C. Wang, Y. Liu, S. Wu, K. Xu, Z.-H. Chen, B. Sun, H.-F. Liu, H.-F. Song, A phase-field study on the hydrogen-induced pitting corrosion with solid-solid phase transformation in -uranium, Computational Materials Science 213 (2022) 111663.
- (30) S. Scheiner, C. Hellmich, Stable pitting corrosion of stainless steel as diffusion-controlled dissolution process with a sharp moving electrode boundary, Corrosion science 49 (2) (2007) 319–346.
- (31) S. Scheiner, C. Hellmich, Finite volume model for diffusion-and activation-controlled pitting corrosion of stainless steel, Computer Methods in Applied Mechanics and Engineering 198 (37-40) (2009) 2898–2910.
- (32) W. Sun, L. Wang, T. Wu, G. Liu, An arbitrary Lagrangian-Eulerian model for modelling the time-dependent evolution of crevice corrosion, Corrosion Science 78 (2014) 233–243.
- (33) J. A. Sethian, A fast marching level set method for monotonically advancing fronts., Proceedings of the National Academy of Sciences 93 (4) (1996) 1591–1595.
- (34) I. Steinbach, Phase-field models in materials science, Modelling and simulation in materials science and engineering 17 (7) (2009) 073001.
- (35) T. Q. Ansari, H. Huang, S.-Q. Shi, Phase field modeling for the morphological and microstructural evolution of metallic materials under environmental attack, npj Computational Materials 7 (1) (2021) 143.
- (36) C. Yang, H. Huang, W. Liu, J. Wang, J. Wang, H. M. Jafri, Y. Liu, G. Han, H. Song, L.-Q. Chen, Explicit Dynamics of Diffuse Interface in Phase-Field Model, Advanced Theory and Simulations 4 (1) (2021) 2000162.
- (37) L.-Q. Chen, Phase-field models for microstructure evolution, Annual review of materials research 32 (1) (2002) 113–140.
- (38) Y. Li, S. Hu, X. Sun, M. Stan, A review: applications of the phase field method in predicting microstructure and property evolution of irradiated nuclear materials, npj Computational Materials 3 (1) (2017) 16.
- (39) W. Mai, S. Soghrati, R. G. Buchheit, A phase field model for simulating the pitting corrosion, Corrosion Science 110 (2016) 157–166.
- (40) T. Q. Ansari, Z. Xiao, S. Hu, Y. Li, J.-L. Luo, S.-Q. Shi, Phase-field model of pitting corrosion kinetics in metallic materials, npj Computational Materials 4 (1) (2018) 38.
- (41) T. Q. Ansari, J.-L. Luo, S.-Q. Shi, Modeling the effect of insoluble corrosion products on pitting corrosion kinetics of metals, npj Materials Degradation 3 (1) (2019) 28.
- (42) W. Mai, S. Soghrati, New phase field model for simulating galvanic and pitting corrosion processes, Electrochimica Acta 260 (2018) 290–304.
- (43) A. F. Chadwick, J. A. Stewart, R. A. Enrique, S. Du, K. Thornton, Numerical modeling of localized corrosion using phase-field and smoothed boundary methods, Journal of The Electrochemical Society 165 (10) (2018) C633.
- (44) C. Tsuyuki, A. Yamanaka, Y. Ogimoto, Phase-field modeling for pH-dependent general and pitting corrosion of iron, Scientific reports 8 (1) (2018) 12777.
- (45) C. Yang, Y. Liu, H. Huang, S. Wu, J. Sheng, X. Shi, J. Wang, G. Han, H. Song, Hydride corrosion kinetics on metallic surface: a multiphase-field modeling, Materials Research Express 8 (10) (2021) 106518.
- (46) S. G. Kim, W. T. Kim, T. Suzuki, Phase-field model for binary alloys, Physical review e 60 (6) (1999) 7186.
- (47) S. G. Kim, W. T. Kim, T. Suzuki, M. Ode, Phase-field modeling of eutectic solidification, Journal of crystal growth 261 (1) (2004) 135–158.
- (48) G. Allen, P. Tucker, Surface oxidation of uranium metal as studied by X-ray photoelectron spectroscopy, Journal of the Chemical Society, Dalton Transactions (5) (1973) 470–474.
- (49) N. Harker, T. Scott, C. Jones, J. Petherbridge, J. Glascott, Altering the hydriding behaviour of uranium metal by induced oxide penetration around carbo-nitride inclusions, Solid State Ionics 241 (2013) 46–52.
- (50) J. Bloch, M. H. Mintz, Kinetics and mechanisms of metal hydrides formation-a review, Journal of Alloys and Compounds 253 (1997) 529–541.
- (51) J. Glascott, Hydrogen & Uranium; interactions between the first and last naturally occurring elements, Discovery–Sci. Tech. J. of AWE 6 (2003) 16–27.
- (52) W. Villanueva, K. Grönhagen, G. Amberg, J. Ågren, Multicomponent and multiphase modeling and simulation of reactive wetting, Physical Review E 77 (5) (2008) 056313.
- (53) L.-Q. Chen, W. Yang, Computer simulation of the domain dynamics of a quenched system with a large number of nonconserved order parameters: The grain-growth kinetics, Physical Review B 50 (21) (1994) 15752.
- (54) T. W. Heo, S. Bhattacharyya, L.-Q. Chen, A phase field study of strain energy effects on solute-grain boundary interactions, Acta materialia 59 (20) (2011) 7800–7815.
- (55) T. W. Heo, K. B. Colas, A. T. Motta, L.-Q. Chen, A phase-field model for hydride formation in polycrystalline metals: Application to -hydride in zirconium alloys, Acta Materialia 181 (2019) 262–277.
- (56) B. Nestler, H. Garcke, B. Stinner, Multicomponent alloy solidification: phase-field modeling and simulations, Physical Review E 71 (4) (2005) 041609.
- (57) F. Wang, B. Nestler, A phase-field study on the formation of the intermetallic Al2Au phase in the Al-Au system, Acta Materialia 95 (2015) 65–73.
- (58) F. Wang, A. Reiter, M. Kellner, J. Brillo, M. Selzer, B. Nestler, Phase-field modeling of reactive wetting and growth of the intermetallic Al2Au phase in the Al-Au system, Acta Materialia 146 (2018) 106–118.
- (59) R. Folch, M. Plapp, Quantitative phase-field modeling of two-phase growth, Physical Review E 72 (1) (2005) 011602.
- (60) P. Bollada, P. Jimack, A. Mullis, A new approach to multi-phase formulation for the solidification of alloys, Physica D: Nonlinear Phenomena 241 (8) (2012) 816–829.
- (61) A. N. Choudhury, Quantitative phase-field model for phase transformations in multi-component alloys, Ph.D. thesis, Karlsruhe, Karlsruher Institut für Technologie (KIT), Diss., 2012 (2013).
- (62) J. Bair, M. A. Zaeem, D. Schwen, Formation path of hydrides in zirconium by multiphase field modeling, Acta Materialia 123 (2017) 235–244.
- (63) S. Wu, J. Sheng, C. Yang, X. Shi, H. Huang, Y. Liu, H. Song, Phase-Field Model of Hydride Blister Growth Kinetics on Zirconium Surface, Frontiers in Materials 9 (2022) 916593.
- (64) P. Chiotti, The H-U system (hydrogen-uranium), Bulletin of Alloy Phase Diagrams 1 (2) (1980) 99–106.
- (65) M. Hansen, K. Anderko, H. Salzberg, Constitution of binary alloys, Journal of the Electrochemical Society 105 (12) (1958) 260C.
- (66) T. B. Massalski, H. Okamoto, P. Subramanian, L. Kacprzak, W. W. Scott, Binary alloy phase diagrams, Vol. 1, American society for metals Metals Park, OH, 1986.
- (67) V. Wheeler, The diffusion and solubility of hydrogen in uranium dioxide single crystals, Journal of Nuclear Materials 40 (2) (1971) 189–194.
- (68) J. S. Morrell, M. J. Jackson, et al., Uranium processing and properties, Springer, 2013.
- (69) E. Fisher, Temperature dependence of the elastic moduli in alpha uranium single crystals, part IV (298 to 923 K), Journal of Nuclear Materials 18 (1) (1966) 39–54.
- (70) G. Powell, J. Condon, Mass spectrographic determination of hydrogen thermally evolved from uranium and uranium alloys, Analytical Chemistry 45 (14) (1973) 2349–2354.
- (71) Y. Zhang, B. Wang, Y. Lu, Y. Yang, P. Zhang, Electronic, mechanical and thermodynamic properties of -UH3: A comparative study by using the LDA and LDA + U approaches, Journal of nuclear materials 430 (1-3) (2012) 137–141.
- (72) J. Wachtman Jr, M. Wheat, H. Anderson, J. Bates, Elastic constants of single crystal UO2 at 25∘C, Journal of Nuclear Materials 16 (1) (1965) 39–41.
- (73) S. Blaxland, The Involvement of Stress in Uranium Corrosion Phenomena, The University of Manchester (United Kingdom), 2015.
- (74) J. Morris Jr, The khachaturyan theory of elastic inclusions: Recollections and results, Philosophical Magazine 90 (1-4) (2010) 3–35.
- (75) J. Bair, M. A. Zaeem, M. Tonks, A phase-field model to study the effects of temperature change on shape evolution of -hydrides in zirconium, Journal of Physics D: Applied Physics 49 (40) (2016) 405302.
- (76) J. Lubliner, Plasticity Theory, revised ed. ed (2008).
- (77) D. A. Porter, K. E. Easterling, M. Y. Sherif, Phase transformations in metals and alloys, CRC press, 2021.
- (78) C. Shen, J. Simmons, Y. Wang, Effect of elastic interaction on nucleation: I. Calculation of the strain energy of nucleus formation in an elastically anisotropic crystal of arbitrary microstructure, Acta Materialia 54 (20) (2006) 5617–5630.
- (79) C. Shen, J. Simmons, Y. Wang, Effect of elastic interaction on nucleation: II. Implementation of strain energy of nucleus formation in the phase field method, Acta materialia 55 (4) (2007) 1457–1466.
- (80) G. Han, Y. Zhao, C. Zhou, D.-Y. Lin, X. Zhu, J. Zhang, S. Hu, H. Song, Phase-field modeling of stacking structure formation and transition of -hydride precipitates in zirconium, Acta Materialia 165 (2019) 528–546.
- (81) D. Schwen, L. K. Aagesen, J. W. Peterson, M. R. Tonks, Rapid multiphase-field model development using a modular free energy based approach with automatic differentiation in MOOSE/MARMOT, Computational Materials Science 132 (2017) 36–45.
- (82) J.-l. Lin, B. J. Heuser, Modeling hydrogen solvus in zirconium solution by the mesoscale phase-field modeling code Hyrax, Computational Materials Science 156 (2019) 224–231.
- (83) A. F. Dykhuis, M. P. Short, Phase field modeling of irradiation-enhanced corrosion of Zircaloy-4 in PWRs, Corrosion Science 146 (2019) 179–191.
- (84) A. A. Wheeler, B. T. Murray, R. J. Schaefer, Computation of dendrites using a phase field model, Physica D: Nonlinear Phenomena 66 (1-2) (1993) 243–262.
- (85) C. D. Taylor, Evaluation of first-principles techniques for obtaining materials parameters of -uranium and the (001) -uranium surface, Physical Review B 77 (9) (2008) 094119.
- (86) C. D. Taylor, R. S. Lillard, Ab-initio calculations of the hydrogen-uranium system: Surface phenomena, absorption, transport and trapping, Acta materialia 57 (16) (2009) 4707–4715.
- (87) C. Lin, H. Ruan, S.-Q. Shi, Mechanical-chemical coupling phase-field modeling for inhomogeneous oxidation of zirconium induced by stress-oxidation interaction, npj Materials Degradation 4 (1) (2020) 22.
- (88) T. B. Scott, G. C. Allen, I. Findlay, J. Glascott, UD3 formation on uranium: evidence for grain boundary precipitation, Philosophical Magazine 87 (2) (2007) 177–187.
- (89) S. Wang, F. Giuliani, T. B. Britton, Microstructure and formation mechanisms of -hydrides in variable grain size Zircaloy-4 studied by electron backscatter diffraction, Acta Materialia 169 (2019) 76–87.
- (90) L. Briottet, R. Batisse, P. Bernard, C. Duret-Thual, J.-L. Heuzé, F. Martin, F. Thebault, F. Vucko, Industrial Consequences of Hydrogen Embrittlement, in: Mechanics-Microstructure-Corrosion Coupling, Elsevier, 2019, pp. 223–244.