The IR Compactness of dusty galaxies set star-formation and dust properties at
Abstract
Surface densities of gas, dust and stars provide a window into the physics of star-formation that, until the advent of high-resolution far-infrared/sub-millimeter observations, has been historically difficult to assess amongst dusty galaxies. To study the link between infrared (IR) surface densities and dust properties, we leverage the Atacama Large Millimetre/Submillimetre Array (ALMA) archive to measure the extent of cold dust emission in 15 IR selected galaxies selected on the basis of having available mid-IR spectroscopy from Spitzer. We use the mid-IR spectra to constrain the relative balance between dust heating from star-formation and active galactic nuclei (AGN), and to measure emission from Polycylic Aromatic Hydrocarbons (PAHs) – small dust grains that play a key role in the photoelectric heating of gas. In general, we find that dust-obscured star-formation at high IR surface densities exhibits similar properties at low- and high-redshift, namely: local luminous IR galaxies have comparable PAH luminosity to total dust mass ratios as high- galaxies, and star-formation at is more efficient at high IR surface densities despite the fact that our sample of high galaxies are closer to the main-sequence than local luminous IR galaxies. High star-formation efficiencies are coincident with a decline in the PAH/IR luminosity ratio reminiscent of the deficit observed in far-infrared fine-structure lines. Changes in the gas and dust conditions arising from high star-formation surface densities might help drive the star-formation efficiency up. This could help explain high efficiencies needed to reconcile star-formation and gas volume densities in dusty galaxies at cosmic noon.
revtex4-1Repair the float
1 Introduction
The sizes of galaxies are a critical axis along which to study star-formation. In general, the optical/near-IR extent of galaxies gets progressively smaller towards higher-redshifts at fixed star-formation rate and stellar mass (Buitrago et al., 2008; Conselice, 2014; van der Wel et al., 2014; Shibuya et al., 2015; Mowla et al., 2019), and smaller star-forming galaxies tend to support larger star-formation rate surface densities (Lutz et al., 2016; Fujimoto et al., 2017). The sizes of galaxies also correlate with the conditions of the interstellar medium (Díaz-Santos et al., 2017; McKinney et al., 2020, 2021a; Puglisi et al., 2021), which may drive changes in the underlying mode of star-formation. Indeed, the scaling relationship between star-formation rate surface densities and molecular gas surface densities is sensitive to the physics of stellar mass assembly in galaxies (e.g., Schmidt, 1959; Kennicutt, 1998), and departures from canonical surface density scaling laws have been attributed to changes in the star-formation efficiency (Elbaz et al., 2018). Thus, measuring and accounting for galaxy sizes is an important factor when studying star-formation today and at high-redshift.
Star-formation from around the peak of the star-formation rate density is predominantly obscured by dust (Madau & Dickinson, 2014), and happens within luminous, infrared galaxies with infrared luminosities (LIR) exceeding (Murphy et al., 2011; Zavala et al., 2021). However, the spatial extent of star-formation in such distant systems was historically difficult to measure in single dish surveys. Until the Atacama Large Millimetre/Submillimetre Array (ALMA) introduced capability for high spatial resolution observations at sub-millimeter wavelengths, studying the extent of star-formation in such dust-obscured galaxies was principally limited by a lack of resolution at infrared wavelengths. Deep radio imaging with the Very Large Array (VLA), Plateau de Bure interferometer, and Submillimeter Array were key in revealing the compact sizes of luminous sub-millimeter galaxies (SMGs) detected in single dish survey (e.g., Chapman et al., 2004; Younger et al., 2007; Biggs & Ivison, 2008; Tacconi et al., 2008; Riechers et al., 2011; Bussmann et al., 2013). Recently, much progress has been made towards spatially resolving dust-obscured star-formation on kpc scales in luminous infrared galaxies using ALMA, finding characteristically small sizes kpc (Fujimoto et al., 2017; Gómez-Guijarro et al., 2022a; Engel et al., 2010; Hodge et al., 2016; Ikarashi et al., 2015; Spilker et al., 2016; Kaasinen et al., 2020; Pantoni et al., 2021; McKinney et al., 2020; Rujopakarn et al., 2019; Barro et al., 2016) which are reproduced by numerical simulations coupled to far-IR radiative transfer codes (Cochrane et al., 2019; Popping et al., 2022). Similarly, low-redshift luminous IR galaxies also show small IR sizes kpc (Lutz et al., 2016; Bellocchi et al., 2022); however, these are commonly confined to merger nuclei whereas high targets can show kinematic evidence for disks with high star-formation rate surface densities (Hodge et al., 2016; Calistro Rivera et al., 2018; Pantoni et al., 2021; Xiao et al., 2022). The ISM conditions found within such high dusty star-forming disks seem to resemble those within the cores of local LIRGs (Spilker et al., 2016; McKinney et al., 2020, 2021a; Rybak et al., 2022).
From high-resolution ALMA observations, a number of scaling relations between the IR size of galaxies and their star-formation and gas properties have emerged. Fujimoto et al. (2017) statistically demonstrated that sizes measured at IR wavelengths correlate with LIR, and that for fixed LIR galaxies at high redshift are on-average smaller than those at low redshift. Sizes measured from dust continuum seem to evolve with stellar mass and redshift in a similar manner as optical sizes for late-type galaxies (Gómez-Guijarro et al., 2022b), and shrink relative to the stellar light as the gas fraction is diminished (Gómez-Guijarro et al., 2022a). Elbaz et al. (2018) and Puglisi et al. (2021) target IR-luminous Herschel sources at , and find that luminous infrared galaxies with high surface densities tend to have higher star-formation efficiency and higher CO excitation relative to more extended infrared sources at the same redshift. At Díaz-Santos et al. (2017) and Lutz et al. (2016) showed how the IR surface density is a critical axis for understanding key far-IR cooling line emission like [C II] m. Radiation field intensities and the far-IR line emission they power depart from typical values above a threshold of , which may also change the underlying heating and cooling physics in luminous IR galaxies (McKinney et al., 2021a). Similar far-IR line ratios and ISM conditions are seen in some high-redshift galaxies with ALMA detections of [C II] (Zanella et al., 2018; Rybak et al., 2019; McKinney et al., 2020). Fundamentally, the apparent IR size of dust-obscured star-forming galaxies reflects the surface density of dusty star-forming regions (Díaz-Santos et al., 2017), and is therefore sensitive to the physical mechanisms regulating gas conditions and star-formation rates.
In this work, we measure IR sizes using archival ALMA observations in a sample of galaxies with mid-IR Spitzer Space Telescope spectra. Comparing to low-redshift dusty galaxies with similar multi-wavelength observations, we study the link between infrared surface densities () and the content and conditions of dust between . Building on Kirkpatrick et al. (2017) who look at purely star-forming galaxies, we expand our analysis to include galaxies hosting intermediate to strong buried active galactic nuclei (AGN), the incidence of which within actively star-forming galaxies is high at (Sajina et al., 2012; Kirkpatrick et al., 2012, 2015). We decompose infrared emission from galaxies into their star-forming and AGN components using mid-IR Spitzer spectra (Pope et al., 2008; Kirkpatrick et al., 2012), a key step when accounting for star-formation both with and without AGN. In this manner, we are accounting for galaxies both actively growing their stellar populations and supermassive black holes. From the mid-IR spectra we also measure key dust emission features from polycyclic aromatic hydrocarbons (PAHs) which we compare to the total dust mass as measured by ALMA.
The paper is organized as follows: In Section 2 we describe our sample and detail the archival ALMA analysis used to measure IR sizes and dust masses. Section 3 outlines our major results, which we discuss in Section 4. Section 5 summarizes our main conclusions. Throughout this work we adopt a CDM cosmology with , , and . We assume a Chabrier IMF (Chabrier, 2003).
2 Data and Analysis
In this section we describe the ALMA archival matching process for Spitzer targets, our source detection methods, key measured properties, and we comment on the final sample statistics. We also describe similar measurements made for comparison samples.
2.1 ALMA Archival Sample Selection
Mid-IR spectroscopy of galaxies is key for decomposing the IR spectral energy distribution (SED) into the components powered by AGN vs. star-formation. Nuclear toroidal dust heated to high temperatures by buried AGN emits strongly in the mid-IR (e.g., Laurent et al., 2000; Sturm et al., 2000; Tran et al., 2001), whereas star-forming regions are bright in broad PAH emission features and exhibit relatively shallower mid-IR spectral indices (Allamandola et al., 1989; Pope et al., 2008; Sajina et al., 2007). Kirkpatrick et al. (2012) decompose the mid-IR spectra for a large sample by fitting power-law and star-forming templates to calculate the m AGN fraction (), defined as the fraction of emission within the Spitzer/IRS bandpass () attributed to an obscured AGN such that (Pope et al., 2008). Following Kirkpatrick et al. (2015), we distinguish between three general categories: star-forming dominated galaxies (SFG, ), composite galaxies with intermediary balances between SF and AGN (COM, ), and AGN dominated galaxies (). Mid-IR AGN with exhibit a warmer SED, but the average dust temperature of the cold component powered by star-formation is remarkably constant at all around K (Kirkpatrick et al., 2015). To test the dust-obscured star-formation and dust mass in galaxies over a range of buried AGN strength, we do not select on any threshold. Rather, we use to correct total IR luminosities for the relative contribution from AGN and star-formation. Using Eq. 5 of Kirkpatrick et al. (2015) we first convert the mid-IR AGN fraction to a bolometric IR AGN fraction (). Next, we determine the IR luminosity attributed to star-formation () using LIR.
Given the unique constraint on dust-obscured AGN and star-formation provided by mid-IR spectroscopy, we select our initial sample of galaxies on the basis of existing Spitzer/IRS spectra. Specifically, Kirkpatrick et al. (2012, 2015) present a parent sample of 151 (Ultra) luminous IR galaxies (LIRGs: , ULIRGs: ) at with Spitzer/IRS spectra. The original “supersample” includes galaxies in the Great Observatories Origins Deep Survey North/South (GOODS-N/S) and is representative of Herschel+Spitzer colors of galaxies with m detections (Sajina et al., 2012; Kirkpatrick et al., 2012). Our next selection criterion is on sources that can be observed by ALMA due to their location in the sky, which narrows the candidates from 151 (U)LIRGs across the GOODS fields to 81 (U)LIRGs in GOODS-S. We search for ALMA detections for these 81 GOODS-S galaxies. Galaxies from each classification (SFG, COM, AGN) can be found spanning the redshift and LIR range of the parent sample (Kirkpatrick et al., 2015).
2.2 Source Detection
We use the following methods to search for ALMA counterparts to the 81 Spitzer targets in GOODS-S. We search through the ALMA archive, which includes several large surveys, namely ASAGAO (Hatsukade et al., 2018) and GOODS-ALMA 2.0 (Gómez-Guijarro et al., 2022b). ASAGAO contains a smaller subset of the GOODS-S field than GOODS-ALMA 2.0 but has greater sensitivity. We take as many detections out of ASAGAO, then move to GOODS-ALMA 2.0, and then search the archive for sources not detected in either of the large surveys. We homogenize all ALMA images used in this work to the same imaging parameters; namely, we adopt natural weighting and do not -taper the data.
For a given ALMA cutout taken from the archive or the aforementioned large survey maps and centered on the Spitzer coordinates, we first derive a local RMS after masking potential source emission. Next, we find all peaks above which we use as priors to create a segmentation map using photutils.v1.4 (Bradley et al., 2020) detect_sources with a Gaussian smoothing kernel while enforcing a minimum number of 5 connected pixels, typically less than the number of pixels across the beam FWHM and suitable for flagging spatially unresolved and resolved candidates. We then compare the IRAC4 coordinates against each source found in the segmentation map, and we take the closest match within 1 arcsec for further analysis. As a final check, we next overlay the ALMA contours on top of Spitzer/IRAC Ch. 4 (IRAC4) and near-IR imaging from either JWST/NIRCam F150W (JADES; Eisenstein et al. 2023; Rieke & the JADES Collaboration 2023; JADES Team 2023) or HST/WFC3 F160W (3D-HST; Skelton et al. 2014; Grogin et al. 2011; Koekemoer et al. 2011) to visually confirm the association. When comparing between ALMA and HST, we correct for a global astrometry offset in GOODS-S of in RA and in DEC (Elbaz et al., 2018; Franco et al., 2018). We consider all targets with contours coincident with the IRAC4 coordinates as candidate ALMA detections for our sample.
Our primary goal is to measure IR sizes from the archival ALMA data to constrain the extent of dust emitting regions in our sample. As discussed in Gómez-Guijarro et al. (2022b) and Franco et al. (2018, 2020), this requires a continuum peak pixel SNR. Therefore, of our candidate archival matches to our sample we only consider detections with SNR in our analysis.
In summary, of the 81 Spitzer targets in GOODS-S we find 23 candidate matches detected in both or either of ASAGAO and GOODS-ALMA 2.0. Of these, 10 are of sufficient SNR to measure an IR size. From searching the archive for observations within 1′′ of our Spitzer targets we find 10 more observations with ALMA coverage over our sample of which seven correspond to targets not already detected in the ASAGAO and/or GOODS-ALMA 2.0 maps. Of these seven new matches, five have SNR sufficient to measure the IR size and come from the following ALMA programs: 2017.1.01347.S (PI: A. Pope, see McKinney et al. 2020), and 2018.1.00992.S (PI: C. Harrison, see Lamperti et al. 2021). Our final sample with measurements of the sub-mm/mm flux and IR size consists of 15 galaxies (10 from ASAGAO+GOODS-ALMA 2.0, 5 from targeted programs). We tabulate the general properties of each galaxy in Table 1, and the ALMA-derived quantities are listed in Table 1. Near-IR image cutouts with ALMA contour overlays are shown in Fig. 10.
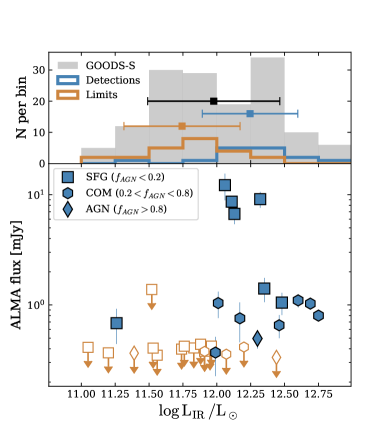
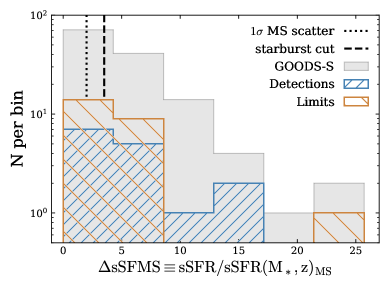
Due to the nature of un-targeted archival observations at IR wavelengths, we expect our final ALMA detected sample to be biased towards higher LIR. To test for such bias, we compare the subset of galaxies with robust flux and size measurements from the ALMA archive against sources covered by archival observations but with no detectable signal (Figure 1). The mean LIR of our final ALMA-detected catalog is dex greater than that of the whole GOODS-S sample, and dex greater than the ALMA non-detections. We detect of all candidates with coverage in archival observations. While our final catalog is not, on-average, representative of LIR and in GOODS-S 24m-selected galaxies (Sajina et al., 2012; Kirkpatrick et al., 2015), it does span the range of both quantities. As shown in the bottom panel of Fig. 1, we do not preferentially detect any particular mid-IR AGN classification. Most importantly, the ALMA archival detection criterion does not impose a bias on the distribution in specific star-formation rates relative to the main-sequence as shown in Figure 2. Roughly of the galaxies in our final ALMA-detected sample are starbursts (sSFR/sSFR, Puglisi et al. 2021), comparable to the starburst fraction amongst the parent sample and ALMA non-detections.
2.2.1 ALMA vs. near-IR morphology and offsets
Recent data released by the JADES team (Eisenstein et al., 2023; Rieke & the JADES Collaboration, 2023; JADES Team, 2023) provides an unprecedented look at the stellar light distribution in dusty galaxies owing to the sensitivity and angular resolution of JWST. Nine out of 15 galaxies in our sample are in the JADES/NIRCam map of GOODS-S, and their cutouts are shown on Figure 10. We find diverse morphologies revealed by JWST, ranging from very compact isolated objects (GS IRS1, GS IRS61) to clumpy multi-component distributions likely induced by a merger (GS IRS15, GS IRS20, GS IRS50, GS IRS58, GS IRS60, GS IRS81). The lowest redshift galaxy in our sample GS IRS73 at is resolved by NIRCam in exquisite detail, and exhibits spiral arms and a central stellar bulge. The high incidence of irregular morphologies in our sample is consistent with the merger-induced fueling scenario of local luminous, IR-galaxies (e.g., Hopkins et al., 2008); however, far-IR spectral lines tracing the cold gas kinematics are needed to confirm a merger vs. clumpy disk scenario.
Offsets between optical/near-infrared and ALMA maps of dusty high galaxies can be upwards of a kpc (e.g., Hodge et al., 2015; Chen et al., 2017; Simpson et al., 2017; Calistro Rivera et al., 2018; Franco et al., 2018). This could arise from complex dust geometries leading to differential attenuation across the galaxy (Cochrane et al., 2021), and has implications for globally-integrated measures of total star-formation (dust-obscured and obscured) and stellar mass (Simpson et al., 2017). We calculate offsets between rest-frame stellar emission (JWST, HST) and cold dust emission (ALMA) across our sample. We measure non-parametric source centroids using the photutils “center of mass” centroiding implementation. The galaxy center is therefore defined as the average of pixels over the source weighted by their intensity. Except for GS IRS50 and GS IRS73, every galaxy in our sample has a positional offset between ALMA and HST or JWST of , consistent with typical ALMA/HST offsets reported in the literature (e.g., Chen et al., 2015; Simpson et al., 2017; Franco et al., 2018). GS IRS73 is a spiral galaxy where the dust is preferentially along the northern arm, possibly due to a recent burst of local star-formation. GS IRS50 has a clumpy optical and IR distribution. While it’s centroids differ by 5 kpc, peaks in the ALMA map correspond to peaks in the NIRCam image and illustrate a clumpy distribution of both dust-obscured and unobscured star-formation across this galaxy. Over the whole sample, the 16%, 50% and 84% quantiles on the offsets are 0.6 (0.07), 1.4 (0.17), and 2.5 (0.30) kpc (arcsec) respectively.
2.3 Measured Quantities
2.3.1 Dust Mass
Eleven of the archival ALMA observations span a range in wavelength between 870-1250m, which probes the Raleigh-Jeans tail of cold dust emission over the range in redshifts spanned by our sample (m between ). This regime is aptly suited to measuring the total dust mass because the emission is optically thin at sub-mm wavelengths (Scoville et al., 2014), and the temperature-dependence is linear meaning uncertainties on the mass-weighted dust temperature () have modest impact on the total dust mass (Scoville et al., 2016, 2017a). Following Kirkpatrick et al. (2017), we use the ALMA flux densities () to measure the dust mass using:
| (1) |
where is the luminosity distance, is the Planck equation, and is the dust opacity from Weingartner & Draine (2001) assuming MW-like dust and 111At 850m the dust opacity is (Weingartner & Draine, 2001). As noted by Kirkpatrick et al. (2017), the variation in at longer wavelengths is negligible across common models (e.g., MW, SMC, LMC) and for different . We choose to fix the cold dust temperature to K because most of the dust is cold with a temperature remarkably constant over (1) the full range of mid-IR AGN fractions when the SED is decomposed into its AGN- and SF-powered components using mid-IR spectroscopy (Kirkpatrick et al., 2015; Scoville et al., 2017a), and (2) redshift for fixed LIR (Drew & Casey, 2022).
Four of the archival ALMA targets (GS IRS 46, 52, 58, 61) are detected by ALMA at wavelengths below m. For two of these targets (GS IRS 46, 52), we use the dust masses derived using 870m APEX/LABOCA photometry from Kirkpatrick et al. (2017) under the same assumptions and formula as used for longer wavelength detections. Two final sources (GS IRS 58, 61) do not have sub-mm observations along the RJ tail, in which case we place upper limits on the total dust mass using the RMS derived from their positions within the ASAGAO map where they are not detected. All dust masses are listed in Table 1.
Kirkpatrick et al. (2017) present an analysis of the dust masses of galaxies selected from the Kirkpatrick et al. (2015) supersample on the availability of sub-mm/mm single-dish photometry. Seven of the galaxies we find ALMA archival matches to also have single-dish sub-mm detections in Kirkpatrick et al. (2017), which we use to test for systematic differences in the dust mass measurements from single-dish and the ALMA interferometer. Flux densities in confusion-limited sub-mm observations are often boosted by the unresolved background as steeply rising source number counts preferentially scatter flux densities upwards (e.g., Hogg & Turner, 1998; Scott et al., 2002; Simpson et al., 2015). Indeed, we find that single-dish derived dust masses tend to be greater than those derived using the ALMA observations by but both agree within .
2.3.2 Flux Densities and Dust Sizes
For each target detected in an archival ALMA map, we measure the integrated flux density () and deconvolved (intrinsic) source size by fitting a 2D elliptical Gaussian using CASA.imfit. For four spatially unresolved sources, we use the convolved size (typically negligibly larger than the clean beam) as an upper limit on the extent of the continuum emission, and the peak flux (). For spatially resolved targets, we derive half-light radii () from the FWHM by first averaging over the major and minor axes, then using . We use to then measure the IR surface density attributed to star-formation () using the AGN-corrected total IR luminosities () and .
The size of emission from a source measured by an interferometer can be made in the image-plane after deconvoling the visibilities, or in the plane directly on the visibilities. In general, the latter yields a more robust measurement because (1) it avoids uncertainties introduced when reconstructing the sky model during deconvolution, and (2) complex visiblity amplitudes as a function of baseline separation are directly measuring the extent of emission. To test consistency between the methods, we measure image-plane sizes for sources in the blindly-selected sample of Gómez-Guijarro et al. (2022b) using the image-plane method outlined above and compare against their -plane sizes. The sample of Gómez-Guijarro et al. (2022b) is taken from GOODS-ALMA2.0 and includes ALMA sources with similar flux densities as our sample at mm. When the peak continuum SNR is above , the difference between image- and -plane sizes is 0.05′′ (400 pc at ) on-average for 18 GOODS-ALMA2.0 sources and both size measures agree within . This is consistent with previous comparisons in the literature (e.g., Hodge et al., 2016; Chang et al., 2020). Below , the difference between image- and -plane sizes exhibits a larger scatter (0.35′′ for 13 sources) but is 0.07′′ on-average and sizes agree within for 80% of sources at SNR. Sizes are intrinsically uncertain in this lower SNR regime whether made in the image-plane or -plane (e.g., Gómez-Guijarro et al., 2022b). Given the agreement between image- and -plane sizes for the SNR range spanned by of our sample, we adopt image-plane dust continuum sizes in our analysis with added uncertainty to the lower SNR sub-set. We add the average uncertainty on -plane sizes ( for SNR) to the image-plane size uncertainties for galaxies in our sample with .
The majority of the ALMA data we use to measure IR sizes were observed at mm (Tab. 1), which at the median of our sample traces rest-frame m emission. One of the high galaxies in our sample (GS IRS 20) is spatially resolved at both 450m and 1.1 mm. Following the same procedure outlined in Section 2.2, we measure intrinsic (PSF-corrected) m for GS IRS20 to be larger than its 1.1 mm size, and in agreement within . This is consistent with radiative transfer simulations of dusty and massive galaxies that find a maximal difference of for sizes at m vs. m (Cochrane et al., 2019; Popping et al., 2022). This is close to the accuracy at which we can measure IR sizes. Finally, we choose not to apply any size corrections accounting for variation in the observed wavelengths when comparing our high sizes (m) against those derived from Herschel/PACS in low- galaxies (m). This is physically motivated because the emission is optically thin at m, and the coldest dust component dominating the far-IR emission also dominates the total dust mass (Scoville et al., 2017a).
| ID | RA | DEC | aa Spectroscopic redshifts are derived from fits to the broad PAH features detected in mid-IR Spitzer/IRS spectra (following Appendix A of McKinney et al. 2020), and have typical uncertainties of . | Ref | |||||||||
|---|---|---|---|---|---|---|---|---|---|---|---|---|---|
| [J2000] | [J2000] | [] | [] | [] | [mm] | [mJy] | [mJy/beam] | [kpc] | [] | ||||
| GS IRS1 | 03:32:44.00 | -27:46:35.0 | 2.69 | 12.69 | 10.95 | 39 | 1.233 | 1 | |||||
| GS IRS15 | 03:32:40.74 | -27:49:26.0 | 2.11 | 12.17 | 10.78 | 39 | 1.131 | 2 | |||||
| GS IRS20 | 03:32:47.58 | -27:44:52.0 | 1.91 | 12.60 | 10.77 | 25 | 1.233 | 1 | |||||
| GS IRS23 | 03:32:17.23 | -27:50:37.0 | 1.96 | 12.35 | 10.99 | 0 | 1.131 | 2 | |||||
| GS IRS33 | 03:32:23.43 | -27:42:55.0 | 2.14 | 12.30 | 10.75 | 95 | 0.872 | 3 | |||||
| GS IRS45 | 03:32:17.45 | -27:50:03.0 | 1.62 | 12.48 | 10.39 | 6 | 1.131 | 2 | |||||
| GS IRS46 | 03:32:42.71 | -27:39:27.0 | 1.85 | 12.32 | 10.59 | 0 | 0.456 | 4bbFor these objects only detected only in ALMA Band 9 (m), we use single-dish dust mass estimates from Kirkpatrick et al. (2017) where possible. Otherwise, we place upper limits using local noise properties derived from the target’s position within the ASAGAO map. | |||||
| GS IRS50 | 03:32:31.52 | -27:48:53.0 | 1.90 | 12.01 | 10.82 | 28 | 1.233 | 1 | |||||
| GS IRS52 | 03:32:12.52 | -27:43:06.0 | 1.79 | 12.11 | 10.43 | 15 | 0.444 | 4bbFor these objects only detected only in ALMA Band 9 (m), we use single-dish dust mass estimates from Kirkpatrick et al. (2017) where possible. Otherwise, we place upper limits using local noise properties derived from the target’s position within the ASAGAO map. | |||||
| GS IRS58 | 03:32:40.24 | -27:49:49.0 | 1.85 | 12.06 | 10.86 | 7 | 0.456 | 1 | 4bbFor these objects only detected only in ALMA Band 9 (m), we use single-dish dust mass estimates from Kirkpatrick et al. (2017) where possible. Otherwise, we place upper limits using local noise properties derived from the target’s position within the ASAGAO map. | ||||
| GS IRS60 | 03:32:40.05 | -27:47:55.0 | 2.02 | 12.46 | 10.88 | 23 | 1.233 | 1 | |||||
| GS IRS61 | 03:32:43.45 | -27:49:01.0 | 1.77 | 12.13 | 10.69 | 15 | 0.441 | 4bbFor these objects only detected only in ALMA Band 9 (m), we use single-dish dust mass estimates from Kirkpatrick et al. (2017) where possible. Otherwise, we place upper limits using local noise properties derived from the target’s position within the ASAGAO map. | |||||
| GS IRS70 | 03:32:27.71 | -27:50:40.6 | 1.10 | 11.99 | 10.78 | 23 | 1.131 | 2 | |||||
| GS IRS73 | 03:32:43.24 | -27:47:56.2 | 0.67 | 11.26 | 10.47 | 0 | 1.131 | 2 | |||||
| GS IRS81 | 03:32:38.49 | -27:46:31.9 | 2.55 | 12.75 | 10.34 | 38 | 1.233 | 1 |
Note. — Columns: () Spectroscopic redshifts derived from fits to the broad PAH features detected in mid-IR Spitzer/IRS spectra following Appendix A of McKinney et al. 2020. The typical uncertainty on IRS-derived redshifts is . (LIR) Total IR luminosities derived by fitting Spitzer and Herschel photometry from Kirkpatrick et al. (2012), with systematic uncertainties of . () Stellar masses originally calculated from optical/near-IR photometry assuming a Salpeter initial mass function (Kirkpatrick et al., 2012), which we have corrected here to a Chabrier initial mass function. () Mid-IR AGN fractions calculated by fitting a star-forming and power-law (AGN) template to the IRS spectra (Pope et al., 2008; Kirkpatrick et al., 2012). (L6.2μm) The luminosity of the m PAH feature measured from fits to the IRS spectra following App. A of McKinney et al. (2020). () Observed continuum effective wavelength. () Source-integrated ALMA flux. () Peak continuum ALMA flux. () Effective radius containing half of the total integrated flux. () Dust mass derived using Eq. 1. (Ref) ALMA program from which properties are derived: ASAGAO (Ueda et al., 2018), GOODS-ALMA (Gómez-Guijarro et al., 2022b), 2018.1.00992.S (Lamperti et al., 2021), 2017.1.03147.S (McKinney et al., 2020)
2.4 Ancillary Data
The parent sample from which our targets are selected from have robust multi-wavelength photometry and mid-IR spectroscopy from Spitzer/IRS. A full description of the IRS observations can be found in Pope et al. (2008) and Kirkpatrick et al. (2012), and a comprehensive discussion of the ancillary Herschel (PACS and SPIRE) and Spitzer (IRAC and MIPS) photometry is presented in Kirkpatrick et al. (2015). We use the stellar masses derived for our sample in Kirkpatrick et al. (2012) who fit 10 optical/near-IR bands between m with a composite stellar population synthesis code assuming an exponentially declining star-formation history (Drory et al., 2004, 2009). Kirkpatrick et al. (2012) assume a Salpeter IMF for their stellar masses, which we convert to a Chabrier framework following Kirkpatrick et al. (2017) (; Speagle et al. 2014). Total IR luminosites are derived from fits to Spitzer/MIPS and Herschel/PACS+SPIRE photometry (Kirkpatrick et al., 2012). The appendix of McKinney et al. (2020) provides a detailed description of how PAH luminosities and spectroscopic redshifts are derived for our sample using a custom Markov Chain Monte Carlo fitting routine. The GOODS-S targets are within the coverage of 3D-HST which provides deep WFC3/IR imaging (Brammer et al., 2012; Momcheva et al., 2016). Key derived properties from the ancillary data are listed in Table 1. In summary, galaxies in our sample have LIR in the range of , stellar masses between , and redshifts from .
2.5 Comparison Samples
We compare our data against local galaxies in the Great Observatories All Sky LIRG Survey (GOALS; Armus et al. 2009), a 60m flux-limited sample of local LIRGs with multi-wavelength data comparable to the coverage of our targets including Spitzer/IRS mid-IR measurements of PAH emission (Stierwalt et al., 2013, 2014), intrinsic IR sizes from Herschel/PACS at m (Lutz et al., 2016), and sub-mm photometry (Chu et al., 2017) from which we derive dust masses. U et al. (2012) also present dust massed derived from SED fitting; however, we choose to re-calculate the total dust mass under the same assumptions and with the same method as applied to the high-redshift galaxies to avoid introducing systematic offsets (Kirkpatrick et al., 2017). We use 850m photometry from the James Clerk Maxwell Telescope where possible to measure the dust mass, and m Herschel/SPIRE 500m photometry otherwise (Chu et al., 2017). Dust masses derived from both agree within on average. The Spitzer/IRS SL slit usually traces the nuclear region in GOALS (Stierwalt et al., 2013). To estimate galaxy-integrated PAH luminosities in GOALS, we scale luminosity measurements of the PAHs made through the slit by the total-to-slit flux IRAC Ch. 4 flux ratio derived in Stierwalt et al. (2014). Aperture corrections do not correlate with distance (Stierwalt et al., 2013) or the total dust mass. We use mid-IR AGN fractions in GOALS derived from the 6.2m equivalent width (Díaz-Santos et al., 2017), as these most closely resembles our method for measuring at where the m PAH anchors the star-forming template during spectral decomposition (Pope et al., 2008).
To contextualize the measurements of PAHs in the ISM for both GOALS and our high star-formation rate targets with the population of more normal star-forming galaxies, we compare against galaxies from the KINGFISH survey (Kennicutt et al., 2011), a sample of nearby ( Mpc) galaxies spanning a range in star-formation rate between . The sizes of galaxies in KINGFISH have been reported at optical and FUV wavelengths (Dale et al., 2007; Kennicutt et al., 2011), but not in the far-IR. Therefore, we download the Herschel/PACS160 maps of KINGFISH targets (Dale et al., 2012) from the NASA/IPAC Infrared Science Archive (IRSA) (KINGFISH Team, 2020) and perform a simple aperture-based measurement to derive the effective radii containing 50% of the 160 m flux. KINGFISH was designed to overlap with existing Spitzer/IRS spectroscopy from the SINGS program (Kennicutt et al., 2003), which we use to extend our analysis of dust to low using PAH line fluxes presented in Smith et al. (2007). We scale the PAH luminosities measured through the IRS slit by the ratio of total LIR to LIR measured through the slit (Smith et al., 2007), an approximate aperture correction assuming the extent of PAHs follows the cold dust continuum (e.g., Bendo et al., 2008; Calapa et al., 2014; Gregg et al., 2022). We note that none of the quantities we derive for KINGFISH correlate with distance or the adopted aperture correction. Finally, we measure dust masses in KINGFISH using Herschel/SPIRE m photometry (Dale et al., 2012, 2017) under the same assumptions made for the other data sets.
PAH line fluxes for GOALS and KINGFISH are measured using spectral decomposition methods (e.g., PAHFIT, Smith et al. 2007; CAFE, Marshall et al. 2007). Owing to the lower SNR of the IRS spectra, we measure PAH line fluxes using a spline continuum fit (Sajina et al., 2007; Pope et al., 2008; McKinney et al., 2020). Smith et al. (2007) demonstrate that the 6.2m PAH line luminosities measured with these two techniques differ by a factor of owing to where the continuum is drawn. Therefore, we scale in GOALS and KINGFISH down by a factor of to match our spline-derived PAH luminosities at higher redshift. Omitting this scale factor does not change the results of our analysis, as the empirical scatter in within GOALS, KINGFISH, and (U)LIRGs is greater than 60% of the median.
3 Results
3.1 Dust masses
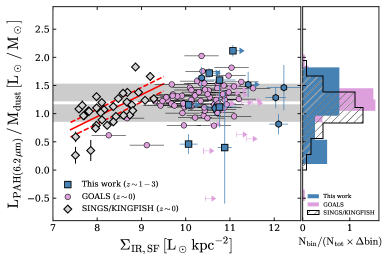
The dust mass is dominated by large grains which also dominate the far-IR emission, whereas PAHs populate the smaller end of the grain size distribution and emit strong mid-IR features (Draine & Li, 2001). Despite this size difference, mid- and far-IR emission tracing the PAHs and cold dust respectively are correlated with the spatial extent of star-formation in galaxies (e.g., Kirkpatrick et al., 2014; Gregg et al., 2022) which is, amongst other reasons, why PAHs have been commonly used to trace dust-obscured star-formation rates (e.g., Genzel et al., 1998; Peeters et al., 2004; Wu et al., 2005; Lutz et al., 2007; Pope et al., 2008). In Figure 3 we show the ratio of LPAH to total dust mass to empirically trace the PAH mass fraction in the ISM (, Draine & Li 2001) which is otherwise commonly inferred in the literature by fitting dust model grids to spectral energy distributions (e.g., Draine & Li, 2007; Aniano et al., 2020). We use only the 6.2m PAH feature because it is isolated from adjacent lines and distant from the strong silicate absorption making it the cleanest PAH line to measure in low SNR Spitzer/IRS spectra. We find no correlation between LPAH/ and for (U)LIRGs (), and that all galaxies included in this analysis scatter around an average LPAH-to-total dust mass ratio of (Tab. 2). This includes galaxies with intermediate to strong dust-obscured AGN, for which spatially resolved JWST/MIRI observations have shown to host strong PAH emission remarkably close to the AGN (Lai et al., 2022). We do find a positive correlation between LPAH/ in KINGFISH () with which could be driven by the higher metallicities found for warmer, high KINGFISH galaxies because of the increasing trend between PAH mass fraction and metallicity (Aniano et al., 2020). The intensity of PAH emission is also a function of metallicity at (Shivaei et al., 2017), and therefore comparable LPAH/ ratios for GOALS, (U)LIRGs and KINGFISH galaxies with may arise from their similar gas phase metallicities. Given the similar masses of the (U)LIRGs and the mass-metallicity relation, we do not expect any effects of metallicity on the PAH emission for the purposes of comparing GOALS and our sample. In any case, the scatter about the best-fit trend in KINGFISH galaxies is substantially lower than for (U)LIRGs at , which could justify the use of PAH emission to trace the total dust mass at if is known. Further studies of high-redshift, low galaxies are needed to test if this correlation holds at earlier cosmic epochs.
3.2 IR Sizes
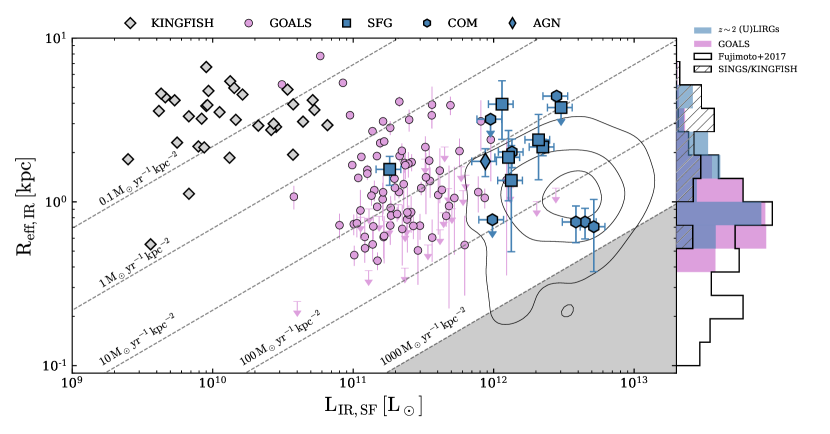
Fujimoto et al. (2017) presents a systematic analysis of IR sizes using Cycles 0-3 ALMA programs made public through the ALMA archive. Their blindly selected sample spans a range in star-formation rates between , stellar masses between and . We compare the sizes measured in our ALMA-detected sample to their 10-selected sample in Figure 4, as well as the distribution in sizes found for GOALS and KINGFISH galaxies. While we have already subtracted the AGN-powered component from LIR using in GOALS and (U)LIRGs, this has minimal impact on the LIR,SF- relation because reaches a maximum of for (Kirkpatrick et al., 2015). We have also divided the effective radii reported by Fujimoto et al. (2017) defined as FWHM by a factor of for consistency with how we measure to be FWHM. (U)LIRGs from GOALS and our ALMA-detected sample have on-average larger than the blindly selected sample of Fujimoto et al. (2017), and cluster about a star-formation rate surface density about an order of magnitude smaller. Three composite galaxies in our sample are much closer to the locus of Fujimoto et al. (2017) than the rest, and these three also happen to have the highest and LIR. This suggests that the offset in sizes between the two samples could be attributed to, in part, observational bias towards brighter objects that preferentially sit above the main-sequence. Indeed, the Fujimoto et al. (2017) sample has a median LIR greater than galaxies in our sample.
As shown in Figure 4, our far-IR size measurements are broadly consistent with the sizes measured for LIRGs and ULIRGs from spanning a range of star-formation rate surface densities found at all redshifts between assuming SFR (Murphy et al., 2011). (U)LIRGs and ALMA-detected galaxies from this work and Fujimoto et al. (2017) are on average smaller in than KINGFISH galaxies, which tend not to host strong nuclear star-formation as can be found in (U)LIRGs. No galaxy in our sample or in GOALS exceeds the theoretical Eddington limit of (Andrews & Thompson, 2011) even if we omit the AGN correction to LIR.
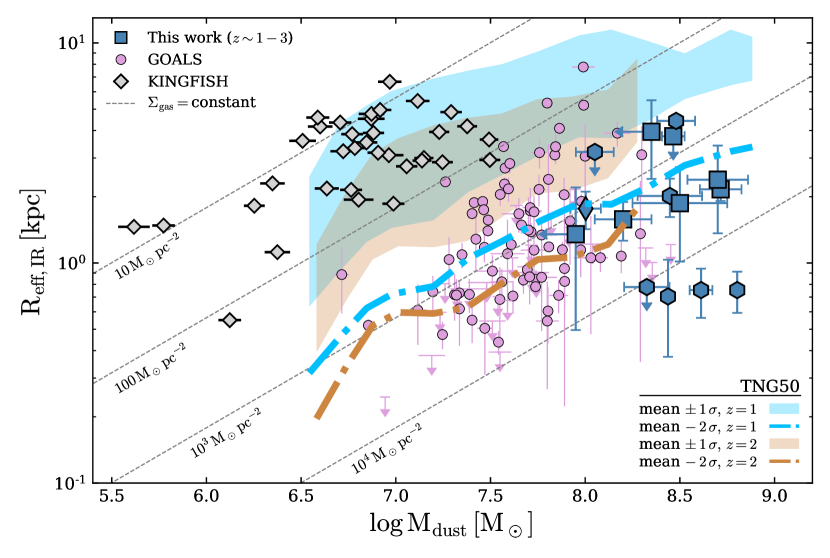
In Figure 5 we show the far-IR extent of the ALMA-detected sample, GOALS, and KINGFISH as a function of their total dust masses. Assuming a dust-to-gas mass ratio of 0.01 as is appropriate for massive galaxies (e.g., Rémy-Ruyer et al., 2014; Shapley et al., 2020; Popping & Péroux, 2022; Shivaei et al., 2022), we find that most (U)LIRGs would fall along an average at and as expected from their large star-formation rate surface densities (Kennicutt & Evans, 2012). The fact that is consistent with optically thin dust (Draine & Li, 2007; Scoville et al., 2017a). We note that approximately of GOALS galaxies at have upper limits on their IR size, which could push the trend towards higher at low amongst the LIRG population.
Popping et al. (2022) derived a simulated distribution in IR size by performing dust radiative transfer on galaxies from the Illustris TNG50 cosmological simulation (Nelson et al., 2019; Pillepich et al., 2019). We compare against their simulated IR sizes and dust masses in Figure 5 which represents galaxies on and above the star-forming main-sequence in TNG50. GOALS galaxies and most of our ALMA-detected sample lie above the star-forming main-sequence, and fall within the parameter space in vs. spanned by simulated galaxies with sizes below the main-sequence trend. Thus, TNG50 reproduces the size and dust mass parameter space observed in (U)LIRGs, but as an outlier population with smaller for fixed relative to main-sequence galaxies. While the size analysis of Popping et al. (2022) does not extend to , the positive correlation between and we find in KINGFISH is comparable to the higher redshift trends for main-sequence galaxies in the simulation (shaded regions on Fig. 5).
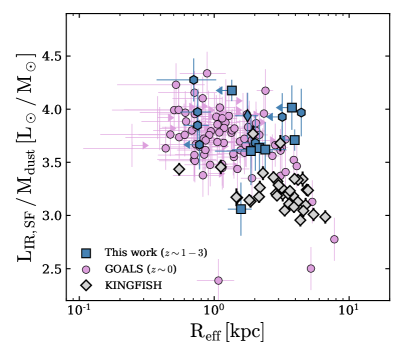
Figure 6 shows the ratio of LIR,SF to as a function of the effective IR radius, bringing together the quantities shown independently in Figures 4 and 5. The ratio of LIR,SF to total dust mass is an empirical tracer of the star-formation efficiency, which reflects the amount of star-formation sustained by a galaxy given its total gas content. We find that the LIR,SF/ ratios for and (U)LIRGs are comparable at fixed , and anti-correlate with the IR size . The more spatially extended KINGFISH galaxies have on-average lower LIR,SF/ than (U)LIRGs, but reach the lower range of the dustier galaxies below kpc.
3.2.1 Far-IR size as a function of mid-IR AGN fraction
Heavily dust-obscured AGN can produce high IR surface densities as the nuclear torus is heated to high temperatures, emitting predominantly at mid-IR wavelengths. Whether or not colder dust emission emitting at far-IR wavelengths is also powered by AGN remains uncertain and debated in the literature (e.g., Stanley et al., 2017; Scoville et al., 2017b; Shangguan et al., 2020; Symeonidis et al., 2016; Symeonidis, 2017; Symeonidis & Page, 2018; McKinney et al., 2021b). Direct heating by AGN and subsequent absorption/re-emission of IR photons could increase the central concentration of IR emission and drive the galaxy-scale effective radii down (e.g., McKinney et al., 2021b; Lamperti et al., 2021). Some star-forming galaxies at high do not necessarily exhibit systematically different far-IR sizes compared to sub-mm luminous quasars (e.g., Chen et al., 2021; Ansarinejad et al., 2022); however, prior works do not explicitly control for the AGN strength using mid-IR spectroscopy.
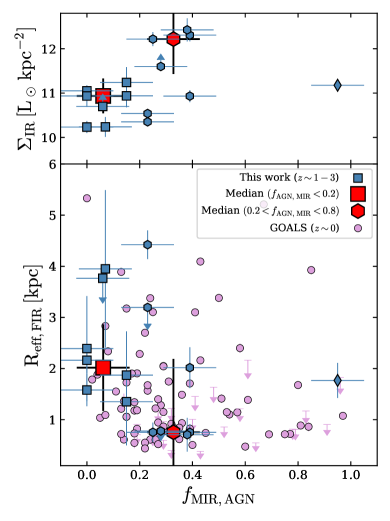
Using the Spitzer/IRS spectral decomposition between SF and AGN for our sample (Pope et al., 2008; Kirkpatrick et al., 2012) and GOALS (Stierwalt et al., 2013, 2014; Díaz-Santos et al., 2017), we show in Figure 7 the relationship between and with from . GOALS galaxies exhibit no systematic correlation between the far-IR size and consistent with the comparison against PG QSOs in Lutz et al. (2016). The trend between and could be stronger for the ALMA-detected sample in this work. The average decreases by a factor of and the average increases by dex between for our sample. The highest IR surface density sources are all moderate to strong AGN consistent with Fujimoto et al. (2017) and Franco et al. (2020) who find that X-ray AGN are preferentially found towards greater . Further spatially resolved far-IR observations at are required to fully test the incidence of small at high in high-redshift galaxies. Nevertheless, the most compact and highest IR surface density sources in our sample all have measurable AGN contribution in the mid-IR.
| () | sample | |||||
|---|---|---|---|---|---|---|
| 0.13 | () | 1 | ||||
| 0.33 | () | 2,3 | ||||
| 0.18 | () | 1,2 | ||||
| 0.14 | () | 3 | ||||
| 0.16 | () | 1,2,3 | ||||
| 0.14 | () | 2 | ||||
| 0.09 | () | 3 | ||||
| 0.64 | 0.27 | 3 |
Note. — Fits take the functional form . Columns: () Domain. () Range. () Slope. () intercept. () dispersion about the best-fit trend. () Perason rank coefficient and corresponding value. (sample) Samples included in fit: (1) KINGFISH, (2) GOALS, (3) ALMA-detected (U)LIRGs at from this work. For fits showing no slope the best-fit and correspond to the column average and dispersion about the mean.
4 Discussion
The dust properties of purely star-forming Spitzer/IRS-selected galaxies were studied extensively in Kirkpatrick et al. (2017). To briefly summarize their main findings, Kirkpatrick et al. (2017) demonstrated that galaxies exhibit lower ratios and higher gas mass fractions than what are found at for fixed LIR, and that galaxies at all redshifts fall along a common relation when accounting for distance above the star-forming main-sequence. We now build upon this prior analysis to understand the role played by the IR sizes of galaxies in governing their star-formation and dust properties.
4.1 ISM conditions and dust composition scale with IR surface densities
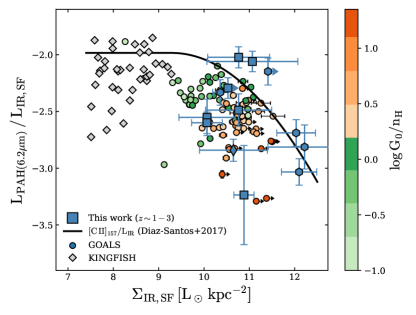
For fixed LIR, galaxies at exhibit more PAH emission per unit LIR than local galaxies (Pope et al., 2013). In a small sample of ALMA-selected Spitzer targets, McKinney et al. (2020) demonstrated that this offset disappears for fixed . We expand upon this prior result using a sample three times larger and sizes predominantly measured along the RJ tail of cold dust emission. Figure 8 shows the LPAH/LIR,SF ratio as a function of at , and for GOALS and KINGFISH. We find the same LPAH/LIR,SF ratios at high and low redshift for fixed . Moreover, we recover an anti-correlation between LPAH/LIR,SF and reminiscent of photometric measures of PAH emission in dusty galaxies (i.e., IR8; Elbaz et al. 2011), and the FIR fine-structure line deficit observed in low- and high dusty galaxies (Díaz-Santos et al., 2017; Zanella et al., 2018; McKinney et al., 2020). PAHs and FIR lines predominantly arise from photodissociation regions (PDRs) around sites of recent star-formation for actively star-forming galaxies (Tielens & Hollenbach, 1985; Malhotra et al., 1997, 2001; Tielens, 2008; Beirão et al., 2012; Croxall et al., 2017; Díaz-Santos et al., 2017; Sutter et al., 2019), and thus the coincidence in their trends with respect to favors physical interpretations local to the young, dusty star-forming regions which dominate the IR surface density. Indeed, the mean UV interstellar radiation field intensity impinging upon PDRs, (measured in , Habing 1968), relative to the neutral PDR density increases by 1 dex over in GOALS as both [C II]/LIR and L6.2μm/LIR,SF fall (Díaz-Santos et al., 2017).
The low LPAH/LIR,SF ratios at high might indicate a change in the ISM conditions regulating the excitation of both FIR lines and PAH emission within dusty and young star-forming regions (e.g., Díaz-Santos et al., 2017). The high ratios found amongst GOALS at indicate that the average star-forming region sees a stronger radiation field, which can modify the PAH photoelectric heating efficiency (Bakes & Tielens, 1994; Galliano et al., 2008; Tielens, 2008) and lower the radiative coupling between stars and gas (McKinney et al., 2020, 2021a). Changes in the relative heating and cooling could lead to systematically high star-formation efficiency if PAHs photoelectrically convert a lower fraction of energy from the stellar radiation field into gas temperatures (Hollenbach & Tielens, 1999; McKinney et al., 2021a). Indeed, simulations that include variable photo-heating laws find high photoelectric heating rates suppress star-formation due to excess heating (Forbes et al., 2016; Inoguchi et al., 2020; Osman et al., 2020). Systematic changes in the photoelectric heating efficiency might leave imprints on the mid-IR spectra as the ionization and/or grain size distribution of PAHs is modified (Draine & Li, 2001; Maragkoudakis et al., 2020). The overlap between GOALS and (U)LIRGs along canonical diagnostic plots of PAH grain properties suggests that the physical mechanisms observed at are likely in place and playing an important role at higher (Figure 3, see also McKinney et al. 2020).
4.2 Dust-obscured galaxies form stars more efficiently at high IR surface densities
In Figure 9 (Left) we show the ratio vs. . The ratio is an empirical tracer of the global star-formation efficiency, which may systematically evolve with redshift (Scoville et al., 2017a). As stated, Kirkpatrick et al. (2017) demonstrated that, for fixed distance above the main-sequence, the star-formation efficiency of (U)LIRGs fall along the same relation between . We find a similarly redshift-independent result, where high IR luminosity surface density galaxies exhibit more efficient star-formation. Combined with KINGFISH which probes galaxies at lower star-formation rates and more extended sizes, the correlation persists linearly over orders of magnitude in with comparatively shallow increase in star-formation efficiency by one order of magnitude. Kirkpatrick et al. (2017) find no correlation between and the ISM extent measured from CO, radio, or Pa for a handful of high galaxies and local LIRGs in GOALS (Rujopakarn et al., 2011). As shown in Figure 6 and Table 2, we find a statistically significant correlation between and the uniformly measured effective radii from far-IR wavelengths in local galaxies, but not at . A much stronger trend manifests at all redshifts using , consistent with multiple studies in the literature demonstrating that luminosity surface densities more accurately reflect the gas and star-formation conditions in galaxies rather than the total luminosity or size alone (e.g., Rujopakarn et al., 2011; Díaz-Santos et al., 2017; Elbaz et al., 2018; McKinney et al., 2020; Díaz-Santos et al., 2021).
The star-formation efficiencies are comparable between GOALS and the (U)LIRGs in this study; however, the samples are different in terms of their position relative to main-sequence star-formation for their corresponding epochs (Lutz et al., 2016; Kirkpatrick et al., 2017). Using the main-sequence parameterization from Speagle et al. (2014), we show in Figure 9 (Right) the ratio of each galaxy’s specific star-formation rate (sSFR) to the main-sequence sSFR for the corresponding stellar mass and redshift against .
GOALS galaxies are typically a factor of above the main-sequence compared to a factor of in ALMA-detected (U)LIRGs. (U)LIRGs at span a range of nearly two orders of magnitude in with a similar dispersion in distance from the main-sequence dex as found locally, albeit shifted down. High (U)LIRGs can exhibit high and low dust-obscured star-formation rate surface densities for fixed position along the main-sequence, whereas in local (U)LIRGs correlates with distance from the main-sequence (Elbaz et al., 2011; Lutz et al., 2016). Indeed, Gómez-Guijarro et al. (2022a) even find high star-formation surface densities in main-sequence, mm-selected galaxies at that also exhibit high star-formation efficiencies. Such galaxies could remain on the main-sequence for 300 Myr - 1 Gyr (Ciesla et al., 2022). The comparable star-formation efficiencies (Fig. 9 Left) and dust properties (Fig. 8) show that the star-forming cores of GOALS galaxies are good local analogs to high (U)LIRGs in terms of their general star-formation properties despite both populations occupying a fundamentally different region with respect to the main-sequence.
The relation between and is consistent with the dependence of both LPAH/ (Fig. 3) and LPAH/LIR,SF (Fig. 8). While these scaling relations illustrate some link between the total dust mass, PAH emission, and star-formation surface densities, the underlying physical association is not yet clear. This is especially true for the complex role played by dust grains in the ISM. Constant LPAH/ suggests that relative to the total dust mass, PAHs are not systematically destroyed in (U)LIRGs at high IR surface densities by strong radiation fields. The low LPAH/LIR,SF ratios at high could be causally linked to the high star-formation efficiencies if the PAHs consistently trace the total dust at all IR surface densities (i.e., ). Indeed, PAH line ratios tracing the ionization state of grains exhibit little scatter amongst (U)LIRGs (e.g., Stierwalt et al., 2014) which could otherwise change the PAH mass-to-light ratio; however, the scatter in the same ratios is higher at (McKinney et al., 2020) and some change in the size distribution of grains is apparent when accounting for the 3.3m PAH feature at (McKinney et al., 2021a). JWST/MIRI MRS could test the PAHs in further detail through high SNR mid-IR spectroscopy. A complimentary approach would be to follow-up Spitzer/IRS targets with ALMA to measure far-infrared lines like [C II] and investigate the potential link between low [C II]/PAH ratios and dust grain properties. This would clarify whether or not changes to the grain properties (i.e., size, charge, PAH mass fraction) are important in regulating the formation of stars within distant and dusty galaxies.
5 Conclusion
Using the ALMA archive, we measure IR sizes () and dust masses for a sample of 15 (U)LIRGs in GOODS-S with existing Spitzer/IRS spectroscopy. We compare these high-redshift galaxies to local luminous IR galaxies in the GOALS survey (Armus et al., 2009) and KINGFISH galaxies with more typical star-formation rates (Kennicutt et al., 2011). We combine the size and dust mass measurements with mid-IR spectral features to assess the degree by which changes in IR surface density drive changes in the total ISM content and conditions. Our main conclusions are as follows:
-
1.
The total dust mass scales with amongst (U)LIRGs along an average dust mass surface density of , corresponding to an average gas mass surface density of assuming a gas-to-dust ratio of 100. We find IR sizes that are smaller for fixed dust mass relative to typical star-forming galaxies selected from the simulated galaxies in TNG50, but the simulation outliers do reproduce this parameter space of high IR surface density dusty galaxies.
-
2.
(U)LIRGs at with measurable AGN contribution to the mid-IR exhibit preferentially smaller far-IR sizes and larger IR surface densities.
-
3.
The / ratio amongst (U)LIRGs does not evolve with redshift suggesting similar PAH mass fractions today and at cosmic noon. PAHs should be used with caution as a total dust mass tracers for (U)LIRGs given the dex scatter about the mean in /; however, this scatter is significantly lower for KINGFISH galaxies at where / correlates with .
-
4.
We find an anti-correlation between the /LIR,SF ratio and at reminiscent of FIR cooling line deficits and down to lower IR surface densities than previously probed. This suggests that changes in ISM conditions regulating the PAH and FIR line emission for galaxies are also likely present in the LIRG population.
-
5.
(U)LIRGs with higher IR surface densities show larger LIR,SF/ ratios, emblematic of more efficient star-formation. We find a trend between and the star-formation efficiency spanning five orders of magnitude in for and galaxies. This trend extends linearly from the KINGFISH galaxies which have lower LIR and more extended IR sizes than the LIRGs and ULIRGs.
-
6.
Whereas galaxies at high IR surface density tend to be further above the main-sequence, we find a weaker correlation between and the distance above the star-forming main-sequence at . In other words, the extent of star-formation for fixed distance above the main-sequence is more varied at than what is found locally. This is consistent with previous works finding high star-formation surface densities for dusty galaxies on the star-forming main-sequence.
Despite occupying fundamentally different regimes with respect to the star-forming main-sequence, the ratios between LIR,SF, total dust mass, PAHs and IR sizes in high- and low-redshift (U)LIRGs are similar. Taken together, the results of this analysis paint a picture of dust-obscured galaxy formation in which the gas and dust conditions set the star-formation conditions, which can increase the star-formation efficiency and support large star-formation rate surface densities. Dust-obscured star-formation at earlier cosmic times may be a scaled up version of what is found locally in the star-forming cores of IR-luminous galaxies, albeit sustained over larger areas and fed by increased gas fractions.
Appendix A Image Cutouts
References
- Allamandola et al. (1989) Allamandola, L. J., Tielens, A. G. G. M., & Barker, J. R. 1989, ApJS, 71, 733, doi: 10.1086/191396
- Andrews & Thompson (2011) Andrews, B. H., & Thompson, T. A. 2011, ApJ, 727, 97, doi: 10.1088/0004-637X/727/2/97
- Aniano et al. (2020) Aniano, G., Draine, B. T., Hunt, L. K., et al. 2020, ApJ, 889, 150, doi: 10.3847/1538-4357/ab5fdb
- Ansarinejad et al. (2022) Ansarinejad, B., Shanks, T., Bielby, R. M., et al. 2022, MNRAS, 510, 4976, doi: 10.1093/mnras/stac002
- Armus et al. (2009) Armus, L., Mazzarella, J. M., Evans, A. S., et al. 2009, PASP, 121, 559, doi: 10.1086/600092
- Bakes & Tielens (1994) Bakes, E. L. O., & Tielens, A. G. G. M. 1994, ApJ, 427, 822, doi: 10.1086/174188
- Barro et al. (2016) Barro, G., Kriek, M., Pérez-González, P. G., et al. 2016, ApJ, 827, L32, doi: 10.3847/2041-8205/827/2/L32
- Beirão et al. (2012) Beirão, P., Armus, L., Helou, G., et al. 2012, ApJ, 751, 144, doi: 10.1088/0004-637X/751/2/144
- Bellocchi et al. (2022) Bellocchi, E., Pereira-Santaella, M., Colina, L., et al. 2022, arXiv e-prints, arXiv:2204.02055. https://arxiv.org/abs/2204.02055
- Bendo et al. (2008) Bendo, G. J., Draine, B. T., Engelbracht, C. W., et al. 2008, MNRAS, 389, 629, doi: 10.1111/j.1365-2966.2008.13567.x
- Biggs & Ivison (2008) Biggs, A. D., & Ivison, R. J. 2008, MNRAS, 385, 893, doi: 10.1111/j.1365-2966.2008.12869.x
- Bradley et al. (2020) Bradley, L., Sipőcz, B., Robitaille, T., et al. 2020, astropy/photutils: 1.0.0, 1.0.0, Zenodo, doi: 10.5281/zenodo.4044744
- Brammer et al. (2012) Brammer, G. B., van Dokkum, P. G., Franx, M., et al. 2012, ApJS, 200, 13, doi: 10.1088/0067-0049/200/2/13
- Buitrago et al. (2008) Buitrago, F., Trujillo, I., Conselice, C. J., et al. 2008, ApJ, 687, L61, doi: 10.1086/592836
- Bussmann et al. (2013) Bussmann, R. S., Pérez-Fournon, I., Amber, S., et al. 2013, ApJ, 779, 25, doi: 10.1088/0004-637X/779/1/25
- Calapa et al. (2014) Calapa, M. D., Calzetti, D., Draine, B. T., et al. 2014, ApJ, 784, 130, doi: 10.1088/0004-637X/784/2/130
- Calistro Rivera et al. (2018) Calistro Rivera, G., Hodge, J. A., Smail, I., et al. 2018, ApJ, 863, 56, doi: 10.3847/1538-4357/aacffa
- Chabrier (2003) Chabrier, G. 2003, PASP, 115, 763, doi: 10.1086/376392
- Chang et al. (2020) Chang, Y.-Y., Le Floc’h, E., Juneau, S., et al. 2020, ApJ, 888, 44, doi: 10.3847/1538-4357/ab595b
- Chapman et al. (2004) Chapman, S. C., Smail, I., Windhorst, R., Muxlow, T., & Ivison, R. J. 2004, ApJ, 611, 732, doi: 10.1086/422383
- Chen et al. (2015) Chen, C.-C., Smail, I., Swinbank, A. M., et al. 2015, The Astrophysical Journal, 799, 194, doi: 10.1088/0004-637x/799/2/194
- Chen et al. (2017) Chen, C.-C., Hodge, J. A., Smail, I., et al. 2017, ApJ, 846, 108, doi: 10.3847/1538-4357/aa863a
- Chen et al. (2021) Chen, Z., Fang, G., Lin, Z., et al. 2021, ApJ, 906, 71, doi: 10.3847/1538-4357/abc9bb
- Chu et al. (2017) Chu, J. K., Sanders, D. B., Larson, K. L., et al. 2017, ApJS, 229, 25, doi: 10.3847/1538-4365/aa5d15
- Ciesla et al. (2022) Ciesla, L., Gómez-Guijarro, C., Buat, V., et al. 2022, arXiv e-prints, arXiv:2211.02510. https://arxiv.org/abs/2211.02510
- Cochrane et al. (2019) Cochrane, R. K., Hayward, C. C., Anglés-Alcázar, D., et al. 2019, MNRAS, 488, 1779, doi: 10.1093/mnras/stz1736
- Cochrane et al. (2021) Cochrane, R. K., Best, P. N., Smail, I., et al. 2021, MNRAS, 503, 2622, doi: 10.1093/mnras/stab467
- Conselice (2014) Conselice, C. J. 2014, ARA&A, 52, 291, doi: 10.1146/annurev-astro-081913-040037
- Croxall et al. (2017) Croxall, K. V., Smith, J. D., Pellegrini, E., et al. 2017, ApJ, 845, 96, doi: 10.3847/1538-4357/aa8035
- Dale et al. (2007) Dale, D. A., Gil de Paz, A., Gordon, K. D., et al. 2007, ApJ, 655, 863, doi: 10.1086/510362
- Dale et al. (2012) Dale, D. A., Aniano, G., Engelbracht, C. W., et al. 2012, ApJ, 745, 95, doi: 10.1088/0004-637X/745/1/95
- Dale et al. (2017) Dale, D. A., Cook, D. O., Roussel, H., et al. 2017, ApJ, 837, 90, doi: 10.3847/1538-4357/aa6032
- Díaz-Santos et al. (2017) Díaz-Santos, T., Armus, L., Charmandaris, V., et al. 2017, ApJ, 846, 32, doi: 10.3847/1538-4357/aa81d7
- Díaz-Santos et al. (2021) Díaz-Santos, T., Assef, R. J., Eisenhardt, P. R. M., et al. 2021, A&A, 654, A37, doi: 10.1051/0004-6361/202140455
- Draine & Li (2001) Draine, B. T., & Li, A. 2001, ApJ, 551, 807, doi: 10.1086/320227
- Draine & Li (2007) —. 2007, ApJ, 657, 810, doi: 10.1086/511055
- Drew & Casey (2022) Drew, P. M., & Casey, C. M. 2022, ApJ, 930, 142, doi: 10.3847/1538-4357/ac6270
- Drory et al. (2004) Drory, N., Bender, R., & Hopp, U. 2004, ApJ, 616, L103, doi: 10.1086/426502
- Drory et al. (2009) Drory, N., Bundy, K., Leauthaud, A., et al. 2009, ApJ, 707, 1595, doi: 10.1088/0004-637X/707/2/1595
- Eisenstein et al. (2023) Eisenstein, D. J., Willott, C., Alberts, S., et al. 2023, arXiv e-prints, arXiv:2306.02465, doi: 10.48550/arXiv.2306.02465
- Elbaz et al. (2011) Elbaz, D., Dickinson, M., Hwang, H. S., et al. 2011, A&A, 533, A119, doi: 10.1051/0004-6361/201117239
- Elbaz et al. (2018) Elbaz, D., Leiton, R., Nagar, N., et al. 2018, A&A, 616, A110, doi: 10.1051/0004-6361/201732370
- Engel et al. (2010) Engel, H., Tacconi, L. J., Davies, R. I., et al. 2010, ApJ, 724, 233, doi: 10.1088/0004-637X/724/1/233
- Forbes et al. (2016) Forbes, J. C., Krumholz, M. R., Goldbaum, N. J., & Dekel, A. 2016, Nature, 535, 523, doi: 10.1038/nature18292
- Franco et al. (2018) Franco, M., Elbaz, D., Béthermin, M., et al. 2018, A&A, 620, A152, doi: 10.1051/0004-6361/201832928
- Franco et al. (2020) Franco, M., Elbaz, D., Zhou, L., et al. 2020, A&A, 643, A30, doi: 10.1051/0004-6361/202038312
- Fujimoto et al. (2017) Fujimoto, S., Ouchi, M., Shibuya, T., & Nagai, H. 2017, ApJ, 850, 83, doi: 10.3847/1538-4357/aa93e6
- Fujimoto et al. (2018) Fujimoto, S., Ouchi, M., Kohno, K., et al. 2018, ApJ, 861, 7, doi: 10.3847/1538-4357/aac6c4
- Galliano et al. (2008) Galliano, F., Madden, S. C., Tielens, A. G. G. M., Peeters, E., & Jones, A. P. 2008, ApJ, 679, 310, doi: 10.1086/587051
- Genzel et al. (1998) Genzel, R., Lutz, D., Sturm, E., et al. 1998, ApJ, 498, 579, doi: 10.1086/305576
- Gómez-Guijarro et al. (2022a) Gómez-Guijarro, C., Elbaz, D., Xiao, M., et al. 2022a, A&A, 659, A196, doi: 10.1051/0004-6361/202142352
- Gómez-Guijarro et al. (2022b) —. 2022b, A&A, 658, A43, doi: 10.1051/0004-6361/202141615
- Gregg et al. (2022) Gregg, B., Calzetti, D., & Heyer, M. 2022, ApJ, 928, 120, doi: 10.3847/1538-4357/ac558a
- Grogin et al. (2011) Grogin, N. A., Kocevski, D. D., Faber, S. M., et al. 2011, ApJS, 197, 35, doi: 10.1088/0067-0049/197/2/35
- Habing (1968) Habing, H. J. 1968, Bull. Astron. Inst. Netherlands, 19, 421
- Hatsukade et al. (2018) Hatsukade, B., Kohno, K., Yamaguchi, Y., et al. 2018, PASJ, 70, 105, doi: 10.1093/pasj/psy104
- Hodge et al. (2015) Hodge, J. A., Riechers, D., Decarli, R., et al. 2015, ApJ, 798, L18, doi: 10.1088/2041-8205/798/1/L18
- Hodge et al. (2016) Hodge, J. A., Swinbank, A. M., Simpson, J. M., et al. 2016, ApJ, 833, 103, doi: 10.3847/1538-4357/833/1/103
- Hogg & Turner (1998) Hogg, D. W., & Turner, E. L. 1998, PASP, 110, 727, doi: 10.1086/316173
- Hollenbach & Tielens (1999) Hollenbach, D. J., & Tielens, A. G. G. M. 1999, Reviews of Modern Physics, 71, 173, doi: 10.1103/RevModPhys.71.173
- Hopkins et al. (2008) Hopkins, P. F., Hernquist, L., Cox, T. J., & Kereš, D. 2008, ApJS, 175, 356, doi: 10.1086/524362
- Ikarashi et al. (2015) Ikarashi, S., Ivison, R. J., Caputi, K. I., et al. 2015, ApJ, 810, 133, doi: 10.1088/0004-637X/810/2/133
- Inoguchi et al. (2020) Inoguchi, M., Hosokawa, T., Mineshige, S., & Kim, J.-G. 2020, MNRAS, 497, 5061, doi: 10.1093/mnras/staa2022
- JADES Team (2023) JADES Team. 2023, JWST Advanced Deep Extragalactic Survey (JADES), MAST/STScI, doi: 10.17909/8tdj-8n28
- Kaasinen et al. (2020) Kaasinen, M., Walter, F., Novak, M., et al. 2020, ApJ, 899, 37, doi: 10.3847/1538-4357/aba438
- Kennicutt (1998) Kennicutt, Robert C., J. 1998, ApJ, 498, 541, doi: 10.1086/305588
- Kennicutt et al. (2003) Kennicutt, Robert C., J., Armus, L., Bendo, G., et al. 2003, PASP, 115, 928, doi: 10.1086/376941
- Kennicutt & Evans (2012) Kennicutt, R. C., & Evans, N. J. 2012, ARA&A, 50, 531, doi: 10.1146/annurev-astro-081811-125610
- Kennicutt et al. (2011) Kennicutt, R. C., Calzetti, D., Aniano, G., et al. 2011, PASP, 123, 1347, doi: 10.1086/663818
- KINGFISH Team (2020) KINGFISH Team. 2020, Key Insights on Nearby Galaxies: A Far-Infrared Survey with Herschel, IPAC, doi: 10.26131/IRSA71
- Kirkpatrick et al. (2015) Kirkpatrick, A., Pope, A., Sajina, A., et al. 2015, ApJ, 814, 9, doi: 10.1088/0004-637X/814/1/9
- Kirkpatrick et al. (2012) Kirkpatrick, A., Pope, A., Alexander, D. M., et al. 2012, ApJ, 759, 139, doi: 10.1088/0004-637X/759/2/139
- Kirkpatrick et al. (2014) Kirkpatrick, A., Calzetti, D., Kennicutt, R., et al. 2014, ApJ, 789, 130, doi: 10.1088/0004-637X/789/2/130
- Kirkpatrick et al. (2017) Kirkpatrick, A., Pope, A., Sajina, A., et al. 2017, ApJ, 843, 71, doi: 10.3847/1538-4357/aa76dc
- Koekemoer et al. (2011) Koekemoer, A. M., Faber, S. M., Ferguson, H. C., et al. 2011, ApJS, 197, 36, doi: 10.1088/0067-0049/197/2/36
- Lai et al. (2022) Lai, T. S. Y., Armus, L., U, V., et al. 2022, arXiv e-prints, arXiv:2209.06741. https://arxiv.org/abs/2209.06741
- Lamperti et al. (2021) Lamperti, I., Harrison, C. M., Mainieri, V., et al. 2021, A&A, 654, A90, doi: 10.1051/0004-6361/202141363
- Laurent et al. (2000) Laurent, O., Mirabel, I. F., Charmandaris, V., et al. 2000, A&A, 359, 887. https://arxiv.org/abs/astro-ph/0005376
- Lutz et al. (2007) Lutz, D., Sturm, E., Tacconi, L. J., et al. 2007, ApJ, 661, L25, doi: 10.1086/518537
- Lutz et al. (2016) Lutz, D., Berta, S., Contursi, A., et al. 2016, A&A, 591, A136, doi: 10.1051/0004-6361/201527706
- Madau & Dickinson (2014) Madau, P., & Dickinson, M. 2014, ARA&A, 52, 415, doi: 10.1146/annurev-astro-081811-125615
- Malhotra et al. (1997) Malhotra, S., Helou, G., Stacey, G., et al. 1997, ApJ, 491, L27, doi: 10.1086/311044
- Malhotra et al. (2001) Malhotra, S., Kaufman, M. J., Hollenbach, D., et al. 2001, ApJ, 561, 766, doi: 10.1086/323046
- Maragkoudakis et al. (2020) Maragkoudakis, A., Peeters, E., & Ricca, A. 2020, MNRAS, 494, 642, doi: 10.1093/mnras/staa681
- Marshall et al. (2007) Marshall, J. A., Herter, T. L., Armus, L., et al. 2007, ApJ, 670, 129, doi: 10.1086/521588
- McKinney et al. (2021a) McKinney, J., Armus, L., Pope, A., et al. 2021a, ApJ, 908, 238, doi: 10.3847/1538-4357/abd6f2
- McKinney et al. (2021b) McKinney, J., Hayward, C. C., Rosenthal, L. J., et al. 2021b, ApJ, 921, 55, doi: 10.3847/1538-4357/ac185f
- McKinney et al. (2020) McKinney, J., Pope, A., Armus, L., et al. 2020, ApJ, 892, 119, doi: 10.3847/1538-4357/ab77b9
- Momcheva et al. (2016) Momcheva, I. G., Brammer, G. B., van Dokkum, P. G., et al. 2016, ApJS, 225, 27, doi: 10.3847/0067-0049/225/2/27
- Mowla et al. (2019) Mowla, L. A., van Dokkum, P., Brammer, G. B., et al. 2019, ApJ, 880, 57, doi: 10.3847/1538-4357/ab290a
- Murphy et al. (2011) Murphy, E. J., Chary, R. R., Dickinson, M., et al. 2011, ApJ, 732, 126, doi: 10.1088/0004-637X/732/2/126
- Nelson et al. (2019) Nelson, D., Pillepich, A., Springel, V., et al. 2019, MNRAS, 490, 3234, doi: 10.1093/mnras/stz2306
- Osman et al. (2020) Osman, O., Bekki, K., & Cortese, L. 2020, MNRAS, 498, 2075, doi: 10.1093/mnras/staa2011
- Pantoni et al. (2021) Pantoni, L., Massardi, M., Lapi, A., et al. 2021, MNRAS, 507, 3998, doi: 10.1093/mnras/stab2346
- Peeters et al. (2004) Peeters, E., Spoon, H. W. W., & Tielens, A. G. G. M. 2004, ApJ, 613, 986, doi: 10.1086/423237
- Pillepich et al. (2019) Pillepich, A., Nelson, D., Springel, V., et al. 2019, MNRAS, 490, 3196, doi: 10.1093/mnras/stz2338
- Pope et al. (2008) Pope, A., Chary, R.-R., Alexander, D. M., et al. 2008, ApJ, 675, 1171, doi: 10.1086/527030
- Pope et al. (2013) Pope, A., Wagg, J., Frayer, D., et al. 2013, ApJ, 772, 92, doi: 10.1088/0004-637X/772/2/92
- Popping & Péroux (2022) Popping, G., & Péroux, C. 2022, MNRAS, 513, 1531, doi: 10.1093/mnras/stac695
- Popping et al. (2022) Popping, G., Pillepich, A., Calistro Rivera, G., et al. 2022, MNRAS, 510, 3321, doi: 10.1093/mnras/stab3312
- Puglisi et al. (2021) Puglisi, A., Daddi, E., Valentino, F., et al. 2021, MNRAS, 508, 5217, doi: 10.1093/mnras/stab2914
- Rémy-Ruyer et al. (2014) Rémy-Ruyer, A., Madden, S. C., Galliano, F., et al. 2014, A&A, 563, A31, doi: 10.1051/0004-6361/201322803
- Riechers et al. (2011) Riechers, D. A., Hodge, J., Walter, F., Carilli, C. L., & Bertoldi, F. 2011, ApJ, 739, L31, doi: 10.1088/2041-8205/739/1/L31
- Rieke & the JADES Collaboration (2023) Rieke, M., & the JADES Collaboration. 2023, arXiv e-prints, arXiv:2306.02466, doi: 10.48550/arXiv.2306.02466
- Rujopakarn et al. (2011) Rujopakarn, W., Rieke, G. H., Eisenstein, D. J., & Juneau, S. 2011, ApJ, 726, 93, doi: 10.1088/0004-637X/726/2/93
- Rujopakarn et al. (2019) Rujopakarn, W., Daddi, E., Rieke, G. H., et al. 2019, ApJ, 882, 107, doi: 10.3847/1538-4357/ab3791
- Rybak et al. (2019) Rybak, M., Calistro Rivera, G., Hodge, J. A., et al. 2019, arXiv e-prints. https://arxiv.org/abs/1901.10027
- Rybak et al. (2022) Rybak, M., Hodge, J. A., Greve, T. R., et al. 2022, arXiv e-prints, arXiv:2207.06967. https://arxiv.org/abs/2207.06967
- Sajina et al. (2007) Sajina, A., Yan, L., Armus, L., et al. 2007, ApJ, 664, 713, doi: 10.1086/519446
- Sajina et al. (2012) Sajina, A., Yan, L., Fadda, D., Dasyra, K., & Huynh, M. 2012, ApJ, 757, 13, doi: 10.1088/0004-637X/757/1/13
- Schmidt (1959) Schmidt, M. 1959, ApJ, 129, 243, doi: 10.1086/146614
- Scott et al. (2002) Scott, S. E., Fox, M. J., Dunlop, J. S., et al. 2002, MNRAS, 331, 817, doi: 10.1046/j.1365-8711.2002.05193.x
- Scoville et al. (2014) Scoville, N., Aussel, H., Sheth, K., et al. 2014, ApJ, 783, 84, doi: 10.1088/0004-637X/783/2/84
- Scoville et al. (2016) Scoville, N., Sheth, K., Aussel, H., et al. 2016, ApJ, 820, 83, doi: 10.3847/0004-637X/820/2/83
- Scoville et al. (2017a) Scoville, N., Lee, N., Vanden Bout, P., et al. 2017a, ApJ, 837, 150, doi: 10.3847/1538-4357/aa61a0
- Scoville et al. (2017b) Scoville, N., Murchikova, L., Walter, F., et al. 2017b, ApJ, 836, 66, doi: 10.3847/1538-4357/836/1/66
- Shangguan et al. (2020) Shangguan, J., Ho, L. C., Bauer, F. E., Wang, R., & Treister, E. 2020, ApJ, 899, 112, doi: 10.3847/1538-4357/aba8a1
- Shapley et al. (2020) Shapley, A. E., Cullen, F., Dunlop, J. S., et al. 2020, ApJ, 903, L16, doi: 10.3847/2041-8213/abc006
- Shibuya et al. (2015) Shibuya, T., Ouchi, M., & Harikane, Y. 2015, ApJS, 219, 15, doi: 10.1088/0067-0049/219/2/15
- Shivaei et al. (2017) Shivaei, I., Reddy, N. A., Shapley, A. E., et al. 2017, ApJ, 837, 157, doi: 10.3847/1538-4357/aa619c
- Shivaei et al. (2022) Shivaei, I., Popping, G., Rieke, G., et al. 2022, ApJ, 928, 68, doi: 10.3847/1538-4357/ac54a9
- Simpson et al. (2015) Simpson, J. M., Smail, I., Swinbank, A. M., et al. 2015, ApJ, 807, 128, doi: 10.1088/0004-637X/807/2/128
- Simpson et al. (2017) —. 2017, ApJ, 839, 58, doi: 10.3847/1538-4357/aa65d0
- Skelton et al. (2014) Skelton, R. E., Whitaker, K. E., Momcheva, I. G., et al. 2014, ApJS, 214, 24, doi: 10.1088/0067-0049/214/2/24
- Smith et al. (2007) Smith, J. D. T., Draine, B. T., Dale, D. A., et al. 2007, ApJ, 656, 770, doi: 10.1086/510549
- Speagle et al. (2014) Speagle, J. S., Steinhardt, C. L., Capak, P. L., & Silverman, J. D. 2014, ApJS, 214, 15, doi: 10.1088/0067-0049/214/2/15
- Spilker et al. (2016) Spilker, J. S., Marrone, D. P., Aravena, M., et al. 2016, ApJ, 826, 112, doi: 10.3847/0004-637X/826/2/112
- Stanley et al. (2017) Stanley, F., Alexander, D. M., Harrison, C. M., et al. 2017, MNRAS, 472, 2221, doi: 10.1093/mnras/stx2121
- Stierwalt et al. (2013) Stierwalt, S., Armus, L., Surace, J. A., et al. 2013, ApJS, 206, 1, doi: 10.1088/0067-0049/206/1/1
- Stierwalt et al. (2014) Stierwalt, S., Armus, L., Charmandaris, V., et al. 2014, ApJ, 790, 124, doi: 10.1088/0004-637X/790/2/124
- Sturm et al. (2000) Sturm, E., Lutz, D., Tran, D., et al. 2000, A&A, 358, 481. https://arxiv.org/abs/astro-ph/0002195
- Sutter et al. (2019) Sutter, J., Dale, D. A., Croxall, K. V., et al. 2019, ApJ, 886, 60, doi: 10.3847/1538-4357/ab4da5
- Symeonidis (2017) Symeonidis, M. 2017, Monthly Notices of the Royal Astronomical Society, 465, 1401, doi: 10.1093/mnras/stw2784
- Symeonidis et al. (2016) Symeonidis, M., Giblin, B. M., Page, M. J., et al. 2016, Monthly Notices of the Royal Astronomical Society, 459, 257, doi: 10.1093/mnras/stw667
- Symeonidis & Page (2018) Symeonidis, M., & Page, M. J. 2018, Monthly Notices of the Royal Astronomical Society, 479, L91, doi: 10.1093/mnrasl/sly105
- Tacconi et al. (2008) Tacconi, L. J., Genzel, R., Smail, I., et al. 2008, ApJ, 680, 246, doi: 10.1086/587168
- Tielens (2008) Tielens, A. G. G. M. 2008, ARA&A, 46, 289, doi: 10.1146/annurev.astro.46.060407.145211
- Tielens & Hollenbach (1985) Tielens, A. G. G. M., & Hollenbach, D. 1985, ApJ, 291, 747, doi: 10.1086/163112
- Tran et al. (2001) Tran, Q. D., Lutz, D., Genzel, R., et al. 2001, ApJ, 552, 527, doi: 10.1086/320543
- U et al. (2012) U, V., Sanders, D. B., Mazzarella, J. M., et al. 2012, ApJS, 203, 9, doi: 10.1088/0067-0049/203/1/9
- Ueda et al. (2018) Ueda, Y., Hatsukade, B., Kohno, K., et al. 2018, ApJ, 853, 24, doi: 10.3847/1538-4357/aa9f10
- van der Wel et al. (2014) van der Wel, A., Franx, M., van Dokkum, P. G., et al. 2014, ApJ, 788, 28, doi: 10.1088/0004-637X/788/1/28
- Weingartner & Draine (2001) Weingartner, J. C., & Draine, B. T. 2001, ApJ, 548, 296, doi: 10.1086/318651
- Whitaker et al. (2014) Whitaker, K. E., Franx, M., Leja, J., et al. 2014, ApJ, 795, 104, doi: 10.1088/0004-637X/795/2/104
- Wu et al. (2005) Wu, H., Cao, C., Hao, C.-N., et al. 2005, ApJ, 632, L79, doi: 10.1086/497961
- Xiao et al. (2022) Xiao, M. Y., Wang, T., Elbaz, D., et al. 2022, A&A, 664, A63, doi: 10.1051/0004-6361/202142843
- Younger et al. (2007) Younger, J. D., Fazio, G. G., Huang, J.-S., et al. 2007, ApJ, 671, 1531, doi: 10.1086/522776
- Zanella et al. (2018) Zanella, A., Daddi, E., Magdis, G., et al. 2018, MNRAS, 481, 1976, doi: 10.1093/mnras/sty2394
- Zavala et al. (2021) Zavala, J. A., Casey, C. M., Manning, S. M., et al. 2021, ApJ, 909, 165, doi: 10.3847/1538-4357/abdb27