Can Twitter be Used to Acquire Reliable Alerts against Novel Cyber Attacks?
Abstract
Time-relevant and accurate threat information from public domains are essential for cyber security. In a constantly evolving threat landscape, such information assists security researchers in thwarting attack strategies. In this work, we collect and analyze threat-related information from Twitter to extract intelligence for proactive security. We first use a convolutional neural network to classify the tweets as containing or not valuable threat indicators. In particular, to gather threat intelligence from social media, the proposed approach collects pertinent Indicators of Compromise (IoCs) from tweets, such as IP addresses, URLs, File hashes, domain addresses, and CVE IDs. Then, we analyze the IoCs to confirm whether they are reliable and valuable for threat intelligence using performance indicators, such as correctness, timeliness, and overlap. We also evaluate how fast Twitter shares IoCs compared to existing threat intelligence services. Furthermore, through machine learning models, we classify Twitter accounts as either automated or human-operated and delve into the role of bot accounts in disseminating cyber threat information on social media. Our results demonstrate that Twitter is growing into a powerful platform for gathering precise and pertinent malware IoCs and a reliable source for mining threat intelligence.
Keywords Cyber Threat Intelligence (CTI) Indicators of Compromise (IoC) Open Source Intelligence (OSINT) Threat Hunting Threat Intelligence
1 Introduction
The threat community is continuously evolving, and recently, the explosive increase in malware attacks has led also to catastrophic situations that make cyber security standards brittle. Recently, Cyber Threat Intelligence (CTI) has emerged as a cutting-edge discipline that leverages sharing of information on cyber threats for fostering a preventive approach to the cyber defense [1]. The main goal of CTI is to disseminate information about recently discovered vulnerabilities, threats, and attacks collected by third-party alliances and to accomplish the remedies quickly. Moreover, CTI will be useful in foreseeing future threats and possibilities by the information available in threat reports and social media. Recently several web-based platforms appeared that provide information and intelligence about threats, vulnerabilities, and adversaries. The information gained from diverse public sources such as social media, hacker forums, technical bulletins, and the dark web is very important for organizations to develop proactive intelligence-based cyber security [2] [3]. For instance, Indicators of Compromise (IoC) extracted from Open Source Intelligence (OSINT) platforms will provide information regarding malicious actions, hints, and proof of a security breach [4]. The IoCs are often used to gain information for cyber forensic procedures: they are observable evidence of compromises that can help to identify the impact of the attack and understand how to cleanse the affected perimeter and restore the operation of affected networks, devices, and services.
CTIs are traditionally derived from official sources, including the National Vulnerability Database (NVD) and the Common Vulnerabilities and Exposures (CVE) database, yet there are substantial gaps between vulnerability notification and NVD publication [5]. OSINT provides early indications of events, vulnerabilities, and exploits as the information is disseminated in real-time. Nowadays, social media can aid security practitioners in acquiring information on cyber threats by conducting threat hunting [6]. Social media is widely used for social engagement, news and information access, and decision-making. Facebook, Twitter, Tumblr, Instagram, and LinkedIn are all well-known names among the general public, and these can be used to connect people from all over the world [7]. Among various social media, Twitter is one of the most rapidly rising social networking services that connect billions of people [8]. Twitter, though several security-related accounts, has become a platform for disseminating up-to-date IoCs and threat intelligence data [6].
There had previously been several studies that examined the potential of leveraging Twitter as an efficient medium for deriving cyber threat intelligence [4] [5] [9]. However, existing studies are mostly focused on the involvement of social media in delivering CTI, with little regard for the reliability of the source of the content. As automated accounts currently overrun social media like Twitter, it is vital to assess the role of automatic accounts in delivering IoCs. The proposed work concentrates on assessing the reliability of threat indicators to design proactive defenses against novel attacks. In this research, we examine the quality and reliability of IoCs to investigate the role of social media in providing accurate threat intelligence information.We propose a detailed investigation of IoCs extracted from Twitter using diverse threat intelligence services and evaluate how precise such IoCs are and how timely intelligence they provide. For this study, we gathered security tweets posted between January 2021 and June 2021. We filtered 58,769 security tweets containing IoCs from 430,187 tweets using a convolutional neural network. With the help of threat metrics such as correctness, timeliness, and overlap, we determine whether Twitter delivers fast and trustworthy threat information. Furthermore, we adopted machine learning and deep learning models to develop an automated system for distinguishing between IoC-related Twitter accounts operated by humans and those that are automated. To enhance the comprehensibility of the results generated by the ML models, we incorporated Explainable Artificial Intelligence (XAI) techniques. Finally, we assessed the proportion of automated accounts that are involved in disseminating information related to security threats. Our findings show that 98.08% of the file hashes mentioned in tweets are reliable IoCs, whereas Twitter delivers 1.27% of novel vulnerabilities that are not present in the NVD database. Moreover, 46.98% of URLs, 28.75% of IP addresses, and 56.77% of domain names indicated in tweets are trustworthy cyber forensic artifacts. Our analysis shows that Twitter may be considered as a threat information-sharing platform that offers early warning of cyber threats compared to other threat intelligence platforms. The major contributions of this paper are summarized as follows:
-
•
We develop an automated method to collect and extract IoCs such as IP addresses, URLs, domain addresses, file hashes, and CVEs from Twitter to investigate whether Twitter delivers threat information about diverse security vulnerabilities.
-
•
We examine the reliability of IoCs disclosed on tweets with the help of threat intelligence services such as VirusTotal, AlienVault, Urlhaus, MalwareBazaar, MISP, and CVE.
-
•
We demonstrate the relevance of Twitter in sharing threat information by measuring metrics like correctness, timeliness, and overlap.
-
•
We create a dataset with different levels of features that includes account-level information, tweet-related information, and temporal information to classify Twitter users as human-operated or automated accounts.
-
•
We implement a generic system to identify the automatic accounts sharing threat indicators using machine learning and deep learning. Furthermore, the model is interpreted using various explainability tools.
The rest of the paper is organized as follows. Section 2 discusses related works. The objectives and proposed methodology is elaborated in Section 3. Section 4 discusses data collection strategy and identification of relevant security tweets. Extraction and analysis of IoCs are described in Section 5. Section 6 gives a detailed description of features generated for identifying adversarial accounts. The implementation and interpretation of the bot classification model are discussed in Section 7. Then, in Section 8, we present findings about the research questions, and Section 9 elaborates discussions. Finally, Section 10 draws the conclusions and future scope.
2 Related Work
In this section, we discuss the related literature about IoCs extraction, IoCs validation, and profile validation.
2.1 IoCs Extraction.
Nowadays, social media can aid researchers in conducting threat hunting (IoC hunting) to generate CTI. Most of the state of the art tried to propose various techniques for extracting CTI data like network IoCs (e.g., URL, IP, and hash address) from threat reports, online articles, and social media. Some research works rely on static CTI extraction. The work done by Liao et al., [10] proposed a tool for extracting IoCs from 71,000 unstructured articles of 45 technical blogs. They utilized Natural Language Processing (NLP) techniques such as Relation Extraction (RE) and Named Entity Recognition (NER) to extract IoCs like IP, hash, and DateTime. Zhu et al.[11] proposed an approach to extract URLs and IP addresses from security articles by leveraging the semantics of malicious campaigns found in threat intelligence reports. In extracting IoCs, their study achieved a precision and recall rate of 91.9 and 97.8, respectively. Furthermore, few researchers focused on descriptive CTI extraction that not only extracts static indicators but also understands the nature of the threats in detail (e.g., attack vectors, tool). For instance, Husari et al. [12] implemented a tool, named TTPDrill, for extracting threat actions from CTI reports using NLP and Information Retrieval techniques. They also created a comprehensive attack model by linking each identified threat action to the corresponding techniques, tactics, and kill chain phases. TTPDrill obtained a precision and recall rate of 84% and 82%, respectively. Zhao et al.[2] extracted IoCs from blogs and news articles and categorized these CTI-related contents based on (i) domain tags like phishing or malware.
Long et al. [13], applied Neural-Based sequence labeling on English and Chinese cybersecurity articles for extracting IoCs. Their model has achieved an average F1-score of 89.0% for English and 81.8% for Chinese articles. Researchers also investigated IoCs over social networks such as Twitter and Facebook. Niakanlahiji et al. [14] conducted experiments on Twitter posts and proposed a system that incorporates graph theory to identify credible Twitter users. They also proposed machine learning algorithms to distinguish CTI tweets from non-CTI tweets and text mining methods to extract IoCs. The study observed that around 10% of identified URLs exist in blacklisted databases when considering real-time extraction, and it increased to 26% after one week. In [15], Sabottke et al. gathered data by searching tweets with CVE identifiers. Since tweets without the CVE ID are disregarded, the system is insufficient to discover possible exploits of other threat-related tweets. iACE is an automated IoC extractor developed by Liao et al. [10] to extract IoC from blogs and forum articles. iACE uses an SVM model to discover relevant sentences from articles that include IoCs by examining the grammatical relationships between IoCs and context words via a graph mining approach.
2.2 IoCs Validation.
As the cyber threat evolves at a rapid rate, security specialists face various challenges when analyzing information that draws from various sources. Multiple steps need to be undertaken to exchange information related to potential cyber threats, which must be completed before the information can be considered actionable CTI. Several sources have discussed threat intelligence’s actionability and observed various traits that contribute to deciding its usefulness. These characteristics include trustworthiness, timeliness, anonymity, relevance, reputation, and the ability to exchange data seamlessly between different systems [1].
Reliability of CTI focused on two aspects (i) the CTI source and (ii) the data provided by these sources. In either case, evaluating the trustworthiness of a CTI transmitted by a source is necessary. Schaberreiter et al. [16] proposed a set of parameters such as similarity, completeness, timeliness, compliance, interoperability, verifiability, false positives, maintenance, and extensiveness to evaluate a CTI source and introduced a trust measure. In another work, Ibrahim et al. [17] investigated the indicator’s quality for assessing the level of contribution made by participants in sharing information for threat intelligence. They evaluated the quality of the indicators by considering factors such as uniqueness, correctness, utility, and relevance.
Researchers in [18] presented an IoC scoring model to diminish the amount of false positives by combining intelligence feeds. They collected the IoCs from several threat intelligence platforms like Cyber Cure, C&C Tracker, Binary Defense, and AbuseIPDB. They computed the extensiveness, timeliness, completeness, and whitelist overlap for each feed and measured the source confidence with each feed. Alves et al. [5] compared multiple vulnerability repositories and Twitter to study the latency with which vulnerabilities were published on various platforms. They found that Twitter generated early security warnings compared to the NVD database. Shin et al. [4] developed a tool for extracting malware IoCs such as IP, Domain, URL, and file hash within Twitter posts. They showed that the performance of Twitter for capturing some malware families like Emotet is better than the other threat intelligence feeds. For each IoC type, they also evaluated the accuracy, latency, and exclusiveness of IoCs against different Threat Intelligent Services such as AlienVault OTX, MalwareBazaar, and Virus Total. They came to the conclusion that extracted IoCs are unique and early.
2.3 Profile Validation.
Several researchers have investigated how to determine the authenticity of social media accounts. Adewole et al. [19] proposed a model for detecting spam messages and accounts in Online Social Networking (OSN). To identify spam messages, they compiled a dataset from three sources: Twitter Spam Corpus, SMS Corpus V.0.1 Big, and SMS collection V.1, which contained 18,000, 1324, 5574 and samples, respectively. Their model relied on 18 features, including content and behavior-based characteristics, and the RF classifier obtained a precision of 0.933 and an area under the curve (AUC) of 0.977. Alom et al. [7] proposed a deep learning strategy for identifying Twitter spammers based on tweets and meta-data such as account age, number of replies, followers/friends, etc., to understand different characteristics affecting the classification. DABot [20] uses a Residual Network (ResNet), an attention mechanism, and a bidirectional Gated Recurrent unit (BiGRU) to recognize social bots and legitimate users. It identifies social bots from humans based on a variety of characteristics, including user-level, interaction-based, time-related, and content-related characteristics.
Bose et al. [21] developed a semi-supervised technique using a Regression model based on user weight calculation, community formation, and central user impact assessment to trace and promote Twitter user profiles that can contribute as instances of CTI-related information based on a collection of supplied seed nodes. Aswani et al. [22] developed a system for detecting Twitter spammers using a bio-inspired algorithm called Firefly. Their system achieved a high accuracy rate of 97.98% and relied on features such as unique words, diversity of hashtag frequency, polarity, etc. Heidari et al. [23] proposed a bot detection model by extracting sentiment features from tweet texts. Their study demonstrated the effectiveness of this approach on Dutch tweets and achieved an accuracy of more than 87%. Rodríguez-Ruiz et al. [24] implemented a one-class classification for better Twitter bot detection. Their experiment showed that this method had a consistent performance in detecting different types of bots, achieving an AUC score above 0.89 without prior knowledge about the bots.
While several studies have explored IoC extraction from blog articles and social media, few of them have investigated the reliability of these indicators. To advance this field, our investigation delves into the accuracy, timeliness, and overlap of IoCs transmitted through Twitter, utilizing popular Threat Intelligence platforms for validation. Additionally, we surpass the current state of the art by examining the prevalence of IoCs common to all platforms to determine the most popular indicators. Notably, no prior research has examined the role of automated accounts in delivering IoCs. Therefore, our study aims to fill this gap by exploring the involvement of these accounts in IoC dissemination.
3 Study Design
In this section, we discuss the objectives and context of the study, the research questions, and the architecture of the system conceived to answer them.
3.1 Objectives and Research Questions
This investigation aims to understand to which extent Twitter can provide data to derive actionable threat intelligence and take appropriate actions to subvert cyber-attacks [25]. The study focuses on three goals: (i) to obtain a characterization of the threat intelligence (i.e., IoCs) delivered with Twitter, (ii) to assess the reliability of the IoCs distributed with security-related Twitter profiles, and (iii) to develop a model for determining the involvement of the automatic accounts in disseminating IoCs. Our three goals have been declined in three research questions as below:
-
•
RQ1: Which kinds of IoCs are mainly transmitted through Tweets?
To provide early alert against novel attacks, a multitude of indicators of compromise is being distributed through social media, including Twitter, blog posts, discussion forums, and other similar platforms. Each of these sources shares different amounts and types of IoCs, among which we can refer to email indicators, host-based indicators, network indicators, and behavioral indicators 111https://resources.infosecinstitute.com/topic/threat-hunting-iocs-and-artifacts/. In this paper, we are focusing on network indicators (such as IP, URL, domain addresses), file hashes, and vulnerability indicators such as CVE ID to measure the relevance of Twitter in cyber threat intelligence. Therefore, with this question, we aim to monitor the kind of network and vulnerability IoCs commonly shared via tweets. -
•
RQ2: To what extent IoCs extracted from Twitter accounts are reliable?
Analyzing the trustworthiness of IoCs derived from tweets is a key step toward understanding how we can leverage Twitter to identify novel attack patterns. Information from Threat Intelligence Services (TIS) is used to validate the reliability of IoCs through diverse performance indicators and to answer specific research questions. To evaluate the significance of social media like Twitter in CTI, we, in particular, evaluate three metrics and describe them based on the following research questions.RQ2.1 - Correctness: What percentage of IoCs are reported malicious by different threat intelligence services?
Correctness determines whether the IoCs mentioned in the tweets are also mentioned by other threat intelligence services. We considered an IoC as malicious if any of the TIS reported it as malicious. Equation 1 is used to compute correctness:(1) where represents the total number of IoCs gathered from the tweets and is the number of IoCs found on Twitter which are also found on other TIS.
RQ2.2 - Timeliness: How fast Twitter shares its IoCs compared to other threat intelligence services?
This measure indicates which sources are usually early in providing threat intelligence relating to the same event. To quantify such measure, we use the following equation:(2) where is the reported date of IoC in security tweets and is the start date of the same IoC in the other threat intelligence services.
RQ2.3 - Overlap: How many IoCs in Twitter exist in other Threat Intelligence Services?
The existence of a single IoC over different TISs indicates its relevancy. This criterion motivates if the information associated with a given IoC is useful to identify a threat. This attribute is calculated by determining the number of IoCs common in different TIS. -
•
RQ3: To what proportion are the automated accounts delivering IoCs through Twitter?
On Twitter, different accounts can provide threat-related information, including legitimate accounts managed by human security experts and automated accounts that rely on bots or scripts. Legitimate accounts may provide a higher proportion of verified and high-quality threat-related data, as they can often perform more nuanced analysis and verification of IoCs before sharing them. However, automated accounts can be beneficial for rapidly detecting and sharing IoCs with security teams and may provide a higher volume of threat-related data overall. This research question determines the proportion of legitimate and automated accounts disclosing IoCs on Twitter. Equation 3 calculates the proportion of automated accounts delivering cyber forensic artifacts.(3) where represents the total number of malicious IoCs reported by automated accounts, and is the total number of malicious IoCs determined using TIS.
3.2 Context Selection
In this section, we describe the context of the investigation and provide background about Twitter, the Indicators of Compromise, and Threat Intelligence as a discipline.
3.2.1 Twitter
Twitter is a popular online microblogging service, and it is used also for discussing news related to different topics, like generic information, politics, economics, entertainment, and technology [26]. Furthermore, Twitter has 396.5 million accounts and 206 million users accessing their accounts daily [27]. Due to the nature of timeliness, diversity, and volume, Twitter seems to be one of the prominent sources for deriving threat intelligence compared to other social media platforms [28]. In [29], Horawalavithana et al. reported that many vulnerabilities are disclosed on Twitter. Recently, many security practitioners have used Twitter to disseminate their findings of threats in the form of IoCs, as well as discuss data breaches, zero-day vulnerabilities, DDoS, and ransomware attacks [6] [30] [15] [31]. For instance, in June 2017, an incident employing NotPetya was mentioned on Twitter prior to getting published by a mainstream source [32].
3.2.2 Indicators of Compromises
Indicators of compromise are observable computer forensic artifacts that are specific to a threat and that can be used to detect an attack and locate the targeted machines. IoCs are usually extracted from OSINT platforms and reveal information about the exploitation and capabilities of adversaries. Network, host-based, and email IoCs are the three predominant types of IoCs that provide information for cyber forensic investigations and give an indication of the attack [33]. Network IoCs, such as URLs and domain names, can be related to Command and Controls or drop servers used in botnets or generally in the communication of malware. Additionally, IP addresses aid in identifying attacks emanating from a known corrupted server; however, IP indicators may last a limited time as attackers are used to frequently moving their servers to other locations. The host-based IoCs comprise hashes of the file, the mutex, the registry keys, and the Dynamic Link Libraries (DLLs). On social media sites, file hashes like MD5 and SHA256 are commonly reported indicators used to recognize the malicious program uniquely, but recently imphash and SHA3-384 have been added. Nowadays, the distribution of malware is spread through email links as well as email attachments, so this forms another type of IoC.
Furthermore, recent studies demonstrated how the detection of advanced persistent threats is made simpler by vulnerability indicators like CVE-ID (Common Vulnerabilities and Exposures entry), a standard index form for known vulnerabilities [5]. A short overview of the vulnerability, along with the release date, can be discovered by the CVE-ID. Hence, gathering and extracting relevant IoCs from sources like articles, hacker forums, blogs, and social media posts, leads to deriving useful CTI that will allow organizations to prepare ahead for attack campaigns.
3.2.3 Threat Intelligence Services
Several Threat Intelligence Services (TIS) are available to gather and organize threat information and IoC. The TIS gathers information from diverse sources on a regular basis to help security analysts investigate threats and provide early warnings about attacks. Nowadays, there are several TIS available online and freely. Researchers utilize VirusTotal to evaluate the files and gather threat information [34]. VirusTotal [35] is one of the reliable TIS, employing 75 antivirus software and 62 domain and website scan engines [36]. Further, AlienVault OTX [37] can be freely accessible to security experts and threat hunters to enable collaborative investigation. Security experts can add suspicious or malicious threat information in the form of a pulse on the AlienVault platform. Both VirusTotal and AlienVault communicate with the server via a unique API key. URLhaus [38] is a project of abuse.ch that captures, monitors, and distributes malicious URLs to assist security experts to protect their systems from cyber-attacks. URLhaus does not require an API key to connect with the server; direct communication can be established. MalwareBazaar [39], like URLhaus, is an abuse.ch project and does not require an API connection to examine IoCs in its database. MalwareBazaar accepts hashes rather than IP, URL, domain, and CVEs compared to other threat intelligence services. The Malware Information Sharing Platform (MISP) is an open-source application that enables the collection and sharing of IoCs along with vulnerability information [40]. In MISP, threat information is reported in the form of events: contextual description, threat level, actors, date, etc. All forms of IoCs, including CVE-ID, are searchable in MISP. On the other hand, the National Vulnerability Database (NVD) focuses primarily on collecting information related to software vulnerabilities. As NVD and the CVE List are fully synced, any revisions to CVE are instantly reflected in NVD. The NIST undertakes the continuing investigation of CVEs and determines threat severity for each vulnerability using Common Vulnerability Scoring System (CVSS) [41]. Further, sandbox environments such as JoeSandbox [42], Any.run [43], and Intezer [44] provide detailed information about malware from which IoCs can be extracted. However, in this study, we employ Threat Intelligence Platforms such as VirusTotal, AlienVault, UrlHaus, MalwareBazaar, MISP, and vulnerability databases like NVD, which were selected based on existing literature [45] [4] [10] [40] [46] and their prevalent usage. The acceptable levels of various indicators of compromise in TISs are summarized in Table 1
| TIS | URL | IP | Domain | Hash | CVE |
| VirusTotal | ✓ | ✓ | ✓ | ✓ | X |
| AlienVault | ✓ | ✓ | ✓ | ✓ | X |
| URLhaus | ✓ | ✓ | ✓ | ✓ | X |
| MalwareBazaar | X | X | X | ✓ | X |
| MISP | X | X | X | ✓ | ✓ |
| NVD | X | X | X | X | ✓ |
3.3 System Architecture
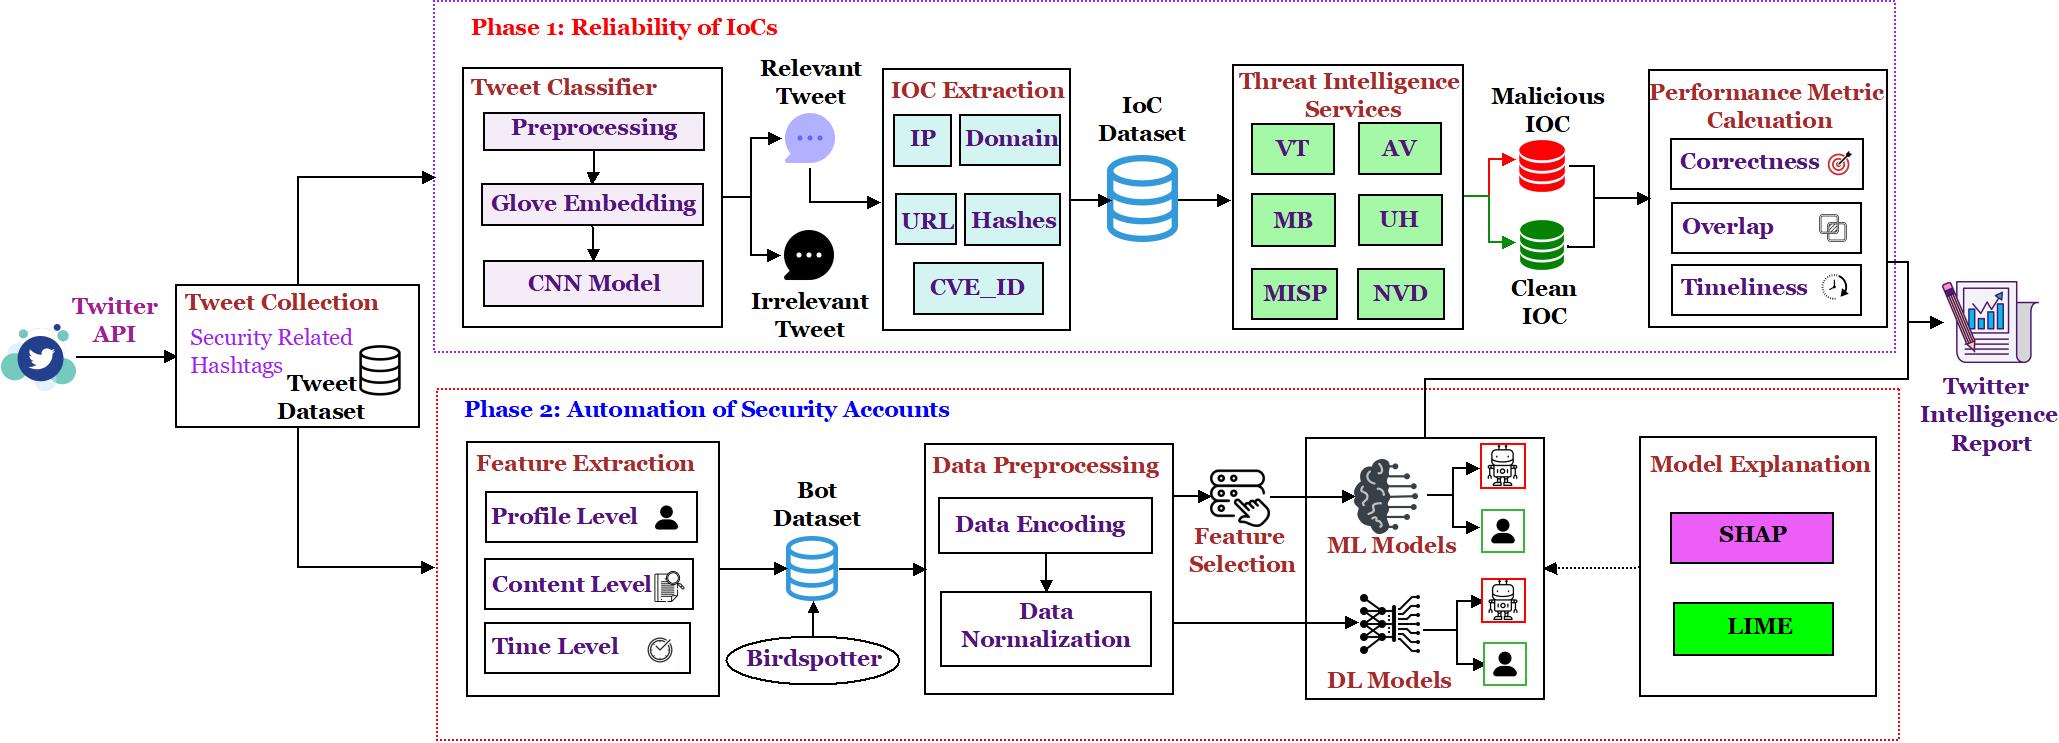
Figure 1 depicts the proposed system for extracting Threat Intelligence from Twitter. The methodology involves two phases namely: Reliability of IoCs (RoIoC) and Automation of Security Accounts (AoSA). In the RoIoC phase, we evaluate the reliability of IoCs and analyze how quickly Twitter distributes threat information aids in formulating actionable threat intelligence. In the initial process, we gathered seven months of security tweets published from January 2021 to June 2021. The process for collecting the tweets is described in Section 4. While we acquired Twitter data as an IoC source for our study, it is possible that we also collected non-security tweets or tweets without IoCs. In our study, we considered a relevant tweet as one that includes an IoC. However, some tweets may be malware tutorial tweets, references to security blogs, or includes URLs such as Facebook, Twitter, and Reddit links that can not be considered valid IoCs. So we regarded tweets without IoCs as irrelevant tweets. To exclude irrelevant tweets, we develop a filtering system based on natural language processing and deep learning models. After identifying relevant tweets, we extract network IoCs and vulnerability IoCs. We employed various TIS, including VirusTotal, AlienVault (OTX2), URLhaus, MalwareBazaar, MISP, and NVD, to extract additional information related to the cyber forensic artifacts. With the help of these TIS, we determine the threat metrics such as correctness, timeliness, and overlap to estimate the reliability of IoC. Subsequently, in the AoSA phase, we examine the involvement of automatic accounts in delivering IoCs. To identify whether an account is an automatic account or a human, we implement Machine Learning (ML) and Deep Learning (DL) algorithms. To develop the bot prediction model, we derive diverse features, including profile, temporal, and content levels from Twitter accounts. Section 3 outlines how the features were generated for account classification and the implementation of the ML and DL models. More importantly, we generate interpretable models which explain the features learned by classification algorithms.
4 Collection and Identification of Security Tweets Carrying IoCs
4.1 Security Tweets
Twitter allows the extraction of any client’s data using the Twitter API and offers access to user profile information such as block lists, user searches, and real-time tweets. As the initial stage of the data collection process, a Twitter developer account was created for accessing Twitter API services and auth credentials. The data collection program automatically harvested 2.41 million tweets(English and non-English) employing the tweepy [47] python module using keyword/hashtag search. We employed a number of hashtags related to cyberspace, including malware, ransomware, botnet, androidtrojan, bankingtrojan, windowstrojan, remoteaccesstrojan, rattrojan, linuxtrojan, adware, spyware, keylogger, rootkit, bootkit, rigek, xploitkit, honeypot, ioc, malspam, crypto-locker, cryptolocker, crypto-ransomware, opendir, c2, md5, sha256, spearphishing, phishing, phishingkit, cyberattack, cve, sqlinjection, 0day, passwordcracker, metasploit, reduc, zombie, C&C, emotet, cobaltstrike, scam, redline, formbook, lokibot, raccoon [48] [49] [4].
Since our study focused on tweets written in English, we excluded non-English tweets from the 2.4 million tweets using the language attribute information obtained from the API response. After the elimination of tweets in other languages, we were left with 1.39 million English tweets. Furthermore, our tweet corpus includes a lot of retweets because Twitter offers a retweet feature that permits users to repost previously posted tweets. It is preferable to remove retweets from the collected tweets because they include duplicate text as the original post. Thus, we omitted the retweets using the API response data and received 445,049 original tweets. Although some duplicate tweets may exist in the dataset, it is important to eliminate them to ensure accuracy. As the posting time of each tweet is a crucial element in our study, we sorted all tweets in chronological order and eliminated duplicates by utilizing the drop_duplicates() method of the data frame. Specifically, we kept only the first occurrence of each tweet. After the elimination, 430,187 unique tweets remained.
4.2 Identification of Relevant Tweets
The straightforward retrieval of tweets using a keyword-based search strategy yields irrelevant tweets like malware tutorials tweets or security blogs. So we implemented a tweet classifier to identify the relevant tweets and exclude tweets without pertinent IoCs.
4.2.1 Preprocessing and Classification
Each tweet is processed through Natural Language Processing (NLP) procedures to extract essential information for classification. The preprocessing procedure comprises (i) lowercase conversion, (ii) removal of mentions, (iii) normalization of all the IoCs, including URLs, IPs, domain names, CVEs, and hashes, to their corresponding types, such as [url], [ip], [domain], [cve], [hash], to aid in recognizing tweets that contain IoCs, (iv) substitution of all defanged IoCs222In order to prevent accidental clicks on harmful links, the IoCs are transformed into another format(i.e., defanged). For example, the defanged representation of http://xn—iconiqcaptal-0fb.com/ is hxxp:/ xn—iconiqcaptal-0fb.com/, while the defanged form of IP address 1.1.1.1 is 1[.][1[.]1[.]1 with [defanged] because a tweet containing a defanged IoC value makes an important feature for classification, (v) removal of non-alpha characters except square brackets, which are used in IoC normalization, (vi) removal of single-character tokens, (vii) lemmatization, and (viii) stopword removal. Later, a deep learning classifier such as 1D-Convolutional Neural Network (CNN) is used to identify relevant tweets. We employ Glove [50], a pre-trained embedding method, to produce numerical feature vectors of 300 dimensions.
4.2.2 Experimentation
Experimental Setup: We used Ubuntu 22.04 LTS system with an i9 CPU and 32 GB RAM to carry out this experiment. Additionally, the matplotlib package displays the analysis results visually. We used the sci-kit learn and the Keras Python tool to build classification models.
Dataset: One Ph.D. student, with the support of two professors having 15 years of experience in cyber security, manually annotated a subset of 32,588 tweets out of 430,187. It is worth noticing that the manually annotated sample ensures a reliable and fair representativeness of the whole data collection (i.e., a confidence level of 99% and a confidence interval of less than 1%). The annotators labeled them based on the presence of IoCs in the tweet, giving a label of 1 for relevant tweets and 0 for irrelevant ones. This process resulted in a final dataset of labeled tweets with 12,400 relevant and 20,188 irrelevant tweets. To train the model, 80% of the labeled data was utilized. The remaining samples were divided equally between validation and testing sets.
Model Creation and Result:
Convolutional Neural Network models have demonstrated their effectiveness in various NLP tasks, including sentence classification [51], document query matching [52], and semantic parsing [53]. The ability of CNNs to automatically learn feature representations from input data makes them particularly useful for accurately classifying tweets into different categories. Furthermore, CNNs can handle variable-length inputs by utilizing convolutions of varying sizes and pooling operations to reduce input dimensionality [54]. So, in this study, we created a 1D-CNN model consisting of six one-dimensional convolution layers, five dropout layers, three max pool layers, and a fully connected layer for tweet classification. Using KerasTuner, we fine-tuned the hyperparameters to determine the ideal values for number filters, kernel size, and learning rate. The resulting model employed convolution layers with filter sizes of 50, 100, and 200 and a kernel size of 3. Finally, we compiled the model using the Adam optimizer with a learning rate set to 0.0001.
We executed the training for 200 epochs and evaluated the performance. Due to the skewed nature of the dataset, we considered F1 score to evaluate the performance. The F1 score is computed by the Equation 4. The detection is determined by using Equation 5.
| (4) |
where True Positive (TP) indicates how often the classifier correctly predicts a tweet as relevant. False Positive (FP) represents how many times the model misclassified a tweet as relevant while it is an irrelevant tweet. False Negative (FN) indicates how many times the model misclassified a tweet as irrelevant while it is a relevant tweet.
| (5) |
The CNN model achieves an F1-score of 98.80% and a detection rate of 99.65%. After the model was developed, we used the CNN model to predict the label (i.e., relevant or irrelevant) for the unlabeled tweets. As the result of CNN prediction, a total of 58,769 tweets are identified as relevant, and the remaining 371,418 tweets are predicted as irrelevant.
5 Extraction and Analysis of IoCs using TIS
5.1 IoC Extraction
The IoC extractor automatically retrieves IoCs from the relevant security tweets by using a regular expression. We adopted the iocextract [55] library to extract IoCs and handle defanged forms as Twitter defanged the suspicious IoCs to protect users from unintentionally visiting a harmful hyperlink. Additionally, Twitter URLs are often shortened; therefore, in order to improve readability and effectiveness, we expanded the abbreviated URLs obtained as the response from the API response. To create a pertinent IoC dataset, certain unnecessary URLs like Tweet URLs, Facebook and Youtube URLs (see Table 2), and similar ones are also purged.
| Type | Regular Expression |
|---|---|
| \hlineB1.6 Twitter | (?:http?:\/\/)?(?:www\.)?twitter\.com\/(?:(?:\w)*#!\/)?(?:pages\/)?(?:[\w\-]*\/)*([\w\-]*) |
| (?:https?:\/\/)?(?:www\.)?(mbasic.facebookm\.facebookfacebookfb)\.(comme)\/(?:(?:\w\.) *#!\/)?(?:pages\/)?(?:[\w\-\.]*\/)*([\w\-\.]*) | |
| Youtube | (?:https?:\/\/)?(?:www\.)?youtu\.?be(?:\.com)?\/?.*(?:watchembed)?(?:.*v=v\/\/)([\w\-_]+)&? |
Table 2 shows the regular expression used to eliminate the irrelevant URLs. Furthermore, it is usual to requote someone else’s tweet, and the likelihood of the same IoCs appearing more than once is common. So, we arranged the IoCs chronologically and generated unique IoCs by removing duplicate records. As a result of IoC Extraction, we generated a dataset containing 90,991 IoCs from 58,769 tweets with the following fields: user name, published date, IoC value, IoC type, hashtags, and tweet URL. Table 3 shows how often IoCs were reported on Twitter from January 2021 to July 2021. According to these statistics, IoCs are highly reported in the month of April 2021, and URLs contribute the most.
| Month | URL | IP | Domain | Hash | CVE | Total |
|---|---|---|---|---|---|---|
| January 2021 | 8986 | 2708 | 852 | 1602 | 260 | 14408 |
| February 2021 | 10500 | 1639 | 855 | 565 | 270 | 13829 |
| March 2021 | 10767 | 1324 | 833 | 302 | 286 | 13512 |
| April 2021 | 10029 | 2332 | 1350 | 661 | 230 | 14602 |
| May 2021 | 8457 | 2158 | 918 | 727 | 308 | 12568 |
| June 2021 | 6440 | 1675 | 927 | 282 | 259 | 9583 |
| July 2021 | 8134 | 2128 | 1541 | 406 | 280 | 12489 |
| Total IoC | 63313 | 13964 | 7276 | 4545 | 1893 | 90991 |
5.2 Meta Data Information about IoC from TIS
The IoCs extracted from the tweets are queried in various engines such as Virustotal, AlienVault, Urlhaus, Malwarebazaar, MISP, and NVD to determine whether Twitter discloses a significant amount of security vulnerabilities, as well as Twitter gives early warnings about cyber threats. We defined a threshold of one in VirusTotal, which indicates that if any antivirus engine report that an IoC is harmful, then we consider the IoC as malicious. In the case of AlienVault, we used information such as pulse, google safe browsing, and antivirus reports to determine if an IoC is harmful. Both UrlHaus and MalwareBazaar employ database-based approaches that store a substantial amount of malicious indicators in their database. If the IoCs are found in the UrlHaus and MalwareBazaar database, we regard them as malicious since both of these engines do not keep the benign IoCs. Moreover, MalwareBazaar exclusively focuses on hashes and only gives information about them. All forms of IoCs or attributes, including CVE-IDS, are scannable in MISP through PyMISP. The PyMISP package for Python enables fetching events, adding or modifying events/attributes, and searching for attributes. We can interpret the IoC as a malicious indicator if the attributes are reported in any of the events. Each IoC was submitted to various TISs and a report was prepared that segregates them as clean or malicious. As we previously noted, the NVD and the CVE list are strongly linked, and any updates to the CVE list are immediately replicated in the NVD. However, there is still a time gap between the publishing date in these databases since CVE is allocated an identifier immediately when a threat occurs, without waiting for additional analysis. We use diverse TIS to collect information in the form of the first reported date, attack category, file types for hashes, etc. These details are also recorded for malicious IoCs in order to compute metrics such as correctness, timeliness, and overlap. The details about the number of malicious and clean IoCs obtained from TISs are summarized in Table 4.
| IoC Type | VT | AV | UH | MB | MISP | NVD | ||||||
| M | C | M | C | M | NF | M | NF | M | NF | F | NF | |
| URL | 29730 | 33583 | 34 | 63278 | 77 | 63236 | NA | NA | 49 | 63264 | NA | NA |
| IP | 3035 | 10929 | 1596 | 12368 | 290 | 13674 | NA | NA | 516 | 13448 | NA | NA |
| Domain | 4108 | 3168 | 183 | 7093 | 167 | 7109 | NA | NA | 63 | 7213 | NA | NA |
| Hashes | 4417 | 128 | 4223 | 322 | 348 | 4197 | 639 | 3906 | 2004 | 2541 | NA | NA |
| CVE | NA | NA | NA | NA | NA | NA | NA | NA | 101 | 1792 | 1869 | 24 |
| (%) | 46.34 | 53.66 | 6.77 | 93.23 | .99 | 99.01 | 14.06 | 85.94 | 3.00 | 97.00 | 98.73 | 1.27 |
∗ VT- VirusTotal, AV - AlienVault, UH - UrlHaus, MB - MalwareBazaar
∗ M- Malicious, C - Clean, F - Found, NF - Not Found, NA - Not Applicable
Based on our analysis, VirusTotal reports a higher number of IoCs if compared with the other intelligence services. In comparison to others, this platform gives 46.34% of indicators as malicious and reports almost all file hashes as malicious. When the entire inputs are examined in the AlienVault, it returns only 6.77% of IoCs as malicious and remaining as clean. Similar to the AlienVault platform, Urlhaus and MISP report a few of the indicators as malicious. However, AlienVault and MISP recognize 92.91% and 44.09% of file hashes as malicious, respectively. MalwareBazar reports that 14.06% of file hashes retrieved from Twitter are malicious. Furthermore, 98.73% of the vulnerability indicators stated on Twitter are already available in the National Vulnerability Database. However, in our analysis, we found 24 CVE IDs (approximately 1.27% of the total) mentioned on Twitter that are not (yet) included in NVD. We manually verified those 24 CVE IDs in the MITRE CVE list [56] and found that 20 were reserved by an organization or individual for use in announcing a new security vulnerability, one was considered an adversarial sample, and the remaining three were determined to be novel vulnerabilities. These novel vulnerabilities included a credential exposure flaw in the Ansible module (CVE-2021-20180), a mutation XSS vulnerability affecting certain combinations of tags with the bleach.clean function in Python (CVE-2021-23980), and an improper certificate validation vulnerability in Dell EMC Unisphere for PowerMax versions (CVE-2021-21548).
6 Generation of Dataset for AoSA
6.1 Feature Generation
We adopted Machine Learning (ML) and Deep Learning (DL) models for identifying accounts as human/automated accounts. To ascertain this, we derived attributes that are extracted from user profiles and tweet content. The details about the features for the classification of accounts as human or automatic accounts are discussed below.
| Level | Symbol | Feature | Reference |
| Profile | Following Count | [57],[58],[7],[59] | |
| Profile | Followers Count | [7],[7],[59] | |
| Profile | Followers Ratio | [60],[7],[20],[59] | |
| Profile | Listed Count | [59] | |
| Profile | Length of Description | [61],[59] | |
| Profile | Profile Image | [61] | |
| Profile | Age of Account in Days | [58],[7],[59] | |
| Profile | Listed Count per Day | [59] | |
| Profile | Reputation | [62],[7],[59] | |
| Profile | Protected | ||
| Profile | Verified | ||
| Content | Number of Tweet | [57] | |
| Content | Number of Retweet | [57] | |
| Content | Average length of Tweets | [59] | |
| Content | Standard Deviation of Length of Tweets | [63],[59] | |
| Content | Average Number of Post Containing URLs | [64] | |
| Content | Number of Words Per Tweet | [65],[7] | |
| Content | Number of Digits Per Tweet | [66],[7] | |
| Content | Username Mention Ratio | [67],[60],[59] | |
| Content | Unique Mention Ratio | [68],[59] | |
| Content | Number of Hashtag per tweet | [59] | |
| Content | URL ratio | [57],[59] | |
| Content | Retweet Ratio | [20],[59] | |
| Content | Unique Post Ratio | [59] | |
| Content | Mean of Like, Quote, Reply, Retweet Count | [69],[20] | |
| Content | No of Unique Source | [68] | |
| Content | Unique Source Ratio | [20],[59] | |
| Content | Tweet Similarity | [70],[59] | |
| Time | No.of Post Per Day | ||
| Time | Maximum Time Interval Between Tweets, Retweets, Post | [20],[59] | |
| Time | Minimum Time Interval Between Tweets, Retweets, Post | [20],[59] | |
| Time | Mean of Time Interval Between Tweets, Retweets, Post | [70],[20],[59] | |
| Time | Standard Deviation of Time Interval Between Tweets, Retweets, Post | [20],[59] | |
| Time | Idle Hours | [7],[59] | |
| Time | Post Time Pattern | [20] | |
| Time | Burstiness | [71],[20] |
-
1.
Profile Level Features
Profile level features are related to the user’s profile information and the account activity: the complete list is provided in Table 5.: Followers Count: On social media, a user’s number of followers () typically reflects the level of trust that people have in them. Except for famous personalities/celebrities, members in the followers’ group who are genuine users typically know one another in real life. Legitimate users typically have a high number of followers, which may be used to classify people as spammers or benign [57] [58].
: Following Count: The authors of [7] adopted this feature in their study. For the purpose of being spotted, spammers frequently follow more profiles quickly. The number of followings, also known as friends count indicated by .
: Followers Ratio: It is the proportion of the number of followers and the number of followings of the user. Spammers have fewer followers than human users because no one directly knows them in real life [60]. Also, there are more followings than real users, implying that accounts that are bots have a lower ratio.
(6) where nF oS represents the number of followers of a particular user, and nF indicates the number of followings.
: Listed Count: The listed count () gives the popularity of a Twitter account by estimating the number of users included in other people’s lists. The value of this feature is often high for legitimate users and low for spammers.
: Protected and Verified: A protected and verified feature logically gives an indication of the behavior of the account. Protected () specifies if the Twitter profile is private, and verified () indicates whether or not the profile is verified by Twitter. Typically, spammers leave their profiles unprotected. Both of these features have boolean values: True or False.
: Length of Description: It is the number of characters of the description displayed on the Twitter Profile page. It is observed that the descriptions of automatic accounts are often blank, so their description length is close to zero [61]. The length of the description is represented as .
: Profile Image: It indicates the presence of profile image. A bot account is less likely to alter its default profile picture [61]. So the value of this feature () is usually false for the spammers and true for genuine users.
: Age of Account in Days: As bot accounts are terminated and disabled by Twitter, the lifespan of spam accounts on Twitter is generally shorter than that of actual users. As a result, spam accounts are typically created more recently than real users [58]. The age of the account is the difference between the current date and the profile’s creation date on Twitter.
(7) : Listed Count per Day: It shows how many users add a particular user to their list in a single day. This ratio is expressed using Equation 8:
(8) : Reputation: One of the key indicators for determining if a Twitter account is legitimate or a bot is estimated by computing reputation score [62], which is determined using the Equation 9 below:
(9) where indicates the reputation score of the user, is the number of followers, and represents the number of followings. In general, famous accounts, such as celebrities, have a large number of followers but few followings, yielding a score close to one. On the contrary, for a genuine account, the following and follower counts are nearly equivalent. However, in the case of spammers, the follower count is lower, and the following count is larger, implying a reputation score close to zero.
-
2.
Content Level:
Social bots typically send similar-sounding tweets with inconsistent grammar and illogical writing patterns. We determined the following content-based features to classify Twitter users as human or automatic accounts.: Number of Tweets, Retweets: It is incredibly challenging for bots to replicate human tweeting behavior. In most cases, the bots deliver tweets from the database or publish them using a probabilistic method like the Markov chain algorithm, or they retweet rather than tweet. Twitter bot accounts frequently send out a large number of tweets to accomplish their goal before they are discovered and blocked. This feature is indeed strong as it focuses on the spammers’ typical pattern of behavior. Furthermore, the automated spammers’ propensity for retweeting can be used to distinguish automatic accounts from humans [57]. The total number of tweets by the user is counted from the date of creation of the Twitter account and represented as . The number of retweets () is determined by counting the number of tweets that start with RT.
: Average Length of Tweets: With the use of this feature, we can determine how well a user posts tweets, i.e., around the same length or dynamic length. It computes the average length of tweets posted by a user.
(10) where is the average length of tweets, and represents length of tweet.
: Standard Deviation of Length of Tweets: In [63, 72], researchers found that automatic accounts have a lower standard deviation of tweet lengths, compared to humans, which implies that the bot accounts are probably posting identical or similar information. This attribute is determined using Equation 11.
(11) : Average Number of Post Containing URLs: Spammers generally employ URLs in their tweets, such as advertisements, phishing sites, and redirect links to other websites. The number of tweets, consisting of URLs, is higher among spammers than among legitimate accounts, and this tendency is used to analyze the bot behaviour [64, 72]. It is determined by using Equation 12.
(12) where indicates the average number of posts containing urls, is the total number posts that contains urls, indicates total number of tweets, and represents the total number of retweets.
: Number of Words in Tweet: It is the number of words contained in the tweets for a specific account, denoted by . In [65], the researchers suggest that non-spammers employ a significant amount of words in their tweets.
: Number of Digits Per Tweet: This attribute determines the number of digits per tweet. The bots often use less number of digits compared to benign users [66].
(13) where represents the number of Digits Per Tweet, is the number of digits used in the tweets posted by a user, and is the total number of tweets for the same account.
: Username Mention Ratio: Spammers take advantage of the username mentions functionality to propagate spam messages [67] quickly. A user is regarded as a spam account if their tweets have a lot of mentions and reply tags [60]. The number of mentioned usernames is determined by the API response, represented as . The mention ratio is mathematically represented as:
(14) where is the mention ratio, total number of mentioned username, and represents the total number of tweets.
: Unique Mention Ratio: Prior studies reported that benign accounts typically post tweets by mentioning a small number of unique usernames [68]. A high unique mention ratio suggests that the user is engaged in frequent mentions of unique usernames, which signifies that the account is probably a bot. The unique mention ratio is determined by:
(15) where represents the unique mention ratio, total number of unique mentions, and indicates the total number of tweets.
: Number of Hashtag per tweet: In order to enhance the likelihood that their tweets will be searched, bots frequently include hashtags in their tweets. Therefore, figuring out how many hashtags were mentioned in their tweets adds more significance to the classification phase. It is the ratio of the number of hashtags included in tweets to the number of posts and denoted by
: URL ratio: To spread more stuff on Twitter, an automatic account often transmits more URLs in their tweets that sometimes direct to harmful sites. For spammers, inserting URLs is absolutely essential because they cannot fulfill their goals if they do not include URLs in their tweets [57, 72]. The URL ratio (), which is the ratio of the number of URLs to the number of tweets, has a high value for spammers but a low value for benign users.
: Retweet Ratio: The retweet ratio () is the proportion of the number of retweets to the total number of tweets and retweets posted by a specific user.
(16) where represents the retweet ratio, indicates the number of retweets for a specific user, and & are the number of tweets and retweets posted by a user.
: Unique Post Ratio: Spammers frequently retweet and send similar tweets. As a result, a spammer has fewer unique tweets than a benign tweeter.
(17) where represents the Unique Post Ratio, is the total number of unique posts, and & indicates the total number of tweets and retweets.
: Mean of Like, Quote, Reply, Retweet Count: It is possible that the spammers’ tweets will receive fewer retweets and likes than those of genuine users because their tweets are unsolicited in nature. Furthermore, as real users often avoid tweets from bot accounts, posts of an automatic account receive fewer replies, quotes, and mentions [69].
(18) where denotes the mean of Like/ Quote/ Reply/ Retweet Count, indicates the total number of tweets of a particular user, represents the number of Like/ Quote/ Reply/ Retweet obtained for the tweet.
: No of Unique Source: The tweets can be posted through various sources like an API interface, a web application, an HTTP interface, a blogging platform, etc. A legitimate user might not always limit publishing tweets from a specific source. But the bots could limit their tweets to a few sources because of scale and automation-related considerations [68]. So, the number of unique sources () used by accounts gives insight into the botness level. The more number of unique sources implies the more likely the account is to be genuine.
: Unique Source Ratio: It is the ratio between the total number of unique sources used by one user and the total number of unique sources used by all users. Since the benign users use multiple sources, the ratio will be higher for the real users. It is defined as:
(19) : Tweet Similarity: The tweet’s content determines the account’s spamming behavior. If an account’s tweets are similar, it is more likely that it is a spammer [70]. The cosine similarity of the tweets measures how closely the tweets are related, and a greater score for this feature suggests that the account could be a spam account.
(20) where indicates dot product of two tweets, and indicates norm.
-
3.
Time Level
The published time of the tweet can be used to extract various time-based information. The temporal distribution of postings has been seen to differ among spammers and legitimate users. We extracted 16 temporal features.: No.of Post Per Day: The amount of tweets and retweets shared by spammers in a day is often higher than that of non-spammers. Therefore, we adopted this feature for identifying bot users, and it is the ratio of the number of posts (both tweets and retweets) to their account age.
(21) : Maximum Time Interval Between Tweets, Retweets, Post: Spammers typically may not tweet for a prolonged amount of time after publishing a significant number of posts in a short period of time [20]. So, we considered the minimum and the maximum time interval between tweets as a feature to classify bots from non-bot users.
(22) where is the maximum time interval between two consecutive tweets, retweets, or both tweets and retweets.
: Minimum Time Interval Between Tweets, Retweets, Post: Similar to the maximum time interval between tweets, the minimum time gap between consecutive tweets is a significant factor for bot classification [20].
(23) where indicates the minimum time gap between two consecutive tweets, retweets, or both tweets and retweets.
: Mean of Time Interval of Tweets, Retweets, Post: Bot users constantly disseminate spam data, whereas human individuals tweet at random times, typically during their leisure time [70]. The average duration between tweets has the potential to affect the behavior of the bot.
(24) : Standard Deviation of Time Interval Between Tweets, Retweets, Post: Like mean of the time interval of tweets, Wu et al. [20] also employed this feature in their study. Hence, we also used the standard deviation of the time interval between tweets to accomplish bot detection.
(25) where is the standard deviation of time interval between tweets, indicates time interval between two consecutive tweets, and represents the mean of time interval.
: Idle Hours: The one objective of an automatic account is to post messages continuously. So, determining the idle hours of a user aids in examining the behavior of an automatic account. The idle hours are determined by the following formula, and it is typically lower for the bot accounts [59].
(26) : Post Time Pattern: The majority of bots were discovered to automatically publish posts(both tweets and retweets) at predetermined intervals using the web interface or Twitter APIs [20]. This trend suggests a reduced entropy for the duration between tweets. The post-time pattern is determined using the Shannon entropy mechanism, and the formula is provided below.
(27) where is the probability of time interval.
: Burstiness: Human activities show significant diversity, which means that people sometimes tweet quickly and some other times take a longer period between tweets [71]. This nature is determined by the burstiness feature, and it is mathematically represented as follows:
(28) where is used to ensure that the burstiness value is non-negative, the value of the burstiness maybe or or . If the value is , it reflects entirely normal behavior, denotes totally Poisson activity, and indicates the most bursty conduct. In general, spammers tend to follow values close to and .
6.2 Data Labeling
The feature generation phase delivers a data set with 47 features. Compared to generic social media users, accounts delivering threat intelligence information may exhibit odd features (e.g., regularities in the content of tweets, including a high presence of malicious URLs, abnormal social networks, and unusual posting behaviors). Such odd features may lead general-purpose automated solutions to biased bot-detection outcomes. For this reason, we decided to design a new AI-enabled approach specialized in distinguishing between human-operated and bot-driven IoC-related Twitter accounts. To build supervised ML/DL models, we need a labeled dataset. Initially, we tried to label Twitter users as automatic accounts or human-operated by inspecting their profiles manually. But this was a very tedious and time-consuming task as it required going through a lot of textual content, including tweets and descriptions, and also considering other non-textual aspects related to the user. Due to the challenging nature of manual labeling, we decided to employ an available automated tool to be aided in the process.
The Botometer [73] tool has been used in many studies to detect accounts as human or bot [74],[75]. However, profiles that are no longer available, such as suspended accounts, cannot be predicted by Botometer to be bots. This is troublesome because Twitter frequently suspends bot-driven accounts, and measuring botness after a certain time runs the risk of missing a sizable portion of bots. In [76], Ram et al. proposed the Birdspotter tool which works better than Botometer in terms of mean F1 scores and botness scores. So we adopted Birdspotter for labeling the account as human-operated or automatic.
The Birdspotter tool generates a botness score (between 0 and 1) for each Twitter account. We calculated the botness score for each Twitter account in the dataset using the Birdspotter tool. The botness score near 1 indicates a high likelihood of being a bot, while a score close to 0 represents a low likelihood of being a bot. To determine the appropriate threshold for annotating the accounts, we manually reviewed a subset of Twitter accounts with botness scores near 0.5, 0.65, 0.80, 0.85, 0.90, and 0.95. Then, the account is examined on Twitter, and a decision is made by evaluating the profile description and existence of the account. After reviewing a substantial number of Twitter accounts, we defined a threshold of 0.95. Twitter users with a botness score above or equal to 0.95 are labeled as 1; otherwise, they are marked as 0. After annotation, we generated a dataset with 47 attributes that included 81,161 legitimate users and 16,301 bots (according to the threshold-based labeling).
6.3 Data Preprocessing
Data preprocessing is an essential step in machine learning models because the quality of the data and relevant information has a direct impact on model performance. So we have performed preprocessing techniques such as data encoding and data normalization. The data normalization helps in transforming the categorical attributes into a machine-understandable format. Our dataset contains two categorical attributes: protected and verified. So, we converted the verified and protected boolean values to binary by mapping the False to 0 and the True to 1. Furthermore, the min-max normalization is performed on the dataset to scale each feature value between 0 and 1.
7 Evaluation of AoSA using Classification Models
7.1 Feature Selection
The model performance is adversely affected by redundant or correlated features; therefore, feature selection techniques aid in filtering out irrelevant features. Feature selection minimizes storage requirements and prevents overfitting by eliminating unnecessary features. We have employed the SelectKBest feature selection technique, which outputs the attributes according to the highest score ( value defines the number of best features). The value of obtained in one classifier is not appropriate for another because each ML classifier has a unique nature and operates differently depending on various parameters. Therefore, we applied the SelectKBest approach to each machine classification model. Additionally, we evaluated the effectiveness of the classifier for various values of (1 to 47). We fix the for a particular classifier by assessing the performance of the classifier. Conversely, there is no need to perform feature selection on deep learning models since DL classifiers inherently extract pertinent features in their layers.
7.2 Classification Algorithms
As bots become more sophisticated, their behavior may evolve and become harder to detect. Therefore, it is advisable to use machine learning to implement a bot detection solution. Machine learning algorithms can learn from a more diverse range of characteristics and data points than heuristic-based methods, resulting in greater precision in identifying accounts driven by bots. The self-build classifier can adapt to add features and changes more easily and identify new patterns of bot behavior that may not be captured by BirdSpotter. In comparison to BirdSpotter, we have integrated more features, such as temporal features, reputation, the average length of tweets, retweet ratio, number of digits per tweet, number of words per tweet, that are not taken into account in BirdSpotter. In this study, we employed six ML classifiers and two DL models to classify IoC-related Twitter accounts as bot-driven or human-operated. With the help of various ML and DL classifiers such as K-Nearest Neighbor (KNN), Logistic Regression (LR), Support Vector Classifier (SVC), Decision Tree (DT), Random Forest (RF), XGBoost, Deep Neural Network (DNN), and Convolutional Neural Network (CNN) we determined whether Twitter account as human or automatic account. All models have one or more hyperparameters that need to be tuned to get the optimum results. We applied hyperparameter tuning mechanisms such as RandomizedSearchCV and GridSearchCV to determine the best parameter values for the classifiers.
7.3 Experimentation Result
The dataset was split into an 8:2 ratio, with 80% used for training and 20% reserved as the test set to evaluate the model’s performance. To improve the performance of the models, we tuned the parameters. The selected hyperparameter values are summarized in Table 6.
| Model | Hyper Parameter |
|---|---|
| \hlineB1 KNN | metric=manhattan, n_neighbors=102, p=1, weights=distance |
| LR | C=10, penalty=none |
| SVC | C=4000, class_weight=balanced, gamma=1 |
| DT | max_depth=80, max_features=0.8 |
| RF | class_weight=balanced_subsample, criterion=entropy, max_depth=60, min_samples_leaf=2, min_samples_split=5, n_estimators=2400 |
| XGBoost | learning_rate=0.01, gamma=3.2, max_depth=30, min_samples_leaf=1, min_samples_split=10, n_ estimators=1600 |
| DNN | optimizer = adam, learning_rate = 0.0001 |
| 1D-CNN | Conv1D layers = 2, dropout layer = 1, dropout = 0.5, max pooling layer = 1, dense layer = 3, filters=64, kernel_size=3, optimizer = adam, learning_rate = 0.0001 |
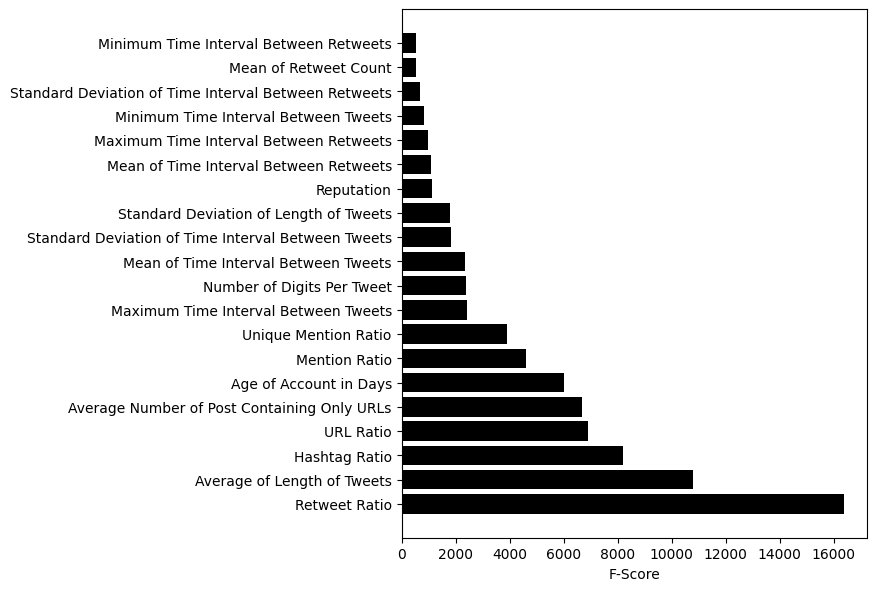
We implemented six ML and two DL models and subsequently compared the performance of each classifier using the performance metric F1-score. Here, we adopted F1-score instead of accuracy due to the class imbalance of the dataset, i.e., there are fewer bot samples compared to benign samples. To improve classifier performance, we performed feature selection on each ML classifier and estimated the optimal features. Table 7 reports the performance of models in two scenarios: with a complete set of features and features. We observed that after feature selection, there was a slight improvement in the F1-score. Furthermore, we explored how well the number of important features differs across classifiers. For KNN, the classification produces the best results when we choose the 17 features with the F1-score of 88.2%. Also, the Logistic Regression, SVC, and DT perform well when 39, 24, and 29 attributes are used, respectively. For random forest, the F1 score increases slightly when we select approximately all features, say 46. XGBoost, on the other hand, delivers the same outcome with and without feature selection. The ranking of features according to the f-score obtained from SelectKBest algorithm is depicted in Fig 2. The most relevant features found are Retweet Ratio, Average length of Tweets, Hashtag ratio, URL ratio, Age of Account, Length of Description, Text Time Pattern, Tweet Similarity, and so on. From Table 7, we inferred that XGBoost achieved higher performance with an F1-score of 90.96% compared to other classifiers.
| Model | F1-Score | Feature Selection | |
|---|---|---|---|
| K value | F1-Score | ||
| KNN | 87.93 | 17 | 88.2 |
| LR | 88.15 | 39 | 88.18 |
| SVC | 85.15 | 24 | 85.32 |
| DT | 87.87 | 29 | 88.36 |
| RF | 90.91 | 46 | 90.95 |
| XgBoost | 90.96 | 46 | 90.96 |
| DNN | 89.43 | NA | 89.43 |
| 1D-CNN | 89.57 | NA | 89.57 |


To understand whether our model can achieve more precise results than a threshold-based solution on the botness score provided by Birdspotter, we manually analyzed all disagreements in the classification of Twitter accounts that occurred between the XGBoost model and the labeling operated through Birdspotter. To this aim, out of 19,493 accounts in the test set, we identified 1,722 disagreements. In particular, from these disagreements, our model identified 641 accounts as automated, which were labeled as humans through Birdspotter. Conversely, our model predicted 1,081 accounts as humans, which were automated according to the Birdspotter-based labeling. During our manual analysis, we made decisions based on the factors such as the profile picture, account description, location, and tweet activities. The labeling was done by a Ph.D. student and two professors with expertise in cybersecurity. Accounts were manually labeled as belonging to seven categories that are: human, company, doesn’t exist (anymore), suspended, bot, automated by, and other. We were able to clearly identify accounts that belonged to the human category by examining their profile pictures and descriptions. However, it was also noted that some accounts might be maintained by companies, and we labeled them as company accounts. We discovered that a few accounts had been suspended by Twitter, did not exist (anymore), or were flagged as “Automated by”. Figure 3(a) shows an instance of an account labeled as “Automated by”. These accounts were labeled as automated because Twitter allows identifying bot accounts using the keyword “Automated by” in their profile, as documented in [77]. We also encountered suspended accounts (like the one depicted in Figure 3(b)). Twitter mentions an account may be suspended if it is spammy, hacked, or creates abusive tweets [78]. Additionally, some accounts explicitly stated themselves as bots in their description, and we labeled them as belonging to the bot category. We also discovered accounts created solely for the purpose of promoting events such as tech fests or game activities. We have labeled these accounts as other. Table 8 reports the results of our manual analysis. We considered an account as human-operated if it was associated with a human or a company or if it did not exist (anymore). Additionally, we view an account as automated if it was suspended or identified as a bot or “Automated by". From Table 8, it can be observed that our model correctly predicted 1,049 out of the 1,081 human-operated accounts. However, we found 32 accounts that our model predicted as human-operated that were actually automated. Out of the remaining 641 misclassified accounts predicted as automated, our manual analysis revealed that 632 were human-operated, and only 9 were automated. In total, we found 664 actual misclassifications and 1,058 proper classifications out of 1,722 samples. Section 7.4 explains which features influenced the correct classification as well as misclassification.
| Type of Account | Count of each type by manual analysis | ||||||
|---|---|---|---|---|---|---|---|
|
|
||||||
| Human | 550 | 274 | |||||
| Company | 147 | 82 | |||||
| Other | 297 | 254 | |||||
| Doesn’t Exist | 55 | 22 | |||||
| Suspended | 20 | 7 | |||||
| Bot | 10 | 2 | |||||
| Automated By | 2 | 0 | |||||
7.4 Model Explainability using SHAP and LIME
An explainable artificial intelligence provides information or justifications to make the model functioning obvious or simple to comprehend [79]. We adopted the SHapley Additive Explanation (SHAP) and Local Interpretable Model-Agnostic Explanation (LIME) approaches to explain the bot classification model and determine the features that influence model prediction. SHAP and LIME are two model-agnostic techniques for explaining any classifier. SHAP [80] is based on the coalition idea of game theory [81] and provides a means to assess the influence of each attribute. LIME [82] concentrates on explaining a particular instance locally. Since the XGBoost model performed well in classifying accounts, we interpreted and explained the XGBoost model through different explainability techniques.
7.4.1 Global Interpretability
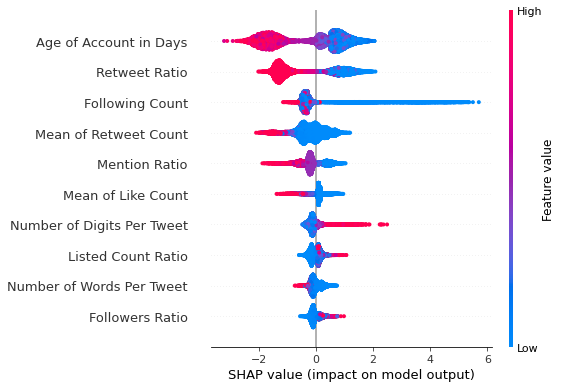
Global interpretability facilitates grasping the complete logic behind a model and each of the various possible outcomes. In this phase, we exploited SHAP to understand and explain the XGBoost model globally by determining SHAPley values. Figure 4 illustrates the SHAP summary Beeswarm plot, which displays the features according to their relevance in classifying Twitter accounts. The horizontal axis indicates the SHAP value, while the vertical axis indicates the features in increasing order of relevance. Each of the tiny points on the figure corresponds to a single instance. We can determine whether an instance has a greater or smaller feature value by looking at the color of the particular dot. The point is red when the feature has high values and blue for those with relatively low values. From Figure 4, we observe that some very high values of the age of account that appears in the upper left of the plot have a negative impact on the model prediction. Furthermore, we can see a few blue dots in the upper left, indicating that this low feature value also lowers the performance. Similarly, the higher values of retweet ratio negatively correlated with the model’s performance. But in the case of followers ratio, a few low values of this feature have a little detrimental influence on performance.
7.4.2 Local Interpretability
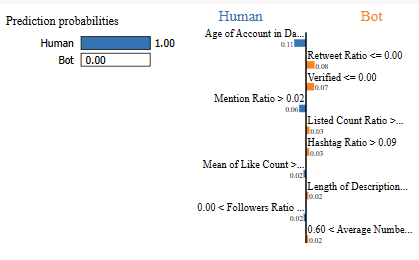
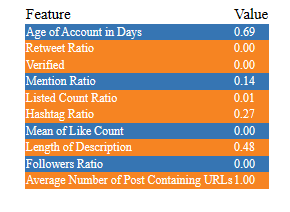
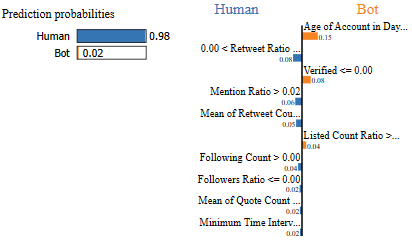
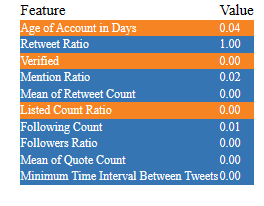
Local Interpretability aids in comprehending and interpreting a prediction regarding a particular data instance. We applied both SHAP and LIME to interpret the given instance. Figure 5 6 7 depicts a SHAP force plot that outlines how each attribute affects the prediction of a given sample. The base value indicates the mean of all predicted probabilities. The prediction for the given data is shown in bold. The hues blue and red signify the key attributes used to generate the prediction for the given instance. Red denotes attributes that increase the performance for the particular data instance, whereas blue represents features that diminish the performance. The most influential features for the prediction are located near the red-blue borderline, and the width of the color bar represents the influence of that feature in the prediction score.
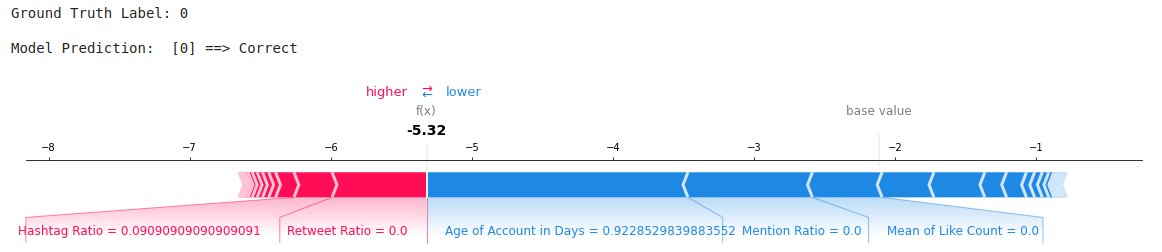
Figure 5 demonstrates the SHAP interpretation for a specific legitimate account. We analyze that the predicted value for this sample is -5.32, which is smaller than the base value. The feature values highlighted in red, in this case, retweet ratio and hashtag ratio, have been shown to boost output values. Also, features like account age, mention ratio, and mean like count lessen the model’s output value. The local interpretation of a specific bot account is illustrated in Figure 6. The output value mentioned in the plot is 2.01, which is higher than the base value. The features shown in red have a beneficial impact on the output value, with the following count having the highest influence.
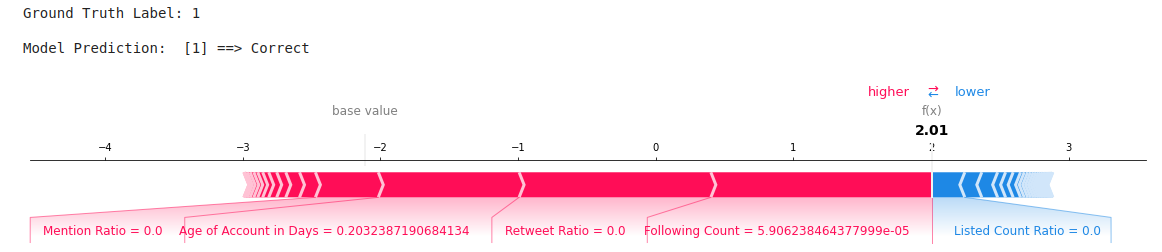
Figure 7 illustrates the local interpretation of incorrectly classified data; in this case, the sample actually represents a bot account that was mistakenly identified as a real account. In this scenario, the model score is significantly impacted by the features indicated by the blue color.
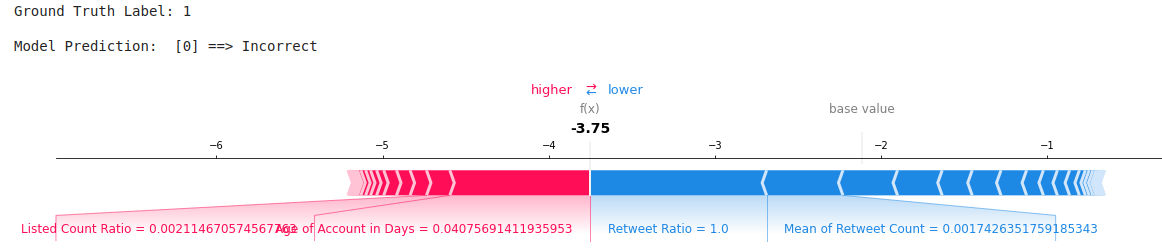
Figure 8 depicts the LIME interpretation of a randomly selected bot sample. The plot shows the predicted probability for each class, with the bot having the highest probability of 88%. The significance of each attribute to this prediction is depicted in the center bar plot. The feature emphasized in orange contributes toward the bot class, whereas blue signifies the human class. In this sample, the mention ratio has a 9% feature significance score, followed by the retweet ratio, verified, and age of account, each of which has an 8% importance score. The right plot depicts the top ten features impacting prediction and their associated values. These attributes have a beneficial effect on prediction output.
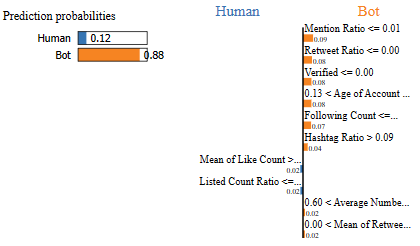
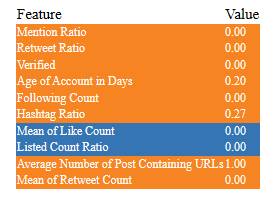
Figure 9 shows the local interpretation of a legitimate account that was classified correctly. From this figure, we observe that the age of the account has an 11% favorable impact on the prediction. Furthermore, the mention ratio, mean of like count, and followers ratio all have a positive influence on predicting this sample as human.
Local interpretation of a misclassified sample is illustrated in Figure 10. From the plot, the account has a 98% probability of being predicted as human; however, it is actually a bot. The features marked in blue, such as retweet ratio, mention ratio, mean retweet count, and so on, influence the prediction of the XGBoost model towards the human class. Furthermore, the retweet ratio is more important, with an 8% influence score for this prediction. However, features such as account age, verified, and listed count ratio all contribute to predicting this sample as a bot. These interpretations make it simple to discover the features driving the performance of the model. The age of the account and the retweet ratio are the two features that contribute most to the prediction in all scenarios, including the SelectKBest feature selection and model interpretations.
8 Summary of Findings
8.1 RQ1: Which kinds of IoCs are mainly transmitted through security Tweets?
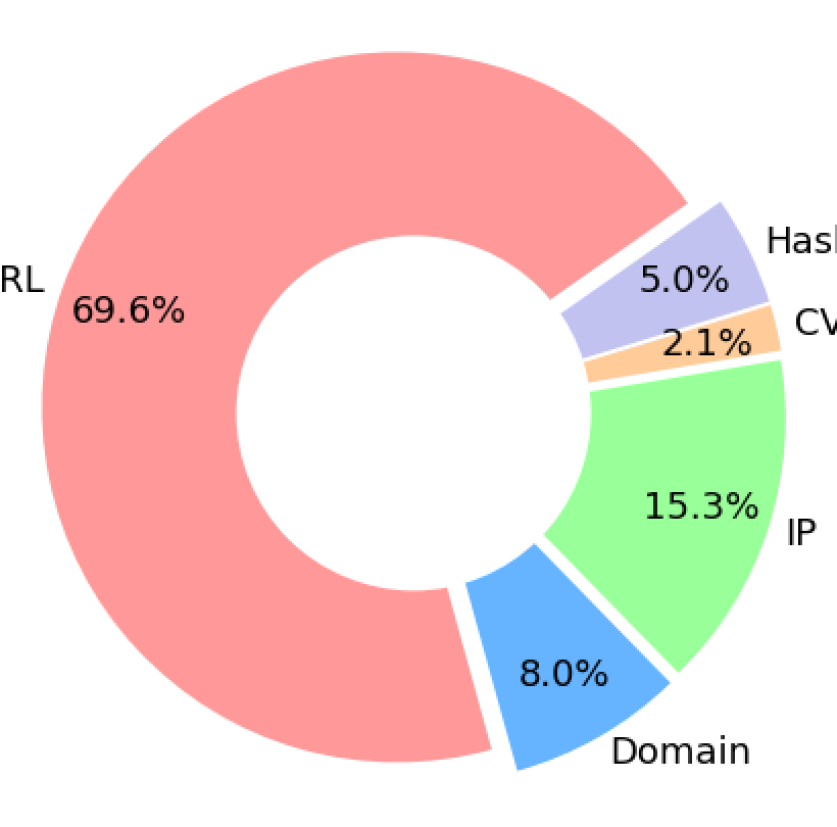
Figure 11(a) shows the overall statistics of the IoCs reported from January to July 2021. According to these data, we observe that URLs are the most commonly traded IoCs compared to others. From January to July 2021, 69.6% of URLs were acquired, while only 2.1% of vulnerability indicators (CVE) were obtained. In general, URLs are the most communicated IoCs through security Tweets.
| IoC Type | Phishing | Malware | Others |
|---|---|---|---|
| URL | 72.7% | 4.6% | 22.7% |
| IP | 34.8% | 50.8% | 14.4% |
| Domain | 88.8% | 3.5% | 7.7% |
| File Hashes | 2.7% | 93.1% | 4.1% |
Additionally, the data we gathered from Twitter provides meaningful information about various types of attacks that happened in the cyber world. On Twitter, most security practitioners reported valuable threat information by the relevant attack keywords/ hashtags. From the relevant tweets that contain IoC, we derived which sort of attacks, such as malware and phishing, are frequently adopted by the attackers. Table 9(a) demonstrates the statistics of the most occurring attacks mentioned in the security tweets. From the table, we inferred that 72.7% of URLS mentioned in the security tweets are associated with phishing attacks. While 93.1% of file hashes are related to the malware family.
8.2 RQ2: To what extent IoCs extracted from Twitter accounts are reliable?
We assessed the applicability of Twitter in providing threat intelligence and the reliability of IoCs using metrics such as correctness, timeliness, and overlap.
Correctness: What percentage of IoCs are reported malicious by different threat intelligence services?
Correctness is one of the most important aspects to consider when assessing the trustworthiness of IoC. It is obtained by calculating the number of malicious IoCs reported by at least any threat intelligence services. The percentage of each type of malicious indicator is summarized in Table 9.
| IoC Type | URL | IP | Domain | Hashes | CVE | Total |
| IoCs reported on Twitter | 63313 | 13964 | 7276 | 4545 | 1893 | 90991 |
| Malicious IoCs reported by any of the TISs | 29743 | 4015 | 4196 | 4458 | 1869 | 44281 |
| Percentage of malicious IoCs | 46.98 | 28.75 | 57.67 | 98.08 | 98.73 | 48.67 |
Our investigation using threat intelligence platforms shows that 48.67% of IoCs reported on Twitter are actually malicious. Further, 98.08% of hashes reported in tweets constitute a threat signal. Recently, social media has been increasingly used to report signs of vulnerability. 98.73% of CVEs mentioned in tweets are already in NVD; however, 1.27% of novel vulnerabilities are released by Twitter users and not yet in the national vulnerability database. Furthermore, 46.98% of URLs and 56.7% of domains cited by security users are cyber forensic evidence associated with a threat or attack. Regarding IP addresses, 28.75% of IP addresses related to threats stated in tweets are also in various threat intelligence services.
Timeliness: How fast Twitter shares its IoCs compared to other threat intelligence services?
The timeliness metric is a key performance indicator that determines which platforms disclose IoCs as early as possible. We determined the timeliness metric by comparing the published date of the IoC on Twitter and the initial submission date of the IoC on various threat intelligence services. As TIS do not provide analysis dates for certain malicious IoCs, we were only able to compare 39,402 out of the total 44,281 IoCs. The percentage of IoCs reported earlier by Twitter and various threat intelligence services are plotted in Fig 12. For the IP, domain addresses, and URLs, we compared the timeliness with only VirusTotal since Table 4 clearly shows that VirusTotal is the TIS delivering the highest number of indicators. Other intelligence services identified a few of the indicators as malevolent. So we considered VirusTotal as the baseline platform, which scans all sorts of IoCs and conveniently delivers the first reported date for almost all IoCs, with the exception of a few IP addresses. Figure 12(d) indicates that Twitter delivers timely threat warnings in the form of URLs by reporting 78.4% of URLs earlier than VirusTotal. In the case of IP addresses and domains, 1.2% of malicious IPs are reported earlier by Twitter, and 14% of malicious domain addresses are timely reported by Twitter. Although the proportion of timeliness for IP and domain addresses is lower, Twitter still contributes with a few malicious IoCs ahead of the VirusTotal. We observed VirusTotal and AlienVault for file hashes since both platforms reported almost all hashes as malicious indicators. In terms of timeliness regarding hashes, VirusTotal outperforms Twitter and AlienVault with a 97.2% of early warning. We estimated the timeliness of CVEs between Twitter and NVD since NVD is the primary vulnerability database based on and completely synced with the CVE records; all changes to CVE appear instantly in NVD. The investigation shows that social media like Twitter report 36.7% of CVEs earlier than NVD. Through our analysis, we found that Twitter provided 24,479 IoCs before TIS. Therefore, it is evident from this that Twitter offers reliable and timely warnings against novel threats and vulnerabilities.
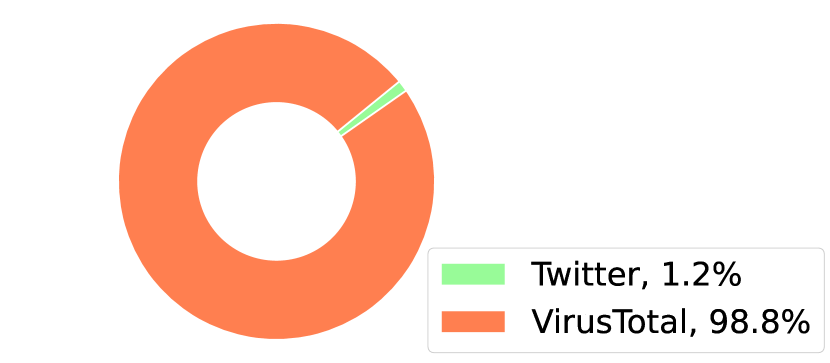
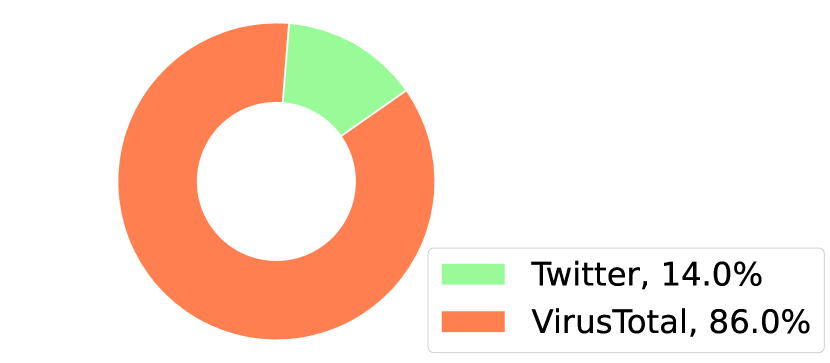

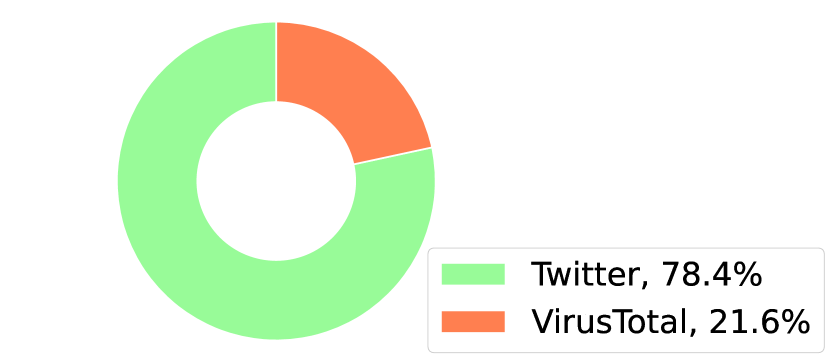
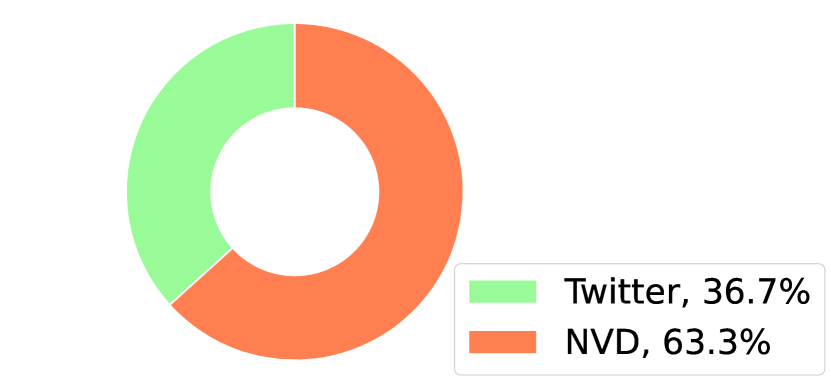
Overlap: How many IoCs in Twitter exist in other Threat Intelligence Services?
Determining the popular IoC is a crucial task for a threat to community and security practitioners. If we can find out which artifacts are currently involved in malicious activities, it is easier for security analysts and researchers to take essential steps to prevent further threat activities. We discovered the important IoCs by finding the intersection of the malicious IoCs obtained from the various threat intelligence services. Since not all threat intelligence systems can scan all types of IoCs, we determined the intersection for each indicator. The upset plot shown in Figure 13 is used to illustrate the findings about the overlap. Figure 13(a) shows that URLs can be scanned on four different platforms, including VirusTotal, AlienVault, UrlHaus, and MISP. Two URLs are common among all four of these platforms.
According to the total malicious URL count, the number of common URLs is minimal (say two), which is due to the number of malicious URLs reported by AlienVault and MISP. AlienVault and MISP reported very few URLs as malicious. If we exclude AlienVault and MISP, 76 URLs are common among VirusTotal and UrlHaus. Similar to the URL, for IP and domain addresses, we computed the intersection between the VirusTotal, AlienVault, UrlHaus, and MISP. The most pertinent IoCs, in terms of IP and domain addresses, are 27 and 17, respectively. There are 663 IP addresses common among VirusTotal and AlienVault, as well as 137 domain addresses common among VirusTotal and UrlHaus. With the exception of NVD, all threat intelligence services allow us to examine the file hashes, so we have taken the intersection between them. The most important evidence of compromise, according to our investigation, is 80 file hashes. Additionally, we can see from Figure 13(d) that almost all hashes found in VirusTotal and AlienVault are involved with threat activities.
Although NVD is the primary database of vulnerability indicators in the case of CVE, we can also analyze CVE in MISP. However, MISP only exposes us to 101 CVEs out of the 1970 CVES we collected, which results in the most common vulnerability.
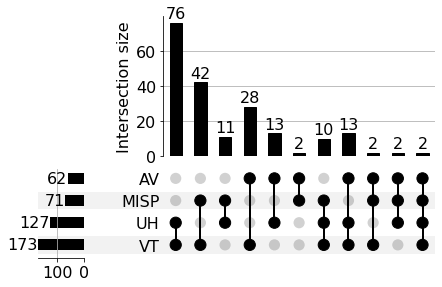
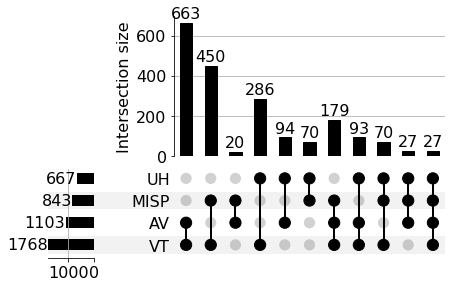
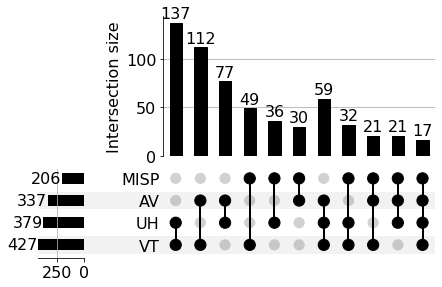
8.3 RQ3: To what proportion are the automated accounts delivering IoCs through Twitter?
We employed the XGBoot model to determine whether the IoCs posted on Twitter originated from human-maintained or automated accounts. The XGBoost model predicted that out of the 1749 accounts that posted IoCs, 1694 are human-handled, and 55 are automated accounts. Notably, human-handled accounts shared the majority percentage (82.12%) of the IoCs, while automated accounts shared 17.87% of them. Moreover, we analyzed the percentage of Twitter accounts sharing the 44,281 malicious IoCs and discovered that 3.55% of them were from automated accounts, which is a total of 8,067 malicious IoCs. Consequently, we calculate that the automated accounts were responsible for initiating 18.22% of the malicious IoCs on Twitter. Additionally, we analyzed the prevalence of automated accounts sharing malicious IoCs before TIS and found that they initiated 777 cyber artifacts (3.17%). To summarise, our analysis confirms that automated accounts are also involved in disseminating malicious IoCs on Twitter.
9 Discussion
While we acquired Twitter data for IoC sources in our study, it’s likely that we also gathered non-security tweets or security news devoid of IoCs. To partially mitigate this issue, like previous researchers [48] [49] [4], we used a set of hashtags and or keywords. However, the tweets might not be relevant because they can include blog URLs and tutorial discussions with the same hashtags. We developed an automated system with the help of a deep learning model to identify relevant tweets bearing IoCs. Furthermore, to limit the irrelevant IoCs, we purged certain unnecessary URLs like Tweet URLs, Facebook and Youtube URLs, etc., using regular expression rules. According to Table 9, URL is the most prevalent IoC sent via security tweets. It might be because malicious URLs are frequently used as the centerpiece of several cyber incidents, including malware, phishing, and spamming [83]. Additionally, it is simple for attackers to deliver the URLs via the existing communication systems. Moreover, the search criteria used to acquire the data for this study included terms like “phishing," “malware," “0day," “botnet," “spyware," “ransomware," and others. However, as shown in Table 4, the percentage of suspicious IPs identified as malicious is relatively low across all TIS. Since attackers frequently change IP addresses [84] [85], it is possible that threat intelligence services rarely examine and store IP addresses in their feeds. Thus according to our findings, IP addresses are a poor indicator of threat activities.
Table 3 illustrates the malicious status of IoC in various TIS, which reflects how well threat intelligence services can deliver threat information. We deduced from the table that, with the exception of CVE, VirusTotal could scan all forms of IoCs and offer a reasonable outcome. So, based on our study and previous studies [4], we recognized Virustotal as a core intelligence service. MISP has recently been adopted by many security experts, although the volume of events and threat information recorded in MISP remains relatively low. In the future, we plan to integrate the MISP by adding the indicators we have identified as malicious during our research into MISP. So that we can discover more about indicators and the events associated with them.
The automation system for validating the source of the security tweets achieved 91% performance, but it provides some false positives. Since automated accounts and advertising agencies have similar traits, such as the number of followers and retweets, the system seldom makes classification errors. Additionally, as we used an automated tool to annotate Twitter users as bots or legitimate, our training data may contain noise that might lead to incorrect classification. The false positives can be minimized by continuous learning [86] and also manually annotating the Twitter accounts. To partially mitigate this issue, we manually analyzed all classification disagreements that occurred between our model and the Birdspotter-based labeling and found that our model can achieve a higher performance in identifying IoC-related human-operated Twitter accounts while misclassifying several accounts that are actually bot-driven. The number of misclassified samples might be alleviated by training the ML model through a fully manually annotated corpus. However, manually marking all the accounts as bots or legitimate is challenging. Prior to manually annotating, one must go through all Twitter accounts and examine the user’s profile and activity. When an account is highlighted with the Automated by, as seen in Figure 3, we can infer that it is a bot. However, examining other accounts and determining whether they are bots or humans takes a lot of effort.
10 Conclusions and Future Work
Security firms have adopted CTI to combat APT attacks since it accumulates important knowledge to comprehend an attacker’s intent and forecast future attacks. Nowadays, social media serves as a key platform for exchanging threat intelligence, and Twitter is an excellent source. For deriving threat intelligence from Twitter, we gathered seven-month cyber-related tweets and extracted relevant IoCs using regular expression. To exclude irrelevant tweets from the study, we implemented a binary classifier with an F1-score of 98.80% and a detection rate of 99.65%. With the help of threat intelligence services, we evaluated the reliability of IoCs by metrics like correctness, timeliness, and overlap. Based on our investigation, it is evident that URLs are the IoCs that are most frequently traded compared to others. By utilizing the correctness metric, we have inferred that 48.67% of IoCs reported on Twitter are actually malicious. In terms of timeliness, Virustotal provided an early warning for threats associated with IoCs in most cases, while Twitter was able to provide early alerts specifically for URLs. While exploring the overlap metric, we identified the critical artifacts currently involved in malicious activities. Additionally, we evaluated the extent to which automatic accounts were involved in disseminating IoCs. We employed various machine learning and deep learning models to distinguish between cyber artifacts shared by humans and those shared by automatic accounts. Among the different models, XGBoost yielded the highest performance, achieving an F1-score of 90.96%. We also utilized explainability tools such as SHAP and LIME to interpret the model’s outcomes and identify the characteristics of automatic and legitimate accounts. Furthermore, we demonstrated that a significant portion of malicious IoCs was spread on Twitter by human accounts while automated accounts are also involved in disseminating IoCs. Our findings suggest that Twitter is becoming popular for delivering relevant and accurate suspicious IoCs. In the future, we plan to investigate other social media platforms, such as Reddit, in delivering threat intelligence. We also plan to extract detail information about a threat, such as malware name, attacker, attack type, target, and similar from the security blogs mentioned in the tweets. Furthermore, we intend to add other metrics to make more accurate the evaluation of IoC reliability.
References
- [1] Thomas D Wagner, Khaled Mahbub, Esther Palomar, and Ali E Abdallah. Cyber threat intelligence sharing: Survey and research directions. Computers & Security, 87:101589, 2019.
- [2] Jun Zhao, Qiben Yan, Jianxin Li, Minglai Shao, Zuti He, and Bo Li. Timiner: Automatically extracting and analyzing categorized cyber threat intelligence from social data. Computers & Security, 95:101867, 2020.
- [3] Matt Bromiley. Threat intelligence: What it is, and how to use it effectively. SANS Institute InfoSec Reading Room, 15:172, 2016.
- [4] Hyejin Shin, WooChul Shim, Saebom Kim, Sol Lee, Yong Goo Kang, and Yong Ho Hwang. # twiti: Social listening for threat intelligence. In Proceedings of the Web Conference 2021, pages 92–104, 2021.
- [5] Fernando Alves, Ambrose Andongabo, Ilir Gashi, Pedro M Ferreira, and Alysson Bessani. Follow the blue bird: A study on threat data published on twitter. In Computer Security–ESORICS 2020: 25th European Symposium on Research in Computer Security, ESORICS 2020, Guildford, UK, September 14–18, 2020, Proceedings, Part I 25, pages 217–236. Springer, 2020.
- [6] Hunting threats on twitter: How social media can be used to gather actionable threat intelligence. https://www.trendmicro.com/vinfo/es/security/news/cybercrime-and-digital-threats/hunting-threats-on-twitter.
- [7] Zulfikar Alom, Barbara Carminati, and Elena Ferrari. A deep learning model for twitter spam detection. Online Social Networks and Media, 18:100079, 2020.
- [8] Haewoon Kwak, Changhyun Lee, Hosung Park, and Sue Moon. What is twitter, a social network or a news media? In Proceedings of the 19th international conference on World wide web, pages 591–600, 2010.
- [9] Fernando Alves, Aurélien Bettini, Pedro M Ferreira, and Alysson Bessani. Processing tweets for cybersecurity threat awareness. Information Systems, 95:101586, 2021.
- [10] Xiaojing Liao, Kan Yuan, XiaoFeng Wang, Zhou Li, Luyi Xing, and Raheem Beyah. Acing the ioc game: Toward automatic discovery and analysis of open-source cyber threat intelligence. In Proceedings of the 2016 ACM SIGSAC Conference on Computer and Communications Security, pages 755–766, 2016.
- [11] Ziyun Zhu and Tudor Dumitras. Chainsmith: Automatically learning the semantics of malicious campaigns by mining threat intelligence reports. In 2018 IEEE European Symposium on Security and Privacy (EuroS&P), pages 458–472. IEEE, 2018.
- [12] Ghaith Husari, Ehab Al-Shaer, Mohiuddin Ahmed, Bill Chu, and Xi Niu. Ttpdrill: Automatic and accurate extraction of threat actions from unstructured text of cti sources. In Proceedings of the 33rd annual computer security applications conference, pages 103–115, 2017.
- [13] Zi Long, Lianzhi Tan, Shengping Zhou, Chaoyang He, and Xin Liu. Collecting indicators of compromise from unstructured text of cybersecurity articles using neural-based sequence labelling. In 2019 International Joint Conference on Neural Networks (IJCNN), pages 1–8. IEEE, 2019.
- [14] Amirreza Niakanlahiji, Lida Safarnejad, Reginald Harper, and Bei-Tseng Chu. Iocminer: Automatic extraction of indicators of compromise from twitter. In 2019 IEEE International Conference on Big Data (Big Data), pages 4747–4754, 2019.
- [15] Carl Sabottke, Octavian Suciu, and Tudor Dumitra\textcommabelows. Vulnerability disclosure in the age of social media: Exploiting twitter for predicting real-world exploits. In 24th USENIX Security Symposium (USENIX Security 15), pages 1041–1056, 2015.
- [16] Thomas Schaberreiter, Veronika Kupfersberger, Konstantinos Rantos, Arnolnt Spyros, Alexandros Papanikolaou, Christos Ilioudis, and Gerald Quirchmayr. A quantitative evaluation of trust in the quality of cyber threat intelligence sources. In Proceedings of the 14th International Conference on Availability, Reliability and Security, pages 1–10, 2019.
- [17] Omar Al-Ibrahim, Aziz Mohaisen, Charles Kamhoua, Kevin Kwiat, and Laurent Njilla. Beyond free riding: quality of indicators for assessing participation in information sharing for threat intelligence. arXiv preprint arXiv:1702.00552, 2017.
- [18] Jelle Ermerins, Niek van Noort, Joao de Novais Marques, and Leandro Velasco. Scoring model for iocs by combining open intelligence feeds to reduce false positives. 2020.
- [19] Kayode Sakariyah Adewole, Nor Badrul Anuar, Amirrudin Kamsin, and Arun Kumar Sangaiah. Smsad: a framework for spam message and spam account detection. Multimedia Tools and Applications, 78(4):3925–3960, 2019.
- [20] Yuhao Wu, Yuzhou Fang, Shuaikang Shang, Jing Jin, Lai Wei, and Haizhou Wang. A novel framework for detecting social bots with deep neural networks and active learning. Knowledge-Based Systems, 211:106525, 2021.
- [21] Avishek Bose, Shreya Gopal Sundari, Vahid Behzadan, and William H Hsu. Tracing relevant twitter accounts active in cyber threat intelligence domain by exploiting content and structure of twitter network. In 2021 IEEE International Conference on Intelligence and Security Informatics (ISI), pages 1–6. IEEE, 2021.
- [22] Reema Aswani, Arpan Kumar Kar, and P Vigneswara Ilavarasan. Detection of spammers in twitter marketing: a hybrid approach using social media analytics and bio inspired computing. Information Systems Frontiers, 20(3):515–530, 2018.
- [23] Maryam Heidari, H James Jr, and Ozlem Uzuner. An empirical study of machine learning algorithms for social media bot detection. In 2021 IEEE International IOT, Electronics and Mechatronics Conference (IEMTRONICS), pages 1–5. IEEE, 2021.
- [24] Jorge Rodríguez-Ruiz, Javier Israel Mata-Sánchez, Raul Monroy, Octavio Loyola-Gonzalez, and Armando López-Cuevas. A one-class classification approach for bot detection on twitter. Computers & Security, 91:101715, 2020.
- [25] Sudip Mittal, Prajit Kumar Das, Varish Mulwad, Anupam Joshi, and Tim Finin. Cybertwitter: Using twitter to generate alerts for cybersecurity threats and vulnerabilities. In 2016 IEEE/ACM International Conference on Advances in Social Networks Analysis and Mining (ASONAM), pages 860–867. IEEE, 2016.
- [26] Hyejin Shin, WooChul Shim, Jiin Moon, Jae Woo Seo, Sol Lee, and Yong Ho Hwang. Cybersecurity event detection with new and re-emerging words. In Proceedings of the 15th ACM Asia Conference on Computer and Communications Security, pages 665–678, 2020.
- [27] 60 incredible and interesting twitter stats and statistics. https://www.brandwatch.com/blog/twitter-stats-and-statistics/.
- [28] Semih Yagcioglu, Mehmet Saygin Seyfioglu, Begum Citamak, Batuhan Bardak, Seren Guldamlasioglu, Azmi Yuksel, and Emin Islam Tatli. Detecting cybersecurity events from noisy short text. arXiv preprint arXiv:1904.05054, 2019.
- [29] Sameera Horawalavithana, Abhishek Bhattacharjee, Renhao Liu, Nazim Choudhury, Lawrence O. Hall, and Adriana Iamnitchi. Mentions of security vulnerabilities on reddit, twitter and github. In IEEE/WIC/ACM International Conference on Web Intelligence, pages 200–207, 2019.
- [30] Han-Sub Shin, Hyuk-Yoon Kwon, and Seung-Jin Ryu. A new text classification model based on contrastive word embedding for detecting cybersecurity intelligence in twitter. Electronics, 9(9):1527, 2020.
- [31] Sahar Altalhi and Adnan Gutub. A survey on predictions of cyber-attacks utilizing real-time twitter tracing recognition. Journal of Ambient Intelligence and Humanized Computing, pages 1–13, 2021.
- [32] Anna Sapienza, Sindhu Kiranmai Ernala, Alessandro Bessi, Kristina Lerman, and Emilio Ferrara. Discover: Mining online chatter for emerging cyber threats. In Companion Proceedings of the The Web Conference 2018, pages 983–990, 2018.
- [33] Threat hunting: Iocs and artifacts. https://resources.infosecinstitute.com/topic/threat-hunting-iocs-and-artifacts/.
- [34] Peng Peng, Limin Yang, Linhai Song, and Gang Wang. Opening the blackbox of virustotal: Analyzing online phishing scan engines. In Proceedings of the Internet Measurement Conference, pages 478–485, 2019.
- [35] Virustotal. https://support.virustotal.com/hc/en-us/articles/115002126889-How-it-works.
- [36] Virustotal contributors. https://support.virustotal.com/hc/en-us/articles/115002146809-Contributors.
- [37] Alienvault - open threat exchange. https://otx.alienvault.com/.
- [38] Urlhaus - malware url exchange. https://urlhaus.abuse.ch/.
- [39] Malwarebazaar - malware sample exchange. https://bazaar.abuse.ch/.
- [40] Cynthia Wagner, Alexandre Dulaunoy, Gérard Wagener, and Andras Iklody. Misp: The design and implementation of a collaborative threat intelligence sharing platform. In Proceedings of the 2016 ACM on Workshop on Information Sharing and Collaborative Security, pages 49–56, 2016.
- [41] Harold Booth, Doug Rike, Gregory A Witte, et al. The national vulnerability database (nvd): Overview. 2013.
- [42] Automated malware analysis - joe sandbox cloud basic. https://www.joesandbox.com/#windows.
- [43] Any.run - interactive online malware sandbox. https://any.run/.
- [44] Intezer - autonomous security operations. https://www.intezer.com/.
- [45] Sampashree Nayak, Deepak Nadig, and Byrav Ramamurthy. Analyzing malicious urls using a threat intelligence system. In 2019 IEEE International Conference on Advanced Networks and Telecommunications Systems (ANTS), pages 1–4. IEEE, 2019.
- [46] Ying Dong, Wenbo Guo, Yueqi Chen, Xinyu Xing, Yuqing Zhang, and Gang Wang. Towards the detection of inconsistencies in public security vulnerability reports. In USENIX Security Symposium, pages 869–885, 2019.
- [47] Tweepy documentation. https://docs.tweepy.org/en/stable/.
- [48] Linn-Mari Kristiansen, Vinti Agarwal, Katrin Franke, and Raj Sanjay Shah. Cti-twitter: Gathering cyber threat intelligence from twitter using integrated supervised and unsupervised learning. In 2020 IEEE International Conference on Big Data (Big Data), pages 2299–2308. IEEE, 2020.
- [49] Vahid Behzadan, Carlos Aguirre, Avishek Bose, and William Hsu. Corpus and deep learning classifier for collection of cyber threat indicators in twitter stream. In 2018 IEEE International Conference on Big Data (Big Data), pages 5002–5007. IEEE, 2018.
- [50] Jeffrey Pennington, Richard Socher, and Christopher D Manning. Glove: Global vectors for word representation. In Proceedings of the 2014 conference on empirical methods in natural language processing (EMNLP), pages 1532–1543, 2014.
- [51] Yahui Chen. Convolutional neural network for sentence classification. Master’s thesis, University of Waterloo, 2015.
- [52] Yelong Shen, Xiaodong He, Jianfeng Gao, Li Deng, and Grégoire Mesnil. Learning semantic representations using convolutional neural networks for web search. In Proceedings of the 23rd international conference on world wide web, pages 373–374, 2014.
- [53] Wen-tau Yih, Xiaodong He, and Christopher Meek. Semantic parsing for single-relation question answering. In Proceedings of the 52nd Annual Meeting of the Association for Computational Linguistics (Volume 2: Short Papers), pages 643–648, 2014.
- [54] Dario Stojanovski, Gjorgji Strezoski, Gjorgji Madjarov, and Ivica Dimitrovski. Emotion identification in fifa world cup tweets using convolutional neural network. In 2015 11th International Conference on Innovations in Information Technology (IIT), pages 52–57. IEEE, 2015.
- [55] Iocextract python library. https://github.com/InQuest/python-iocextract.
- [56] Mitre search cve list. https://cve.mitre.org/cve/search_cve_list.html.
- [57] Mohd Fazil and Muhammad Abulaish. A hybrid approach for detecting automated spammers in twitter. IEEE Transactions on Information Forensics and Security, 13(11):2707–2719, 2018.
- [58] PV Bindu, Rahul Mishra, and P Santhi Thilagam. Discovering spammer communities in twitter. Journal of Intelligent Information Systems, 51(3):503–527, 2018.
- [59] Loukas Ilias and Ioanna Roussaki. Detecting malicious activity in twitter using deep learning techniques. Applied Soft Computing, 107:107360, 2021.
- [60] Malik Mateen, Muhammad Azhar Iqbal, Muhammad Aleem, and Muhammad Arshad Islam. A hybrid approach for spam detection for twitter. In 2017 14th International Bhurban Conference on Applied Sciences and Technology (IBCAST), pages 466–471. IEEE, 2017.
- [61] Buket Erşahin, Özlem Aktaş, Deniz Kılınç, and Ceyhun Akyol. Twitter fake account detection. In 2017 International Conference on Computer Science and Engineering (UBMK), pages 388–392. IEEE, 2017.
- [62] Monika Singh, Divya Bansal, and Sanjeev Sofat. Who is who on twitter–spammer, fake or compromised account? a tool to reveal true identity in real-time. Cybernetics and Systems, 49(1):1–25, 2018.
- [63] Luigi Rovito, Lorenzo Bonin, Luca Manzoni, and Andrea De Lorenzo. An evolutionary computation approach for twitter bot detection. Applied Sciences, 12(12):5915, 2022.
- [64] Chao Yang, Robert Harkreader, and Guofei Gu. Empirical evaluation and new design for fighting evolving twitter spammers. IEEE Transactions on Information Forensics and Security, 8(8):1280–1293, 2013.
- [65] Sreekanth Madisetty and Maunendra Sankar Desarkar. A neural network-based ensemble approach for spam detection in twitter. IEEE Transactions on Computational Social Systems, 5(4):973–984, 2018.
- [66] Chao Chen, Jun Zhang, Xiao Chen, Yang Xiang, and Wanlei Zhou. 6 million spam tweets: A large ground truth for timely twitter spam detection. In 2015 IEEE international conference on communications (ICC), pages 7065–7070. IEEE, 2015.
- [67] Michael Mccord and M Chuah. Spam detection on twitter using traditional classifiers. In international conference on Autonomic and trusted computing, pages 175–186. Springer, 2011.
- [68] Amit A Amleshwaram, Narasimha Reddy, Sandeep Yadav, Guofei Gu, and Chao Yang. Cats: Characterizing automation of twitter spammers. In 2013 Fifth International Conference on Communication Systems and Networks (COMSNETS), pages 1–10. IEEE, 2013.
- [69] Abdullah Talha Kabakus and Resul Kara. A survey of spam detection methods on twitter. International Journal of Advanced Computer Science and Applications, 8(3), 2017.
- [70] Hao Chen, Jun Liu, Yanzhang Lv, Max Haifei Li, Mengyue Liu, and Qinghua Zheng. Semi-supervised clue fusion for spammer detection in sina weibo. Information Fusion, 44:22–32, 2018.
- [71] Junshan Pan, Ying Liu, Xiang Liu, and Hanping Hu. Discriminating bot accounts based solely on temporal features of microblog behavior. Physica A: Statistical Mechanics and its Applications, 450:193–204, 2016.
- [72] Matteo Cardaioli, Mauro Conti, Andrea Di Sorbo, Enrico Fabrizio, Sonia Laudanna, and Corrado Aaron Visaggio. It’s a matter of style: Detecting social bots through writing style consistency. In 2021 International Conference on Computer Communications and Networks (ICCCN), pages 1–9, 2021.
- [73] Botometer. https://botometer.osome.iu.edu/.
- [74] Eiman Alothali, Motamen Salih, Kadhim Hayawi, and Hany Alashwal. Bot-mgat: A transfer learning model based on a multi-view graph attention network to detect social bots. Applied Sciences, 12(16):8117, 2022.
- [75] Mohammad Majid Akhtar, Bibhas Sharma, Ishan Karunanayake, Rahat Masood, Muhammad Ikram, and Salil S Kanhere. Machine learning-based automatic annotation and detection of covid-19 fake news. arXiv preprint arXiv:2209.03162, 2022.
- [76] Rohit Ram, Quyu Kong, and Marian-Andrei Rizoiu. Birdspotter: A tool for analyzing and labeling twitter users. In Proceedings of the 14th ACM International Conference on Web Search and Data Mining, pages 918–921, 2021.
- [77] What’s an automated account and why do they need labels? https://help.twitter.com/en/using-twitter/automated-account-labels.
- [78] Why might my twitter account be suspended? https://help.twitter.com/en/managing-your-account/suspended-twitter-accounts.
- [79] Alejandro Barredo Arrieta, Natalia Díaz-Rodríguez, Javier Del Ser, Adrien Bennetot, Siham Tabik, Alberto Barbado, Salvador García, Sergio Gil-López, Daniel Molina, Richard Benjamins, et al. Explainable artificial intelligence (xai): Concepts, taxonomies, opportunities and challenges toward responsible ai. Information fusion, 58:82–115, 2020.
- [80] Scott M Lundberg and Su-In Lee. A unified approach to interpreting model predictions. Advances in neural information processing systems, 30, 2017.
- [81] Erik Štrumbelj and Igor Kononenko. Explaining prediction models and individual predictions with feature contributions. Knowledge and information systems, 41(3):647–665, 2014.
- [82] Marco Tulio Ribeiro, Sameer Singh, and Carlos Guestrin. " why should i trust you?" explaining the predictions of any classifier. In Proceedings of the 22nd ACM SIGKDD international conference on knowledge discovery and data mining, pages 1135–1144, 2016.
- [83] Threat hunting for urls as an ioc. https://resources.infosecinstitute.com/topic/threat-hunting-for-urls-as-an-ioc/.
- [84] Antonio Villalón-Huerta, Ismael Ripoll-Ripoll, and Hector Marco-Gisbert. Key requirements for the detection and sharing of behavioral indicators of compromise. Electronics, 11(3):416, 2022.
- [85] J Ray. Understanding the threat landscape: indicators of compromise (iocs), 2015.
- [86] Yizheng Chen, Zhoujie Ding, and David Wagner. Continuous learning for android malware detection. arXiv preprint arXiv:2302.04332, 2023.