Hidden giants in JWST’s PEARLS:
An ultra-massive 4.26 sub-millimeter galaxy that is invisible to HST
Abstract
We present a multi-wavelength analysis using SMA, JCMT, NOEMA, JWST, HST, and SST of two dusty strongly star-forming galaxies, 850.1 and 850.2, seen through the massive cluster lens A 1489. These SMA-located sources both lie at 4.26 and have bright dust continuum emission, but 850.2 is a UV-detected Lyman-break galaxy, while 850.1 is undetected at 2 m, even with deep JWST/NIRCam observations. We investigate their stellar, ISM, and dynamical properties, including a pixel-level SED analysis to derive sub-kpc-resolution stellar-mass and maps. We find that 850.1 is one of the most massive and highly obscured, 5, galaxies known at 4 with 1011.8 M⊙ (likely forming at 6), and 850.2 is one of the least massive and least obscured, 1, members of the 4 dusty star-forming population. The diversity of these two dust-mass-selected galaxies illustrates the incompleteness of galaxy surveys at 3–4 based on imaging at 2 m, the longest wavelengths feasible from HST or the ground. The resolved mass map of 850.1 shows a compact stellar mass distribution, 1 kpc, but its expected evolution to 1.5 and then 0 matches both the properties of massive, quiescent galaxies at 1.5 and ultra-massive early-type galaxies at 0. We suggest that 850.1 is the central galaxy of a group in which 850.2 is a satellite that will likely merge in the near future. The stellar morphology of 850.1 shows arms and a linear bar feature which we link to the active dynamical environment it resides within.
1 Introduction
Obscuration by dust has been a complicating factor in understanding the properties of high-redshift galaxies for the last 30 years. The first studies of 3 star-forming galaxy samples were selected through their restframe ultraviolet (UV) emission (Steidel & Hamilton 1993). However, the subsequent identification in the sub-millimeter waveband of highly dust-obscured galaxies at similar redshifts (e.g., Ivison et al. 1998) demonstrated a much wider diversity in the properties of galaxies at high redshifts than the just the subset detectable in the restframe UV (Ivison et al. 2000). The potential for entire classes of dusty, massive galaxies (detectable in the sub-/millimeter or the mid-infrared with Spitzer/IRAC) to be missed from UV, visible- and near-infrared-selected samples, variously termed optically/near-infrared faint/dark (or less precisely “HST-dark”), has been a concern for studies attempting to construct stellar-mass-limited galaxy surveys at 1 (e.g., Dey et al. 1999; Caputi et al. 2012; Simpson et al. 2014; Wang et al. 2019). With the launch of JWST, there has been a renewed appreciation of the significant role of dust in defining the observed visible to near-infrared properties of high-redshift galaxy populations (e.g., Barrufet et al. 2023; Bisigello et al. 2023; Kokorev et al. 2023; Magnelli et al. 2023; Pérez-González et al. 2023).
The potential significance of missing optically-undetected populations was underlined by the analysis of large samples of dust-obscured galaxies. These populations are generally optically faint, but the majority of star formation in the Universe at 4–5 was estimated to occur in these obscured systems (e.g., Dudzevičiūtė et al. 2020; Bouwens et al. 2020). It was the rapid evolution in this dust-obscured activity that created the peak in the star-formation rate density at 2 (e.g., Magnelli et al. 2013). Discovering the physical processes driving this dust-obscured activity is thus crucial for understanding galaxy evolution. The most massive and obscured examples of this high redshift, dust-rich population are known as sub-millimeter galaxies (SMGs). They are found from surveys at 1 mm that select galaxies based on cool dust mass out to 6 (e.g., Simpson et al. 2014; Brisbin et al. 2017). These galaxies are proposed to evolve into the cores of massive galaxies at 0 (e.g., Eales et al. 1999; Dudzevičiūtė et al. 2020; Amvrosiadis et al. 2023).
Current studies of the properties of dust-obscured galaxies are hampered by both their complex dust obscuration and high redshift. In particular, their restframe UV-to-visible morphologies (available from HST) may not provide true indicators of their structures, necessary to determine the role of interactions and mergers in driving their evolution (e.g., Gillman et al. 2023; Huang et al. 2023). JWST promises to revolutionize this field by providing high-spatial-resolution imaging in the restframe near-infrared, necessary to map the internal variations in the dust reddening and star formation, as well as isolating any contributions from reddened AGN emission, which have confounded previous attempts to estimate the stellar masses of some of these systems (e.g., Hainline et al. 2011). The analysis of resolved JWST restframe near-infrared imaging will thus hopefully deliver much more reliable stellar masses (Sorba & Sawicki 2018). In particular, 01 FWHM NIRCam imaging will yield more robust stellar morphologies on kpc scales that may indicate what drives the growth of the population of massive, gas- and metal-rich galaxies responsible for the increasing obscuration of star formation at 4–5.
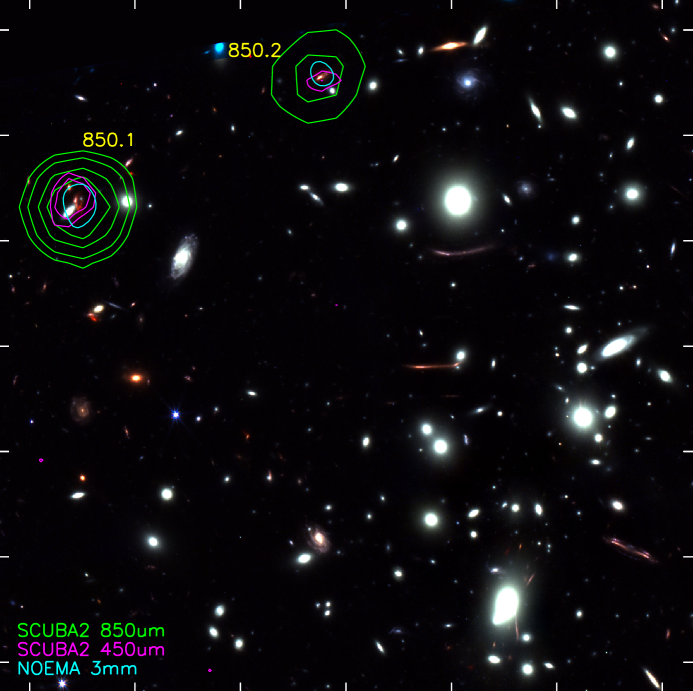
To exploit the unique JWST imaging from the Prime Extragalactic Areas for Reionization and Lensing Science (PEARLS) Guaranteed Time program (Windhorst et al. 2023), we collated the sub-millimeter imaging from the SCUBA-2 camera on JCMT of all the PEARLS fields visible from Mauna Kea, using the JCMT archive at CADC. The analysis of a 30-minute exposure of the cluster A 1489 ( 0.35) revealed two previously unknown, bright 850-m sources, SMM J121223.0+273351 and SMM J121220.4+273410 (hereafter 850.1 and 850.2, respectively) with 60 and 20 mJy. This snapshot observation was so shallow that it would not normally be expected to yield any significant detections, so the presence of two bright sources was a surprise. Initial analysis of these sources suggested that they were likely to be behind the cluster and hence high-redshift, dusty star-forming galaxies gravitationally magnified by the massive foreground cluster (Zitrin et al. 2020).
Gravitational lensing has been used as a tool to aid the study of dusty galaxies at high redshifts since their discovery. The first example of a high-redshift dust-obscured galaxy, FSC 10214 at 2.286 (Rowan-Robinson et al. 1991), was uncovered by virtue of the gravitational magnification caused by a serendipitously positioned foreground galaxy. Lensing by clusters and individual galaxies has been exploited ever since to study high-redshift dusty star-forming galaxies (e.g., Smail et al. 1997; Swinbank et al. 2010; Ciesla et al. 2020; Fujimoto et al. 2023), as lensing both boosts the apparent fluxes and magnifies sources across all wavelengths, making it easier to study these otherwise very faint galaxies.
Follow up of the two A 1489 sub-millimeter sources with SMA, NOEMA, and JCMT gave precise locations and redshifts for the two bright sources and constrained their far-infrared emission. These observations showed that the two sources were indeed very dusty, star-forming galaxies lying 100 kpc apart in a structure at 4.26. One counterpart was undetected in the HST and Spitzer 3.6/4.5-m imaging of this field, while the other corresponds to a UV-bright Lyman-break galaxy. They are thus examples of the two populations that dominate the star-formation-rate density in the transition from primarily unobscured at 5 to predominantly obscured at 4–5, with the benefit that the lens magnification will help JWST resolve their internal structures.
The structure of this paper is as follows: §2 describes our new and archival multi-wavelength observations, their reduction and analysis, including spatially resolved spectral energy distribution (SED) fitting. §3 presents our results and discusses these, and our conclusions are given in §4. We assume a cosmology with 0.3, 0.7, and 70 km s-1 Mpc-1. In this cosmology the luminosity distance to 4.26 is 39.4 Gpc and 1′′ corresponds to 6.9 kpc before correcting for lens magnification. All quoted magnitudes are on the AB system, and uncertainties on median values were derived from bootstrap resampling. The quoted stellar properties assume a Chabrier initial mass function (IMF).
2 Observations, Reduction and Analysis
2.1 JCMT
The initial 30-minute SCUBA-2 observation of A 1489 came from program M15AI29, taken in very good weather, 0.03, on 2015 May 6. The 850-m map showed two significantly detected point sources, one of which was exceptionally bright. The presence of these unusual sources in this JWST survey field motivated us to obtain higher resolution continuum observations at 880 m with SMA as well as deeper continuum observations at 450/850m with SCUBA-2, and spectroscopic observations covering the 3-mm band from NOEMA.
To improve the sub-millimeter maps, the cluster was observed for program M23AP006 with SCUBA-2 simultaneously at 450 m and 850 m (at resolutions of 75 and 145 FWHM, respectively) in very good weather conditions 0.03–0.04 on the nights of 2023 February 15, March 21 and May 14. The total exposure time was 3.5 hours using a standard constant-velocity daisy mapping pattern, and the 30 minutes of exposure taken in similar conditions from M15AI29 was added to give a total exposure time of 4 hours in each band.
Individual maps for each 30 minute observation were reduced using the Dynamic Interactive Map-Maker (dimm) tool of the Sub-Millimetre User Reduction Facility (smurf; Chapin et al. 2013) with the blank field configuration in order to detect point sources within the maps. The bright source 850.1 was well-detected in each 30 minute exposure, so a shift-and-add method (Ivison 2006) was applied to the data, co-aligning the positions at 850 m to the median position from the M23AP006 observations. The same offsets were applied to the 450 m maps and this modestly improved the signal-to-noise for sources in both bands.
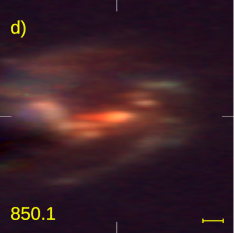
The individual maps were calibrated using a flux conversion factor of FCF450μm = 491 Jy beam-1 pW-1 and FCF850μm = 537 Jy beam-1 pW-1 (Dempsey et al. 2013) and then combined using inverse-variance weighting to create a final map at each wavelength. To improve point-source detection, the resulting 450 m and 850 m maps were match-filtered with their respective beams: 75 and 145 FWHM Gaussians. The maps were cropped to radii of 40, where the noise was low and more uniform, providing coverage of all of the primary JWST field. The 1- sensitivity in the region of 850.1/850.2 was 1.5 mJy at 850 m and 21 mJy at 450 m after matched filtering. The resulting 450 m and 850 m maps are shown in Figure 1.
The new maps identified a third bright sub-millimeter source to the north west of the cluster, SMM J121213.4+273517, with = 16.5 mJy, but undetected at 450 m (Table 1). Unfortunately this source is 2′ from 850.2 and lies outside the coverage of the existing HST, JWST, SMA, and NOEMA observations, and there was no obvious counterpart in the Spitzer imaging. This source is not discussed further, beyond noting that it is likely to be intrinsically luminous as the lensing magnification from the cluster will be modest ( 1.5 ) and the 450/850-m flux ratio suggests this source may lie at 3, thus it could be another member of the 4.26 structure.
Positions and flux densities for all three 850-m sources were derived by fitting Gaussian beams to the 850-m and 450-m maps. The resulting fluxes are given in Table 1, these were deboosted at 450 m following Geach et al. (2017) to reflect the lower signal to noise.
2.2 SMA
The Submillimeter Array (SMA) observed the JCMT-determined positions for 850.1 and 850.2 during a single transit between UT 6.1 and 16.3 on 2022 March 14. At the time, the SMA was operating with all eight antennas in the EXT configuration (maximum baselines of 220 m). The array receiving system was tuned to an LO frequency of 346 GHz (giving an effective band center of 880 m), providing LSB coverage from 330–342 GHz and USB coverage from 350–362 GHz in each of two orthogonally polarized receivers, resulting in 24 GHz of dual-polarization continuum bandwidth. The weather was good, with the precipitable water vapor column ranging from 1.5 to 2 mm and stable, low atmospheric phase variation (“seeing”).
Observations were made in a short repeated cycle, measuring the nearby phase and amplitude gain calibrator J 1159+292 for 1.5 minutes, then the positions of 850.1 and 850.2 for 4 minutes each. This resulted in high quality gain calibration transfer to each target. In total, 850.1 was observed for 3.75 hours and 850.2 for 3.85 hours. Passband calibration was determined from observations of J 0854+201, J 1159+292, and BL Lac, and the absolute flux scale was derived from observations of Ceres and MWC 349A, taken immediately before and after the targets.
For each source, the resolution of the synthesized beam was 085 063 – around 10 better than from SCUBA-2 – and for sources with lensing magnification of 4–6, the circularised beam corresponds to 2.0–2.5 kpc FWHM in the source plane. The rms of the maps was 0.8 mJy beam-1 and both 850.1 and 850.2 were well detected in these sub-arcsecond resolution maps, precisely locating the sub-millimeter sources. Table 1 reports their precise positions.
850.1 was detected with a peak flux density around 19 mJy. However, this source was clearly resolved in both dimensions (Figure 2). Similarly, 850.2 had a peak flux density of 9 mJy, although it also appeared resolved in the EastWest direction. The vector-average amplitude versus distance plots for both sources showed increasing amplitudes on short baselines. This demonstrated that both sources were resolved. Fitting the visibility data and extrapolating these to zero spacing indicated total flux densities of 42.3 1.6 mJy for 850.1 and 22.5 1.6 mJy for 850.2. Table 1 reports these values, along with the other long-wavelength measurements. The estimated flux density for 850.2 was in good agreement with that measured at 850-m by SCUBA-2, but the SMA observations were 20% lower for 850.1, a 6.5 difference. Half of this may be accounted for the difference in the effective band centers of the two instruments, but the remainder suggests that there may be further extended continuum, or [Cii] emission (Smail et al. 2011), around 850.1 that was resolved out with the sub-arcsecond SMA beam.
Using the aips task uvfit, elliptical Gaussian models were fitted to the data for each source. This derived beam-corrected FWHM of 100 014 065 014 (PA of 23 7 degrees) for 850.1 and 105 016 043 020 (PA of 22 8 degrees) for 850.2. These correspond to circularised equivalent FWHM sizes of 5.6 1.4 kpc and 4.6 2.4 kpc (uncorrected for lensing).
At the redshifts of 850.1 and 850.2 determined from their NOEMA 3-mm spectra (see next section), the [Cii] 1900.54 GHz line falls in the spectral coverage of the SMA observations. The 1- sensitivity of these data after binning to 120 km s-1 (143 MHz) channels was 25 mJy. However, this was insufficient to detect [Cii], assuming typical [Cii] to far-infrared luminosity ratios for the sources. A search for the line in the sources did not show any significant line emission associated with the continuum sources at the relevant frequencies.
2.3 NOEMA
NOEMA observations were obtained as part of the S22CX program in several partial tracks during 2022 July. An earlier Gemini-N GMOS program (GN-2020A-Q-903, PI: Zitrin) had yielded an optical spectroscopic redshift from template-fitting of 4.267 (Nonino, Zitrin priv. comm.) for the SMA-located HST counterpart to 850.2. This allowed the LO tunings to be chosen to cover the expected frequencies of the CO(4–3), CO(5–4), and [Ci] lines of this source, in the expectation that 850.1 was likely to lie at high redshift and potentially the same redshift as 850.2. Hence, two setups were used in Band 1 (3 mm) with LO frequencies of 93.5 GHz and 101.244 GHz. Tthe wide bandwidth of the PolyFiX correlator means that these two setups covered a contiguous frequency range of 31 GHz from 81.88–112.86 GHz. All tracks were observed in the compact D-configuration (maximum baseline length 175 m) with 10 antennas in the array for five partial tracks, nine antennas for three partial tracks, and eight antennas for one partial track.
Calibration was performed using the Grenoble Image and Line Data Analysis Software (gildas) package. Either MWC 349 or LkHa 101 was observed for use as the flux calibrator; in cases where one of these sources was either not observed or the data were of poor quality, the gain calibrator 1156+295 was used as the flux calibrator, bootstrapping its flux from other tracks with reliable observations of MWC 349 or LkHa101. Bandpass calibration was obtained from observations of 3C 273, 3C 279, and BL Lac. After flagging for bad visibilities, the effective on-source time for a 10-antenna array for each of 850.1 and 850.2 was 1.6 hours from the lower frequency setup and 1.8 hours from the higher frequency setup. Finally, dirty cubes were produced with mapping (part of the gildas package) using natural weighting from -tables resampled to 20 MHz. The synthesised beam sizes for the cubes ranged between 38 to 61 FWHM.
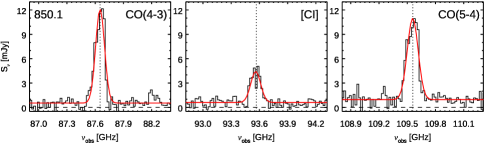
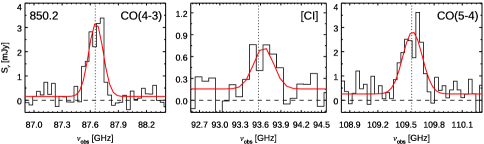
The reduction of the NOEMA observations showed 3-mm continuum detections of both sources with positions that agree within the relative astrometric uncertainty with those from SMA (Figure 1). Spectra extracted at the positions of the two galaxies yielded three lines in each spectrum (Figure 3). The frequencies of the brighter two lines in each source were 87.65 GHz and 109.56 GHz (Figure 3, Table 2) corresponding to CO(4–3) and CO(5–4), at 461.041 GHz and 576.268 GHz in the restframe, respectively. The third, fainter line in each source (at 93.6 GHz) was [Ci](1–0) at 492.161 GHz. These low-resolution observations in NOEMA’s compact configuration showed no significant evidence for extended emission in either the continuum or lines.
Gaussian fits to all three emission lines in each source yielded redshifts of 4.2599 0.0001 for 850.1 and 4.2593 0.0003 for 850.2 (Figure 3). The latter was in reasonable agreement with the optical measurement for 850.2. The Gaussian fits were then used to derive line centers and widths, which were used to integrate the emission to derive the intensity (after continuum subtraction) within a window of FWHM around the peak. For the weak [Ci] line in 850.2 the FWHM of the CO lines was used to determine the integration window. From these the line intensity, center and width (expressed as an equivalent Gaussian FWHM), were measured along with their uncertainties. The second moment of the line yields FWHM-equivalent estimates that were 20% smaller than the Gaussian fitted values. 850.2 shows evidence of a double-peak profile in both the CO(4–3) and CO(5–4) lines (Figure 3), and so for that source the velocity difference between the two peaks was instead used as the best estimate of the kinematics of the source. The line and continuum properties of both sources are given in Tables 1, 2, & 3. The CO line luminosities were used to estimate line luminosity ratios between transitions from to , , following Solomon & Vanden Bout (2005).
2.4 HST, JWST, & SST
The details of the observations, reduction, and analysis of the HST imaging of A 1489 (PID: 15959) were reported in Zitrin et al. (2020). The observations were obtained in 2020 March and comprised a total of five orbits, including one orbit ( 1.9 ks) in each of the F435W, F606W, and F814W filters with ACS and shorter exposures with WFC3 in the F105W, F125W, F140W, and F160W filters. The WFC3 data were not used in our analysis as they were shallower than the equivalent JWST imaging and also do not cover both targets. As described by Zitrin et al. (2020), mosaiced images were produced for all of the HST filters using the calibrated exposures at a pixel scale of 0.03′′ pixel-1 (matching that used for NIRCam) on an astrometric grid aligned to Gaia DR2. See Zitrin et al. (2020) for more details of the reduction and analysis.
JWST observed A 1489 as part of GTO program 1176 (PEARLS, Windhorst et al. 2023) targeting moderate-redshift clusters and blank fields to study galaxy evolution. A 1489 was imaged in 2023 January with NIRCam filters F090W, F150W, F200W, F277W, F356W, and F444W. Observations of F090W and F444W were taken with the MEDIUM8 readout with six groups per integration and four integrations for a total exposure time of 2.5 ks. F150W and F356W were observed with a SHALLOW4 readout with nine groups per integration and four integrations for a total exposure of 1.9 ks. While F200W and F277W were observed with a SHALLOW4 readout with ten groups per integration and four integrations for a total exposure of 2.1 ks.
Images were initially processed using the STScI calwebb pipeline with the jwst_0995.pmap context. Further processing was then applied to remove artifacts in the images. These steps were described in detail by Windhorst et al. (2023). In brief, “snowballs” (resulting from energetic cosmic ray hits) were identified and masked, then “wisps” caused by straylight from the secondary-mirror support were corrected using filter-specific templates, next striping due to amplifier differences was corrected by matching the background level in adjacent columns using the ProFound code (Robotham et al. 2018). Finally, detector-level offsets in the short-wavelength camera were corrected by constructing a “super-sky” with ProFound and scaling each detector to that sky level.
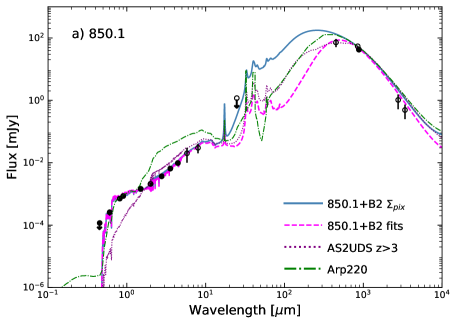
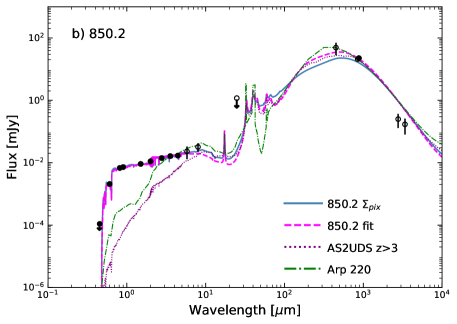
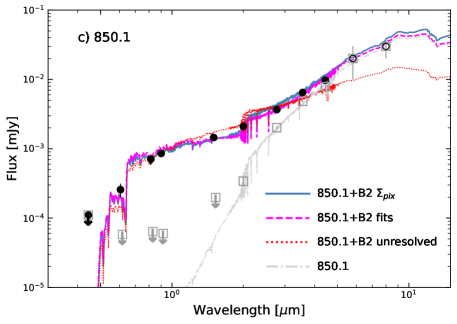
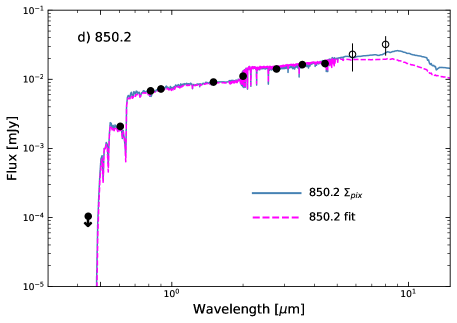
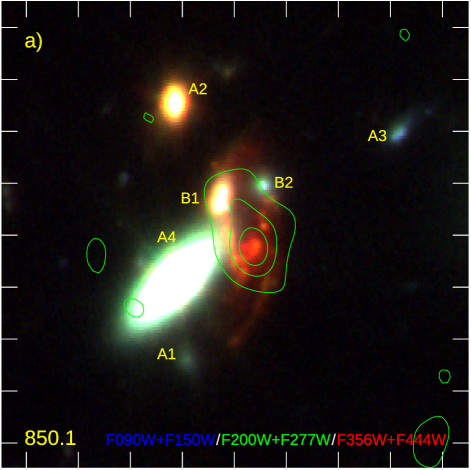
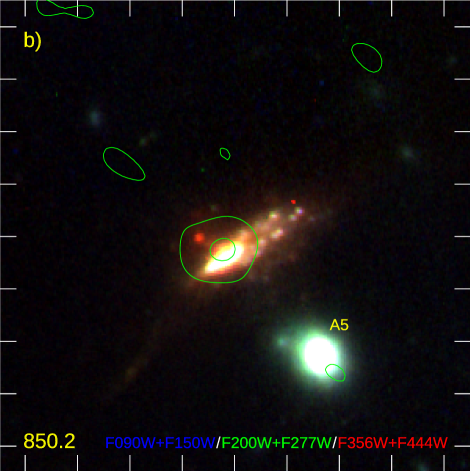
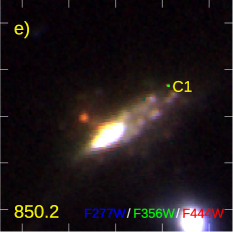
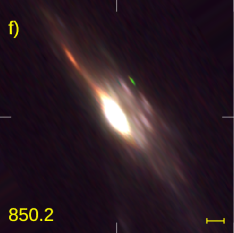
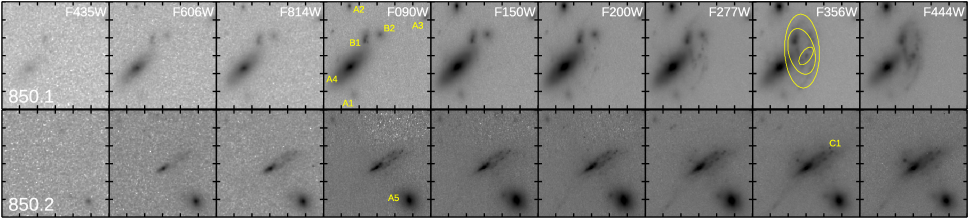
Figure 1 shows a JWST/HST view of the wider environment of 850.1/850.2. More detailed zooms are shown in Figure 2, including the SMA 880m maps that precisely locate the counterparts to the sub-millimeter sources. Figure 4 illustrates the variation in the brightness of the two counterparts with wavelength across the nine JWST/HST bands. Sources were identified in a sequence starting with “A” for distinct sources, “B” for potential subcomponents, and “C” for likely emission-line features. These are labelled on the F090W images.
To extend the wavelength coverage of these dusty, high-redshift galaxies, the pipeline reductions of the Spitzer IRAC and MIPS 24 m images of A 1489 were retrieved from the SST archive. This was undertaken prior to both the launch of JWST and the SMA observations, finding potential 8-m bright counterparts within the SCUBA-2 error circles for both 850.1 and 850.2, that turned out to be the correct identifications. These data were included in our SED analysis to extend the wavelength coverage in the gap between JWST and SCUBA-2. Neither source was detected at 24 m with MIPS. This was unsurprising given their high redshifts and the modest depth of the data, and so a 3- limit was adopted at that wavelength (Table 1). The emission in the IRAC bands was blended with the nearby galaxies for both 850.1 and 850.2, and therefore the flux estimates were based on small 24–36 diameter apertures. However, the sub-millimeter galaxies were increasingly dominant at the longer wavelengths and 850.2 was effectively uncontaminated by 8 m. For both sources, excluding the IRAC and MIPS data points, or adopting limits instead, did not alter the solutions for the best-fit SEDs obtained below.
To measure integrated photometry for 850.1/850.2 and the other sources in close proximity to them in the JWST and HST data, large circular apertures were used (except for 850.1) with sizes listed in Table 4. These measurements used the photometric zero points from Windhorst et al. (2023) for NIRCam and from the ACS pipeline (as given in the FITS file headers) for the ACS imaging. These provided close-to-total fluxes for most of the sources. PSF matching employed model PSFs created with WebbPSF v1.1.0 or TinyTim for HST/ACS, utilizing the odt files closest to the observation date, and convolved to match the F444W PSF. Due to the large aperture sizes, PSF corrections for 850.1/850.2 were modest in all cases. Sky corrections were derived from large annuli around the targets. An additional correction was applied for the contribution from the disk galaxy, A4, to those sources around 850.1. This was modelled in each filter assuming rotational symmetry and rotating the images by 180 degrees around the center of A4, then smoothing slightly, before subtracting this image from the original. The resulting photometry is listed in Table 4 with 3- limits for non-detections.
To determine the sizes and profiles of the two sources, the galfit code was applied to the different JWST wavebands assuming single Sérsic profiles and correcting for the varying resolution between the bands using an empirical PSF taken from stars in the images. This process was challenging in the crowded environment of 850.1, especially given the fine structures visible in the surrounding galaxies as a result of the superlative resolution and depth of the data. However, aided by the fact that the bulk of 850.1 was undetected in the F090W image, a model was constructed in this band of the surrounding galaxies and used as the basis for constrained fitting to the redder passbands, where a further component was included to represent 850.1. The structural parameters of both sources from this analysis are reported in Tables 2 & 5.
2.5 Integrated SED modelling
The SED modelling of the two sub-millimeter sources was iterated with the aim of understanding the nature of the various subcomponents in these systems and so derive robust physical properties for the two galaxies. The analysis employed both the photometric-redshift version of the magphys code (Battisti et al. 2019) as well as the high-redshift version (da Cunha et al. 2015) to derive parameters at the known CO redshifts, both using the standard priors (including a star-formation history that rises at early times, before declining exponentially, with superimposed random bursts). The selected codes were applied to the integrated photometry of the sources (including potentially unrelated subcomponents), to the integrated photometry of the individual subcomponents, and also to the resolved “pixel-level” photometry (described in the next subsection). In principle, the latter resolved SED fitting should be most robust, but the modest resolution of some of the longer-wavelength observations (Spitzer IRAC, SCUBA-2, and NOEMA) means that there were fewer constraints available on the form of the SEDs. For this reason the resolved SED fitting is presented as a proof-of-concept, and for most of the quantitative analysis, the fitting to the integrated photometry was used to derive the physical properties.
The photometric analysis of 850.2 was straightforward owing to the relative isolation of the galaxy from other sources in the field, as well as the relatively good agreement between the redshifts derived from the CO/[Ci] emission lines and the archival restframe UV spectroscopy. The latter confirmed that the emission seen in both sub-millimeter and the restframe UV–optical all arises from the same physical system, although not necessarily precisely the same components within this system.
In contrast, 850.1 has a complex environment and the analysis of this system required iteration. Based on the source morphology and its variation with wavelength shown in Figure 4, as well as the results from the resolved SED modelling discussed in the next sub-section, the emission around 850.1 was divided into three components: two blue “knots” B1 and B2, and the bulk of the remainder of the source, 850.1, which shows much redder colors and corresponds to the peak of the SMA map (Figure 2). The analysis started by estimating likely redshifts for these three components as well as the other sources seen close to 850.1/850.2 that lacked spectroscopic redshifts (those marked in Figure 2 and listed in Table 4 & 5), with the photometric redshift version of magphys (Battisti et al. 2019; da Cunha et al. 2015). These photometric redshifts are reported in Table 5. These were then used to assess the level of agreement of the spectroscopic redshift measurements for 850.1 and 850.2 with their photometric properties.
For 850.2, the photometric redshift, 4.28, driven by the strong Lyman break in the broadband SED (Figures 4 & 5) was in excellent agreement with the spectroscopic redshift 4.26 derived from the multiple lines seen in the NOEMA spectrum (Figure 3), and also the Gemini-N/GMOS spectrum (Nonino, Zitrin, priv. comm.). The latter spectrum showed a pronounced decline in flux blueward of 1215Å, no Lyman- emission but a series of strong absorption features including Siii 1260, Oi+Siii 1303 (blend), Cii 1334, Siii 1526 and Civ 1548, Feii 1608 and Alii 1670. The Siii 1265 and Civ 1548 lines displayed P-Cygni-like profiles. These low-ionisation interstellar absorption features are commonly seen in Lyman-break galaxies (Shapley et al. 2003). In 850.2, their measured line centers displayed a median blueshift of 190 km s-1 relative to the CO-derived systemic redshift. This velocity offset may be a signature of a wind, or it indicates that the UV-bright element of the system corresponds to the higher frequency peak in the CO spectrum of the source (Figure 3), with the redshifted CO component then potentially arising in the redder part of the system.
A similar photometric analysis for 850.1, used a photometric aperture that includes the emission from the two knots B1 and B2 (Figures 2 & 4, Table 4). This resulted in a photometric redshift that was significantly lower than the CO redshift: 2.63 (Table 5). Figure 4 shows clearly that B1 and B2 are considerably bluer than the bulk of 850.1, both dominating the emission shortward of 2 m, and B1 is visible all the way down to F435W, where the wavelength coverage of the filter falls almost completely blueward of 912Å in the restframe at 4.26. Photometric redshifts measured for the three components individually yielded estimates of 1.12 and 4.17 for B1 and B2, respectively, while the very red 850.1 gave 4.41 in reasonable agreement with the CO redshift (Table 5).
The photometric redshift estimate for B1 indicated that the source was unlikely to be associated with either 850.1 or the foreground cluster. Thus, while the alignment of B1 with features in 850.1 is very suggestive that they are related, B1’s detection in the F435W filter is hard to reconcile with it lying at 4.26, and it is more likely to be a superimposed lower-redshift source. The situation is more complicated for B2, where the estimated photometric redshift suggests it could be associated with 850.1 at 4.26, but the uncertainty allows much lower redshift solutions as well. We therefore retain B2 as a potential UV-bright component within 850.1 or a close/interacting companion and discuss how this influences the inferred properties of the source.
Having confirmed that the measured photometry for 850.1, B2, and 850.2 were all consistent with the CO-derived redshifts, more representative estimates of their physical properties were derived by running the high-redshift version of magphys (da Cunha et al. 2015) with the redshifts fixed at 4.26 for all three components. The main parameters from these fits are reported in Table 5 and the best-fit SEDs plotted in Figure 5. For 850.1 and B2, the two best-fit SEDs were summed and labelled “850.1+B2 fits”, and this is plotted compared to the integrated photometry of the system, although 850.1 dominates the emission longward of 3 m. In addition, Figure 5c show the results of fitting solely to 850.1, illustrating the very red colors of this source.
The fit to the combined photometry of 850.1 and B2 using a single magphys model and labelled “850.1+B2 unresolved” is also shown in Figure 5c. This was much less successful at reproducing the optical/near-infrared SED of the combined source. This resulted in a statistically much poorer fit to the observed photometry that predicted a much lower mass, star-formation rate, and age (see Table 5) but a comparably high dust mass to the preferred sum of the individual fits to 850.1 and B2. These parameters would imply a galaxy more similar to 850.2 in its physical properties, but we believe that this poor fit was erroneous due to the distinct low and high extinction regions that were being modelled with a single dust extinction term. Similar model biases may also be responsible for some apparently low-mass sub-millimeter galaxies identified from SED fitting of systems with a wide range in (e.g., Pope et al. 2023). This erroneous fit also produces an apparent power-law-like excess in the observed fluxes longward of 3.6 m compared to the model. This is reminiscent of similar features seen in the SEDs of 10% of sub-millimeter sources analysed by Hainline et al. (2011), who attributed it to hot dust emission from dust-obscured AGN. If the origin of this excess is similar in those sources to 850.1, then an obscured AGN may not be the cause as there is no such bright compact, red point-source seen in 850.1. Instead the red mid-infrared excess may be a result of fitting a single SED model to a source with a mixture of internal dust obscuration, including both weakly and highly reddened regions.
2.6 Resolved SED modelling
The high resolution and depth of the JWST/HST imaging of these sources can be used to go beyond the analysis just described to undertake resolved SED modelling of the sources to investigate their internal structures. Specifically to map the distribution of stellar mass and dust reddening within the two systems (see also, Duncan et al. 2023). To perform this analysis 9 9′′ thumbnails were extracted from the JWST and HST imaging centered on 850.1 and 850.2. The JWST thumbnails were weighted and coadded, the combined image smoothed with a Gaussian filter with a FWHM of 007, and then SExtractor Bertin & Arnouts (1996) used to construct a segmentation map. The segmentation maps was employed to identify regions of blank sky that were used to estimate the pixel-to-pixel noise and also to define areas associated with the various sources. To aid this for 850.1 the large-scale emission from the bright galaxy, A4, was first removed by rotating the images by 180 degrees centered on A4 and subtracting these from the original frames.
To ensure that the final spatially resolved maps were not oversampled, the JWST and HST images were PSF-matched to the resolution of the F444W observations, 015. These images (and the associated segmentation masks) were then rebinned from the default 0.03′′ pixel-1 sampling to 0.18′′ pixel-1, to provide nearly independent pixels. From this binned data, photometry was extracted in all the JWST/HST bands for each 018 pixel, including the uncertainties measured from the pixel-to-pixel variations in the background regions.
To include information about the longer-wavelength emission, the SMA 880-m map was used to provide a constraint on the long wavelength pixel-to-pixel photometry. For each source a model was constructed from the deconvolved 880-m source properties measured by SMA and sampled at 018. For the 880-m photometry, liberal uncertainties of 2 mJy per pixel were adopted to avoid over-constraining the magphys fits and also to reflect the fact that the resolution of the SMA map was coarser than the JWST/HST imaging.
For the magphys analysis of the pixel-based photometry, at least three detections were required at 3 in the visible or near-infrared wavebands to include the fitted parameters in the analysis. Fits to pixels with too few photometric constraints resulted in poorly constrained properties. However, the results did not change significantly if 2- limits in three bands or 3- in two bands were used instead, although the uncertainties became more significant. To derive the physical properties of each source the high-redshift version of magphys was applied to the photometry for each pixel within the segmentation mask that defines each of the sources. A fixed redshift of 4.26 was used, but all other parameters were allowed to vary according to the standard priors used in the previous section, and also adopted in previous studies (e.g., Dudzevičiūtė et al. 2020). For the analysis of 850.1, the pixels that were associated with B1 were included, but then removed as this appears to be an unrelated foreground source. This conclusion was also supported by the of the magphys fits for B1 at 4.26 being significantly worse than those in the remainder of the source ( 20, compared to 1).
Two further requirements were applied in the resolved analysis for a fit to a pixel to be included in the final maps. Firstly, the magphys fit had to provide a reasonable description of the photometric observations, yielding a 10. This removed seven pixels in 850.2 and none in 850.1. Secondly, the predicted 850-m flux density from the best-fit magphys SED for the pixel must not exceed 10 mJy. This caught situations where the predicted restframe far-infrared SED for the pixel, which was only weakly constrained by the SMA observations, was strongly at odds with the expected flux distribution for the source. This affected only four pixels from 116 in 850.1 and twelve from 415 in 850.2. Typically these were in the lowest surface brightness regions on the periphery of the sources and these pixels were replaced by the local median fit. With these cuts applied, the total sub-millimeter flux densities for the sources from summing the predicted magphys 850-m fluxes were 52 mJy for 850.1, compared to 42.31.6 mJy and 54.11.5 mJy observed by SMA and SCUBA-2 respectively, and 14 mJy for 850.2, compared to 22.51.6 mJy and 21.21.5 mJy for SMA and SCUBA-2 respectively. Figure 5 shows the predicted full SEDs for both sources, constructed by summing the individual best-fit pixel SEDs. These provide very good fits to the visible to near-infrared (including the longer wavelength Spitzer bands that were not included in the resolved analysis), and while the agreement at longer wavelengths in the restframe far-infrared to sub-millimeter was poorer, given the limited information available at these wavelengths for a spatially resolved analysis at JWST resolution, we view the agreement as reasonably successful.
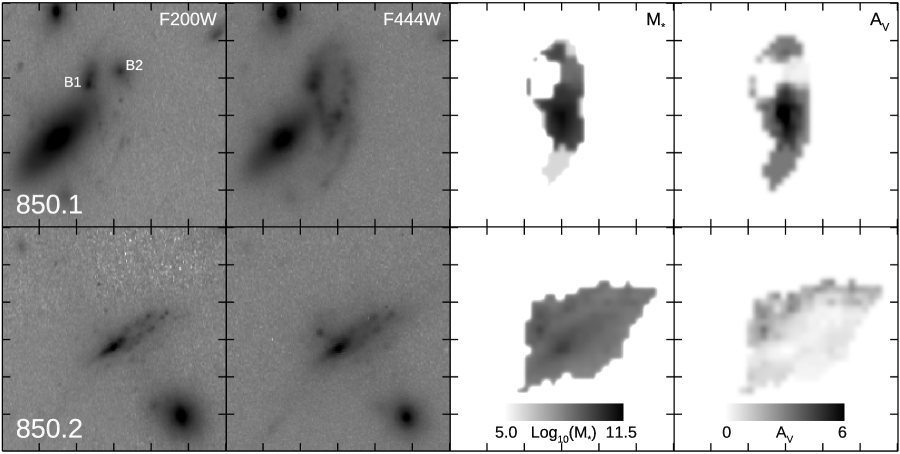
This resolved analysis allowed the internal variation in some of the key physical properties of the sources to be mapped on 018 scales, equivalent to 0.5–0.6 kpc in the source plane after accounting for lensing magnification. The discussion below focuses on the distribution of stellar mass and dust reddening, , as these two quantities are most closely tied to the photometric properties in the JWST and HST wavebands, where the observations have the highest resolution and signal-to-noise. The absolute normalisation of these maps will depend on the SED modelling code used (e.g., Carnall et al. 2019; Pacifici et al. 2023), but for comparison with the earlier results and published samples we use magphys. The resolved 2-D maps of the estimated stellar-mass density and dust reddening for 850.1 and 850.2 are shown in Figure 6.
3 Results and Discussion
Figure 2 illustrates the JWST/HST view of the surroundings of the two sources as well as their morphologies after correcting for the image shear due to lensing, while the variation in their brightness across the nine JWST and HST bands is shown in Figure 4. Strikingly, 850.1 is undetected in all the HST ACS bands and the bluer JWST bands, the bulk of the galaxy only being significantly detected at 2 m or above, while 850.2 displays emission down to F606W but then a strong drop between F606W and F435W (see Figures 4 & 5).
There are a number of sources detected with JWST/HST lying close to 850.1 and 850.2, with photometric redshifts reported in Table 5. These redshifts indicated that two of the galaxies near 850.1, including the bright disk galaxy A4, are probably members of the cluster A 1489 at 0.35 and that similarly, the disk galaxy A5, near 850.2, is also likely to be a cluster member. This is unsurprising given that the two sub-millimeter sources are seen through the dense central regions of the foreground cluster. This analysis also suggested that none of the other galaxies visible in close proximity to 850.1 and 850.2 is likely to be physically associated with the sub-millimeter sources.
3.1 Gravitational lens model
A first strong-lens model for A 1489 was presented by Zitrin et al. (2020) based on multiple images identified in their HST observations. The analysis here uses a new lens model based on the same set of multiple images but employing a revised and updated version of the Zitrin et al. (2015) parametric code (Pascale et al. 2022; Furtak et al. 2022). In this model, cluster galaxies were modeled as double pseudo-isothermal ellipticals (dPIE) and dark matter haloes were modelled using pseudo-isothermal elliptical mass distributions (PIEMDs). Two such halos were used for A 1489, centered on the two main mass clumps identified by Zitrin et al. (2020) and mass components were included to represent the cluster galaxies near to 850.1 and 850.2, including A4 and A5.
The updated lens model predicts similar lensing magnification for 850.1 and 850.2 (Table 5) of 4.0 and 5.6, respectively, where the uncertainties were judged from the range of acceptable models and are expected to be conservative. These values were employed when comparing the properties of these sources to other populations. Table 6 lists intrinsic, lensing-corrected, properties for both sources. The NIRCam morphologies of the sources after correcting for the lensing magnification are shown in Figure 2d and 2f.
Accounting for lensing magnification, 850.1 has an intrinsic 850-m flux density of 13.5 0.4 mJy, while 850.2 has 3.8 0.3 mJy. This shows that 850.1 is an example of a rare population of very luminous sub-millimeter sources with a surface density of 10 5 degree-2 (Geach et al. 2017; Simpson et al. 2019; Garratt et al. 2023), while 850.2 comes from a much more numerous population around the knee in the 850-m counts (Stach et al. 2018) with a surface density 50 higher ( 500 degree-2).
Corrected for lens magnification, 1.5 mag, 850.1 would have 29 and 27 for an extended source (not a point source as frequently adopted to define survey limits). This demonstrates that neither previous HST nor ground-based -band surveys would have been able to detect this class of source, let alone if there are less-massive or higher-redshift examples.
After correcting their sky positions for lensing, the relative separation of 850.1 and 850.2 was estimated to be 100 kpc ( 15′′) in the source plane. Thus, without the lensing magnification of the foreground cluster, these two galaxies would appear as a single blended bright ( 17 mJy) source in a single-dish sub-millimeter survey, similar to the associated multiple 4.62 components found in two SCUBA-2 sources by Mitsuhashi et al. (2021). This small spatial separation, along with the line-of-sight velocity difference between 850.1 and 850.2 of only 30 20 km s-1, indicates that these two galaxies are part of a small group at 4.26 lying behind the core of the foreground cluster. Indeed, given the stellar mass for 850.1 estimated below, unless 850.2 has a very high transverse velocity, then it is very likely on a bound orbit and will merge at some point in the future.
This group behind A 1489 adds to a growing list of similar systems comprising one or more sub-millimeter galaxies and other companion galaxies in groups at 2–4, lensed by massive foreground clusters (e.g., Ledlow et al. 2002; Borys et al. 2004; Kneib et al. 2005; Caputi et al. 2021; Frye et al. 2023). In view of the large volumes accessible in surveys for sub-millimeter sources due to the negative -correction, the frequency of identification of such systems may reflect the similarity between the spatial size of group-sized halos with mass comparable to those of sub-millimeter galaxies ( 1013 M⊙, e.g., Stach et al. 2021) and the source-plane extent of the high-magnification region of the most massive clusters at 1 (see Frye et al. 2023).
3.2 SEDs and stellar properties
The spectral energy distributions of the combined 850.1+B2 and 850.2 shown in Figure 5 are strikingly different. Shortward of 2 m (restframe -band) the only emission from 850.1+B2 comes from the component/companion B2, with 850.1 itself undetected (see Figure 5c). In contrast, both the disk and the high surface brightness feature in 850.2 display a blue continuum that is detected down to the restframe far-UV (Figure 4).
The magphys analysis provided a lensing-corrected stellar mass from the sum of the fits to 850.1 and B2 5.5 1011 M⊙ and a star-formation rate (SFR) of SFR 900 M⊙ yr-1 (Tables 5 & 6). These estimates are in reasonable agreement with the sum of the fits to the individual resolved pixels 4.0 1011 M⊙ and SFR 1200 M⊙ yr-1, even though the latter fit lacked several of the mid-infrared and sub-/millimeter photometric constraints used in the former. If B2 is taken to be a separate galaxy from 850.1, the estimates for the system do not change appreciably as the latter contains the majority of the mass and SFR. For 850.2 the estimates were: 0.18 0.07 1011 M⊙ and a SFR 210 20 M⊙ yr-1, with the resolved pixel-fits again in reasonable agreement: 0.40 1011 M⊙ and SFR 200 M⊙ yr-1. AGN contamination is not biasing the high stellar mass derived for 850.1 (or indeed 850.2) as the F444W morphology indicates only a small fraction of the light in the restframe near-infrared could be from a central point source (see Figures 2d and 2f). Similarly, removing the IRAC 5.8- and 8.0-m photometry from the magphys analysis did not change the best-fitting SEDs.
After correcting for lensing magnification, 850.1 is fainter than 850.2 at all wavelengths shortward of 8 m (restframe -band), yet the estimated stellar mass for 850.1 is 30 higher, while its star-formation rate and dust mass are only 3–4 higher than those derived for 850.2. The primary driver of this is the differences in ages for the best-fit SEDs. 850.1 has a best-fit mass-weighted SED with an age of 450 Myr, corresponding to a mass-to-light ratio for the stellar population in the restframe -band (observed 8.5 m) 4.5. In contrast, 850.2 has a much younger best-fit SED with an age of 50 Myrs and 0.3. This difference in age accounts for a factor of 15 in the predicted masses, with the remainder due to the difference in extinction between the two galaxies, 5 mag and 1 mag, equivalent to 1. The time needed to form the stellar masses of 850.1 and 850.2, assuming the current SFRs (averaged over a 100 Myr timescale), was 600 Myrs and 90 Myrs, respectively. These are comparable to the magphys mass-weighted ages for both galaxies, indicating that it is possible that the bulk of the stellar mass in both systems was formed in the on-going star-formation events, with 850.1 potentially forming at 6.
3.3 Morphologies and structures
The extended emission of the two galaxies is well detected in the redder JWST bands and shows that 850.1 is morphologically more complex than 850.2 (Figure 2). The F444W morphology of 850.1 in Figure 4 suggests a nearly face-on system with two arm-like features extending north and south from the ends of a linear structure of clumps. This bar-like feature has a source plane radius of 2–2.5 kpc, and spans a slightly brighter clump at the center of the galaxy. The 880-m emission detected by SMA in 850.1 peaks on the central clump (Figure 2), and the resolved SED analysis shown in Figure 6 indicates that the stellar-mass surface density and the dust reddening also both peak around this region. The map shows a maximum stellar-mass density of 14 1010 M⊙ kpc-2 and a mean density within of (6.41.4) 1010 M⊙ kpc-2. As surface densities these quantities are magnification invariant. The resolved SED maps also indicate that B2, seen in projection against the northern part of the disk of 850.1, has a lower stellar mass surface density, 109 M⊙ kpc-2, than the bulk of 850.1 and also a much lower reddening, 0.3–1.
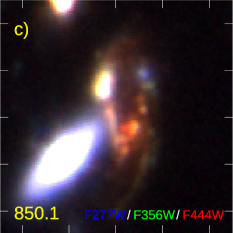
The variation as a function of scale of the orientation of the main structural features in 850.1 is illustrated in Figure 3. Fitted ellipses are overlaid at three surface brightness levels onto the F356W frame showing a change in orientation and ellipticity in the inner regions, compared to the outskirts. This variation is similar to the characteristic change in orientation and ellipticity seen from a bar. More qualitatively, the morphology of this source (seen in the restframe -band) is reminiscent of the bar and arms in NGC 1365, the dominant galaxy the Fornax group, as well as showing features similar to the arms and bars seen in dust continuum in high-redshift sub-millimeter galaxies (Hodge et al. 2019).
Although the internal colors of 850.1 appear uniformly red in Figure 2a, this is misleading as the source is only well detected in the three filters longward of 2.8 m, two of which were combined into the red channel. Figure 2c (and 2d), uses the three reddest JWST bands and shows variation in color within the system, with the reddest region coinciding with the central clump. The map of from the resolved pixel-level SED fits in Figure 6 also indicate a reddening gradient in the 850.1 that ranges from 6.8 in the center to 3 in the outskirts. However, these reddening estimates are for light detected in F444W, and will be lower than what would be measured if longer-wavelength resolved photometry was included. This may explain why the median F444W-weighted from the pixel-level SEDs was 3.6 compared to 5 measured from the integrated photometry including longer wavelength constraints.
While the map of in 850.1 indicates that the central regions are highly obscured (probably even more obscured than shown in the map as this corresponds to light that was still detectable at restframe -band, see Simpson et al. 2017), the outer parts of the galaxy are also surprisingly highly and uniformly reddened out to radii of 3–4 kpc. The simplest explanation may be that this galaxy has a very dusty disk (even if the gas fraction for the system is low, see §3.5), as well as an even more obscured nuclear region. Such extended dust disks have been seen in similarly dust-rich galaxies (e.g., Hodge et al. 2016; Gullberg et al. 2019), in conjunction with more compact dust continuum structures that have been interpreted as bars and rings (Hodge et al. 2019). Another, perhaps more speculative explanation for this wide-spread (and relatively uniform) dust reddening in this (modestly-inclined, in contrast to Nelson et al. 2023) galaxy is a dusty wind, as is seen on similar scales in M 82 (e.g., Yamagishi et al. 2012; Beirão et al. 2015), Mgii absorbers at higher redshifts (Ménard & Fukugita 2012), and also theoretically expected (e.g., Krumholz & Thompson 2013). To illustrate the plausibility of this explanation, we assume a Milky Way gas-to-dust ratio, for which an 3 corresponds to a hydrogen column density of 1022 cm-2 (Bouchet et al. 1985). Integrating over the extent of 850.1 gives a gas mass of 1010 . If this gas (and associated dust) is being expelled in a wind with an outflow rate comparable to the current SFR, then this mass represents just 10 Myrs of activity, during which time the material would cover the extent of 850.1 if it was travelling at the escape velocity. Thus it is possible that the relatively uniform red colors of 850.1 may be due to a foreground screen of dust expelled by a starburst-driven wind.
Turning now to 850.2, this has an asymmetric structure with a bright elongated region (sheared by lensing) and a western extension. The overall appearance is of a dusty, disk-like galaxy (Figure 2). In contrast to the very red colors of the bulk of 850.1, both the high-surface brightness region of 850.2 and the western extension are detected in F606W, corresponding to restframe 1100Å, with neither region detected in F435W, restframe 830Å, indicating the presence of a strong Lyman break in the SED (Figure 4). However, in addition to these UV-bright components there is also faint red emission to the north that shows up as a band of higher- in Figure 6. This northern region includes a compact red component, seen in F277W, F356W and F444W (Figures 2 & 4), that appears as a distinct entity in the source plane (Figure 2f). The peak of the SMA 880-m emission lies between this red clump and the UV-bright region, suggesting that this may be an interacting system with both obscured and unobscured components, and with the unobscured part corresponding to the higher-frequency peak seen in the CO spectrum of this source.
The pixel-level SED fits for 850.2 give 0.3–1.0 over most of the UV-detected region but rising to 3 at the red clump on the northern side. This behaviour contrasts with that seen in local galaxies, where extinction typically rises towards the galaxy center (e.g., Holwerda et al. 2005; Keel et al. 2023). From the stellar mass map the median stellar-mass density within the effective radius in 850.2 was (0.100.01) 1010 M⊙ kpc-2 with a peak of 0.7 1010 M⊙ kpc-2. Thus 850.2 has a more uniform distribution of stellar mass density and than 850.1.
Although 850.2 is very blue compared to 850.1, the UV light traces only 10% of the star formation in this system. In addition, there is a slight excess of emission in the Spitzer 5.8 and 8 m filters above the best-fit model SED in Figure 5 that may indicate a steeply rising SED for the dustier red northern region (but this is far from dominant in F444W). Taken together with the strong far-infrared/sub-millimeter emission, indicating the presence of highly obscured star formation within the system and the velocity offsets seen between the optical and CO spectroscopy, this suggests that there could be two spatially distinct components within this source. However, in contrast to B2 and 850.1 in 850.2 the low-obscuration component dominates from the optical out to at least 4.4 m, with the fainter and more obscured component only appearing at 2 m.
The galfit analysis quantified the stellar continuum structure of the two sources. The analysis of 850.1 in the F444W passband yielded a Sérsic parameter 0.9 0.1 (with lower, but increasingly uncertain, values in bluer bands). A fixed 1 was therefore adopted to simplify comparison of the derived sizes between the bands. This showed a constant effective radius with wavelength of 3.8 0.4 kpc after correcting for lensing (see also Chen et al. 2022; Kamieneski et al. 2023). The similar analysis of 850.2 yielded 1.9 0.1 in F444W, with higher values in the bluer bands, although a combination of a de Vauncoleurs (Sérsic 4) and an 1 Sérsic did a better job of reproducing the asymmetric, extended emission in the source. However, for comparison to 850.1, 1 was adopted, which gave sizes that modestly decrease in bluer bands, but with low significance, and 2.5 0.3 kpc in F444W (also corrected for lensing). These sizes are comparable to those derived in the F444W waveband for sub-millimeter galaxies with flux densities of 1 mJy in the literature: 3.9 0.8 kpc (Cheng et al. 2022, 2023; Chen et al. 2022). There was no evidence for a trend in restframe near-infrared size with either dust mass or redshift for the combined samples.
The dust continuum radii, , derived from the SMA observations (corrected for lensing magnification) were 2.8 0.7 kpc for 850.1 and 1.9 1.0 kpc for 850.2. Compared to the F444W sizes, these gave identical ratios of dust to F444W effective radii of 0.7 0.2 and 0.7 0.4 respectively, similar to previous estimates (e.g., Lang et al. 2019; Gullberg et al. 2019; Chen et al. 2022). These indicate the presence of compact dust-enshrouded regions in the dense cores of both galaxies, linked to the high regions (Simpson et al. 2017).
Finally, galfit was applied to the stellar mass distributions from the resolved, pixel-level SED modelling to attempt to derive stellar-mass radii with a Sérsic profile with 1. However, this proved very unstable and so instead simple numerical integration was used to derive the half-mass radii for the two sources: 1.0 0.2 kpc for 850.1 and 2.2 0.4 kpc for 850.2, both corrected for lensing magnification. While the stellar mass radius determined for 850.2 was in agreement with that measured at F444W, for 850.1 the stellar-mass size was around 4 smaller than seen at F444W. This demonstrates that a significant fraction of the stellar mass in this massive system lies in a compact and very highly obscured nuclear region with the ratios of dust to stellar mass sizes: 2.8 0.9 and 0.9 0.5 for 850.1 and 850.2, respectively.
3.4 Comparisons to dust-mass-selected populations
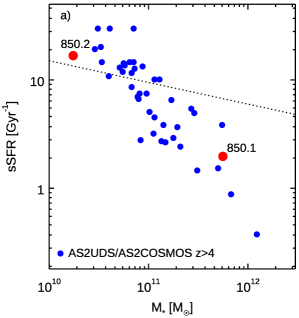
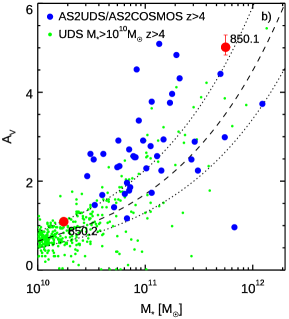
Figure 7 compares the derived properties of 850.1 and 850.2 with a representative sample of dust-mass-selected galaxies derived from ALMA interferometric identifications of 1,000 sources found in 3 degrees2 of wide-field 850-m SCUBA-2 surveys in the UDS and COSMOS fields: AS2UDS (Stach et al. 2019) and AS2COSMOS (Simpson et al. 2020). These samples have been analysed in an identical manner using magphys, allowing us to perform a simple comparison of their derived properties (Dudzevičiūtė et al. 2020; Ikarashi et al. 2023). After accounting for lensing magnification, Figure 7a shows that 850.1 and 850.2 lie at either end of the mass range seen in 850-m-selected galaxies at 4: 850.1 being one of the more massive galaxies found (from dust-selected samples or other methods) at these redshifts, while 850.2 is one of the least massive in dust-selected samples (see also, Pope et al. 2023). Looking at their specific SFR, 850.1 lies below and 850.2 lies just inside the claimed “starburst” regime at this redshift. The strong linear trend in Figure 7a likely reflects the fact that these samples were selected primarily on their cold dust mass, the formation of which requires an equivalent characteristic stellar mass of 1011 M⊙, with an observed dispersion of only 0.4 dex.
Figure 7b shows the variation of with stellar mass for 850.1 and 850.2 compared with the 40 ALMA-identified 4 dusty star-forming galaxies selected from SCUBA-2 mapping in the UDS and COSMOS fields as well as less active -selected star-forming galaxies at 4. This figure demonstrates one of the more strikingly differences between 850.1 and 850.2: they lie at diametrically opposite ends of the trend of with stellar mass for dusty galaxies at 4. Thus these two closely-associated sources span the full range in reddening seen in the high-redshift sub-millimeter population, underlining the diversity in the restframe UV-to-visible properties for dusty star-forming galaxies, which was already present in the population, even in the same environment, at 4. The two sources broadly follow the trend seen in the 4 -selected galaxy population, which has the form 0.42 0.23 with a median absolute deviation of 0.32, although this has a steeper slope than seen at 0 (Garn & Best 2010, but see also Gómez-Guijarro et al. 2023; Shapley et al. 2022).
To test if there were other observed properties that would provide a better predictor of for this sample of 4 SMGs, the correlation of various properties (, , , SFR, , Age, ) with was analysed using maximal information-based non-parametric exploration (mine, Reshef et al. 2011). This showed that the most significant correlation with for the SMG sample was indeed with stellar mass, with a 0.3% chance of random correlation using a jackknife test on the sample and the MINE likelihoods were calibrated with a Monte Carlo simulation. There was only a minor reduction in scatter when additional corrections were included for either or (Gómez-Guijarro et al. 2023), and so it appeared that stellar mass was the most likely driver of the differences in dust reddening between 850.1 and 850.2 (although or SFR did nearly as well).
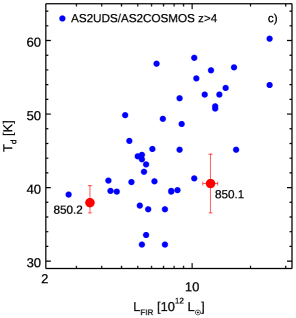
The final panel in Figure 7 showing purely SED properties is Figure 7c, which compares the dust temperature and far-infrared luminosities from the magphys analysis of 850.1/850.2 to the wider dusty 4 population in UDS and COSMOS, where and were derived in very similar ways with magphys. The two galaxies lie within the scatter of the – trend at 4, with 850.1 having a higher far-infrared luminosity and a marginally higher dust temperature (although with considerable uncertainties, even with the inclusion of the 450 m SCUBA-2 photometry). The similarity in the dust temperatures is due to the similar ratios of far-infrared luminosity to dust mass (or equivalently ISM mass, as 850.1 and 850.2 have very similar dust-to-gas ratios, see below) for the two sources: (84) 103 L⊙ M and (71) 103 L⊙ M for 850.1 and 850.2 respectively, suggesting their far-infrared luminosities predominantly arise in similarly optically-thick starburst regions (Scoville 2013).
3.5 Gas and dynamical masses
The lines detected in the NOEMA 3-mm spectra of the sources, along with their dust continuum properties from SMA and SCUBA-2, provide a wealth of information about the properties of the galaxies including both their gas dynamics and the characteristics of their interstellar medium (ISM). Looking first at their ISM properties, the CO line luminosity ratios for the two galaxies are very similar: 0.54 0.01 and [Ci]/CO(4–3) 0.29 0.01 for 850.1; 0.61 0.02 and [Ci]/CO(4–3) 0.29 0.04 for 850.2. These compare to 0.69 0.06 and [Ci]/CO(4–3) 0.82 0.06 for the well-studied 2.3 SMG the Cosmic Eyelash (Swinbank et al. 2010; Danielson et al. 2011), indicating that 850.1 and 850.2 have marginally less excited CO spectral line energy distributions (SLEDs) compared to the Eyelash (i.e. suggesting a flattening/turnover of the SLED around 4–5).
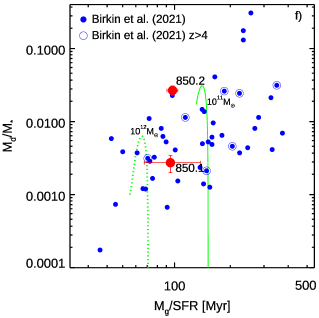
Gas masses were estimated by converting the CO(4–3) line luminosities to CO(1–0) using the Eyelash ratio of 0.50 0.04, noting that its CO SLED appears slightly more excited than either 850.1/850.2 and hence this may underestimate the CO(1–0) line luminosity. Adopting 1, consistent with the available constraints on dust-mass-selected samples and previous studies (Birkin et al. 2021), gives cold gas masses, corrected for lensing, (1.05 0.03) 1011 M⊙ for 850.1 and (0.29 0.02) 1011 M⊙ for 850.2 (Table 6).
The NOEMA spectra also provide kinematic information about the motion of cool gas in the galaxies. The Gaussian FWHM of the CO lines is the best measure of the kinematics of the gas in 850.1. For 850.2, both CO transitions show evidence for double-peaked lines and so the mean velocity difference between the peaks, 330 70 km s-1, was used as the measure of the projected circular velocity. Inclination was estimated from the apparent axial ratio of the source measured in the F444W band and corrected for lensing shear (Table 2). To calculate the dynamical masses a fixed radius of 10 kpc was chosen as this should be sufficient to contain the majority of the stellar and cold-gas mass in these systems.111When estimating the mass of the cold H2 reservoir using a CO(1–0) luminosity extrapolated from moderate- CO lines using a galaxy-integrated conversion factor, , it is critical to appreciate that this does not mean that the extrapolated H2 (or CO(1–0)) reservoir has the same physical extent as the moderate- CO emission. Gradients in the excitation or optical depth will lead to different physical extents for the different tracers (Weiß et al. 2005). Using 10 kpc and gives estimated dynamical masses of 3.8 1011 M⊙ and 0.8 1011 M⊙ for 850.1 and 850.2, respectively. These compare to the total baryonic masses of 6.6 1011 M⊙ and 0.50 1011 M⊙, confirming that the baryonic masses are broadly consistent with the galaxy kinematics derived from the CO line width, given the uncertainties on the inclination corrections. If the calculation had instead used a Milky-Way-like 4.3 to estimate the cold gas mass, then the baryonic masses would rise to 10.0 1011 M⊙ and 1.4 1011 M⊙, which both exceed the dynamical estimates, although they are still formally in agreement due to the large uncertainties on the latter from the inclination corrections and adopted sizes.
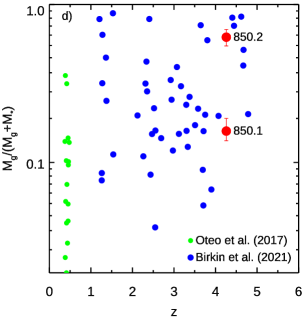
Using the estimated gas masses assuming 1, Figure 7d illustrates the variation in gas fraction of galaxy populations as a function of redshift for dust-mass-selected samples. The gas fraction of 0.16 0.03 for 850.1 is at the low end of the distribution for dust-selected systems at 4, while the estimate for 850.2 of 0.62 0.07 is at the upper end and so more consistent with the rough trend for higher gas fractions at higher redshifts.
3.6 ISM properties
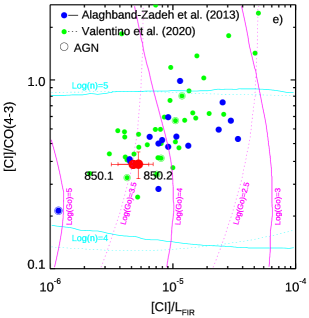
Both 850.1 and 850.2 show fairly lower [Ci] luminosities relative to either their CO(4–3) or far-infrared luminosities compared to many of the high-redshift dust-mass selected galaxies or other [Ci]-detected star-forming galaxies shown in Figure 7e. Following Alaghband-Zadeh et al. (2013), a simple PDR model can be used assess the physical origin of these differences. The ratio [Ci]/CO(4–3) traces the characteristic density of the ISM and [Ci]/ indicates the strength of the radiation field, although the absolute values are sensitive to the chosen model, compare the tracks from Alaghband-Zadeh et al. (2013) and Valentino et al. (2020) in Figure 7e. The Kaufman et al. (1999) PDR model grids indicate well-constrained ISM densities for 850.1 and 850.2, 4.5 0.1 cm-3, and radiation fields of 3.5–4.3 (in Habing units), depending upon the adopted tracks (see the discussion in Valentino et al. 2020). These ISM properties are within the ranges previously estimated for sub-millimeter galaxies and local ULIRGs (see Alaghband-Zadeh et al. 2013; Valentino et al. 2020).
Assuming a simple uniform density sphere for the geometry of the ISM in these sources, then the ISM densities and gas masses indicate a radius of 0.4 kpc for 850.1 and 0.25 kpc for 850.2 (see Yan & Ma 2016). Adopting a more plausible thin disk geometry would result in a larger radius by a factor of 1.9–2.5 for disks with thickness of 0.1–0.05 their diameter. This would correspond to diameters of 1.8 kpc and 1.1 kpc, a factor of 1.6 smaller than the measured dust continuum sizes in both sources (Table 6). However, a more realistic model would involve a multi-phase ISM, with much of the cool gas in a component that is potentially distinct from the star-forming material, thus arguing for using a lower gas mass (relevant for the star-forming phase) in these calculations and hence a smaller volume. Even without this extra complication, it is clear that the dense ISM traced by the moderate- CO lines in these galaxies is limited to a relatively small volume, either distributed as smaller clouds spread throughout the disks or more likely mostly restricted to a compact region in the galaxy centers.
A similar calculation can be undertaken using the ISM radiation fields. For solar metallicities, a Salpeter IMF, and constant-SFR bursts with ages of 50–500 Myr, 10% of the bolometric luminosity arises in ionizing radiation with 6–13.6 eV. Assuming a centrally illuminated spherical shell geometry then the estimated radiation field from the PDR models implies sheel radii 1.1–2.9 kpc for 850.1 and 0.6–1.4 kpc for 850.2. These sizes were smaller than those measured at F444W (Table 6) but are closer to those derived for the total stellar mass (and dust continuum) in §3.2 as well as by previous dust continuum studies (Simpson et al. 2015; Gullberg et al. 2019), although these assume different geometries.
3.7 Gas masses and fractions
Figure 7f shows the variation of dust-to-stellar mass ratio with the gas consumption timescale at the current SFR for the two galaxies. The trend in Figure 7f reflects the fact that galaxy-integrated dust mass provides a crude proxy for gas mass, hence , with similar dust-to-gas ratios of 69 16 and 61 8 for 850.1 and 850.2, slightly lower than the median of 120 50 for the 4 subset from Birkin et al. (2021), with 60 37 for their whole sample. The gas consumption timescales of both galaxies are 100 Myr, so they will consume their current gas reservoirs by 4, unless further material is accreted. While the dust-to-stellar mass ratio for 850.2 is an order of magnitude higher than for 850.1, at 0.026 0.004 compared to 0.0027 0.0009, reflecting the very different stellar masses of the two galaxies. To interpret this difference Figure 7f shows two tracks for proto-spheroid galaxy models (top-hat collapse) from Calura et al. (2017). These show the variation of dust-to-stellar mass ratio with gas consumption timescale for halos with baryonic masses of 1012 M⊙ and 1011 M⊙, which roughly bracket the estimates for 850.1 and 850.2. These evolutionary tracks start at high and initially show rapidly increasing until a peak at 150–200 Myrs before declining, the tracks then terminate at the point that an outflow is expected to remove the remainder of the cold gas in the system. The higher mass model peaks at a lower dust-to-stellar mass ratio owing to the shorter star-formation timescale leading to increased dust destruction, before the galactic wind terminates all star formation. These theoretical models demonstrate that the observed dust-to-stellar ratios for 850.1 and 850.2 can be achieved by models at typical ages of 100–300 Myrs, with their relative dust-to-stellar mass ratios being consistent with 850.1 being older than 850.2.
The ISM properties of 850.1 and 850.2 are surprisingly similar in terms of dust temperature, ionization field, and density, given the very different stellar masses and restframe UV–visible obscuration of the stellar populations in the two galaxies. This similarity has its basis in the comparable ratios of dust mass to far-infrared luminosity (or star-formation rate) for the two systems, which indicates similar relative amounts of ISM mass available to absorb and then reradiate the luminosity arising from the on going star formation (Scoville 2013). In contrast, the dust-to-stellar mass ratios of the two galaxies are very different, reflecting their different evolutionary stages. 850.1 is a much more massive system and is relatively gas poor, suggesting that it may be in the process of quenching its activity. While 850.2 is a young and gas-rich system that is rapidly growing its stellar and dust mass.
3.8 Evolutionary links
850.1 is one of the most massive galaxies known at 4 in terms of stellar or total baryonic mass at 1011.8 M⊙ (e.g., Caputi et al. 2011; Stefanon et al. 2015; Marsan et al. 2022), with a space density of 3 10-7 Mpc-3 estimated from the surface density of comparably bright 850-m sources and assuming a redshift range of 3–6 for the population. This is consistent with expected limits for such massive systems from CDM ( 5 10-6 Mpc-3, Behroozi & Silk 2018). Unlike most previous studies of high-redshift massive galaxies, the high-resolution JWST imaging used here tightly constrains the restframe optical/infrared SED, and also excludes significant contamination from an obscured AGN in our estimates of the stellar mass. Likewise, the sub-millimeter imaging from SMA provided both the identification of this massive (but optically undetected) high-redshift galaxy and also constrained the influence of dust on 850.1’s SED necessary to derive a robust stellar mass (see also Ikarashi et al. 2022).
This analysis also benefited from the high-spatial resolution and long-wavelength coverage of JWST to go beyond what has been previously possible in resolved studies of the stellar content of dusty galaxies at high redshifts (e.g., Lang et al. 2019). The resolved stellar-mass maps from the pixel-level SED fitting indicated stellar mass surface density estimates within the central regions of 850.1 and 850.2 that are comparable to the stellar density of early-type galaxies at the present day, long believed to be the potential descendants of these systems. Moreover, the small stellar-mass sizes for the two sources, 1–2 kpc, are comparable to those claimed for the most compact, massive “quiescent/evolved” galaxies at 1–3, 1–5 kpc (e.g., Waddington et al. 2002; Trujillo et al. 2006; Longhetti et al. 2007; Buitrago et al. 2008; Damjanov et al. 2009; Mowla et al. 2019; Lustig et al. 2021). The stellar-mass sizes for 850.1 and 850.2 are also consistent with the expectations from hydrodynamic simulations (e.g., Wellons et al. 2015), which indicate sizes of 1 kpc for systems with masses of 1011 M⊙.
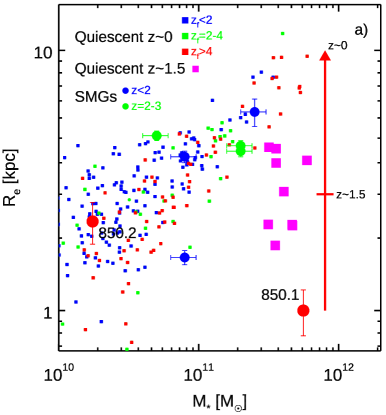
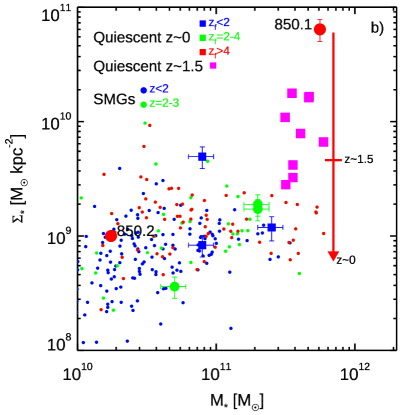
Figure 8 shows the intrinsic sizes and stellar-mass densities for 850.1 and 850.2 compared to their lensing-corrected stellar masses. These are plotted alongside estimates from integrated SED fitting and JWST NIRCam F444W sizes for 1–3 SMGs with 2–4 mJy from Chen et al. (2022), although the F444W-based sizes may overestimate the true stellar-mass sizes for these dust-obscured systems. The figure also includes a sample of high mass spectroscopically-classified quiescent galaxies at somewhat lower redshifts, 1.2–1.7, with estimated stellar masses above 3 1011 M⊙, and sizes derived from HST F160W imaging (Longhetti et al. 2007). These comparisons show that 850.2 has a stellar-mass size and stellar-mass surface density consistent with those seen in early-type galaxies at the present day, as do the other lower redshift sub-millimeter galaxies with comparable 850-m flux densities from Chen et al. (2022). However, 850.1 is an outlier in both panels, with a size that is a factor of 10 smaller than comparably massive early-type galaxies at 0. Nevertheless, the peak stellar-mass surface density for 850.1, 1.4 1011 M⊙ kpc-2, is similar to the characteristic maximum stellar-mass density estimated in the central regions local early-type galaxies (e.g., Hopkins et al. 2009), suggesting a potential link.
Empirical estimates of the size evolution of massive, early-type galaxies out to 3 indicate that these increase at lower redshifts as (e.g., Cimatti et al. 2012; Trujillo et al. 2007; Holwerda et al. 2020). This implies a size increase of 4 for 850.1 from 4.26 to 1.5 and 10 to the present day. The evolution in the size of massive galaxies is driven by minor mergers (such as the potential accretion of B2 and 850.2 onto 850.1) that increase the total stellar mass of the system modestly but boost the effective radius considerably (Naab et al. 2009; Hopkins et al. 2009; Oser et al. 2012). The size evolution for lower mass galaxies is less extreme (Genel et al. 2018) and may be moot for 850.2 if it subsequently merges with 850.1. As Figure 8 shows, if 850.1 undergoes size evolution as suggested by simulations and observations at 3, then at 1.5 it will end up in the region of the – and – planes that are populated by the high-mass quiescent galaxies from Longhetti et al. (2007), before evolving to match the properties of the most massive early-type galaxies at 0. These massive galaxies at 0 are also those that appear to have formed the bulk of their stars at 4, again in good agreement with the observations of 850.1. Overall, this appears to be strong circumstantial evidence that 850.1 represents the formation phase of an ultra-massive early-type galaxy, which will subsequently evolve through the massive, passive galaxy population found at 1–3 (Trujillo et al. 2006; Buitrago et al. 2008; Damjanov et al. 2009).
To summarise, 850.1, 850.2, and B2 reside in a probable group-like halo serendipitously discovered behind the core of A 1489. The two sub-millimeter sources represent extremes of the dust-mass-selected population at 4, with 850.1 being one of the most massive galaxies known at these redshifts. The gas reservoirs in the two galaxies contribute very different fractions of their total baryonic content at this early phase of the Universe (age of 1.4 Gyr): gas fractions of 16% and 62%, suggesting different evolutionary states. These differences were also reflected in the different characteristic ages of their best-fit SEDs and dust/stellar ratios, although both were predicted to consume their current gas reservoirs by 4. The properties of these gas reservoirs are surprisingly similar, both indicating high densities, strong radiation fields, and comparable dust temperatures. Thus 850.1 appears to represent a massive, highly obscured, but relatively gas-poor (“quenching”?) galaxy with possibly two closaree neighbors that are both much less massive and more gas-rich, as well as younger.
If these galaxies do reside in a single group-sized 1013 M⊙ halo, as was claimed for sub-millimeter galaxies (e.g., Stach et al. 2021), then 850.1 is very likely to be the central galaxy with B2 and 850.2 as satellites that will eventually be accreted through minor mergers. These mergers will increase the stellar-mass radius of 850.1, which at 1 kpc is more compact than typical examples of “quiescent/passive” galaxies at 2–3, into which it will likely evolve, so that the stellar-mass surface density of this galaxy will eventually decline by two orders of magnitude to match those of the most massive early-type galaxies at the present day. Such minor mergers may also be the trigger for the formation of the apparent stellar bar visible in the central regions of 850.1 (Figure 4). Similar features have been reported from JWST imaging of galaxies at 1–3 (e.g., Guo et al. 2023), and likely indicate dynamical disturbance of disks. Disks can form bars relatively quickly if they were cold and gas rich and the central regions of the halos were baryon dominated (e.g., Bland-Hawthorn et al. 2023). These non-axisymmetric structures then serve to remove angular momentum from gas in the disk and efficiently funnel it into the galaxy center potentially fueling the central dusty starburst that alerted us to the existence of these systems in the first place.
4 Conclusions
This pair of sub-millimeter galaxies demonstrates the remarkable diversity of galaxies hosting massive dust and gas reservoirs at high redshifts. These two galaxies are associated in a single structure at 4.26, but their observed and intrinsic properties span the full range known for this population at 4. The main conclusions of this work are:
1. 850.1 is an example of a rare population of very luminous sub-millimeter sources with an intrinsic 13.5 0.4 mJy, corresponding to a population with a surface density of 10 5 degree-2, while 850.2 with 3.8 0.3 mJy comes from the much more numerous population around the knee in the 850-m counts, having a surface density 50 higher. 850.1 is one of the most massive galaxies known at 4 in terms of stellar or total baryonic mass at 1011.8 M⊙ with an estimated formation redshift 6 and a space density of 3 10-7 Mpc-3, consistent with expected limits from CDM. The high-resolution JWST imaging can exclude significant contamination from obscured AGNs in these mass estimates.
2. Without lensing 850.1 would have 29 and 27. Neither HST nor ground-based -band surveys would have been able to detect this class of source, let alone less-massive or higher-redshift examples. This reflects the high dust reddening, 3–6, over the full 7-kpc detected extent of the disk in 850.1 (with the exception of the UV-bright companion B2, if it is actually part of 850.1). This wide spread and relatively uniform dust reddening in a modestly inclined galaxy may be a result of either efficient mixing of dust within the galaxy disk, or more speculatively a dusty wind emanating from the 1 kpc stellar core.
3. The high-quality multi-band JWST/HST images available for this field also allows a pixel-level SED analysis that provides unique information on the internal structures of the galaxies. This resolved SED analysis shows good correspondence with the integrated SED fits, but only because it showed the need to exclude the foreground/companion UV-bright sources, B1 and B2, from the integrated photometry fits for 850.1. If these sources had been included in a single SED fit then that results in a significantly worse fit and biased derived properties. Similar issues may affect integrated photometry modelling of systems comprising a mix of low- and high-obscuration regions or components. This effect may also explain previous reports of mid-infrared power-law excesses in 10% of dusty galaxies that were previously attributed to buried AGN. Such resolved analyses benefit considerably from the inclusion of resolved long-wavelength constraints on the pixel-level SEDs, as provided by sensitive sub-millimeter interferometry.
4. 850.1 and 850.2 are just 100 kpc ( 15′′) apart in the source plane and offset in velocity by only 30 km s-1, indicating that they likely reside in a single structure, a small group at 4.26. Without the lensing effect of the foreground cluster they would appear as a single, blended, bright ( 17 mJy) source in a single-dish sub-millimeter survey. There are a number of similar lensed groups at 2–4, comprising one or more sub-millimeter galaxies and other companions, reported in the literature. The frequency with which these systems are being found may reflect the correspondence between the spatial scale of group-sized halos and the size of high-magnification region of massive clusters at 1, see also Frye et al. (2023). This adds evidence that at least a subset of the high-redshift sub-millimeter population resides in group-scale halos. These are expected to be the most active environments for the accretion of gas and companion galaxies from the surrounding intergalactic medium, potentially providing both the fuel and the trigger needed to power their active star formation,
5. The properties of 850.1 suggest it is the central galaxy of this group. Its stellar size and central stellar-mass surface density will match those measured for massive quiescent galaxies at 1.5 and 0 if it follows the expected size evolution due to the accretion, through minor mergers, of satellite galaxies such as 850.2 (which itself may be an interacting system) and potentially B2.
6. The exquisite JWST imaging of the A 1489 field, combined with the natural magnification of the foreground cluster lens, provides a striking view of the stellar structure of these two strongly star-forming galaxies. The structure of 850.1 is particularly noteworthy, with features that appear to correspond to arms and a central bar in a very massive galaxy at 4.26. It is tempting to identify these features as a response to dynamical perturbations from the group environment, including the presence of 850.2 as a close companion. Bars with 1-kpc radii have been reported from high-resolution dust continuum imaging of high-redshift sub-millimeter galaxies by Hodge et al. (2019), as well as from statistical analyses of the dust continuum shapes of the sub-millimeter galaxy population (Gullberg et al. 2019). These features have similar sizes to the dust continuum peak and the massive stellar core in 850.1, suggesting that this galaxy is experiencing a bar-driven inflow that is fueling a central starburst in its baryon-dominated core.
Acknowledgments
We thank Harold Pena for his help with the JCMT observations and reduction and Rob Ivison and Anna Puglisi for valuable comments and discussions.
All of the Durham co-authors acknowledge STFC through grant number ST/T000244/1 and ST/X001075/1. AZ acknowledges support by the Ministry of Science & Technology, Israel, and by Grant No. 2020750 from the United States-Israel Binational Science Foundation (BSF) and Grant No. 2109066 from the United States National Science Foundation (NSF). RAW, SHC, and RAJ acknowledge support from NASA JWST Interdisciplinary Scientist grants NAG5-12460, NNX14AN10G and 80NSSC18K0200 from GSFC. Work by CJC acknowledges support from the European Research Council (ERC) Advanced Investigator Grant EPOCHS (788113). MAM acknowledges the support of a National Research Council of Canada Plaskett Fellowship, and the Australian Research Council Centre of Excellence for All Sky Astrophysics in 3 Dimensions (ASTRO 3D), through project number CE17010001. CNAW acknowledges funding from the JWST/NIRCam contract NASS-0215 to the University of Arizona. CC is supported by the National Natural Science Foundation of China, No. 11803044, 11933003, 12173045. This work is sponsored (in part) by the Chinese Academy of Sciences (CAS), through a grant to the CAS South America Center for Astronomy (CASSACA). We acknowledge the science research grants from the China Manned Space Project with NO. CMS-CSST-2021-A05. JMD acknowledges support from PGC2018-101814-B-100. The James Clerk Maxwell Telescope is operated by the East Asian Observatory on behalf of The National Astronomical Observatory of Japan; Academia Sinica Institute of Astronomy and Astrophysics; the Korea Astronomy and Space Science Institute; the National Astronomical Research Institute of Thailand; Center for Astronomical Mega-Science (as well as the National Key R&D Program of China with No. 2017YFA0402700). Additional funding support is provided by the Science and Technology Facilities Council of the United Kingdom and participating universities and organizations in the United Kingdom and Canada. Additional funds for the construction of SCUBA-2 were provided by the Canada Foundation for Innovation. The data used in this project came from programs M23AP006 and M15AI29. The Submillimeter Array is a joint project between the Smithsonian Astrophysical Observatory and the Academia Sinica Institute of Astronomy and Astrophysics and is funded by the Smithsonian Institution and the Academia Sinica. This work is based on observations carried out under project number S22CX with the IRAM NOEMA Interferometer. IRAM is supported by INSU/CNRS (France), MPG (Germany) and IGN (Spain). This work is based on observations made with the NASA/ESA/CSA James Webb Space Telescope. The data were obtained from the Mikulski Archive for Space Telescopes (MAST) at the Space Telescope Science Institute, which is operated by the Association of Universities for Research in Astronomy, Inc., under NASA contract NAS 5-03127 for JWST. These observations are associated with JWST program 1176. This research is based on observations made with the NASA/ESA Hubble Space Telescope obtained from the Space Telescope Science Institute, which is operated by the Association of Universities for Research in Astronomy, Inc., under NASA contract NAS 5–26555. These observations are associated with program 15959. This work is based in part on archival data obtained with the Spitzer Space Telescope, which was operated by the Jet Propulsion Laboratory, California Institute of Technology under a contract with NASA. This research has made use of Canadian Astronomy Data Centre (CADC), NASA’s Astrophysics Data System (ADS) and the NASA Extragalactic Database (NED). We recognize that Maunakea is a culturally important site for the indigenous Hawaiian people; we are privileged to study the cosmos from its summit. We also acknowledge the indigenous peoples of Arizona, including the Akimel O’odham (Pima) and Pee Posh (Maricopa) Indian Communities, whose care and keeping of the land has enabled us to be at ASU’s Tempe campus in the Salt River Valley, where much of our work was conducted.
References
- Alaghband-Zadeh et al. (2013) Alaghband-Zadeh, S., Chapman, S. C., Swinbank, A. M., et al. 2013, MNRAS, 435, 1493, doi: 10.1093/mnras/stt1390
- Amvrosiadis et al. (2023) Amvrosiadis, A., Wardlow, J., Birkin, J. E., et al. 2023, MNRAS, submitted
- Barrufet et al. (2023) Barrufet, L., Oesch, P. A., Weibel, A., et al. 2023, MNRAS, doi: 10.1093/mnras/stad947
- Battisti et al. (2019) Battisti, A. J., da Cunha, E., Grasha, K., et al. 2019, ApJ, 882, 61, doi: 10.3847/1538-4357/ab345d
- Behroozi & Silk (2018) Behroozi, P., & Silk, J. 2018, MNRAS, 477, 5382, doi: 10.1093/mnras/sty945
- Beirão et al. (2015) Beirão, P., Armus, L., Lehnert, M. D., et al. 2015, MNRAS, 451, 2640, doi: 10.1093/mnras/stv1101
- Bertin & Arnouts (1996) Bertin, E., & Arnouts, S. 1996, A&AS, 117, 393, doi: 10.1051/aas:1996164
- Birkin et al. (2021) Birkin, J. E., Weiss, A., Wardlow, J. L., et al. 2021, MNRAS, 501, 3926, doi: 10.1093/mnras/staa3862
- Bisigello et al. (2023) Bisigello, L., Gandolfi, G., Grazian, A., et al. 2023, arXiv e-prints, arXiv:2302.12270, doi: 10.48550/arXiv.2302.12270
- Bland-Hawthorn et al. (2023) Bland-Hawthorn, J., Tepper-Garcia, T., Agertz, O., & Freeman, K. 2023, ApJ, 947, 80, doi: 10.3847/1538-4357/acc469
- Borys et al. (2004) Borys, C., Chapman, S., Donahue, M., et al. 2004, MNRAS, 352, 759, doi: 10.1111/j.1365-2966.2004.07982.x
- Bouchet et al. (1985) Bouchet, P., Lequeux, J., Maurice, E., Prevot, L., & Prevot-Burnichon, M. L. 1985, A&A, 149, 330
- Bouwens et al. (2020) Bouwens, R., González-López, J., Aravena, M., et al. 2020, ApJ, 902, 112, doi: 10.3847/1538-4357/abb830
- Brisbin et al. (2017) Brisbin, D., Miettinen, O., Aravena, M., et al. 2017, A&A, 608, A15, doi: 10.1051/0004-6361/201730558
- Buitrago et al. (2008) Buitrago, F., Trujillo, I., Conselice, C. J., et al. 2008, ApJ, 687, L61, doi: 10.1086/592836
- Calura et al. (2017) Calura, F., Pozzi, F., Cresci, G., et al. 2017, MNRAS, 465, 54, doi: 10.1093/mnras/stw2749
- Cappellari et al. (2011) Cappellari, M., Emsellem, E., Krajnović, D., et al. 2011, MNRAS, 413, 813, doi: 10.1111/j.1365-2966.2010.18174.x
- Cappellari et al. (2013) Cappellari, M., McDermid, R. M., Alatalo, K., et al. 2013, MNRAS, 432, 1862, doi: 10.1093/mnras/stt644
- Caputi et al. (2011) Caputi, K. I., Cirasuolo, M., Dunlop, J. S., et al. 2011, MNRAS, 413, 162, doi: 10.1111/j.1365-2966.2010.18118.x
- Caputi et al. (2012) Caputi, K. I., Dunlop, J. S., McLure, R. J., et al. 2012, ApJ, 750, L20, doi: 10.1088/2041-8205/750/1/L20
- Caputi et al. (2021) Caputi, K. I., Caminha, G. B., Fujimoto, S., et al. 2021, ApJ, 908, 146, doi: 10.3847/1538-4357/abd4d0
- Carnall et al. (2019) Carnall, A. C., Leja, J., Johnson, B. D., et al. 2019, ApJ, 873, 44, doi: 10.3847/1538-4357/ab04a2
- Chapin et al. (2013) Chapin, E., Gibb, A. G., Jenness, T., et al. 2013, Starlink User Note, 258
- Chen et al. (2022) Chen, C.-C., Gao, Z.-K., Hsu, Q.-N., et al. 2022, ApJ, 939, L7, doi: 10.3847/2041-8213/ac98c6
- Cheng et al. (2022) Cheng, C., Yan, H., Huang, J.-S., et al. 2022, ApJ, 936, L19, doi: 10.3847/2041-8213/ac8d08
- Cheng et al. (2023) Cheng, C., Huang, J.-S., Smail, I., et al. 2023, ApJ, 942, L19, doi: 10.3847/2041-8213/aca9d0
- Ciesla et al. (2020) Ciesla, L., Béthermin, M., Daddi, E., et al. 2020, A&A, 635, A27, doi: 10.1051/0004-6361/201936727
- Cimatti et al. (2012) Cimatti, A., Nipoti, C., & Cassata, P. 2012, MNRAS, 422, L62, doi: 10.1111/j.1745-3933.2012.01237.x
- da Cunha et al. (2015) da Cunha, E., Walter, F., Smail, I., et al. 2015, ApJ, 806, 110, doi: 10.1088/0004-637X/806/1/110
- Damjanov et al. (2009) Damjanov, I., McCarthy, P. J., Abraham, R. G., et al. 2009, ApJ, 695, 101, doi: 10.1088/0004-637X/695/1/101
- Danielson et al. (2011) Danielson, A. L. R., Swinbank, A. M., Smail, I., et al. 2011, MNRAS, 410, 1687, doi: 10.1111/j.1365-2966.2010.17549.x
- Dempsey et al. (2013) Dempsey, J. T., Friberg, P., Jenness, T., et al. 2013, MNRAS, 430, 2534, doi: 10.1093/mnras/stt090
- Dey et al. (1999) Dey, A., Graham, J. R., Ivison, R. J., et al. 1999, ApJ, 519, 610, doi: 10.1086/307395
- Dudzevičiūtė et al. (2020) Dudzevičiūtė, U., Smail, I., Swinbank, A. M., et al. 2020, MNRAS, 494, 3828, doi: 10.1093/mnras/staa769
- Duncan et al. (2023) Duncan, K. J., Windhorst, R. A., Koekemoer, A. M., et al. 2023, MNRAS, 522, 4548, doi: 10.1093/mnras/stad1267
- Eales et al. (1999) Eales, S., Lilly, S., Gear, W., et al. 1999, ApJ, 515, 518, doi: 10.1086/307069
- Frye et al. (2023) Frye, B. L., Pascale, M., Foo, N., et al. 2023, arXiv e-prints, arXiv:2303.03556, doi: 10.48550/arXiv.2303.03556
- Fujimoto et al. (2023) Fujimoto, S., Kohno, K., Ouchi, M., et al. 2023, arXiv e-prints, arXiv:2303.01658, doi: 10.48550/arXiv.2303.01658
- Furtak et al. (2022) Furtak, L. J., Zitrin, A., Weaver, J. R., et al. 2022, arXiv e-prints, arXiv:2212.04381, doi: 10.48550/arXiv.2212.04381
- Garn & Best (2010) Garn, T., & Best, P. N. 2010, MNRAS, 409, 421, doi: 10.1111/j.1365-2966.2010.17321.x
- Garratt et al. (2023) Garratt, T. K., Geach, J. E., Tamura, Y., et al. 2023, MNRAS, 520, 3669, doi: 10.1093/mnras/stad307
- Geach et al. (2017) Geach, J. E., Dunlop, J. S., Halpern, M., et al. 2017, MNRAS, 465, 1789, doi: 10.1093/mnras/stw2721
- Genel et al. (2018) Genel, S., Nelson, D., Pillepich, A., et al. 2018, MNRAS, 474, 3976, doi: 10.1093/mnras/stx3078
- Gillman et al. (2023) Gillman, S., Gullberg, B., Brammer, G., et al. 2023, arXiv e-prints, arXiv:2303.17246, doi: 10.48550/arXiv.2303.17246
- Gómez-Guijarro et al. (2023) Gómez-Guijarro, C., Magnelli, B., Elbaz, D., et al. 2023, arXiv e-prints, arXiv:2304.08517. https://arxiv.org/abs/2304.08517
- Gullberg et al. (2019) Gullberg, B., Smail, I., Swinbank, A. M., et al. 2019, MNRAS, 490, 4956, doi: 10.1093/mnras/stz2835
- Guo et al. (2023) Guo, Y., Jogee, S., Finkelstein, S. L., et al. 2023, ApJ, 945, L10, doi: 10.3847/2041-8213/acacfb
- Hainline et al. (2011) Hainline, L. J., Blain, A. W., Smail, I., et al. 2011, ApJ, 740, 96, doi: 10.1088/0004-637X/740/2/96
- Hodge et al. (2016) Hodge, J. A., Swinbank, A. M., Simpson, J. M., et al. 2016, ApJ, 833, 103, doi: 10.3847/1538-4357/833/1/103
- Hodge et al. (2019) Hodge, J. A., Smail, I., Walter, F., et al. 2019, ApJ, 876, 130, doi: 10.3847/1538-4357/ab1846
- Holwerda et al. (2020) Holwerda, B. W., Bridge, J. S., Steele, R. L., et al. 2020, AJ, 160, 154, doi: 10.3847/1538-3881/aba617
- Holwerda et al. (2005) Holwerda, B. W., Gonzalez, R. A., Allen, R. J., & van der Kruit, P. C. 2005, AJ, 129, 1396, doi: 10.1086/427716
- Hopkins et al. (2009) Hopkins, P. F., Bundy, K., Murray, N., et al. 2009, MNRAS, 398, 898, doi: 10.1111/j.1365-2966.2009.15062.x
- Huang et al. (2023) Huang, J. S., Li, Z.-J., Cheng, C., et al. 2023, arXiv e-prints, arXiv:2304.01378, doi: 10.48550/arXiv.2304.01378
- Ikarashi et al. (2022) Ikarashi, S., Ivison, R. J., Cowley, W. I., & Kohno, K. 2022, A&A, 659, A154, doi: 10.1051/0004-6361/202141196
- Ikarashi et al. (2023) Ikarashi, S., Smail, I., Swinbank, A. M., et al. 2023, in prep.
- Ivison (2006) Ivison, R. J. 2006, MNRAS, 370, 495, doi: 10.1111/j.1365-2966.2006.10515.x
- Ivison et al. (2000) Ivison, R. J., Smail, I., Barger, A. J., et al. 2000, MNRAS, 315, 209, doi: 10.1046/j.1365-8711.2000.03376.x
- Ivison et al. (1998) Ivison, R. J., Smail, I., Le Borgne, J. F., et al. 1998, MNRAS, 298, 583, doi: 10.1046/j.1365-8711.1998.01677.x
- Kamieneski et al. (2023) Kamieneski, P. S., Frye, B. L., Pascale, M., et al. 2023, arXiv e-prints, arXiv:2303.05054, doi: 10.48550/arXiv.2303.05054
- Kaufman et al. (1999) Kaufman, M. J., Wolfire, M. G., Hollenbach, D. J., & Luhman, M. L. 1999, ApJ, 527, 795, doi: 10.1086/308102
- Keel et al. (2023) Keel, W. C., Windhorst, R. A., Jansen, R. A., et al. 2023, AJ, 165, 166, doi: 10.3847/1538-3881/acbdff
- Kneib et al. (2005) Kneib, J. P., Neri, R., Smail, I., et al. 2005, A&A, 434, 819, doi: 10.1051/0004-6361:20042034
- Kokorev et al. (2023) Kokorev, V., Jin, S., Magdis, G. E., et al. 2023, ApJ, 945, L25, doi: 10.3847/2041-8213/acbd9d
- Krist et al. (2011) Krist, J. E., Hook, R. N., & Stoehr, F. 2011, in Society of Photo-Optical Instrumentation Engineers (SPIE) Conference Series, Vol. 8127, Optical Modeling and Performance Predictions V, ed. M. A. Kahan, 81270J
- Krumholz & Thompson (2013) Krumholz, M. R., & Thompson, T. A. 2013, MNRAS, 434, 2329, doi: 10.1093/mnras/stt1174
- Landsman (1993) Landsman, W. B. 1993, in Astronomical Society of the Pacific Conference Series, Vol. 52, Astronomical Data Analysis Software and Systems II, ed. R. J. Hanisch, R. J. V. Brissenden, & J. Barnes, 246
- Lang et al. (2019) Lang, P., Schinnerer, E., Smail, I., et al. 2019, ApJ, 879, 54, doi: 10.3847/1538-4357/ab1f77
- Lawrence et al. (2007) Lawrence, A., Warren, S. J., Almaini, O., et al. 2007, MNRAS, 379, 1599, doi: 10.1111/j.1365-2966.2007.12040.x
- Ledlow et al. (2002) Ledlow, M. J., Smail, I., Owen, F. N., et al. 2002, ApJ, 577, L79, doi: 10.1086/344334
- Longhetti et al. (2007) Longhetti, M., Saracco, P., Severgnini, P., et al. 2007, MNRAS, 374, 614, doi: 10.1111/j.1365-2966.2006.11171.x
- Lustig et al. (2021) Lustig, P., Strazzullo, V., D’Eugenio, C., et al. 2021, MNRAS, 501, 2659, doi: 10.1093/mnras/staa3766
- Magnelli et al. (2013) Magnelli, B., Popesso, P., Berta, S., et al. 2013, A&A, 553, A132, doi: 10.1051/0004-6361/201321371
- Magnelli et al. (2023) Magnelli, B., Gómez-Guijarro, C., Elbaz, D., et al. 2023, arXiv e-prints, arXiv:2305.19331, doi: 10.48550/arXiv.2305.19331
- Marsan et al. (2022) Marsan, Z. C., Muzzin, A., Marchesini, D., et al. 2022, ApJ, 924, 25, doi: 10.3847/1538-4357/ac312a
- McDermid et al. (2015) McDermid, R. M., Alatalo, K., Blitz, L., et al. 2015, MNRAS, 448, 3484, doi: 10.1093/mnras/stv105
- Ménard & Fukugita (2012) Ménard, B., & Fukugita, M. 2012, ApJ, 754, 116, doi: 10.1088/0004-637X/754/2/116
- Mitsuhashi et al. (2021) Mitsuhashi, I., Matsuda, Y., Smail, I., et al. 2021, ApJ, 907, 122, doi: 10.3847/1538-4357/abcc72
- Mowla et al. (2019) Mowla, L. A., van Dokkum, P., Brammer, G. B., et al. 2019, ApJ, 880, 57, doi: 10.3847/1538-4357/ab290a
- Naab et al. (2009) Naab, T., Johansson, P. H., & Ostriker, J. P. 2009, ApJ, 699, L178, doi: 10.1088/0004-637X/699/2/L178
- Nelson et al. (2023) Nelson, E. J., Suess, K. A., Bezanson, R., et al. 2023, ApJ, 948, L18, doi: 10.3847/2041-8213/acc1e1
- Oser et al. (2012) Oser, L., Naab, T., Ostriker, J. P., & Johansson, P. H. 2012, ApJ, 744, 63, doi: 10.1088/0004-637X/744/1/63
- Oteo et al. (2017) Oteo, I., Smail, I., Hughes, T., et al. 2017, arXiv e-prints, arXiv:1707.05329, doi: 10.48550/arXiv.1707.05329
- Pacifici et al. (2023) Pacifici, C., Iyer, K. G., Mobasher, B., et al. 2023, ApJ, 944, 141, doi: 10.3847/1538-4357/acacff
- Pascale et al. (2022) Pascale, M., Frye, B. L., Diego, J., et al. 2022, ApJ, 938, L6, doi: 10.3847/2041-8213/ac9316
- Peng et al. (2002) Peng, C. Y., Ho, L. C., Impey, C. D., & Rix, H.-W. 2002, AJ, 124, 266, doi: 10.1086/340952
- Pérez-González et al. (2023) Pérez-González, P. G., Barro, G., Annunziatella, M., et al. 2023, ApJ, 946, L16, doi: 10.3847/2041-8213/acb3a5
- Perrin et al. (2014) Perrin, M. D., Sivaramakrishnan, A., Lajoie, C.-P., et al. 2014, in Society of Photo-Optical Instrumentation Engineers (SPIE) Conference Series, Vol. 9143, Space Telescopes and Instrumentation 2014: Optical, Infrared, and Millimeter Wave, ed. J. Oschmann, Jacobus M., M. Clampin, G. G. Fazio, & H. A. MacEwen, 91433X
- Pope et al. (2023) Pope, A., McKinney, J., Kamieneski, P., et al. 2023, arXiv e-prints, arXiv:2306.10450. https://arxiv.org/abs/2306.10450
- Reshef et al. (2011) Reshef, D. N., Reshef, Y. A., Finucane, H. K., et al. 2011, Science, 334, 1518, doi: 10.1126/science.1205438
- Robotham et al. (2018) Robotham, A. S. G., Davies, L. J. M., Driver, S. P., et al. 2018, MNRAS, 476, 3137, doi: 10.1093/mnras/sty440
- Rowan-Robinson et al. (1991) Rowan-Robinson, M., Broadhurst, T., Lawrence, A., et al. 1991, Nature, 351, 719, doi: 10.1038/351719a0
- Scoville (2013) Scoville, N. Z. 2013, Secular Evolution of Galaxies, 491, doi: 10.48550/arXiv.1210.6990
- Shapley et al. (2003) Shapley, A. E., Steidel, C. C., Pettini, M., & Adelberger, K. L. 2003, ApJ, 588, 65, doi: 10.1086/373922
- Shapley et al. (2022) Shapley, A. E., Sanders, R. L., Salim, S., et al. 2022, ApJ, 926, 145, doi: 10.3847/1538-4357/ac4742
- Simpson et al. (2014) Simpson, J. M., Swinbank, A. M., Smail, I., et al. 2014, ApJ, 788, 125, doi: 10.1088/0004-637X/788/2/125
- Simpson et al. (2015) Simpson, J. M., Smail, I., Swinbank, A. M., et al. 2015, ApJ, 799, 81, doi: 10.1088/0004-637X/799/1/81
- Simpson et al. (2017) —. 2017, ApJ, 839, 58, doi: 10.3847/1538-4357/aa65d0
- Simpson et al. (2019) —. 2019, ApJ, 880, 43, doi: 10.3847/1538-4357/ab23ff
- Simpson et al. (2020) Simpson, J. M., Smail, I., Dudzevičiūtė, U., et al. 2020, MNRAS, 495, 3409, doi: 10.1093/mnras/staa1345
- Smail et al. (1997) Smail, I., Ivison, R. J., & Blain, A. W. 1997, ApJ, 490, L5, doi: 10.1086/311017
- Smail et al. (2011) Smail, I., Swinbank, A. M., Ivison, R. J., & Ibar, E. 2011, MNRAS, 414, L95, doi: 10.1111/j.1745-3933.2011.01064.x
- Solomon & Vanden Bout (2005) Solomon, P. M., & Vanden Bout, P. A. 2005, ARA&A, 43, 677, doi: 10.1146/annurev.astro.43.051804.102221
- Sorba & Sawicki (2018) Sorba, R., & Sawicki, M. 2018, MNRAS, 476, 1532, doi: 10.1093/mnras/sty186
- Speagle et al. (2014) Speagle, J. S., Steinhardt, C. L., Capak, P. L., & Silverman, J. D. 2014, ApJS, 214, 15, doi: 10.1088/0067-0049/214/2/15
- Stach et al. (2018) Stach, S. M., Smail, I., Swinbank, A. M., et al. 2018, ApJ, 860, 161, doi: 10.3847/1538-4357/aac5e5
- Stach et al. (2019) Stach, S. M., Dudzevičiūtė, U., Smail, I., et al. 2019, MNRAS, 487, 4648, doi: 10.1093/mnras/stz1536
- Stach et al. (2021) Stach, S. M., Smail, I., Amvrosiadis, A., et al. 2021, MNRAS, 504, 172, doi: 10.1093/mnras/stab714
- Stefanon et al. (2015) Stefanon, M., Marchesini, D., Muzzin, A., et al. 2015, ApJ, 803, 11, doi: 10.1088/0004-637X/803/1/11
- Steidel & Hamilton (1993) Steidel, C. C., & Hamilton, D. 1993, AJ, 105, 2017, doi: 10.1086/116579
- Swinbank et al. (2010) Swinbank, A. M., Smail, I., Longmore, S., et al. 2010, Nature, 464, 733, doi: 10.1038/nature08880
- Taylor (2005) Taylor, M. B. 2005, in Astronomical Society of the Pacific Conference Series, Vol. 347, Astronomical Data Analysis Software and Systems XIV, ed. P. Shopbell, M. Britton, & R. Ebert, 29
- Trujillo et al. (2007) Trujillo, I., Conselice, C. J., Bundy, K., et al. 2007, MNRAS, 382, 109, doi: 10.1111/j.1365-2966.2007.12388.x
- Trujillo et al. (2006) Trujillo, I., Feulner, G., Goranova, Y., et al. 2006, MNRAS, 373, L36, doi: 10.1111/j.1745-3933.2006.00238.x
- Valentino et al. (2020) Valentino, F., Magdis, G. E., Daddi, E., et al. 2020, ApJ, 890, 24, doi: 10.3847/1538-4357/ab6603
- Waddington et al. (2002) Waddington, I., Windhorst, R. A., Cohen, S. H., et al. 2002, MNRAS, 336, 1342, doi: 10.1046/j.1365-8711.2002.05870.x
- Wang et al. (2019) Wang, T., Schreiber, C., Elbaz, D., et al. 2019, Nature, 572, 211, doi: 10.1038/s41586-019-1452-4
- Weiß et al. (2005) Weiß, A., Walter, F., & Scoville, N. Z. 2005, A&A, 438, 533, doi: 10.1051/0004-6361:20052667
- Wellons et al. (2015) Wellons, S., Torrey, P., Ma, C.-P., et al. 2015, MNRAS, 449, 361, doi: 10.1093/mnras/stv303
- Windhorst et al. (2023) Windhorst, R. A., Cohen, S. H., Jansen, R. A., et al. 2023, AJ, 165, 13, doi: 10.3847/1538-3881/aca163
- Yamagishi et al. (2012) Yamagishi, M., Kaneda, H., Ishihara, D., et al. 2012, A&A, 541, A10, doi: 10.1051/0004-6361/201218904
- Yan & Ma (2016) Yan, H., & Ma, Z. 2016, ApJ, 820, L16, doi: 10.3847/2041-8205/820/1/L16
- Zitrin et al. (2015) Zitrin, A., Fabris, A., Merten, J., et al. 2015, ApJ, 801, 44, doi: 10.1088/0004-637X/801/1/44
- Zitrin et al. (2020) Zitrin, A., Acebron, A., Coe, D., et al. 2020, ApJ, 903, 137, doi: 10.3847/1538-4357/abb8dd
=20mm
| Source | FWHMCO(4-3) | FWHM[CI] | FWHMCO(5-4) | FWHM | a | ||||||
|---|---|---|---|---|---|---|---|---|---|---|---|
| [GHz] | [km s-1] | [GHz] | [km s-1] | [GHz] | [km s-1] | [km s-1] | [deg] | [1011 M⊙] | |||
| 850.1 | 4.2599 0.0001 | 87.6519 | 380 15 | 93.5606 | 400 30 | 109.558 | 375 15 | 380 10 | 0.88 0.11 | 28 12 | 3.8 |
| 850.2 | 4.2593 0.0003 | 87.6607 | 620 70 | 93.6452 | 1100 500 | 109.570 | 670 80 | 640 50 | 0.40 0.03 | 66 2 | 0.8 0.3b |
Note. — a Axis ratio measured from the F444W isophote shape and corrected for lensing shear. b To estimate the dynamical mass, we used the velocity difference between the two components of the CO(4–3) and CO(5–4) lines, 330 70 km s-1, rather than the FWHM.
| Spitzer | SCUBA-2 | SMA | NOEMA | |||||||
|---|---|---|---|---|---|---|---|---|---|---|
| Source (short name) | R.A. Dec. | 5.8 m | 8.0 m | 24 m | 450 m | 850 m | 880 m | 2.8 mm | 3.4 mm | |
| (J2000) | [Jy] | [Jy] | [mJy] | [mJy] | [mJy] | [mJy] | [kpc] | [mJy] | [mJy] | |
| SMM J121223.0+273351a (850.1) | 12 12 23.050 +27 33 51.89 | 20 10 | 30 10 | 0.76 | 72 21b [4.4] | 54.1 1.5 [30.5] | 42.3 1.6c | 5.6 1.4 | 1.03 0.08 | 0.49 0.04 |
| SMM J121220.4+273410a (850.2) | 12 12 20.484 +27 34 10.45 | 23 10 | 32 10 | 0.76 | 49 21d [3.5] | 21.2 1.5 [11.0] | 22.5 1.6e | 4.6 2.4 | 0.25 0.04 | 0.17 0.03 |
| SMM J121213.4+273517 (850.3) | 12 12 13.43 +27 35 17.0a | … | … | … | 60f | 16.5 2.2 [7.4] | … | … | … | … |
Note. — The numbers in square brackets are the signal-to-noise of the flux density measurements. a Position from SCUBA-2 850 m. The positions derived from the original M15AI29 SCUBA-2 observations of both sources were offset from those reported here by 4′′ due to the use of M 87 as a pointing source, where emission from the radio jet significantly perturbs the position at 850 m. This issue was identified from the SMA observations analyzed in this work and M 87 subsequently removed from the JCMT pointing catalog. b 850.1 un-deboosted 450-m flux density: 93 mJy. c 850.1 peak SMA flux density: 18.5 0.8 mJy. d 850.2 un-deboosted 450-m flux density: 73 mJy. e 850.2 peak SMA flux density: 8.9 0.8 mJy. f 2- limit.
| Source | F435W | F606W | F814W | F090W | F150W | F200W | F277W | F356W | F444W | Comments |
|---|---|---|---|---|---|---|---|---|---|---|
| 850.1 | 26.5 | 25.37 0.21 | 24.28 0.17 | 24.07 0.09 | 23.50 0.07 | 23.09 0.06 | 22.49 0.04 | 21.87 0.04 | 21.43 0.03 | 20⌀ equivalent, including B2 |
| 26.5 | 27.2 | 26.6 | 27.1 | 25.8 | 25.07 0.15 | 23.14 0.05 | 22.19 0.04 | 21.66 0.03 | Excluding B2 | |
| 24.46 0.22 | 24.16 0.11 | 22.98 0.10 | 22.86 0.06 | 22.23 0.05 | 21.90 0.05 | 21.48 0.04 | 21.06 0.03 | 20.77 0.03 | Including B1 and B2 | |
| 850.2 | 26.5 | 23.10 0.08 | 21.82 0.05 | 21.75 0.03 | 21.50 0.03 | 21.29 0.03 | 21.03 0.02 | 20.87 0.02 | 20.83 0.02 | 24⌀ |
| B1 | 25.02 0.27 | 24.98 0.18 | 23.62 0.12 | 23.44 0.07 | 22.92 0.05 | 22.69 0.05 | 22.43 0.04 | 22.22 0.04 | 22.18 0.04 | 09⌀, knot close to 850.1 |
| B2 | 26.5 | 25.37 0.21 | 24.28 0.17 | 24.07 0.09 | 23.50 0.07 | 23.28 0.06 | 23.35 0.07 | 23.36 0.07 | 23.23 0.06 | 09⌀, knot close to 850.1 |
| A1 | 26.5 | 26.04 0.29 | 25.31 0.26 | 25.14 0.15 | 24.63 0.12 | 24.52 0.11 | 24.75 0.13 | 25.24 0.16 | 25.65 0.19 | 09⌀, galaxy SE of 850.1 |
| A2 | 26.5 | 25.84 0.26 | 24.80 0.21 | 24.23 0.10 | 22.02 0.04 | 21.75 0.03 | 21.49 0.03 | 21.31 0.03 | 21.19 0.03 | 09⌀, galaxy N of 850.1 |
| A3 | 25.13 0.28 | 24.97 0.18 | 24.14 0.15 | 24.17 0.10 | 24.23 0.10 | 24.12 0.10 | 24.27 0.10 | 24.61 0.12 | 24.90 0.14 | 09⌀, galaxy NW of 850.1 |
| A4 | 23.34 0.12 | 21.52 0.04 | 20.40 0.03 | 20.17 0.02 | 19.33 0.01 | 19.08 0.01 | 19.18 0.01 | 19.67 0.01 | 19.85 0.01 | 18⌀, bright spiral near 850.1 |
| A5 | 23.87 0.16 | 22.25 0.05 | 21.36 0.04 | 21.17 0.02 | 20.51 0.02 | 20.34 0.02 | 20.52 0.02 | 21.02 0.02 | 21.25 0.03 | 24⌀, galaxy S of 850.2 |
Note. — All limits correspond to 3 .
| Source | |||||||||
|---|---|---|---|---|---|---|---|---|---|
| [108 M⊙] | [Jy km s-1] | [1010 K km s-1 pc2] | [Jy km s-1] | [1010 K km s-1 pc2] | [Jy km s-1] | [1010 K km s-1 pc2] | [1011 M⊙] | ||
| 850.1 | 61 | 4.57 0.03 | 20.8 0.2 | 1.52 0.02 | 6.1 0.1 | 3.85 0.03 | 11.1 0.1 | 4.2 0.1 | 0.16 0.03 |
| 850.2 | 26 | 1.87 0.04 | 8.5 0.2 | 0.62 0.09 | 2.5 0.4 | 1.76 0.04 | 5.1 0.1 | 1.6 0.1 | 0.62 0.07 |
Note. — a Adopting 1.
| Source | a | SFR | Comments | |||||||
|---|---|---|---|---|---|---|---|---|---|---|
| [1011 M⊙] | [103 M⊙ yr-1] | [1012 L⊙] | [K] | [kpc] | ||||||
| 850.1b | 4.26 | 4.39 | … | 22 | 3.7 | 49 | 5.0 | 41 | … | Sum of 850.1 & B2 fits, 4.0 |
| 4.26 | 4.41 | … | 22 | 4.0 | 54 | 5.1 | 41 | 7.50.8 | Excluding B2c | |
| 4.26 | … | … | 16 | 4.8 | 60 | 3.6d | 43 | … | , including B2 | |
| 850.2 | 4.26 | 4.28 | 4.47 | 1.0 | 1.2 | 18 | 1.1 | 38 | 5.80.6 | 5.6 |
| 4.26 | … | … | 2.2 | 1.1 | 11 | 0.7 | 44 | … | ||
| B1 | 1.1 | 1.12 | 0.91 | 0.1 | 0.01 | 0.1 | 1.06 | … | … | |
| B2 | 4.26 | 4.17 | 0.33 | 0.04 | 0.04 | 0.53 | 0.6 | … | … | 4 |
| A1 | 0.35 | 0.31 | 0.53 | … | … | … | … | … | … | Cluster member? |
| A2 | 1.8 | 1.77 | 0.55 | … | … | … | … | … | … | |
| A3 | 0.8 | 0.77 | 0.54 | … | … | … | … | … | … | |
| A4 | 0.35 | 0.46 | 0.35 | … | … | … | … | … | … | Cluster member? |
| A5 | 0.35 | 0.35 | 0.29 | … | … | … | … | … | … | Cluster member? |
Note. — a BPZ-derived photometric redshifts from Zitrin et al. (2020) using only HST photometry. b 2.63 when B1 and B2 are included in the photometric aperture. c A single magphys fit at 4.26 to the “unresolved” photometry of 850.1 including B2 increases from 1.7 to 27.1 and the fit parameters become: 0.9 1011 M⊙, SFR 0.9 103 M⊙ yr-1, 99 108 M⊙, 2.7, 30 K with an age for the best fit star-formation history of 50 Myr. d F444W-weighted mean .
| Propertya | 850.1b | 850.2 | Units |
|---|---|---|---|
| 4.2599 0.0001 | 4.2593 0.0003 | ||
| 4.0 | 5.6 | ||
| 13.5 | 3.8 | mJy | |
| 5.5 | 0.18 | 1011 M⊙ | |
| 15 | 4.6 | 108 M⊙ | |
| 1.05 | 0.29 | 1011 M⊙ | |
| 6.6 | 0.5 | 1011 M⊙ | |
| SFR | 900 | 210 | M⊙ yr-1 |
| 3.8 | 2.5 | kpc | |
| 2.8 | 1.9 | kpc | |
| 1.00.2 | 2.20.4 | kpc |
Note. — a Dual error bars give first the random and then the systematic uncertainties due to the lensing magnification. b Sum of the parameter estimates for the fit to 850.1 and the fit to B2.