Super resolution dual-layer CBCT imaging with model-guided deep learning
Abstract
Objective: This study aims at investigating a novel super resolution CBCT imaging technique with the dual-layer flat panel detector (DL-FPD).
Approach: In DL-FPD based CBCT imaging, the low-energy and high-energy projections acquired from the top and bottom detector layers contain intrinsically mismatched spatial information, from which super resolution CBCT images can be generated. To explain, a simple mathematical model is established according to the signal formation procedure in DL-FPD. Next, a dedicated recurrent neural network (RNN), named as suRi-Net, is designed by referring to the above imaging model to retrieve the high resolution dual-energy information. Different phantom experiments are conducted to validate the performance of this newly developed super resolution CBCT imaging method.
Main Results: Results show that the proposed suRi-Net can retrieve high spatial resolution information accurately from the low-energy and high-energy projections having lower spatial resolution. Quantitatively, the spatial resolution of the reconstructed CBCT images of the top and bottom detector layers is increased by about 45% and 54%, respectively.
Significance: In future, suRi-Net provides a new approach to achieve high spatial resolution dual-energy imaging in DL-FPD based CBCT systems.
I INTRODUCTION
Recently, X-ray flat panel detector (FPD) with more than one single receptor, i.e., CsI:TI scintillator layer, begins to attract a lot of research interests in medical cone-beam CT (CBCT) imaging applicationsschulze2020cone ; Oldham2005ConebeamCTGR ; Wallace2008ThreedimensionalCC . As the number of receptor increases, it becomes possible for FPD to differentiate the incident X-ray photons by their energies. Take the dual-layer FPD (DL-FPD) as an example, X-ray photons carrying lower energies are mostly absorbed by the top layer, and the rest X-ray photons carrying higher energies are mostly absorbed by the bottom layer. As a result, DL-FPD based CBCT imagingshi2020characterization can generate temporally registered spectral-spatial information, i.e., dual-energy CBCT projections, from which material-specific bases that are valuable for disease diagnosesgang2012cascaded ; patino2016material ; nicolaou2010dual can be obtained.
By far, the performance of DL-FPD based dual-energy CBCT imaging has been investigated by several studies. For instance, Shi et al. and Ståhl et al. demonstrated the feasibility of performing accurate dual-energy CBCT imaging based on DL-FPD shi2020characterization ; staahl2021performance . Wang et al. proposed a model-based high resolution material decomposition method for DL-FPD based CBCTWang2021HighresolutionMM . Despite of its feasibility, DL-FPD may have several limitations in generating high-quality dual-energy CT basis images. For example, spectra separation maybe less satisfied in DL-FPD. To compensate, additional beam filtration is often inserted between the top and bottom receptors to increase the energy separationshi2020characterization . However, the radiation dose efficiency might be degraded. In addition, the spatial resolution performance, which is usually characterized by the modulation transfer function (MTF), of the top and bottom receptors is different. Often, the CsI:TI scintillator is made thicker on the bottom receptor to efficiently stop the high energy X-ray photons. Hence, MTF of the bottom receptor is lowerlu2019dual than that of the top receptor made with thinner CsI:TI scintillator. Finally, the spatial resolution of the CBCT images may be degraded due to the detector element binning. In order to speed up the data acquisition procedure, the intrinsic receptor array is usually binned into a smaller array size at the expense of spatial resolution loss. Take the PaxScan 4030CB FPD (Varex, USA) as an example, X-ray signals captured by the native 2048 1536 detector elements with dimension of 0.194 mm (limiting resolution 2.58 lp/mm) can only be accessed by 7.5 fps per second at mostWinNT ; sheth2022technical . As a contrary, the binned 1024 768 detector elements with dimension of 0.388 mm (limiting resolution 1.29 lp/mm) can capture the X-ray signals at a speed of 30.0 fps. Apparently, detector binning would greatly accelerate the signal readout speed in FPD and DL-FPD, but also would dramatically degrade the spatial resolution.
To improve the spatial resolution of CT images, a series of innovative methods have been proposed over the past two decades. For example, Tilley et al. proposed to enhance the image resolution via model-based iterative reconstruction (MBIR) that incorporates system blur and noise correlation Tilley2016ModelbasedIR ; Tilley2018PenalizedLikelihoodRW . Hashemi et al. proposed a simultaneous deblurring and iterative reconstructing method for high resolution CBCT imagingHashemi2017SimultaneousDA . Aarle et al. proposed a super-resolution CT image reconstruction approach based on prior knowledge of the imaging object Aarle2014SuperResolutionFC . Furthermore, deep-learning based super resolution CT imaging methods have also been proposed recently. You et al. developed a semi-supervised residual CycleGAN network to generate high-resolution CT images from low-resolution CT imagesYou2020CTSG . Chen et al. proposed a network-based iterative CBCT reconstruction method to learn the regularization term and enhance the image resolutionChen2018StatisticalIC . Hatvani et al. used a modified U-net and a subpixel network to map the low-resolution CBCT images onto the high-resolution micro-CT imagesHatvani2019DeepLS . Besides the aforementioned innovative CT image reconstruction approaches, essentially, the CT image spatial resolution can also be enhanced with advanced X-ray hardware such as high-end X-ray source and detector. On the X-ray source end, the flying focal spot (FFS) technique Kachelriess2006FlyingFS ; Flohr2005ImageRA ; kyriakou2006impact is able to double the spatial sampling density in the horizontal and vertical directions. On the X-ray detector end, sub-pixel shiftingYan2015SuperRI ; Li2020MicroCTIO is usually implemented. For instance, a super resolution CBCT imaging strategysu2022super incorporating additional 1D or 2D sub-pixel shift between the top and bottom receptors of DL-FPD is proposed.
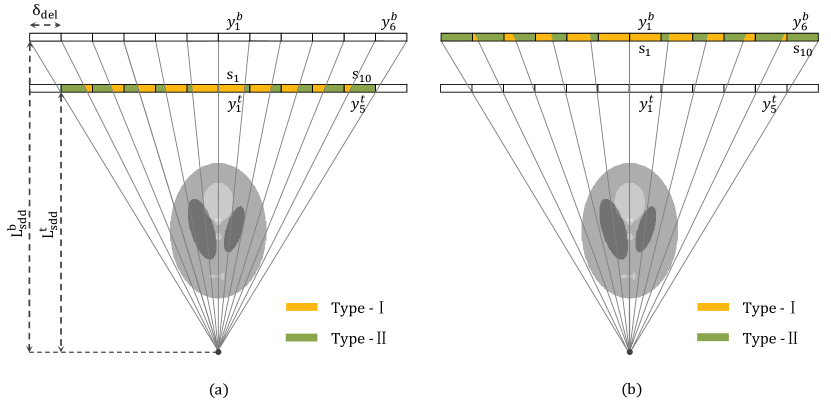
Herein, an alternative super resolution CBCT imaging method is suggested for DL-FPD. Instead of introducing additional 1D or 2D sub-pixel shift between the top and bottom layers, this new approach relies on the intrinsically mismatched spatial information between the top and bottom detector layers to generate super resolution CBCT images. Usually, there exists a small gap between the top and bottom layers in DL-FPD. As a result, mismatched spatial information can be acquired from the low-energy and high-energy projections, see Fig. 1. As illustrated, a certain beamlet carrying the same integration information fall on two different locations of the top and bottom receptor planes. Therefore, it is possible to restore the spatial information at sub-pixel scale, i.e., super resolution imaging, from such spatially mismatched dual-layer projections. To do so, a dedicated recurrent neural network (RNN), denoted as suRi-Net, is designed according to the signal formation procedure to retrieve such high spatial resolution projections. Afterwards, material-specific basis images with high spatial resolution are reconstructed via the image-domain decomposition algorithm.
The rest of this paper is organized as follows: Section II presents the mathematical model, assumptions, the SuRi-Net network, experimental setup and implementation details. Section III presents the experimental results of different phantoms. Section IV provides the discussions and a brief conclusion.
II METHOD
II.1 Imaging model
Assuming the detected signals (proportional to the total number of X-ray photons) on the top and bottom layers are denoted as and , correspondingly. With respect to a certain detector element on the bottom layer, see Fig. 1(a), the coverage (intersection length) of the same X-ray beamlet on the top layer is equal to:
| (1) |
where denotes the source to detector distance (SDD), and denotes the dimension of a detector element. Due to the fan-beam imaging geometry, obviously, the transmission information collected in and are not identical. Quantitatively,
| (2) |
Herein, monochromatic X-ray beams are assumed, and denotes the signal intensity of a sub-pixel. As a consequence, this provides an opportunity to reconstruct X-ray projections with finer spatial resolution, see the colored sub-pixels in Fig. 1. Analytically,
| (3) |
In fact, the sub-pixel signals in Eq. (3) can be generalized into two main types. For the Type-I sub-pixel, it has
| (4) |
For the Type-II sub-pixel, it has
| (5) |
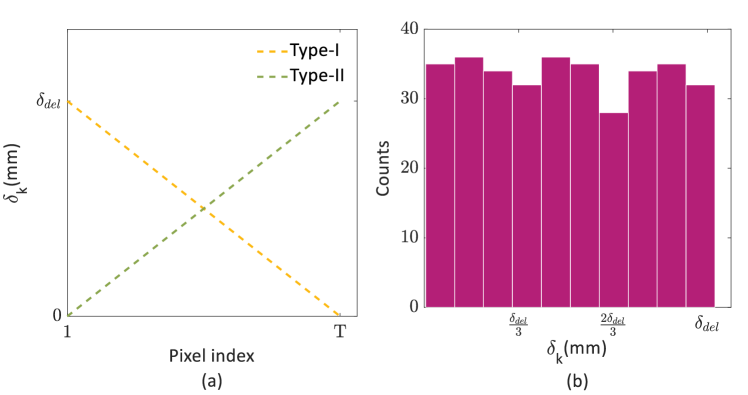
Notice that the above results are derived for the detector elements on the bottom layer with index . Similar expressions can also be derived for the detector elements on the bottom layer with index , and so for the depicted scenario in Fig. 1(b). Interestingly, the width of a sub-pixel, denoted as , varies from one to the another. Specifically, the width of Type-I sub-pixel is equal to
| (6) |
And the width of Type-II sub-pixel is equal to
| (7) |
The relationship between and is plotted in Fig. 2(a), and the distribution of is plotted in Fig. 2(b). In the above derivations, it is assumed that
| (8) |
As a result, the maximum detector dimension is assumed equal to in this study. Be aware that similar results can also be derived for detectors having larger dimensions.
By far, we have mathematically demonstrated the capability of obtaining higher resolution X-ray projections from the DL-PFD. Despite of its simplicity, unfortunately, Eq. (4) and Eq. (5) are quite difficult to be solved with a practical DL-FPD imaging system due to several non-idealities: First, the attenuation information carried by the low-energy and high-energy X-ray beams are different. As a result, the dual-layer projections can not be subtracted directly to generate valuable (quantitatively faithful) signal intensities. Second, the derived analytical solutions in Eq. (4) and Eq. (5) may introduce artifacts when image noise is consideried. Third, it is not very straightforward to reconstruct high resolution CT images from the estimated projections with dramatically varied sub-pixels dimensions.
II.2 suRi-Net
To overcome the above difficulties encountered by Eq. (4) and Eq. (5), the following two assumptions are made: First, the element dimensions of the high resolution low-energy and high-energy projections are identical: . This assumption makes sense only in a statistical way, see the nearly uniform distribution of between 0 and in Fig. 2(b). Second, the signal retrieval procedures defined in Eq. (4) and Eq. (5) can be re-formulated as follows,
| (9) |
where symbols and denote the super resolution projections and the low resolution projections, correspondingly, denotes the complicated non-linear signal extraction operation.
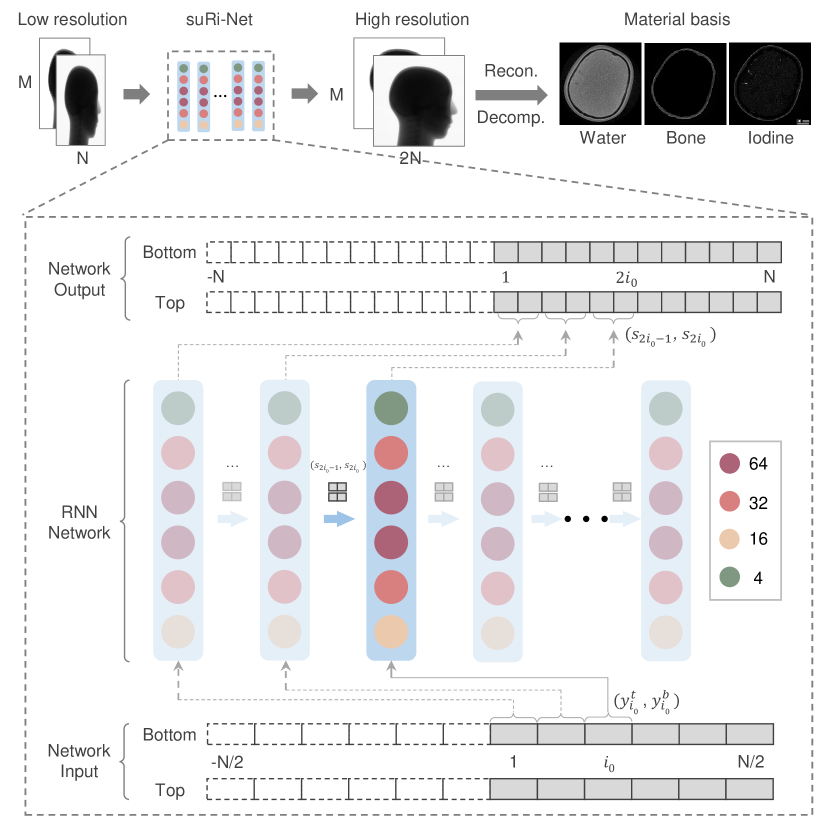
In Eq. (4) and Eq. (5), it demonstrates that the computation of relies on the accumulated summation of all preceding pixels before and . Similarly, the computation of relies on the accumulated summation of all preceding pixels before and . In short, the computation procedure of has a sequential dependency on and . Inspired by such sequential dependency and calculations, the Recurrent Neural Network (RNN) is employed to solve Eq. (9). As known, RNN is a type of artificial neural network good at handling sequential calculationslipton2015critical , which allows previous outputs to be used as inputs while having hidden states. Therefore, it is considered suitable and capable to retrieve the desired super resolution projections with increased accuracy and efficiency.
In this study, such a dedicated RNN network is named as suRi-Net, see Fig. 3. Specifically, the suRi-Net contains six hidden layers to extract image information, and each hidden layer uses the Leaky-ReLU as the activation function. A pair of detector responses are sequentially put into the RNN layer together with outputs from the previous layer are fed into the RNN layer. The input low-energy and high-energy projections have sizes of MN, while the output projections have sizes of M2N. After being processed by the RNN, low-energy and high-energy signals with higher spatial resolution can be obtained, see Fig. 3.
The mean squared error (MSE) between the network predicted high resolution dual-layer projections and the label is used as the network loss:
| (10) |
where denotes the norm.
The training of suRi-Net was performed on TensorFlow platform on a workstation with Nvidia Titan RTX GPU. The initial learning rate was set to , and decayed by 0.98 in every 3000 steps. The network was trained for 350,000 steps with a batch size of 1 for 720,000 pairs of one-dimentional training data.
II.3 Data preparation
The training data are numerically simulatedzhu2022feasibility ; Su2021DIRECTNetAU in Python with the images obtained from ImageNetdeng2009imagenet . The imaging geometry is set as: mm, mm, mm and mm. Specifically, the high resolution ( mm) labels are simulated at first. Afterwards, the low resolution projections ( mm) are obtained from them via 12 binning. The low-energy and high-energy X-ray beam spectra were obtained as follows: the incident beam spectra was simulated at 125 kVp with 1.5 mm aluminum(Al) and 0.4 mm Copper(Cu) filtration in SpekCalePoludniowski_2009 , the low-energy beam spectrum corresponds to the absorbed spectrum on the 0.26 mm thick CsI:TI scintillator layer, and the high-energy beam spectrum is calculated by adding additional 1.0 mm Cu filtration and 0.26 mm CsI:TI scintillator layer. The number of X-ray photons is set to per detector element, and Poisson noise is added.
| Parameter | Value |
| Tube voltage (kVp) | 125 |
| Tube Current (mA) | 12.5 |
| Output filtration (mm) | Al: 1.5, Cu: 0.4 |
| Total views | 450 |
| SOD (mm) | 1160.0 |
| SDD (mm) | 1300.0 (top), 1306.6 (bottom) |
| Image matrix | Limestone: 800800 |
| CatPhan: 600600 | |
| KYOTO: 512512 | |
| Voxel size (mm3) | Limestone: 0.20.20.2 |
| CatPhan: 0.350.350.35 | |
| KYOTO: 0.40.40.4 | |
| Detector array | 768768 |
| Pixel size (mm2) | 0.3080.308 |
| Frame rate (fps) | 7.5 |
| Manual binning | 12 |
| CsI:TI thickness (mm) | 0.26 (top), 0.55 (bottom) |
II.4 Experiments
Physical experiments are performed on an in-house dual-layer CBCT imaging benchtop. The rotating-anode X-ray tube (Varex G-242, USA) is operated at 125 kVp. The DL-FPD detector (560RF-DE, CareRay, China) has a 768768 array and 0.308 mm0.308 mm element dimension (22 binned). The CsI:TI scintillator in the top layer is 0.26 mm thick, and is 0.55 mm in the bottom layer. The two layers is 6.6 mm apart, and an additional 1.0 mm Cu is inserted in between to harden the high-energy X-ray beam. In addition, a 0.4 mm Cu is added to filter the incident X-ray beam. To minimize the Compton scattering effect, X-ray beam with 15.0 mm width (on the detector surface) is collimated. In total, 450 projections are collected from a full 360∘ rotation with 0.8∘ angular interval. Three different objects were scanned: porous limestone rods with a diameter of 65.0 mm, Catphan-700 phantom (CTP682 and CTP714 modules, Phantom lab, USA), and a head phantom (41309-300, Kyoto Kagaku, Japan), see more details in Table 1.
Be aware that these originally acquired projections from this DL-FPD is used to reconstruct the ground truth CT images of high resolution. To generate the low resolution projections, these high resolution projections are manually binned along the horizontal direction. Unless specified, the binning mode mentioned in the rest of the manuscript refers to the manual binning. For example, binning denotes the high resolution projections, binning denotes the low resolution projections.
III Results
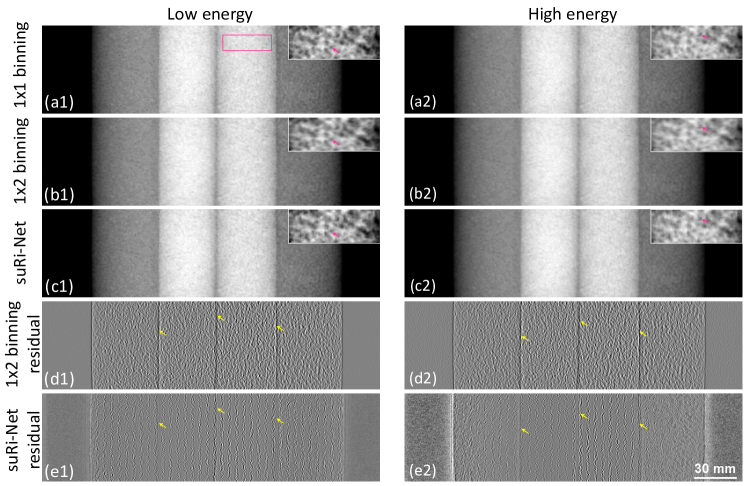
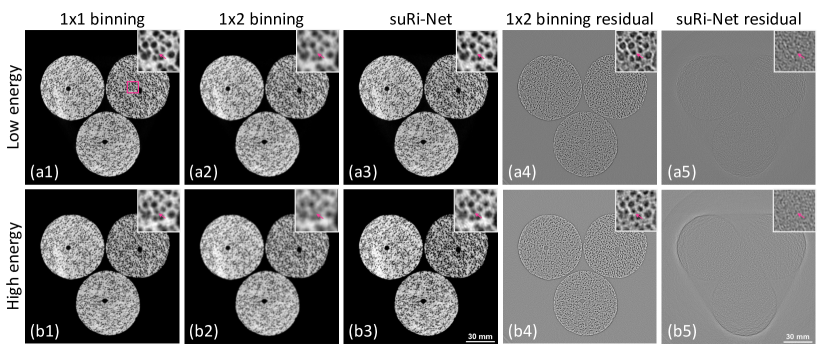
The projections of the porous limestone rods are shown in Fig. 4. In it, the high resolution reference projections with 11 binning are presented in the first row, the low resolution projections with 12 binning are presented in the second row, and the generated high resolution projections from the proposed suRi-Net are presented in the third row. As seen from the zoomed-in region-of-interest (ROI), results obtained from suRi-Net can greatly improve the spatial resolution for both low-energy and high-energy projections. Such improvements can be more easily observed from the subtracted residual difference images, see the highlighted arrows in the fourth and fifth rows. Herein, the residual differences are obtained with respect to the high resolution projections of 11 binning.
The CT imaging results of the porous limestone rods are shown in Fig. 5. The high contrast between air and limestone provides a great opportunity to investigate the performance of suRi-Net in improving the CT image resolution. Specifically, high resolution CT images in the first column are the ground truth obtained from the binned projections, low resolution CT images in the second column are obtained from the binned projections, the suRi-Net reconstructed CT images are shown in the third column. The fourth and fifth columns present the residual images obtained by subtracting the binning CT image and the suRi-Net reconstructed CT image from the binning image, respectively. Compared to the CT images reconstructed from the binned projections, clearly, the developed suRi-Net is able to significantly enhance the image resolution, especially in delineating the porous structures of the limestone rods. For both the top and bottom detector layers, similar performance are obtained. Since the scintillator material on the bottom layer is thicker than the top layer, therefore, the CT images obtained from the bottom layer look a little more blurry than the ones obtained from the top layer, see the images in the bottom row of Fig. 5.
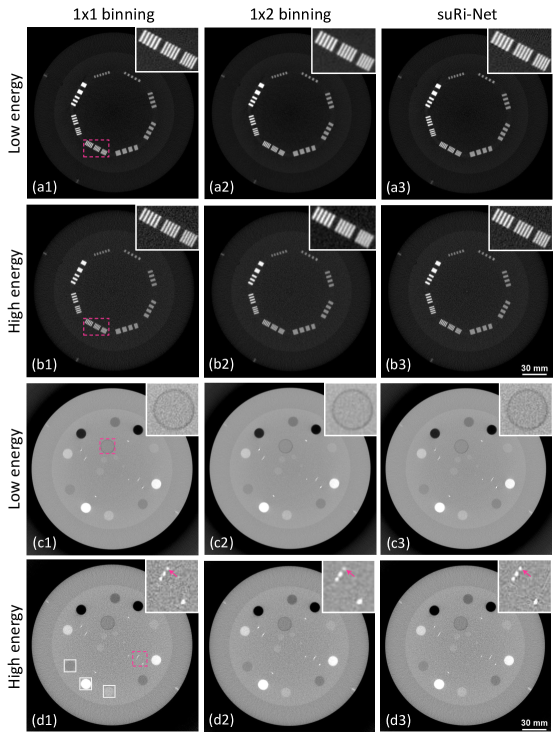
The CT imaging results of the Catphan phantom are shown in Fig.6. Specifically, the CT images in the first and second rows correspond to the CTP714 module, and the CT images in the third and fourth rows correspond to the CTP682 module. According to the zoomed-in images (highlighted in pink rectangles), clearly, results generated from the suRi-Net in the third column show comparable spatial resolution performance as of the reference results obtained in the first column. For example, the highlighted high contrast bar patterns in Fig.6(a3) and (b3) are much sharpen than the ones in Fig.6(a2) and (b2). Similarly, the high contrast bearing balls in Fig.6(d3) are much less blurry than the one in Fig.6(d2). Again, the results of Catphan phantom demonstrate the capability of the proposed suRi-Net method is greatly enhancing the resolution of the CT images.
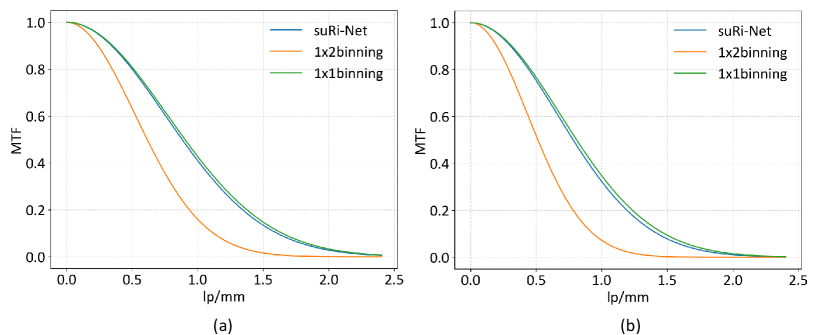
The MTF curves measuredDroege1984ModulationTF on the Teflon rod (highlighted by white box in Fig.6(d1)) in CTP682 module are plotted in Fig.7. As seen, the MTF curves obtained from suRi-Net are slightly lower than the ones obtained from the reference (11 binning), but greatly higher than the ones obtained from the 12 binned projections. Quantitatively, it is found that the spatial frequencies corresponding to MTFs in Fig.7(a) on the low-energy CT image are 0.92 lp/mm, 1.34 lp/mm and 1.37 lp/mm for the 12 binning, suRi-Net and 11 binning, respectively. Similarly, the spatial frequencies corresponding to MTFs in Fig.7(b) on the high-energy CT image are 0.77 lp/mm, 1.19 lp/mm and 1.22 lp/mm for the 12 binning, suRi-Net and 11 binning, respectively. Quantitatively, the suRi-Net improves the spatial resolution of the CT images by 45 and 54 in the top and bottom layer compared with the CT images reconstructed directly from the 12 binned projections, demonstrating the strong capability of suRi-Net in enhancing the spatial resolution of DL-FPD based CBCT imaging.

In addition, the mean signal values and signal standard deviations of Polystyrene, Bone, and Teflon materials are compared, see Fig.8. Clearly, suRi-Net can well maintain the signal values, and can also suppress the CT image noise (compared to the 11 binned reference CT images). Due to the large detector binning, the image noise is much lower in the 12 binned case. Furthermore, the noise levels of the high-energy CT images are higher than that of the low-energy CT images, see Fig.8(b1) and (b2). This is because less photons are detected by the bottom layer during our experiments.
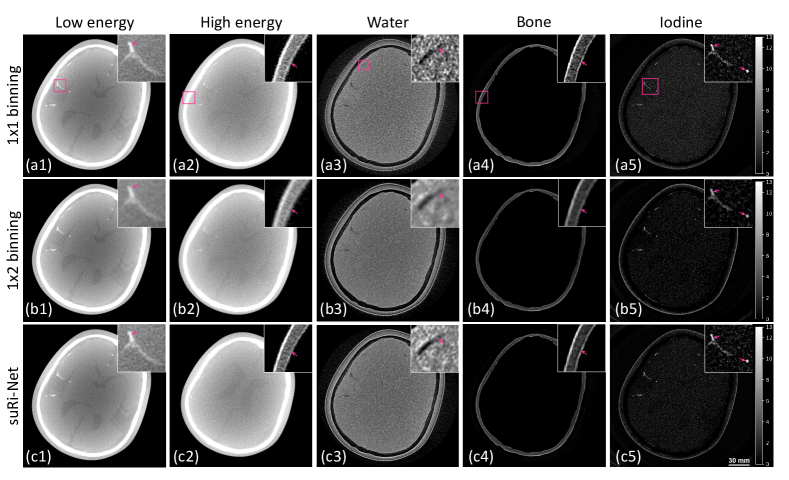
Figure 9 shows the super-resolution CT imaging results of the KYOTO phantom. In it, the CT images obtained from the top and bottom detector layers are presented in the first and second columns, respectively, and the decomposed water, bone and iodine basis maps are presented in the third to fifth columns, respectively. Several typical anatomical structures are highlighted, from which the advancement of suRi-Net in generating high resolution CT images can be clearly demonstrated. For instance, the iodine contrast-enhanced vessels and skull reconstructed from suRi-Net in Fig. 9 (c1) and (c2) are much sharper than the ones reconstructed directly from the 12 binned projections in Fig. 9 (b1) and (b2). Because suRi-Net is able to generate high resolution CT images for both low-energy and high-energy, therefore, the resultant decomposed basis maps from suRi-Net also show superior spatial resolution than the ones obtained from the 12 binned dataset, see the arrow pointed regions on Fig. 9 (c3), (c4) and (c5).
IV DISCUSSIONS AND CONCLUSION
In this study, a novel super resolution CBCT imaging method is developed by taking the advantages of the intrinsic detector element offsets (assuming inclined fan-beam incidence) between the dual-layers. Such intrinsic detector element offsets help to increase the spatial sampling density, and thus enable super resolution CBCT imaging. A simple mathematical model is assumed and derived to explain the mechanism of recovering the high resolution spatial information. Within the imaging model, the sub-pixels either on the top detector layer or on the bottom detector layer are categorized into two groups. Driven by such a mathematical model, a deep learning RNN framework is developed to extract the high resolution spatial information. Results demonstrate that CBCT images reconstructed from the suRi-Net show similar spatial resolution as of the ones acquired with small detector element binning. Quantitatively, this new method is able to improve the spatial resolution of CBCT images by over 45.0 (measured with the spatial frequency at 20% MTF). In addition, the decomposed basis images also maintain high signal accuracy.
Instead of extracting the super resolution information purely relying upon the deep learning techniques, suRi-Net retrieves such high resolution information more heavily upon the underlying imaging physics of DL-FPD. In fact, the spatial resolution information that is finer than the native detector element dimension has already been acquired and encoded in DL-FPD, see Fig. 1. As discussed previously, such super resolution information may be obtained analytically via a certain mathematical model. Due to the non-linear responses in the top and bottom detector layers, however, it is quite challenging to implement such analytical solution in practice. As a consequence, the RNN network is employed in this work to retrieve the super resolution information from the non-linear responses of the top and bottom detector layers. In particular, certain paired detector responses of the top and bottom layers are fed into the corresponding RNN layer together with the estimated responses from the previous RNN layer to generate the high spatial resolution responses. By repeating such procedure across the entire detector plane, high resolution projections can be eventually obtained.
The assumption of equal sub-pixel dimension () made in this study is very empirical. Such an average is statistically viable, see Fig. 2(b). With this assumption, the sub-pixel detector response in any (having varied physical widths) can be easily represented in a computer, which by default assumes equal sub-pixel dimension in image storage. Regardless, this simple assumption may set an upper limit to the resolution of the restored projections. This interesting topic is beyond the scope of this study, and would be investigated as a future work. In addition, the gap between the top and bottom detector layers needs to be moderate. If the gap is too small, the proposed suRi-Net method might become invalid. For example, if the top and bottom detector layers are contacted, namely, , the intrinsic detector element shifts would be tiny (close to 0) across the entire detector plane. To facilitate the use of the proposed suRi-Net method, as a consequence, moderate gap between the top and bottom detector layers is needed. In practice, this is not difficult to achieve when fabricating the DL-FPD.
This study has several limitations. First, the CBCT images acquired from the two detector layers have inconsistent spatial resolutions due to their varied scintillator thicknesses. This problem could be mitigated by making the DL-FPD with equal scintillator thicknessGu2022Evaluation . Second, Compton scattering was neglected by assuming a narrow beam (15.0 mm) width. For CBCT imaging with full field-of-view, Compton scatters should be properly correctedSisniega2015HighfidelityAC . Third, super resolution CBCT imaging is only verified on the axial plane, and high resolution CBCT imaging along both the horizontal and vertical directions have not been investigated yet. It is believed that the proposed suRi-Net is able to complete such super resolution imaging task by processing the low-energy and high-energy projections for two times: first along the horizontal direction, and then along the vertical direction. Fourth, the feasibility of using suRi-Net in dynamic CBCT imaging would be investigated in future. In this case, the spatial and temporal resolution of the four-dimensional (4D) CBCT imaging may be significantly enhanced.
In conclusion, a super resolution CBCT imaging method, named as suRi-Net, is developed with DL-FPD by using of the intrinsic sub-pixel shifts between the top and bottom detector layers. A dedicated RNN network is designed to retrieve such high resolution signal responses. Experimental results demonstrate that suRi-Net can improve the image spatial resolution by up to 45%. In future, suRi-Net may greatly improve the image resolution of dual-energy CBCT with DL-FPD.
References
- (1) RKW Schulze and NA Drage. Cone-beam computed tomography and its applications in dental and maxillofacial radiology. Clinical radiology, 75(9):647–657, 2020.
- (2) Mark Oldham, Daniel Létourneau, Lindsay Watt, Geoffrey D. Hugo, Di Yan, David Lockman, Leonard H. Kim, Peter Y. Chen, Alvaro A. Martinez, and John W. Wong. Cone-beam-CT guided radiation therapy: A model for on-line application. Radiotherapy and oncology : journal of the European Society for Therapeutic Radiology and Oncology, 75 3:271–8, 2005.
- (3) Michael J. Wallace, Michael D. Kuo, Craig B. Glaiberman, Christoph A. Binkert, Robert Chappell Orth, and Gilles Soulez. Three-dimensional C-arm cone-beam CT: applications in the interventional suite. Journal of vascular and interventional radiology : JVIR, 19 6:799–813, 2008.
- (4) Linxi Shi, Minghui Lu, N Robert Bennett, Edward Shapiro, Jin Zhang, Richard Colbeth, Josh Star-Lack, and Adam S Wang. Characterization and potential applications of a dual-layer flat-panel detector. Medical physics, 47(8):3332–3343, 2020.
- (5) Grace J Gang, Wojciech Zbijewski, J Webster Stayman, and Jeffrey H Siewerdsen. Cascaded systems analysis of noise and detectability in dual-energy cone-beam CT. Medical physics, 39(8):5145–5156, 2012.
- (6) Manuel Patino, Andrea Prochowski, Mukta D Agrawal, Frank J Simeone, Rajiv Gupta, Peter F Hahn, and Dushyant V Sahani. Material separation using dual-energy ct: current and emerging applications. Radiographics, 36(4):1087–1105, 2016.
- (7) Savvakis Nicolaou, Charlotte Jane Yong-Hing, Sandro Galea-Soler, Daniel J Hou, Luck Louis, and Peter Munk. Dual-energy CT as a potential new diagnostic tool in the management of gout in the acute setting. American Journal of Roentgenology, 194(4):1072, 2010.
- (8) Fredrik Ståhl, Dirk Schäfer, Artur Omar, Peter van de Haar, Fred van Nijnatten, Paul Withagen, Axel Thran, Erik Hummel, Bernd Menser, Åke Holmberg, et al. Performance characterization of a prototype dual-layer cone-beam computed tomography system. Medical Physics, 48(11):6740–6754, 2021.
- (9) Wenying Wang, Yiqun Ma, Matthew Tivnan, Junyuan Li, Grace J Gang, Wojciech Zbijewski, Minghui Lu, Jin Zhang, Josh Star-Lack, Richard E Colbeth, et al. High-resolution model-based material decomposition in dual-layer flat-panel CBCT. Medical physics, 48(10):6375–6387, 2021.
- (10) Minghui Lu, Adam Wang, Edward Shapiro, Amy Shiroma, Jin Zhang, Joachim Steiger, and Josh Star-Lack. Dual energy imaging with a dual-layer flat panel detector. In Medical Imaging 2019: Physics of Medical Imaging, volume 10948, pages 269–278. SPIE, 2019.
- (11) Paxscan 4030x product description. . Accessed: 2022-09-01.
- (12) Niral Milan Sheth, Ali Uneri, Patrick A Helm, Wojciech Zbijewski, and Jeffrey H Siewerdsen. Technical assessment of 2D and 3D imaging performance of an IGZO-based flat-panel X-ray detector. Medical physics, 49(5):3053–3066, 2022.
- (13) Steven Tilley, Jeffrey H. Siewerdsen, and J. Webster Stayman. Model-based iterative reconstruction for flat-panel cone-beam CT with focal spot blur, detector blur, and correlated noise. Physics in Medicine & Biology, 61:296 – 319, 2016.
- (14) Steven Tilley, Matthew W. Jacobson, Qian Cao, Michael Brehler, Alejandro Sisniega, Wojciech Zbijewski, and J. Webster Stayman. Penalized-likelihood reconstruction with high-fidelity measurement models for high-resolution cone-beam imaging. IEEE Transactions on Medical Imaging, 37:988–999, 2018.
- (15) SayedMasoud Hashemi, William Y. Song, Arjun Sahgal, Young Lee, Christopher Huynh Huynh, Vladimir Grouza, Håkan Nordström, Markus Eriksson, Antoine Dorenlot, Jean-Marie Régis, James G. Mainprize, and Mark Ruschin. Simultaneous deblurring and iterative reconstruction of CBCT for image guided brain radiosurgery. Physics in Medicine & Biology, 62:2521 – 2541, 2017.
- (16) Wim van Aarle, Kees Joost Batenburg, Gert Van Gompel, Elke Van de Casteele, and Jan Sijbers. Super-resolution for computed tomography based on discrete tomography. IEEE Transactions on Image Processing, 23:1181–1193, 2014.
- (17) Chenyu You, Yi Zhang, Xiaoliu Zhang, Guang Li, Shenghong Ju, Zhen Zhao, Zhuiyang Zhang, Wenxiang Cong, Punam K. Saha, and Ge Wang. CT Super-Resolution GAN Constrained by the Identical, Residual, and Cycle Learning Ensemble (GAN-CIRCLE). IEEE Transactions on Medical Imaging, 39:188–203, 2020.
- (18) Binbin Chen, Kaijia Xiang, Zaiwen Gong, Jing Wang, and Shan Tan. Statistical Iterative CBCT Reconstruction Based on Neural Network. IEEE Transactions on Medical Imaging, 37:1511–1521, 2018.
- (19) Janka Hatvani, András Horváth, Jérôme Michetti, Adrian Basarab, Denis Kouamé, and Miklós Gyöngy. Deep learning-based super-resolution applied to dental computed tomography. IEEE Transactions on Radiation and Plasma Medical Sciences, 3:120–128, 2019.
- (20) Marc Kachelriess, Michael Knaup, C. Penssel, and Willi A. Kalender. Flying focal spot (FFS) in cone-beam CT. IEEE Transactions on Nuclear Science, 53:1238–1247, 2006.
- (21) Thomas G. Flohr, Karl Stierstorfer, Stefan Ulzheimer, Herbert Bruder, Andrew Primak, and Cynthia H. McCollough. Image reconstruction and image quality evaluation for a 64-slice CT scanner with z-flying focal spot. Medical physics, 32 8:2536–47, 2005.
- (22) Yiannis Kyriakou, Marc Kachelrie, Michael Knaup, Jens U Krause, and Willi A Kalender. Impact of the z-flying focal spot on resolution and artifact behavior for a 64-slice spiral CT scanner. European radiology, 16:1206–1215, 2006.
- (23) Ziye Yan, Jianwu Li, Yao Lu, Hongxia Yan, and Yanfeng Zhao. Super resolution in CT. International Journal of Imaging Systems and Technology, 25(1):92–101, 2015.
- (24) Yi Li, Jing Li, Tianshu Wang, Maosen Lian, and Shouhua Luo. Micro-CT imaging of super-resolution MBIR algorithm based on sub-pixel displacement. In Medical Imaging 2020: Physics of Medical Imaging, volume 11312, pages 916–923. SPIE, 2020.
- (25) Ting Su, Jiongtao Zhu, Xin Zhang, Dong Zeng, Yuhang Tan, Han Cui, Hairong Zheng, Jianhua Ma, Dong Liang, and Yongshuai Ge. Super resolution dual-energy cone-beam CT imaging with dual-layer flat-panel detector. arXiv preprint arXiv:2210.05884, 2022.
- (26) Zachary C Lipton, John Berkowitz, and Charles Elkan. A critical review of recurrent neural networks for sequence learning. arXiv preprint arXiv:1506.00019, 2015.
- (27) Jiongtao Zhu, Ting Su, Xin Zhang, Jiecheng Yang, Donghua Mi, Yunxin Zhang, Xiang Gao, Hairong Zheng, Dong Liang, and Yongshuai Ge. Feasibility study of three-material decomposition in dual-energy cone-beam CT imaging with deep learning. Physics in Medicine & Biology, 67(14):145012, 2022.
- (28) Ting Su, Xindong Sun, Jiecheng Yang, Donghua Mi, Yikun Zhang, Haodi Wu, Shibo Fang, Yang Chen, Hairong Zheng, Dong Liang, and Yongshuai Ge. DIRECT-Net: a unified mutual-domain material decomposition network for quantitative dual-energy CT imaging. Medical Physics, 49(2):917–934, 2022.
- (29) Jia Deng, Wei Dong, Richard Socher, Li-Jia Li, Kai Li, and Li Fei-Fei. Imagenet: A large-scale hierarchical image database. In 2009 IEEE conference on computer vision and pattern recognition, pages 248–255. Ieee, 2009.
- (30) G Poludniowski, G Landry, F DeBlois, P M Evans, and F Verhaegen. SpekCalc: a program to calculate photon spectra from tungsten anode x-ray tubes. Physics in Medicine and Biology, 54(19):N433–N438, 2009.
- (31) R. T. Droege and Mark S. Rzeszotarski. Modulation transfer function from the variance of cyclic bar images. Optical Engineering, 23:230168, 1984.
- (32) Shan Gu, Hao Zhou, Zhilei Wang, and Hewei Gao. Evaluation of X-ray and CT imaging using a dual-layer flat-panel detector without interlayer metal filter. Chinese Journal of Stereology and Image Analysis, 27(2):81–88, 2022.
- (33) Alejandro Sisniega, Wojciech Zbijewski, J. Xu, Hao Dang, J. Webster Stayman, John I. Yorkston, Nafi Aygun, Vassilis E. Koliatsos, and Jeffrey H. Siewerdsen. High-fidelity artifact correction for cone-beam CT imaging of the brain. Physics in Medicine & Biology, 60:1415 – 1439, 2015.