Sequential Remote Brightenings and Co-spatial Fast Downflows during Two Successive Flares
Abstract
Remote brightenings often appear at outskirts of source active regions of solar eruptive events, nevertheless, their origin remains to be ascertained. In this study, we report imaging and spectroscopic observations of sequential remote brightenings with a combination of H Imaging Spectrograph (HIS) onboard the Chinese H Solar Explorer (CHASE), which is the first space-based solar telescope of China, and the Solar Dynamics Observatory. It is found that, during two successive M-class flares occurring on 2022 August 17, multiple ribbon-like brightenings appeared in sequence away from the flaring active region. Meanwhile, abundant cool filament materials moved downward to the sequential remote brightenings as visible at the H red wing with a line-of-sight speed up to 70 km s-1. The extrapolated three-dimensional magnetic field configuration shows that the sequential remote brightenings correspond to the footpoints of closed ambient field lines whose conjugate footpoints are rooted in the main flare site. We suggest that the sequential remote brightenings are most likely caused by the heating of interchange reconnection between the erupting flux rope and closed ambient field, during which the rope-hosting filament materials are transferred to the periphery of flaring active region along the closed ambient field rather than to the interplanetary space like in the scenario of the slow solar wind formation.
1 Introduction
Solar flares are phenomena of explosive magnetic energy releases that frequently occur in solar atmosphere and produce electromagnetic emissions at a wide range of wavelengths (for reviews see Fletcher et al., 2011; Benz, 2017). Flares are usually classified into two types, i.e., confined and eruptive flares, the latter of which are accompanied with coronal mass ejections (CMEs; Schmieder et al., 2015). In the standard model (Carmichael, 1964; Sturrock, 1966; Hirayama, 1974; Kopp & Pneuman, 1976), flares and CMEs are considered to be two manifestations of the same process (Zhang et al., 2001), namely the violent disruption of coronal magnetic field. Magnetic reconnection taking place in the wake of erupting CMEs is believed to play a crucial role in converting magnetic energy into kinetic energy of CMEs, thermal energy of flares and energetic particles (Priest & Forbes, 2002; Shibata & Magara, 2011). In observations, the most remarkable characteristic of flares are the brightening ribbons at multi-passbands such as H and ultraviolet (UV), corresponding to the footpoints of post-flare loops heated by energetic particles (Benz, 2017). It is believed that the particles propagate along reconnection-formed field lines to the lower atmosphere and heat the plasma over there through Coulomb collisions (e.g., Tian & Chen, 2018).
Aside from the magnetic reconnection in the current sheet connecting CMEs and flare loops (Cheng et al., 2018), it may occur between the erupting CMEs and ambient/background field, namely the interchange reconnection (Crooker et al., 2002), which was proposed originally to interpret the origin of slow solar wind (e.g., Bale et al., 2019). It was also suggested that interchange reconnection may occur between the CME magnetic flux rope (MFR) and the open field during the eruption so as to facilitate the escape of energetic particles (e.g., Masson et al., 2013; Yang et al., 2015). Two pieces of indirect evidence are observations of type III radio bursts caused by escaped electron beams, in particular for those extending to the wavelength of decamneter-kilometer (van Driel-Gesztelyi et al., 2008; Reid & Ratcliffe, 2014; Kou et al., 2020; Wang et al., 2022), and intense solar energetic particles (SEPs) that arrive at the Earth and cause space weather effects (Masson et al., 2012, 2013). Moreover, interchange reconnection is also able to produce the leakage of filament materials once the eruption involves filaments, as well as the drifting of filament footpoints (Aulanier & Dudík, 2019; Yan et al., 2020; Li et al., 2022). In addition, interchange reconnection was also proposed to interpret the evolution of the boundary of coronal holes (Subramanian et al., 2010; Moore et al., 2015) and the formation of switchbacks in solar wind (Drake et al., 2021).
In this study, we report imaging and spectroscopic observations of ribbon-like remote brightenings, which propagated in a jumped manner away from associated active region during an eruption. With careful analyses, we suggest that these sequential remote brightenings are most likely to be caused by the interchange reconnection between erupting MFR and the closed ambient field. The data and methods are introduced in Section 2. The properties of sequential remote brightenings and related magnetic configuration are shown in Section 3, which is followed by a summary and discussion in Section 4.
2 Instruments and Methods
The data applied in this study is mainly acquired from the H Imaging Spectrograph (HIS), which is equipped on the Chinese H Solar Explorer (CHASE; Li et al., 2022). The CHASE/HIS provides full-disk scanning of the Sun at wavebands of H (6559.7 - 6565.9 Å) and Fe I (6567.8 - 6570.6 Å) with a spectral sampling of 0.024 Å. A full-Sun scanning takes 46 s and the time interval of adjacent scanning, equivalent to temporal cadence, is 73 s. In the binning mode data applied in present study, the spatial resolution is and the spectral sampling is 0.048 Å. The Atmospheric Imaging Assembly (AIA; Lemen et al., 2012) on board the Solar Dynamics Observatory (SDO) provides UV and EUV images of the solar atmosphere at nine passbands. The temporal cadence is 12 s (94, 131, 171, 193, 211, 304 and 335 Å) or 24 s (1600 Å and 1700 Å) and the spatial resolution is . The Helioseismic and Magnetic Imager (HMI; Scherrer et al., 2012) provides the full-disk line-of-sight (LOS) magnetograms with the spatial resolution of but a lower time cadence ( 45 s) than that for AIA. The solar full-disk H images from the Global Oscillation Network Group (GONG; Harvey et al., 1996) and the soft X-ray (SXR) images from the X-Ray Telescope (XRT) onboard Hinode (Golub et al., 2007) are also used.
We first calibrate CHASE/HIS data, which includes the dark-field and flat-field correction, slit image curvature correction, wavelength and intensity calibration, and coordinate transformation (Qiu et al., 2022). To make alignment of the HIS images with the SDO/AIA images, we use the routine SIR.pro (Feng et al., 2012; Yang et al., 2015), which is based on the cross correlation method. The alignment is achieved by comparing the HMI continuum images and HIS Fe I line image. Moreover, we identify the sequential remote brightenings using the HIS H line center images. With a back and forth test, we find that the regions whose intensity is 30% larger than the full-disk average intensity can well define the sequential remote brightenings. The EUV images observed by SDO/AIA are enhanced using the multi-scale Gaussian normalization technique (Morgan & Druckmüller, 2014). For UV passbands, we also use the 1600 Å to 1700 Å ratio images to enhance the visibility of sequential remote brightenings at 1600 Å.
We determine the Doppler shifts of the H line as follows. First, we get the contrast spectra via , where is the spectral line intensity at the pixel , is the averaged line intensity of the quiescent region with a size of near the eruption site. Then we calculate the centroid of the strongest absorption dip at the red wing of . Finally, the Doppler velocity is estimated by considering that this red wing absorption is caused by downward moving cool plasma.
3 Results
3.1 Overview of the eruptive event
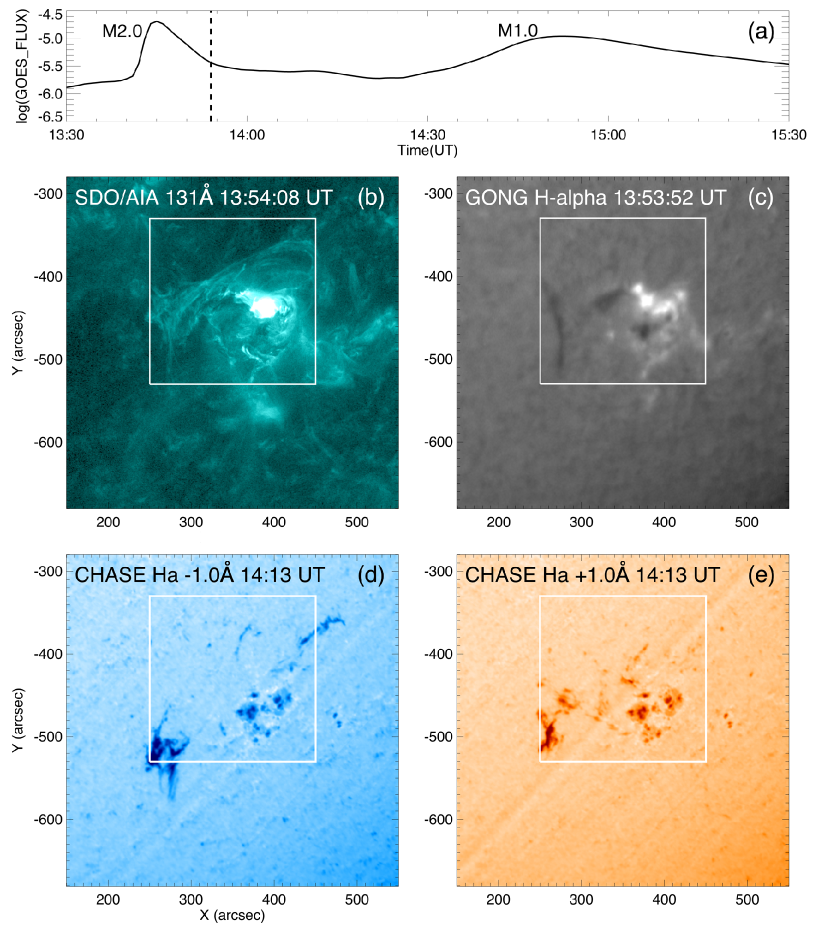
The timeline of the eruptive event is shown in Table 1. On 2022 August 17, an M2.0 flare occurred in NOAA active region (AR) 13078 with its GOES SXR flux peaking at 13:45 UT (Figure 1a). Accompanied with the flare, a rising channel-like structure, known as an MFR (Cheng et al., 2013, 2017), was observed at the AIA 131 Å (Figure 1b). With the rising and expansion of the MFR, a Morton wave appeared at 13:44 UT and then propagated towards the northeast lasting for several minutes. The early eruption of the MFR is found to experience two periods. It first propagated towards the northeast but suddenly changed the direction to the southwest around 13:50 UT. At 14:15 UT, a bright thin thread as part of the MFR can be observed at the northeast of the ARs. At 14:30 UT, the second M1.0 class flare from the same AR started to occur with the flux peaking at 14:52 UT. During the same time, the MFR mainly moved towards the southwest with its left leg clearly visible at almost all EUV passbands. After 15:00 UT, a halo CME was observed by the C2 telescope of the Large Angle and Spectrometric Coronagraph (LASCO) on board Solar and Heliospheric Observatory (SOHO). With a careful inspection, an exceptional feature is that two filament segments were involved in the MFR eruption. The first filament segment from the east of the AR rose along with the left leg of the MFR (Figure 1c). After 14:10 UT, the second segment from the northwest of the AR rose with the right leg of the MFR. These two filament segments sharply erupted as a whole with the MFR after the eruption changed the propagation direction with a large amount of filament materials moving outward as visible at the H blue wing image (Figure 1d).
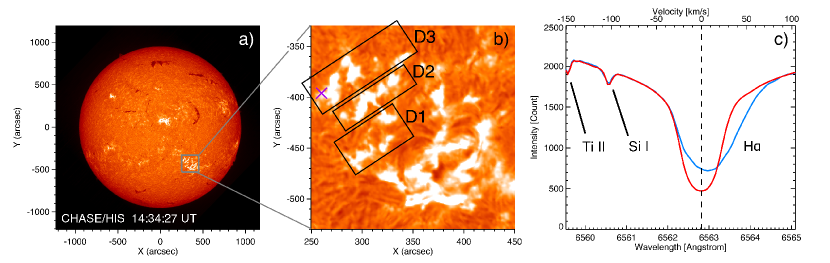
An interesting phenomenon is that some remote brightenings appeared sequentially at multi-passbands (including X-ray, EUV, UV and H line center) after the MFR changed its original eruptive orientation ( 14:15 UT – 14:45 UT). Figure 2 presents the chromospheric images of the remote brightenings at the H line center and their representative H line profile. It is clear that the remote brightenings appeared as multiple ribbon-like brightenings at the periphery of source active region (Figure 2b) and the corresponding H line showed obvious red asymmetry (Figure 2c). We argue that both the remote brightenings and the second flare were caused during the second stage of the MFR eruption. In the paper, we mainly focus on the formation of these interesting remote brightenings.
| Time | Observations |
|---|---|
| 13:26 UT | The first M2.0 class flare started |
| 13:26 - 13:50 UT | The hot-channel-like MFR appeared and rose |
| 13:44 UT | A Morton wave formed and propagated towards the northeast |
| 13:45 UT | The first flare peaked |
| After 13:50 UT | The MFR changed its propagation direction to the southwest, finally giving rise to a CME |
| 14:15 - 14:45 UT | Sequential remote brightenings appeared |
| After 14:26 UT | Sequential bright loops appeared in the X-ray images |
| 14:52 UT | The second M1.0 class flare peaked |
3.2 Features of the sequential remote brightenings
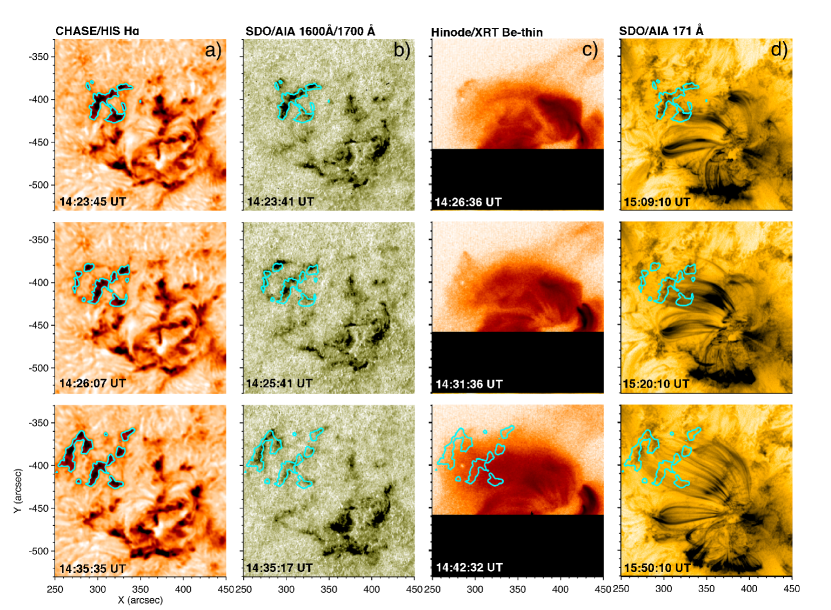
We identify three remote brightenings (D1, D2 and D3) according to their distances to the main flare region. The closest D1 started to appear at about 14:15 UT. Then D2 and D3 occurred sequentially within 30 minutes. For each remote brightening, it appeared almost simultaneously at different passbands, including H, UV, EUV and X-ray. However, the remote brightenings disappeared first at the higher-temperature passbands and then the lower ones, and thus their duration times are quite different at different passbands. Specifically, the sequential remote brightenings lasted for 55 minutes at the 335 Å passband, 65 minutes at the 304Å passband, and about 70 minutes at the H line center. Moreover, after the appearance of sequential remote brightenings, some bright loops connecting the remote brightenings and the flare site started to be visible in the X-ray passband from 14:26 UT and then sequentially from the high- to low-temperature EUV passbands (Figure 3c-d). These characteristics highly resemble those of the main flare process, during which the bright flare ribbons correspond to the footpoints of post-flare loops that gradually cool down from an initially high temperature to a later low temperature.
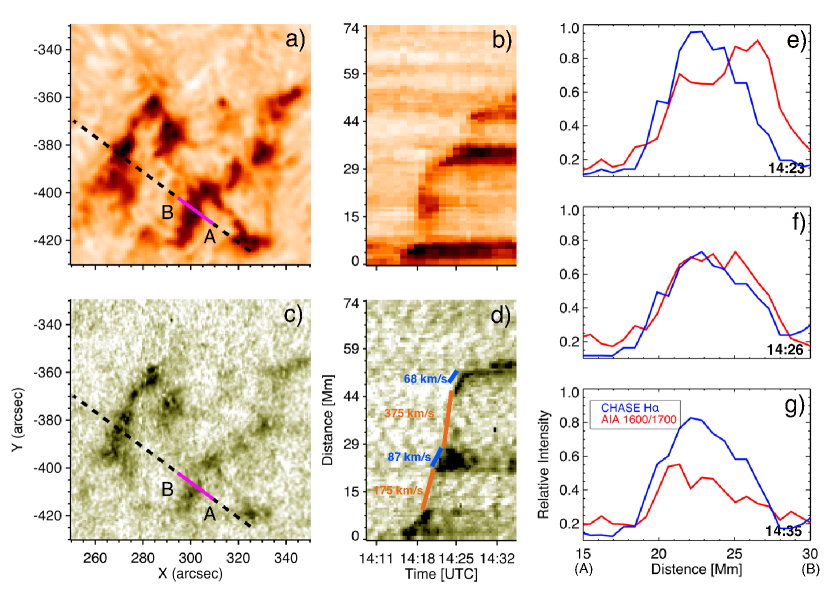
Note that these loops are obviously different from the post-flare loops pertinent to the two M-class flares spatially and temporally. Hence, we argue that magnetic reconnection, which is suspected to be interchange reconnection as interpreted in Section 4, was likely to take place between the MFR and the ambient field. Such a reconnection process, being distinguished from the flare reconnection above the post-flare loops, produced sequential remote brightenings. The H line center intensity of sequential remote brightenings is 150% times the average intensity of the quiescent region. This value is significantly smaller than that for the main flare ribbons, suggesting that the reconnection causing remote brightenings is much milder than that causing the main flare. The spatial extensions of remote brightening regions are about , which is comparable to the size of the main AR. The remote brightenings are mostly ribbon-like brightenings, whose widths are estimated to vary from 5 Mm to 20 Mm. In addition, we also estimate the propagation velocity of remote brightenings based on the distance-time plots as shown by panels b and d in Figure 4. The velocity varies with propagation directions but is mainly in the range of 50–120 km s-1. One important feature for these remote brightenings is that the remote brightening leading front seems to jump between different ribbons with an apparent velocity of 150–400 km s-1, which is obviously larger than the propagation speed of the remote brightening leading front within the ribbons.
To reveal the differences of sequential remote brightenings at the H and UV 1600 Å bands, we plot the distribution of the intensity along the slit (as shown by the pink segments of the dashed line in Figure 4a-b). First, we find that the intensity of sequential remote brightenings at the 1600 Å passband decreases faster than that in the H line center (Figure 4e-g). Second, it seems that the leading fronts of remote brightenings at the 1600 Å propagated faster than those at the H. However, the distances between the fronts at two passbands are less than 5 Mm for almost all directions (Figure 4e). When the leading fronts stopped propagation, such discrepancies disappeared quickly.
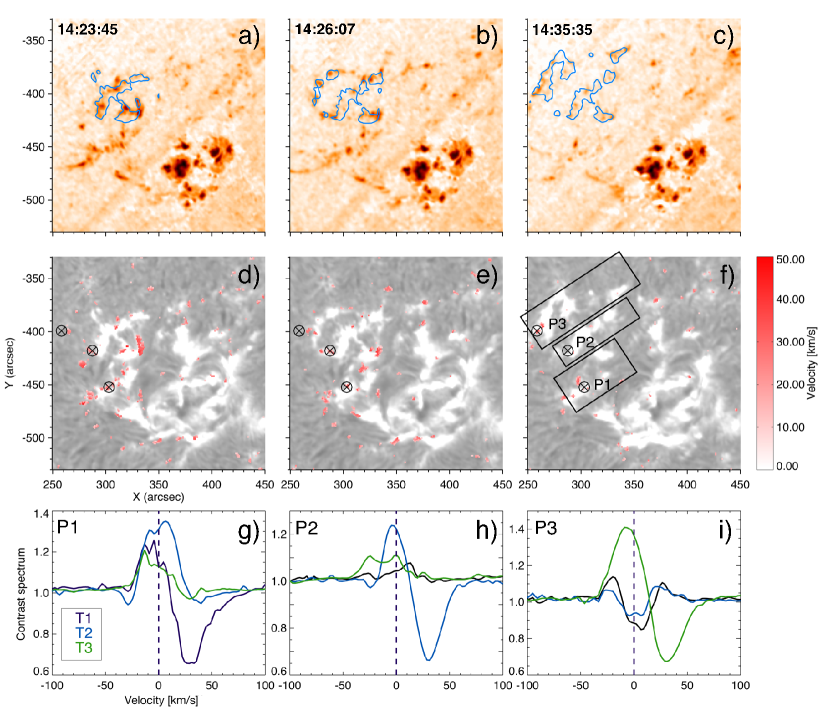
A more important finding is that the sequential remote brightenings were accompanied with downward-moving filament materials (Figure 5a-c). In the H red wing images, one can observe some dark patches moving towards the northeast. They usually lasted for several minutes. Like the propagation of remote brightenings, these patches first appeared at D1 and then at D2 and D3 in sequence. The second important property is that most dark patches coincide with the remote brightenings not only spatially but also temporally. Figure 5g-i displays the H contrast profiles of these dark patches, which show significant absorption at the H red wing. Using the contrast profiles, we derive the Doppler velocities of the absorption dip at the red wing, which are up to 70 km s-1 (Figure 5d-f). This implies cool filament materials moving downward close to the remote brightenings.
3.3 Magnetic Property of the sequential remote brightenings
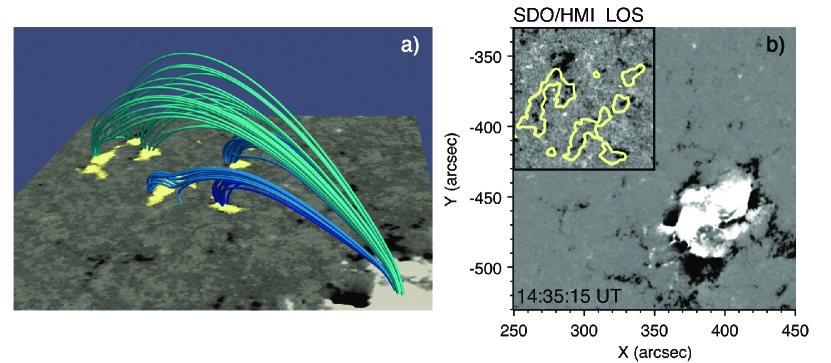
The HMI LOS magnetograms disclose that the AR 13078 consists of a main positive polarity region surrounded by several discrete negative polarity regions. The sequential remote brightenings are found to be located at regions containing some tiny negative polarity patches outside of the main AR as shown in Figure 6b, where the magnetic field strength is about 100 G.
To explore the cause of sequential remote brightenings, we extrapolate the 3D potential field of the AR utilizing the Green function method and investigate the corresponding magnetic connectivity (Figure 6a). We find large-scale closed ambient loops with their left footpoints well corresponding to the remote brightenings and the right ones being located close to the main flare region. Moreover, these ambient loops are highly consistent with the bright loops as visible at the AIA EUV passbands (Figure 3d). We suggest that the interchange reconnection most likely occurs between the erupting flux and large-scale closed ambient fields. On the one hand, the reconnection heats the footpoints of the ambient fields with the left ones corresponding to the remote brightenings and the right ones mixed into the main flare brightenings. On the other hand, the reconnection also simultaneously transfers the materials from the rope-hosting filaments to newly formed ambient fields, and the movement of the filament materials to the remote brightenings gives rise to a red-shifted absorption in the H profiles. Since the large-scale ambient loops are mainly connected to the sporadic negative polarities that are far away from the main active region and form ribbon-like patterns as shown in Figure 6b, the footpoints of the large-scale ambient loops naturally appear as ribbon-like brightenings once the released energy from the interchange reconnection is transported there.
4 Summary and Discussions
In this study, we report imaging and spectroscopic observations of multiple ribbon-like remote brightenings pertinent to the main flare by CHASE/HIS and SDO. One significant property is that these remote brightenings occurred sequentially away from the main flare ribbons and were accompanied by downward-moving filament materials. These sequential remote brightenings are similar to sequential chromospheric brightenings first reported by Balasubramaniam et al. (2005) based on the common features, i.e., the sequential appearance at parasitic unipolar regions away from the main AR (Balasubramaniam et al., 2005; Pevtsov et al., 2007). However, some discrepancies are also found between them. In Balasubramaniam et al. (2005), sequential chromospheric brightenings are composed of separated brightening points appearing at distinct locations and times. The propagation velocity of them is over 600 km s-1. The remote brightenings observed here are more like sequential bright ribbons and have a slower propagation velocity of 300 km s-1. The duration times of remote brightenings are also much longer than that (5.7 minutes) for sequential chromospheric brightenings (e.g., Kirk et al., 2012). The sequential remote brightenings are also closely related to secondary flare ribbons, which are usually ribbon-like brightnings as extensions of the main flare ribbons (Zhang et al., 2014). We suspect that the secondary flare ribbons also originate from interchange reconnection but may correspond to the drifting footpoints of the erupting MFR as suggested in Lim et al. (2017) and Aulanier & Dudík (2019). In contrast, the remote brightenings are argued to be the footpoints of newly-formed closed ambient loops.
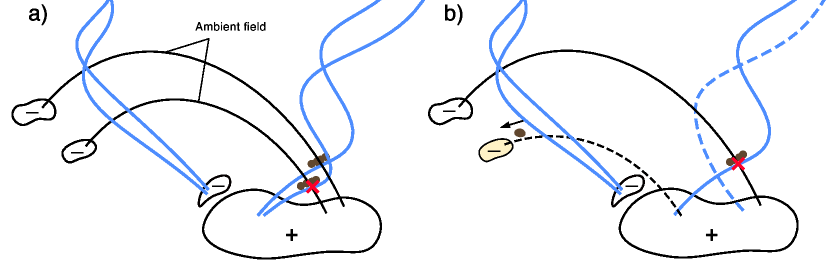
The extrapolated 3D magnetic field configuration further justifies the interchange reconnection we conjecture. In Figure 7, we interpret the process of interchange reconnection in more detail with a schematic drawing. As the MFR erupts outward, it encounters the ambient closed magnetic loops connecting the main AR positive polarity region and the sporadic negative polarities at the outskirts of the AR. The reconnection is supposed to occur between the MFR right leg and the large-scale ambient loops (Figure 7a). When the interchange reconnection occurs, the ambient loops slightly change their footpoints close to the MFR footpoint. Meanwhile, the filament materials are also guided from the erupting MFR to the newly formed ambient loops, and the falling materials thus become visible in the H red wing (Figure 7b). Such a reconnection process is quite similar to the reconnection between the inclined arcade and the erupting MFR in Aulanier & Dudík (2019). In Yan et al. (2020), the similar reconnection process between the erupting filament and the overlying field was also used to explain the transfer and descent of the filament materials. Moreover, in the current event, there exists several groups of closed ambient loops whose remote footpoints are discretely distributed (Figure 6a), which is the main reason of the remote brightenings appearing sequentially away from the main flare region.
We find that the bright loops (Figure 3c-d) connecting the sequential remote brightenings to the main flare region have a quite long cooling time, which is estimated by the formula proposed by Cargill et al. (1995):
| (1) |
where , and are the half-length, initial temperature and density of the loops, respectively. The initial temperature is regarded as K since the loops were first observed in the XRT images. The density is estimated to be about cm-3, as derived through (Cheng et al., 2012), where EM is the total emission measure and is the depth of the loops along the line-of-sight. The depth of the loops usually approximates their width, which is taken as 1.5 Mm here. Based on the extrapolated 3D magnetic field, the lengths of these loops range from 58 Mm to 121 Mm, the cooling times are thus calculated to be 1.3 - 2.5 hours, consistent with the observed cooling time.
Note that, the sequential remote brightenings as defined as sequential patches of EUV brightenings by Guo et al. (2015) were also suggested to be caused by magnetic reconnection between the expanding CME front and localized magnetic field. Nevertheless, for this particular event, such a possibility is excluded because both the CME front and associated Moreton wave were observed to travel across the remote brightening regions about 30 minutes earlier and that no any other waves are found to be temporally related to the remote brightenings.
Although we address that the sequential remote brightenings imply the interchange reconnection between the eruptive MFR and ambient field, which is even expected to widely exist in solar eruption events, such a reconnection process need more observational evidence. Further investigations with data-constrained MHD simulations are planned to reveal how an MFR (or a CME) interacts with the ambient fields and to determine the exact process of the interchange reconnection.
References
- Aulanier & Dudík (2019) Aulanier, G., & Dudík, J. 2019, A&A, 621, A72, doi: 10.1051/0004-6361/201834221
- Balasubramaniam et al. (2005) Balasubramaniam, K. S., Pevtsov, A. A., Neidig, D. F., et al. 2005, ApJ, 630, 1160, doi: 10.1086/432030
- Bale et al. (2019) Bale, S. D., Badman, S. T., Bonnell, J. W., et al. 2019, Nature, 576, 237, doi: 10.1038/s41586-019-1818-7
- Benz (2017) Benz, A. O. 2017, Living Reviews in Solar Physics, 14, 2, doi: 10.1007/s41116-016-0004-3
- Cargill et al. (1995) Cargill, P. J., Mariska, J. T., & Antiochos, S. K. 1995, ApJ, 439, 1034, doi: 10.1086/175240
- Carmichael (1964) Carmichael, H. 1964, NASA Special Publication, 50, 451
- Cheng et al. (2017) Cheng, X., Guo, Y., & Ding, M. 2017, Science China Earth Sciences, 60, 1383, doi: 10.1007/s11430-017-9074-6
- Cheng et al. (2018) Cheng, X., Li, Y., Wan, L. F., et al. 2018, ApJ, 866, 64, doi: 10.3847/1538-4357/aadd16
- Cheng et al. (2013) Cheng, X., Zhang, J., Ding, M. D., Liu, Y., & Poomvises, W. 2013, ApJ, 763, 43, doi: 10.1088/0004-637X/763/1/43
- Cheng et al. (2012) Cheng, X., Zhang, J., Saar, S. H., & Ding, M. D. 2012, ApJ, 761, 62, doi: 10.1088/0004-637X/761/1/62
- Crooker et al. (2002) Crooker, N. U., Gosling, J. T., & Kahler, S. W. 2002, Journal of Geophysical Research (Space Physics), 107, 1028, doi: 10.1029/2001JA000236
- Drake et al. (2021) Drake, J. F., Agapitov, O., Swisdak, M., et al. 2021, A&A, 650, A2, doi: 10.1051/0004-6361/202039432
- Feng et al. (2012) Feng, S., Deng, L., Shu, G., et al. 2012, in 2012 IEEE Fifth International Conference on Advanced Computational Intelligence (ICACI), 626–630, doi: 10.1109/ICACI.2012.6463241
- Fletcher et al. (2011) Fletcher, L., Dennis, B. R., Hudson, H. S., et al. 2011, Space Sci. Rev., 159, 19, doi: 10.1007/s11214-010-9701-8
- Golub et al. (2007) Golub, L., DeLuca, E., Austin, G., et al. 2007, Sol. Phys., 243, 63, doi: 10.1007/s11207-007-0182-1
- Guo et al. (2015) Guo, Y., Ding, M. D., & Chen, P. F. 2015, ApJS, 219, 36, doi: 10.1088/0067-0049/219/2/36
- Harvey et al. (1996) Harvey, J. W., Hill, F., Hubbard, R. P., et al. 1996, Science, 272, 1284, doi: 10.1126/science.272.5266.1284
- Hirayama (1974) Hirayama, T. 1974, Sol. Phys., 34, 323, doi: 10.1007/BF00153671
- Kirk et al. (2012) Kirk, M. S., Balasubramaniam, K. S., Jackiewicz, J., McAteer, R. T. J., & Milligan, R. O. 2012, ApJ, 750, 145, doi: 10.1088/0004-637X/750/2/145
- Kopp & Pneuman (1976) Kopp, R. A., & Pneuman, G. W. 1976, Sol. Phys., 50, 85, doi: 10.1007/BF00206193
- Kou et al. (2020) Kou, Y. K., Jing, Z. C., Cheng, X., et al. 2020, ApJ, 898, L24, doi: 10.3847/2041-8213/aba362
- Lemen et al. (2012) Lemen, J. R., Title, A. M., Akin, D. J., et al. 2012, Sol. Phys., 275, 17, doi: 10.1007/s11207-011-9776-8
- Li et al. (2022) Li, C., Fang, C., Li, Z., et al. 2022, Science China Physics, Mechanics & Astronomy, 65, 289602, doi: 10.1007/s11433-022-1893-3
- Li et al. (2022) Li, H. T., Cheng, X., Guo, J. H., et al. 2022, A&A, 663, A127, doi: 10.1051/0004-6361/202243115
- Lim et al. (2017) Lim, E.-K., Yurchyshyn, V., Kumar, P., et al. 2017, ApJ, 850, 167, doi: 10.3847/1538-4357/aa93f7
- Masson et al. (2013) Masson, S., Antiochos, S. K., & DeVore, C. R. 2013, ApJ, 771, 82, doi: 10.1088/0004-637X/771/2/82
- Masson et al. (2012) Masson, S., Aulanier, G., Pariat, E., & Klein, K. L. 2012, Sol. Phys., 276, 199, doi: 10.1007/s11207-011-9886-3
- Moore et al. (2015) Moore, R. L., Sterling, A. C., & Falconer, D. A. 2015, ApJ, 806, 11, doi: 10.1088/0004-637X/806/1/11
- Morgan & Druckmüller (2014) Morgan, H., & Druckmüller, M. 2014, Sol. Phys., 289, 2945, doi: 10.1007/s11207-014-0523-9
- Pevtsov et al. (2007) Pevtsov, A. A., Balasubramaniam, K. S., & Hock, R. A. 2007, Advances in Space Research, 39, 1781, doi: 10.1016/j.asr.2007.02.058
- Priest & Forbes (2002) Priest, E. R., & Forbes, T. G. 2002, The Astronomy and Astrophysics Review, 10, 313, doi: 10.1007/s001590100013
- Qiu et al. (2022) Qiu, Y., Rao, S., Li, C., et al. 2022, Science China Physics, Mechanics, and Astronomy, 65, 289603, doi: 10.1007/s11433-022-1900-5
- Reid & Ratcliffe (2014) Reid, H. A. S., & Ratcliffe, H. 2014, Research in Astronomy and Astrophysics, 14, 773, doi: 10.1088/1674-4527/14/7/003
- Scherrer et al. (2012) Scherrer, P. H., Schou, J., Bush, R. I., et al. 2012, Sol. Phys., 275, 207, doi: 10.1007/s11207-011-9834-2
- Schmieder et al. (2015) Schmieder, B., Aulanier, G., & Vršnak, B. 2015, Sol. Phys., 290, 3457, doi: 10.1007/s11207-015-0712-1
- Shibata & Magara (2011) Shibata, K., & Magara, T. 2011, Living Reviews in Solar Physics, 8, 6, doi: 10.12942/lrsp-2011-6
- Sturrock (1966) Sturrock, P. A. 1966, Nature, 211, 695, doi: 10.1038/211695a0
- Subramanian et al. (2010) Subramanian, S., Madjarska, M. S., & Doyle, J. G. 2010, A&A, 516, A50, doi: 10.1051/0004-6361/200913624
- Tian & Chen (2018) Tian, H., & Chen, N. H. 2018, ApJ, 856, 34, doi: 10.3847/1538-4357/aab15a
- van Driel-Gesztelyi et al. (2008) van Driel-Gesztelyi, L., Goff, C. P., Démoulin, P., et al. 2008, Advances in Space Research, 42, 858, doi: 10.1016/j.asr.2007.04.065
- Wang et al. (2022) Wang, B. T., Cheng, X., Song, H. Q., & Ding, M. D. 2022, A&A, 666, A166, doi: 10.1051/0004-6361/202244275
- Yan et al. (2020) Yan, X., Xue, Z., Cheng, X., et al. 2020, ApJ, 889, 106, doi: 10.3847/1538-4357/ab61f3
- Yang et al. (2015) Yang, J., Jiang, Y., Xu, Z., Bi, Y., & Hong, J. 2015, ApJ, 803, 68, doi: 10.1088/0004-637X/803/2/68
- Yang et al. (2015) Yang, Y.-F., Qu, H.-X., Ji, K.-F., et al. 2015, Research in Astronomy and Astrophysics, 15, 569, doi: 10.1088/1674-4527/15/4/009
- Zhang et al. (2001) Zhang, J., Dere, K. P., Howard, R. A., Kundu, M. R., & White, S. M. 2001, ApJ, 559, 452, doi: 10.1086/322405
- Zhang et al. (2014) Zhang, J., Li, T., & Yang, S. 2014, ApJ, 782, L27, doi: 10.1088/2041-8205/782/2/L27