reception date \Acceptedacception date \Publishedpublication date
ISM: individual objects (W51C) — ISM: atoms — cosmic rays — submillimeter: ISM
Cosmic-ray-driven enhancement of the C0/CO abundance ratio in W51C
Abstract
We examine spatial variations of the C0/CO abundance ratio () in the vicinity of the -ray supernova remnant W51C, based on [C i] (–), 12CO(1–0), and 13CO(1–0) observations with the ASTE and Nobeyama 45-m telescopes. We find that varies in a range of 0.02–0.16 (0.05 in median) inside the molecular clouds of 100 mag, where photodissociation of CO by the interstellar UV is negligible. Furthermore, is locally enhanced up to by a factor of four near the W51C center, depending on the projected distance from the W51C center. In high- molecular clouds, is determined by the ratio of the cosmic-ray (CR) ionization rate to the H2 density, and we find no clear spatial variation of the H2 density against the projected distance. Hence, the high CR ionization rate may locally enhance near the W51C center. We also find that the observed spatial extent of the enhanced (17 pc) is consistent with the diffusion distance of CRs with the energy of 100 MeV. The fact suggests that the low-energy CRs accelerated in W51C enhance . The CR ionization rate at the -enhanced cloud is estimated to be 310-16 s-1 on the basis of time-dependent PDR simulations of , the value of which is 30 times higher than that in the standard Galactic environment. These results demonstrate that [C i] is a powerful probe to investigate the interaction between CRs and the interstellar medium for a wide area in the vicinity of supernova remnants.
1 Introduction
Cosmic rays (CRs) are one of the important components that determine the chemical properties of the interstellar medium (ISM). CRs penetrate deep into molecular clouds (5 mag; e.g., Shen et al. 2004), while interstellar ultraviolet (UV) radiation affects only the surface of molecular clouds (i.e., photo-dissociation regions (PDRs); see, e.g., Tielens & Hollenbach 1985). Hence, the primary energy source of molecular clouds with 5 mag is CRs, which indicates the importance of CRs’ role to understand the evolution of the ISM in molecular clouds.
Gamma-ray supernova remnants (SNRs) are important targets to study CR chemistry. Among them, W51C is a middle-aged SNR (3104 yrs) at a distance of =5.4 kpc (Sato et al. 2010), showing bright X-ray and -ray emission (Koo et al. 1995; Abdo et al. 2009; Aleksić et al. 2012). The -ray emission originates from the interaction between accelerated CRs and molecular clouds (Aleksić et al. 2012). Notably, the presence of such interaction was confirmed in radio observations. Ceccarelli et al. (2011) observed DCO+(2–1) at five locations in the vicinity of W51C with the IRAM 30-m telescope and determined the CR ionization rate () at “point E” to be 10-15 s-1, which is two orders of magnitude higher than that in the standard Galactic environment (10-17 s-1). They argued that is enhanced by freshly accelerated low-energy CRs. To date, a high inside a molecular cloud associated with an SNR has been identified only in W51C and W28 (Vaupré et al. 2014). W51C is, therefore, a good target to study CR chemistry.
However, measurement of in the vicinity of an SNR is not a trivial task. The CR probes used in previous studies (e.g., DCO+(2–1) as in Ceccarelli et al. 2011) are very weak and thus are not suitable for wide-area mapping observations of molecular clouds, which are required for an extensive study of in the vicinity of an SNR. Bisbas et al. (2017) demonstrated that [C i] is a good probe of CRs on the basis of 3-dimensional PDR model calculations. They found that the C0/CO abundance ratio () would be 0.1 in the standard Galactic environment, whereas would be enhanced up to 10 in the extreme environment with . The C0 abundance is enhanced due to the destruction of CO by He+, which is produced by CRs. It is well known that both [C i] and CO show intense emission lines in the (sub-)millimeter wavelength range. Hence, [C i] and CO are suitable for measuring in the vicinity of W51C. Arikawa et al. (1999) observed [C i] (–) and 12CO(3–2) in the W51 complex region with the Mt. Fuji sub-millimeter telescope and found that [C i]/12CO(3–2) intensity ratio is high (0.6) in the vicinity of W51C. However, the relatively poor spatial grid size of 3 (3.4 pc) in their observations did not allow them to resolve fully the spatial structures of the molecular clouds. In order to distinguish the CR-originating [C i] enhancement inside molecular clouds from the UV-originating [C i] enhancement at the surface, mapping observations in a higher spatial resolution are essential.
In this paper, we present [C i] (–), 12CO(1–0), and 13CO(1–0) maps of W51C. The mapping area is 1500750 (28 pc14 pc), which is one of the most extensive [C i] observations of a Galactic SNR. The spatial resolution is 18 (0.3 pc), which is sufficiently high to spatially resolve the structures of the observed molecular clouds. Analyzing the data, we evaluate the effects of CRs on inside the molecular clouds associated with W51C.
2 Observations and Data Reduction
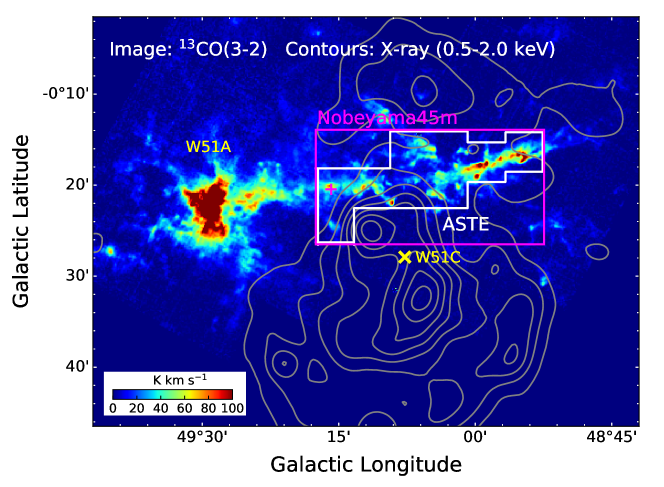
The observations of [C i] (–) were carried out during the period of 2019 August 12 to 17 with the Atacama Submillimeter Telescope Experiment (ASTE) 10-m telescope (Ezawa et al. 2004). The total observation time was 21 hrs, in which 10 hrs were on source. The mapping area is shown in figure 1. Nine sub-regions with an area of 250250 were covered with the on-the-fly (OTF) mapping using the ALMA Band 8 receiver (Satou et al. 2008) and backend WHSF (Iguchi & Okuda 2008; Okuda & Iguchi 2008). The frequency resolution and bandwidth were 500 kHz and 1024 MHz, respectively. The typical system temperature including the atmosphere was 1100 K. The pointing accuracy of the telescope was kept to be , using observations of R Aquila in 12CO(3–2).
Simultaneous observations of 12CO(1–0) and 13CO(1–0) were carried out during the period of 2020 January 21 to March 25 with the Nobeyama 45-m telescope. The total observation time was 9 hrs, in which 3.6 hrs were on source. One region with an area of 1500750 was covered with the OTF mapping using the four-beam receiver FOREST (Minamidani et al. 2016) and backend SAM45 (Kuno et al. 2011). The frequency resolution and bandwidth were 30.52 kHz and 62.5 MHz, respectively. The typical system temperatures including atmosphere were 400 K and 150 K for 12CO(1–0) and 13CO(1–0), respectively. The pointing accuracy of the telescope was kept to be , using observations of RT Aquila in SiO(1–0) maser.
Data reduction of [C i], 12CO(1–0), and 13CO(1–0) was performed with the NOSTAR software. For each map, we split data into an array and subtracted the baselines, using a first-order polynomial. The velocity ranges to subtract baselines were 30–50 and 85–90 km s-1 for [C i], 40–0, 32–35, and 100–110 km s-1 for 12CO(1–0), and 40–0 and 80–110 km s-1 for 13CO(1–0). The amplitude of line intensities was calibrated, using the main beam efficiency of =0.45 for [C i], 0.35 for 12CO(1–0), and 0.39 for 13CO(1–0). We used a spatial grid of 55 and a velocity grid of 0.5 km s-1. A Bessel-Gauss function was used for convolution. The effective angular resolution was 18 for [C i] and 17 for 12CO(1–0) and 13CO(1–0). The typical noise levels of the final cubes were 1.0 K, 0.88 K, and 0.31 K for [C i], 12CO(1–0), and 13CO(1–0), respectively, in the scale.
3 Results
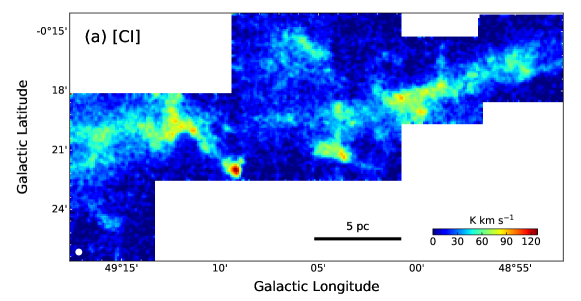
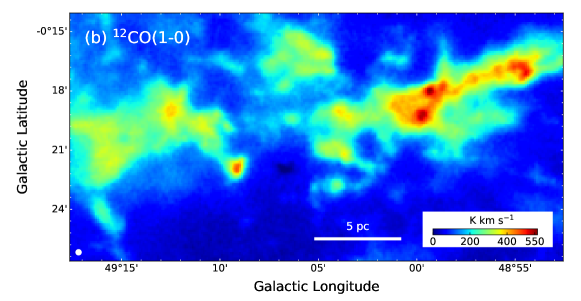
Figure 2 shows integrated intensity maps of [C i], 12CO(1–0), and 13CO(1–0), where the data are integrated over the velocity range 55–80 km s-1, which is associated with the W51 complex (Parsons et al. 2012). The overall spatial distributions, primarily extending in the east-west direction, are similar among the three maps. The morphological similarity between [C i] and CO maps has been reported in previous studies of Galactic star-forming regions (Ikeda et al. 2002; Kamegai et al. 2003; Shimajiri et al. 2013; Izumi et al. 2021). A more detailed look, however, reveals some differences in local structures among them. Notably, the local maximum is located near the center in the [C i] map, whereas it is on the western side in the 12CO(1–0) and 13CO(1–0) maps. The differences in the local structures indicate that is not uniform over the mapping area.
is equivalent to the column density ratio of C0 to CO (i.e., (C0)/(CO)). We estimated (C0) and (CO) from the [C i], 12CO(1–0), and 13CO(1–0) data in 55–80 km s-1, where we assumed the local thermodynamic equilibrium and followed the procedures described in Izumi et al. (2021). (C0) and (CO) were estimated using the following equations;
| (1) |
| (2) |
where is excitation temperature, and are optical depths of [C i] and 13CO(1–0), respectively, and is the 12CO/13CO abundance ratio of 71 (Frerking et al. 1982). We used estimated from the peak brightness temperature of 12CO(1–0) assuming that 12CO(1–0) is optically thick; is estimated on a pixel-by-pixel basis and is common to the estimation of (C0) and (CO). The minimum and maximum values of in the mapping area are 6 K and 81 K, respectively. Consequently, the optical depths of [C i] and 13CO(1–0), (C0), and (CO) were derived to be 0.14–1.41, 0.09–0.90, (2–22)1017 cm-2, and (3–310)1017 cm-2, respectively.
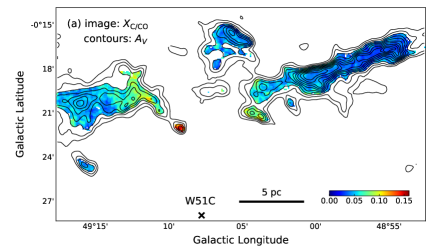
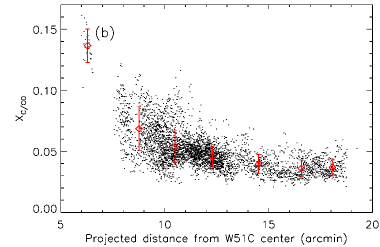
We find that the derived varies in a range of with a median value of 0.06, which is roughly consistent with those in Galactic star-forming regions (DR15: Oka et al. 2001; Oph: Kamegai et al. 2003; Orion: Ikeda et al. 2002; RCW38: Izumi et al. 2021). In the following analyses and discussion, considering that is enhanced by the photodissociation of CO at the surface of molecular clouds, we focus on the regions with 100 mag, where is calculated as =(CO)104/9.41020 (Frerking et al. 1982), in order to examine solely the effect of CRs independently of that of interstellar UV radiation. Figure 3(a) shows the map of , where the regions with 100 mag are masked out. varies in a range of (0.05 in median). We find that is systematically high at the center of the mapping area and is low at the edge. The gradient suggests that is locally enhanced near the W51C center, which is located at the center bottom of the mapping area. Figure 3(b) shows the distribution of plotted against the projected distance from the W51C center, which visualizes a clear enhancement of by a factor of four near the W51C center; is nearly constant of 0.04 at the region far from the W51C center (), while is enhanced up to 0.14 near the W51C center. This type of clear trend of has never been reported in any other SNRs.
4 Discussion and conclusions
4.1 Origin of the local enhancement of
Focusing on the regions with mag in the vicinity of W51C, we have found a characteristic feature of : local enhancement of by a factor of four near the W51C center. Our wide-area maps of [C i] and CO greatly contribute to the advancement of our understanding of the global variations of . In the following discussion, we discuss the origin of the local enhancement of .
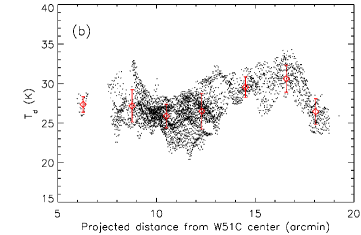
In our analysis, we selected the regions with 100 mag, where the effects of interstellar UV radiation to are expected to be negligible. Here, we validate the assumption, i.e., the interstellar UV radiation does not reach deep inside molecular clouds with a high . Figure 4(a) shows a map of the dust temperature , which is estimated from the ratio of Herschel 70- and 160- maps under an assumption of the dust emissivity power-law index of =2. We find that ranges 20–38 K. Comparison of and maps indicates that is low in the high- regions. In addition, the distribution of against the projected distance from the W51C center (figure 4(b)) does not show local enhancement near the W51C center. Hence, the molecular clouds with 100 mag are well shielded from interstellar UV radiation and its contribution is negligible for the spatial variations of inside molecular clouds.
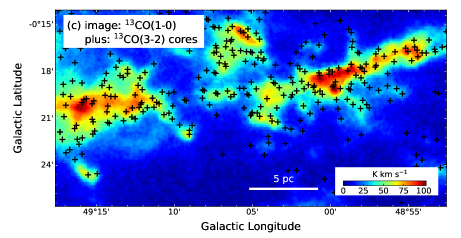
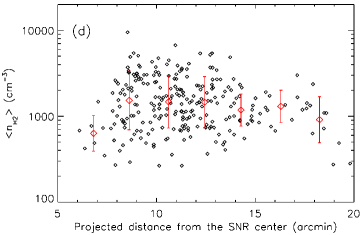
Generally, in high- molecular clouds is determined by the ratio of the CR ionization rate () to the H2 density () on the basis of the balance between molecular formation and destruction. Accordingly, the enhancement of is, if present, caused by a low or high . To investigate the former possibility, we examine the spatial variations of of cloud cores. Parsons et al. (2012) presented a catalog of cloud cores, compiled from their 13CO(3–2) observations. We plot in figure 4(c) the positions of the cataloged cloud cores overlaid on the 13CO(1–0) integrated intensity map; the plot shows that the cloud cores are identified across the entire mapping area. Using the ratio between the H2 column density and core diameter, we estimate averaged in each core, . Figure 4(d) shows plotted against the projected distance from the W51C center. We find that has a typical value of 103 cm-3 and shows no clear variation against the projected distance. Hence, the local enhancement of in figure 3(b) is likely to be caused not by a low but by a high . Note that the region closest to the W51C center locally has a lower than other regions by a factor of two, which may cause a part of the enhancement of at the region.
Past -ray observations (Abdo et al. 2009) suggested that W51C is an accelerator of CRs. The hypothesis is consistent with a high , as probed by in this study. Then, we quantitatively compare the diffusion distance of CRs with the size of the enhanced area of . In figure 3(b), is enhanced up to a projected distance of 15, or 17 pc. The diffusion distance () of CRs is expressed in the form of , where is the diffusion coefficient as a function of the CR energy () and magnetic field strength () and is the time after the supernova explosion. Using in Gabici et al. (2009), =100 MeV, G, and yrs (Koo et al. 1995), we estimate the diffusion distance to be
| (3) |
which is roughly consistent with the observed value of 17 pc. Hence, we conclude that the low-energy CRs accelerated in W51C spread to the diffusion distance and enhance in the region.
4.2 Estimation of with the time-dependent PDR simulation
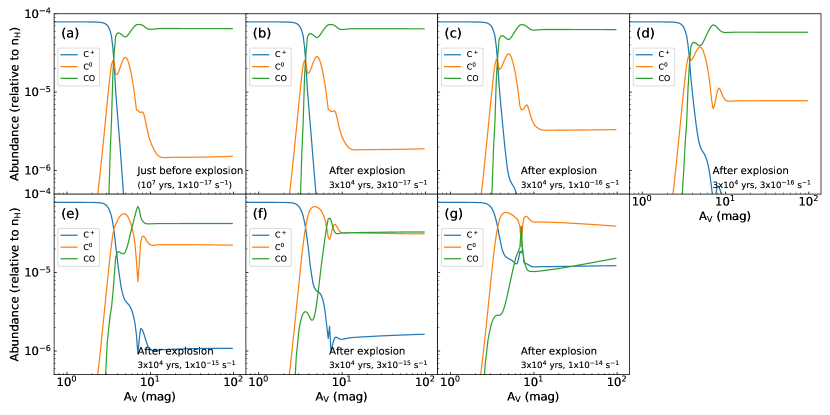
To quantitatively understand the impact of on and estimate in the vicinity of W51C, we simulate the chemical evolution in the molecular cloud (, )=(+49:09:09, 00:22:03), which shows =0.14 and 170 mag in the cloud center. We run one-dimensional plane parallel PDR models (Furuya et al. 2022), which solve the time evolution of the gas temperature and abundances of chemical species self-consistently for given gas density distribution and dust-temperature distribution, considering gas-phase and gas-grain interaction (i.e., adsorption and desorption) and heating and cooling processes. Elemental abundances are taken from Aikawa & Herbst (1999). At the initial chemical state, we assume all hydrogen is in H2, all carbon is in CO, and the remaining oxygen is in H2O ice. The other elements are assumed to exist as either atoms or atomic ions in the gas phase.
The model simulation consists of two steps. In the first step, the model simulates the temporal evolution of the gas temperature and chemical abundances for 107 yrs, assuming the standard value of s-1. The chosen timescale of 107 yrs is arbitrary, but it is long enough for the C+, C0, and CO abundances to reach the steady-state values. In the second step, the model follows the evolution for yrs with an enhanced value in a range between s-1 and s-1. The first and second steps mimic conditions just before and after the supernova explosion that generates W51C, respectively.
As input parameters for the model, we employ the UV intensity = 9200, dust temperature =26 K, and the hydrogen (H i+H2) gas density = 3103 cm-3. The UV intensity is estimated using equation (8) in Hocuk et al. (2017) with =26 K and =85 mag (i.e., half depth of a molecular cloud with =170 mag). The direct effect of the UV radiation is negligible at the cloud center because of the high . is estimated from figure 4(a). =26 K is consistent with the dust temperature in a molecular cloud achieved by the interstellar radiation field (Tielens 2005), where the main heating source of dust in a high- molecular cloud is far-IR radiation from dust in PDR. is determined by a slight optimization of the estimation in figure 4(d) to reproduce =0.04 at just before the explosion (i.e., observed at the region far from the W51C center, where enhancement of is likely unaffected. See figure 3(b).).
Figure 5 shows examples of the obtained chemical structures of the cloud just before the supernova explosion and yrs after the explosion assuming an enhanced . The main difference in the chemical structures is the abundance of C0 (and that of C+) at mag, where the interstellar UV radiation field is significantly attenuated. Higher causes a higher abundance of C0 in a cloud. The enhancement of the C0 abundance is due to the destruction of CO by He+, which in turn produces C+ and O (Bisbas et al. 2015). Hence, our simulations demonstrate that a non-negligible amount of C0 can be produced from CO and that is enhanced within yrs if is significantly enhanced after the explosion. The destruction timescale of CO by He+ () is described as follows (e.g., Furuya & Aikawa 2014);
| (4) |
where is the abundance of CO relative to H. This equation supports that an enhanced realizes the significant destruction of CO at the age of W51C.
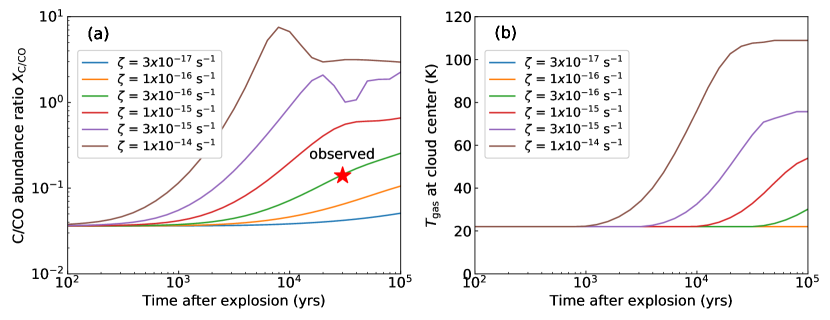
Figure 6 summarizes the obtained time-evolution curves of and at the cloud center for a set of , where is evaluated from the integrated abundance of C0 and CO from mag to 85 mag to directly compare the model predictions with observed values. Figure 6(a) shows that starts to increase 102-4 yrs after the explosion and reaches a steady state value in yrs. Longer time is necessary for lower to reach the steady state, which is consistent with equation (4). Comparing the observed with our model predictions, we estimate to be 310-16 s-1. It is notable that is not in equilibrium and is not enhanced yet at 3104 yrs in the condition of s-1. These results indicate the importance of time-dependent simulations to examine CR chemistry in SNRs. We conclude that is enhanced by a factor of 30 (i.e, from 10-17 s-1 to 310-16 s-1) by low-energy CRs accelerated in W51C.
This is the first and independent confirmation of the enhancement of , which was first reported by Ceccarelli et al. (2011) using DCO+111Ceccarelli et al. (2011) estimated to be 10-15 s-1 at “point E” (see figure 1). In our result (figure 3(a)), is 0.6 at “point E”, which corresponds to s-1. The difference of one order of magnitude may be due to the difference in the probes.. Furthermore, the enhanced near the W51C center (figure 3(a)) indicates that is enhanced not only at the single point reported in Ceccarelli et al. (2011) but also in multiple molecular clouds in the vicinity of W51C. These results demonstrate that [C i] is a powerful tool to investigate the interaction between CRs and the ISM for a wide area in the vicinity of SNRs. Recently, Tanaka et al. (2021) found an enhancement of in a surveyed region in the Galactic center, which may be associated with the SNR Sgr A East. The observed (0.66) is two times higher than the average value in the central molecular zone (0.32). They estimated to be 10-16 s-1 from C0/CO and CN/HCN abundance ratios. The present study and Tanaka et al. (2021) have advanced the understanding of the interaction between CRs and the ISM in the vicinity of SNRs. However, the number of detailed studies of CRs in the vicinity of SNRs is still limited. Further observations of [C i] in other SNRs with single-dish sub-mm telescopes or ALMA are essential for a thorough understanding of the ISM evolution in conjunction with CRs in molecular clouds.
We express many thanks to the anonymous referee for useful comments. This work is based on observations with the ASTE and Nobeyama 45-m telescopes. The ASTE telescope is operated by the National Astronomical Observatory of Japan (NAOJ). The Nobeyama 45-m telescope is operated by the Nobeyama Radio Observatory, a branch of the NAOJ. This work is partially based on archival data obtained with the Herschel Space Observatory, which is an ESA space observatory with science instruments provided by the European-led Principal Investigator consortia and with significant participation of NASA. This work is supported by JSPS KAKENHI Grant No. 19H05075, 21H01136 (HS), 20H05847, and 21H04487 (KF), and NAOJ ALMA Scientific Research Grant No. 2017-06B (MY).


Appendix A Spectra
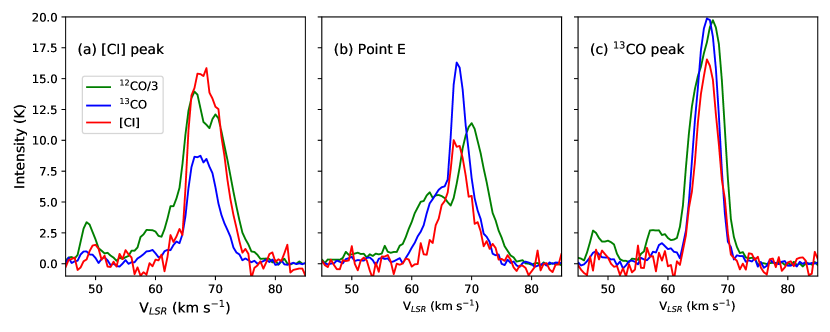
Figure 7 shows [C i], 12CO, and 13CO spectra extracted from three representative positions; the [C i] peak in figure 2(a), “point E” in Ceccarelli et al. (2011), and the 13CO(1–0) peak in figure 2(c). Velocity structures of [C i] are similar to those of 13CO, but different from those of 12CO especially in figures 7(a) and 7(b). This difference may be caused by the self-absorption of 12CO(1–0). Since (C0), (CO), and are not sensitive to (Izumi et al. 2021), underestimation of due to the self-absorption of 12CO(1–0) does not affect our discussion.
Appendix B vs.
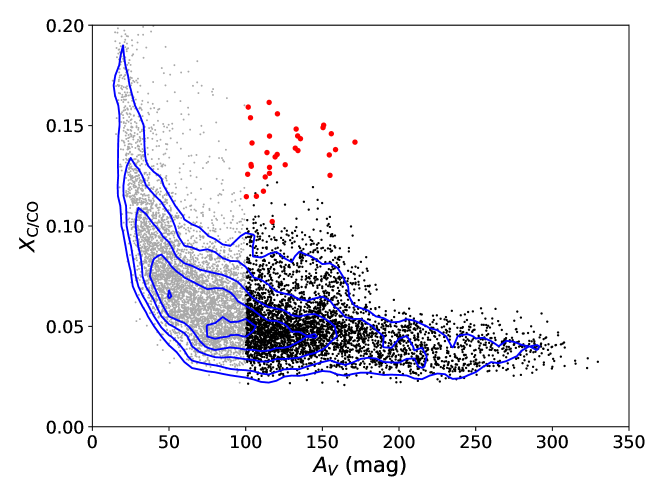
Figure 8 shows plotted against . The overall trend visualized in the blue contours indicates that higher- regions have lower as already reported in Izumi et al. (2021). The decrement of is rapid in 100 mag, while the decrement is negligible in 100 mag. This result supports that the interstellar UV radiation is shielded in 100 mag. Note that the large variation of in 100–180 mag is due to the local enhancement of near the W51C center. We confirm that the molecular cloud closest to the W51C center, which is shown in red color, has higher than other regions with similar .
References
- Abdo et al. (2009) Abdo, A. A., Ackermann, M., Ajello, M., et al. 2009, ApJ, 706, L1
- Aikawa & Herbst (1999) Aikawa, Y., & Herbst, E. 1999, ApJ, 526, 314
- Aleksić et al. (2012) Aleksić, J., Alvarez, E. A., Antonelli, L. A., et al. 2012, A&A, 541, A13
- Arikawa et al. (1999) Arikawa, Y., Tatematsu, K., Sekimoto, Y., et al. 1999, in Star Formation 1999, ed. T. Nakamoto, 88–89
- Bisbas et al. (2015) Bisbas, T. G., Papadopoulos, P. P., & Viti, S. 2015, ApJ, 803, 37
- Bisbas et al. (2017) Bisbas, T. G., van Dishoeck, E. F., Papadopoulos, P. P., et al. 2017, ApJ, 839, 90
- Ceccarelli et al. (2011) Ceccarelli, C., Hily-Blant, P., Montmerle, T., et al. 2011, ApJ, 740, L4
- Ezawa et al. (2004) Ezawa, H., Kawabe, R., Kohno, K., & Yamamoto, S. 2004, in Society of Photo-Optical Instrumentation Engineers (SPIE) Conference Series, Vol. 5489, Ground-based Telescopes, ed. J. Oschmann, Jacobus M., 763–772
- Frerking et al. (1982) Frerking, M. A., Langer, W. D., & Wilson, R. W. 1982, ApJ, 262, 590
- Furuya & Aikawa (2014) Furuya, K., & Aikawa, Y. 2014, ApJ, 790, 97
- Furuya et al. (2022) Furuya, K., Tsukagoshi, T., Qi, C., et al. 2022, ApJ, 926, 148
- Gabici et al. (2009) Gabici, S., Aharonian, F. A., & Casanova, S. 2009, MNRAS, 396, 1629
- Hocuk et al. (2017) Hocuk, S., Szűcs, L., Caselli, P., et al. 2017, A&A, 604, A58
- Iguchi & Okuda (2008) Iguchi, S., & Okuda, T. 2008, PASJ, 60, 857
- Ikeda et al. (2002) Ikeda, M., Oka, T., Tatematsu, K., Sekimoto, Y., & Yamamoto, S. 2002, ApJS, 139, 467
- Izumi et al. (2021) Izumi, N., Fukui, Y., Tachihara, K., et al. 2021, PASJ, 73, 174
- Kamegai et al. (2003) Kamegai, K., Ikeda, M., Maezawa, H., et al. 2003, ApJ, 589, 378
- Koo et al. (1995) Koo, B.-C., Kim, K.-T., & Seward, F. D. 1995, ApJ, 447, 211
- Kuno et al. (2011) Kuno, N., Takano, S., Iono, D., et al. 2011, in 2011 XXXth URSI General Assembly and Scientific Symposium, 1–4
- Massaro et al. (2015) Massaro, F., D’Abrusco, R., Landoni, M., et al. 2015, ApJS, 217, 2
- Minamidani et al. (2016) Minamidani, T., Umemoto, T., Nishimura, A., et al. 2016, in EAS Publications Series, Vol. 75, EAS Publications Series, 193–194
- Oka et al. (2001) Oka, T., Yamamoto, S., Iwata, M., et al. 2001, ApJ, 558, 176
- Okuda & Iguchi (2008) Okuda, T., & Iguchi, S. 2008, PASJ, 60, 315
- Parsons et al. (2012) Parsons, H., Thompson, M. A., Clark, J. S., & Chrysostomou, A. 2012, MNRAS, 424, 1658
- Sato et al. (2010) Sato, M., Reid, M. J., Brunthaler, A., & Menten, K. M. 2010, ApJ, 720, 1055
- Satou et al. (2008) Satou, N., Sekimoto, Y., Iizuka, Y., et al. 2008, PASJ, 60, 1199
- Shen et al. (2004) Shen, C. J., Greenberg, J. M., Schutte, W. A., & van Dishoeck, E. F. 2004, A&A, 415, 203
- Shimajiri et al. (2013) Shimajiri, Y., Sakai, T., Tsukagoshi, T., et al. 2013, ApJ, 774, L20
- Tanaka et al. (2021) Tanaka, K., Nagai, M., & Kamegai, K. 2021, ApJ, 915, 79
- Tielens (2005) Tielens, A. G. G. M. 2005, The Physics and Chemistry of the Interstellar Medium (Cambridge University Press)
- Tielens & Hollenbach (1985) Tielens, A. G. G. M., & Hollenbach, D. 1985, ApJ, 291, 722
- Vaupré et al. (2014) Vaupré, S., Hily-Blant, P., Ceccarelli, C., et al. 2014, A&A, 568, A50