What Makes ImageNet Look Unlike LAION
Abstract
ImageNet was famously created from Flickr image search results. What if we recreated ImageNet instead by searching the massive LAION dataset based on image captions alone? In this work, we carry out this counterfactual investigation. We find that the resulting ImageNet recreation, which we call LAIONet, looks distinctly unlike the original. Specifically, the intra-class similarity of images in the original ImageNet is dramatically higher than it is for LAIONet. Consequently, models trained on ImageNet perform significantly worse on LAIONet. We propose a rigorous explanation for the discrepancy in terms of a subtle, yet important, difference in two plausible causal data-generating processes for the respective datasets, that we support with systematic experimentation. In a nutshell, searching based on an image caption alone creates an information bottleneck that mitigates the selection bias otherwise present in image-based filtering. Our explanation formalizes a long-held intuition in the community that ImageNet images are stereotypical, unnatural, and overly simple representations of the class category. At the same time, it provides a simple and actionable takeaway for future dataset creation efforts.
1 Introduction
For nearly a decade, ImageNet [Deng et al., 2009] was the focal benchmark for much of computer vision and deep learning. Created from image web search results and human filtering, ImageNet contributed curated images suitable for supervised learning at the time. In recent years, however, the community has seen a new generation of models trained on massive amounts of noisy image-text data gathered from the web with minimal curation. Available to the academic public is the massive scale LAION dataset, in two versions, featuring million [Schuhmann et al., 2021] and billion [Schuhmann et al., 2022] image-text pairs, crawled from the web, and filtered by the OpenAI CLIP model [Radford et al., 2021] rather than human annotators.
At the outset, LAION works much like web image search. We can specify a query and retrieve images with high similarity, according to CLIP, between the query and the text surrounding the image on the web site that it was crawled from. We can therefore search LAION for each of the categories in the ImageNet ILSVRC-2012 dataset111Unless otherwise stated, by ImageNet we mean the ImageNet ILSVRC-2012 dataset. and retrieve images corresponding to each of the classes. This process is much like the first step of creating ImageNet from Flickr search results, except that LAION replaces Flickr, but either way, both are based on web crawls. Where the creators of ImageNet hired human annotators to filter images, we can use CLIP similarity to ensure that the resulting images have high fidelity to the class category.
We might expect that for a suitably chosen CLIP similarity threshold, the resulting dataset would bear resemblance to the original ImageNet. However, we demonstrate that this is anything but the case. The dataset, so created from LAION, very much looks unlike ImageNet. And we explain why. This explanation, although subtle, reveals a fundamental fact about the difference between ImageNet and LAION that has consequences for understanding dataset creation at large.
1.1 Our contributions
We introduce a new research artifact, called LAIONet, that aims at a recreation of ImageNet (ILSVRC-2012) on the basis of LAION. We start from LAION-400M, a collection of 400M image-text pairs extracted from web pages in Common Crawl (commoncrawl.org) between 2014 and 2021. The relevance of images and their corresponding texts was quality-controlled with OpenAI CLIP model [Radford et al., 2021], excluding images with a cosine similarity of image and text embeddings less than .
Creation of LAIONet.
We create LAIONet solely on the basis of text-based selection. We require the exact “lemmas” (terms) in a so-called “synset” of an ImageNet category to appear in the text corresponding to an image. Moreover, we require a high CLIP similarity between the text and the synset name and definition. These selection criteria are conservative in that they tend toward images that are easy to classify. Indeed, from the CLIP point of view, there is no evidence that LAIONet images are harder to classify than ImageNet. In fact, CLIP zero-shot accuracy is to percentage points higher on LAIONet than on ImageNet. Moreover, CLIP similarity of the images to their intended synsets does not significantly differ between LAIONet and ImageNet.
Contrasting LAIONet and ImageNet.
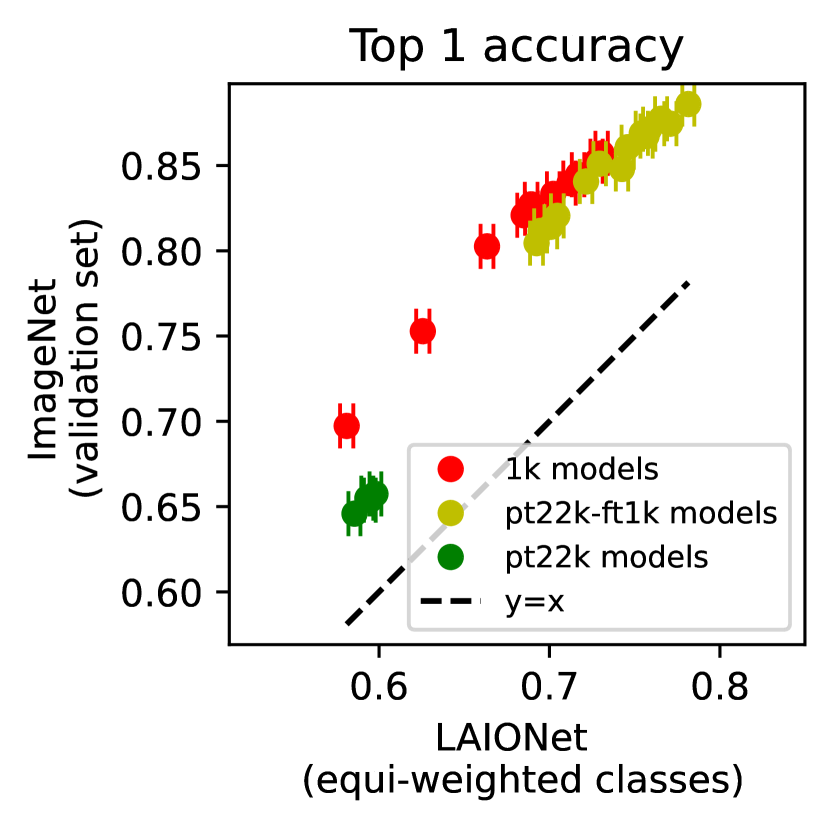
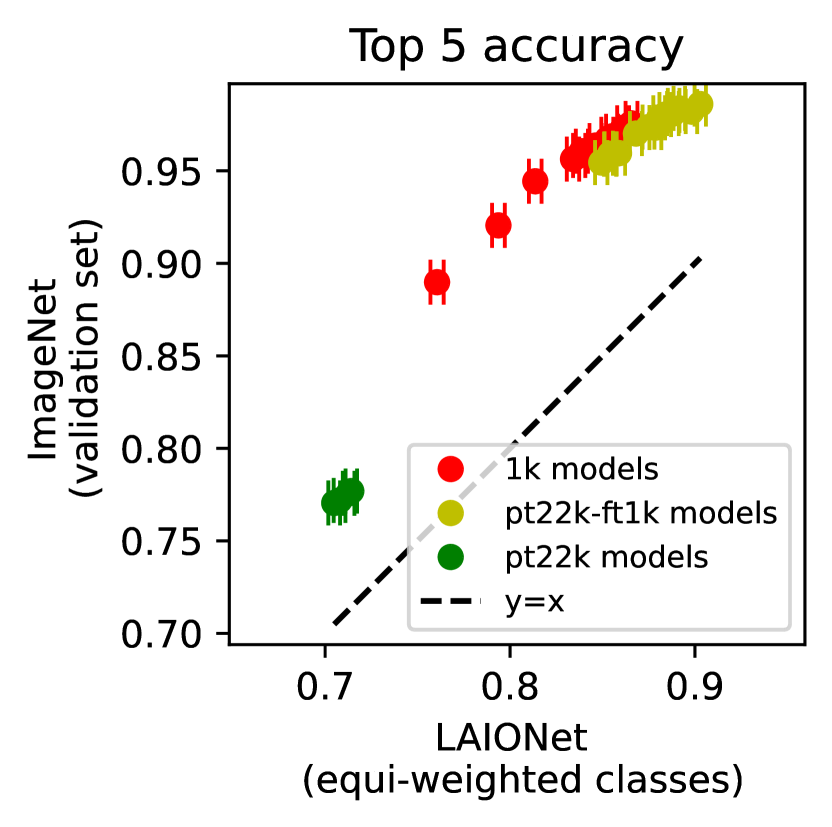
To begin to understand the differences between LAIONet and ImageNet, we evaluate a slew of Imagenet models on LAIONet. As we show, the accuracy of models trained on ImageNet drops by percentage points when evaluated on LAIONet (Figure 1). In calculating accuracy, we weight classes uniformly as is done in ImageNet. Models pre-trained on the full ImageNet with k classes prove to be slightly more robust. When classes are weighted based on the frequency of each class in LAIONet, accuracy drops by another to percentage points.
Drops in accuracy, such as these, are a well-documented phenomenon in machine learning at this point. In this work, we go a step further by providing a substantive explanation for the difference between LAIONet and ImageNet.
Diagnosing the difference.
In a first step, we observe that the intra-class similarity, measured as the pairwise similarity of the images within a class, is lower for LAIONet than for ImageNet. In other words, LAIONet images are more diverse in each class. The recall of the models is also lower in the classes with lower intra-class similarity. Hence, lower intra-class similarity gives a concrete reason for why the accuracy of ImageNet models drops on LAIONet. But why does LAIONet have lower intra-class similarity in the first place?
We answer this question in terms of two plausible causal graphs (Figure 2) for the respective data-generating processes. Both graphs are based on the standard anti-causal representation of classification problems [Schölkopf et al., 2012], whereby for each category there is a mechanism to generate data (here, image and text ) given . However, the two graphs differ in one important aspect.
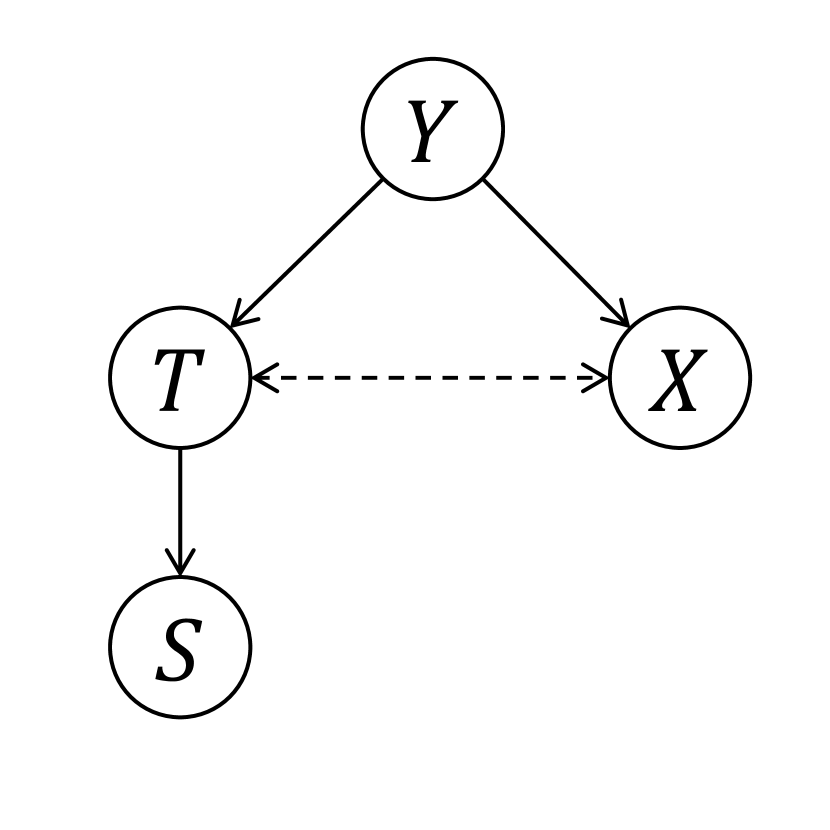
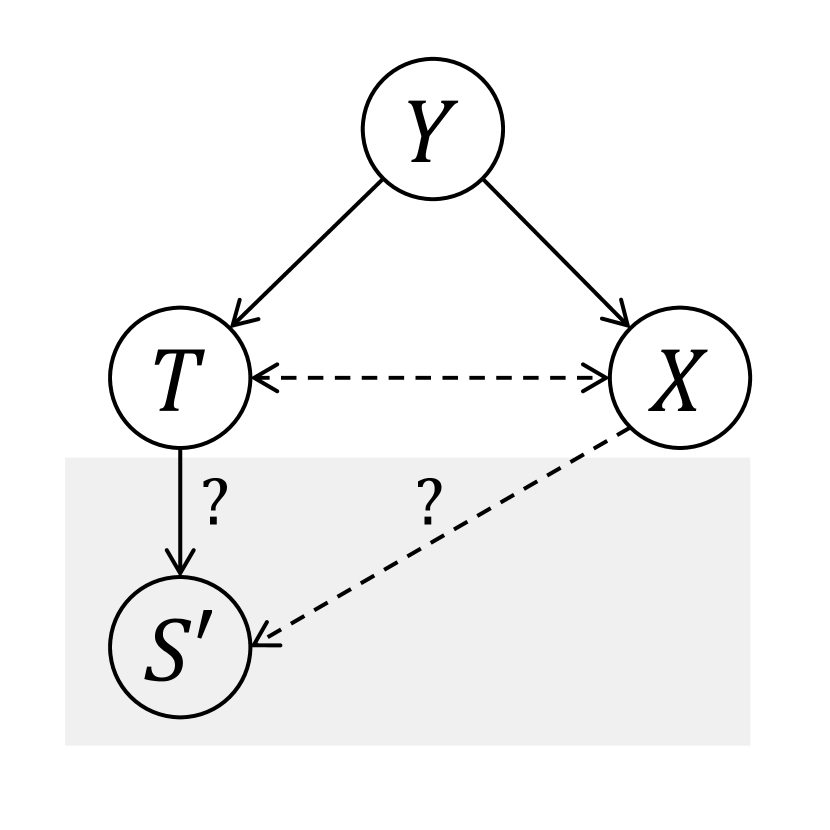
In the case of LAIONet (Figure 2(a)), selection is based on text alone. The causal graph has the important property that the distribution of the image is independent of the selection decision conditional on the text. In other words the text serves as an information bottleneck between the selection mechanism and the image. Choosing an image reveals nothing more about the image than what can be learned from its textual representation. This powerful conditional independence property limits how much selection can bias the distribution of the image. In contrast, in the case of ImageNet (Figure 2(b)), there is a link from the image to the selection decision. For example, this link exists when human annotators see the full image and decide to select or discard an image. The existence of this link is what can strongly bias the distribution of the image conditional on selection. It is this selection bias that is visible in the higher intra-class similarity.
Our case hinges on the existence and strength of the image-to-selection link in the causal graph for ImageNet. We therefore give evidence for both through three complementary arguments.
-
•
We can weaken the image-to-selection link by considering ImageNet instances of different selection frequencies. The selection frequency describes the rate at which Amazon MTurk workers selected a candidate image into the dataset within a target class. This allows us to modulate the strength of the image-to-selection link. Indeed, we find that as we decrease selection frequency, the resulting images come closer to LAIONet. This confirms our hypothesis that the link from the image to the selection is contributing significantly to the divergence between LAIONet and ImageNet.
-
•
We show that text alone cannot explain why an image was selected into ImageNet. The ImageNet-Captions dataset [Fang et al., 2022b] has restored the captions for one-third of the original ImageNet images. If the text was the only factor in determining the relevance to a synset, it should explain why the images in ImageNet-Captions are selected. Looking at the similarity between texts and their synsets, a majority of text-synset pairs exhibit high similarity, but the distribution has a heavy tail and there are instances with low similarity. For pairs with low similarity, there are often many other synsets more similar to the text. This makes these instances unlikely to have been selected solely based on their text.
-
•
We search LAION for the texts most similar to the texts from the ImageNet-Captions dataset. The resulting images show significantly higher variability (in other words, lower intra-class similarity) than ImageNet. This suggests that another mechanism, namely the image-to-selection link, must have been at play. We note the limitation that texts in the ImageNet-Captions dataset may not completely include the text available at the time of ImageNet creation. Second, for many cases, we were unable to find great matches for the ImageNet texts in LAION-M. Scaling our analysis to LAION-B might help here.
In conclusion, we argue that the image-to-selection mechanism was significantly at play in the creation of ImageNet. It is this mechanism that makes ImageNet look unlike LAION. This insight has direct prescriptive value for dataset creation efforts in general. When creating a new dataset, we should select candidate instances on the basis of an information bottleneck. A succinct text caption, for example, generally carries much less information than the entire image. Selecting on the basis of the text caption, therefore, retains much of the entropy present in the image distribution.
All code is available at: https://github.com/alishiraliGit/eval-on-laion
1.2 Related work
Recreating an ImageNet test set, called ImagenetV2, although with a different motivation, was the subject of the seminal paper by Recht, Roelofs, Schmidt, and Shankar [2019]. Engstrom et al. [2020] argue that there is a subtlety in thresholding empirical estimates of the true underlying selection frequency of an image. Our argument, however, does not rely on any specific threshold of the selection frequency. We only need to observe what happens as we vary it from small to large. In contrast to ImageNetV2, our goal is not to recreate ImageNet as closely as possible. Rather it’s the differences between ImageNet and LAION that are the focus of our investigation.
Many other works have modified ImageNet for a variety of reasons. Geirhos et al. [2019] created a stylized version of ImageNet to reduce the reliance of the trained model on texture. Xiao et al. [2021] disentangled the foreground and background of ImageNet images to show the tendency of the models to rely on the background. Li et al. [2023] proposed ImageNet-W test set by inserting a transparent watermark into the images of ImageNet validation set, revealing the reliance of the models on watermarks. ImageNet undergoes ongoing augmentation over time. For example, the ImageNet-Captions [Fang et al., 2022b] project has restored the captions of about one-third of original ImageNet images from Flickr. ImageNet-X [Idrissi et al., 2023] provides a set of human annotations pinpointing failure types for ImageNet such as pose, background, or lighting. The peculiarities of ImageNet have been the subject of multiple studies. For example, Huh et al. [2016] found the large size and many classes, including very similar classes, do not affect the successful transfer performance of ImageNet-trained features.
On the side of LAION, researchers are keenly interested in understanding the strong zero-shot accuracy of contrastive language image models, see, e.g., Vogel et al. [2022]. Fang et al. [2022a] found none of the large training set size, language supervision, and contrastive loss function determines this robustness and a more diverse training distribution should be the main cause. Our work demystifies this distributional advantage by contrasting ImageNet and LAION. Nguyen et al. [2022] compared various large image-text datasets differing in the creation process and found the robustness induced by each varies widely in different aspects, suggesting further studies of the role of dataset design. Our work highlights an important mechanism at play in dataset design that can move the dataset further away from a natural distribution.
2 LAIONet: An ImageNet out of LAION
Our starting point is to create an ImageNet-like dataset from LAION. This dataset is a research artifact intended to highlight the differences between LAION and ImageNet. Our goal is not to provide a new benchmark, or a new training set.
To start, recall that every ImageNet class corresponds to a WordNet [Miller, 1998] synset. Every synset consists of some so-called lemmas. Synsets also come with a short definition known as gloss. We label an instance from LAION with a WordNet synset if 1) at least one lemma from the synset exists in the text of the instance, and 2) the text of the instance is sufficiently similar to the name and definition of the synset.
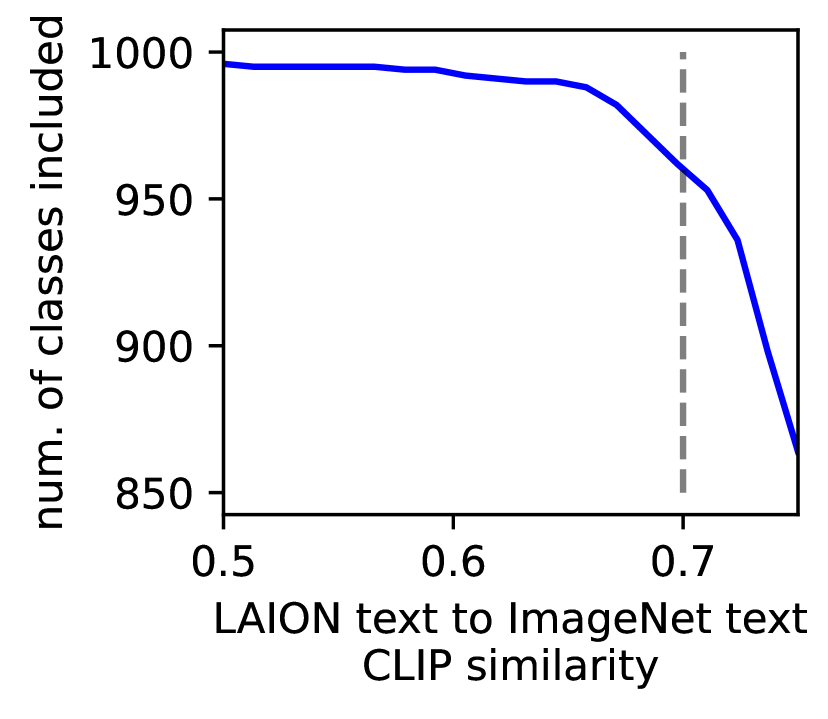
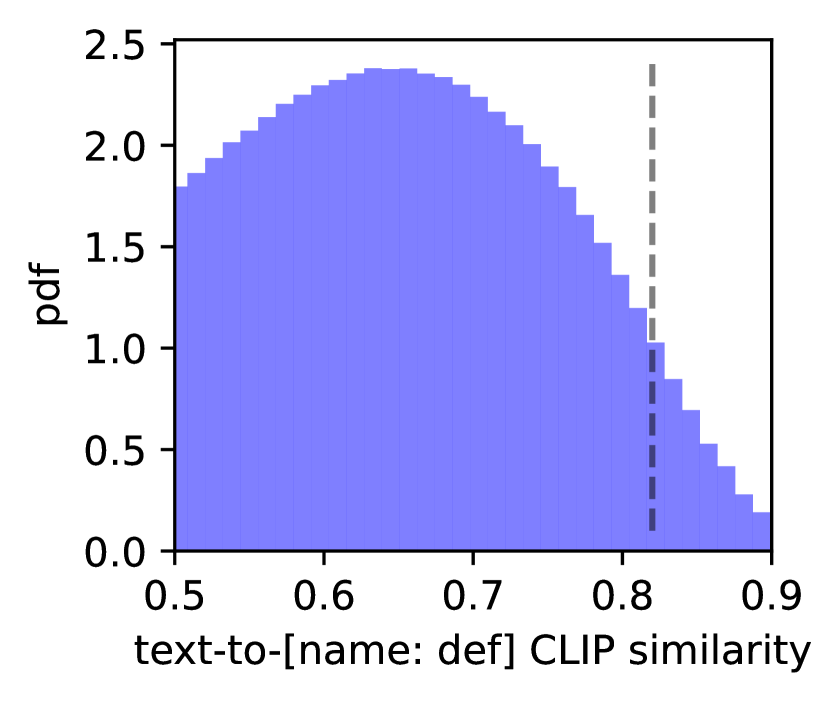
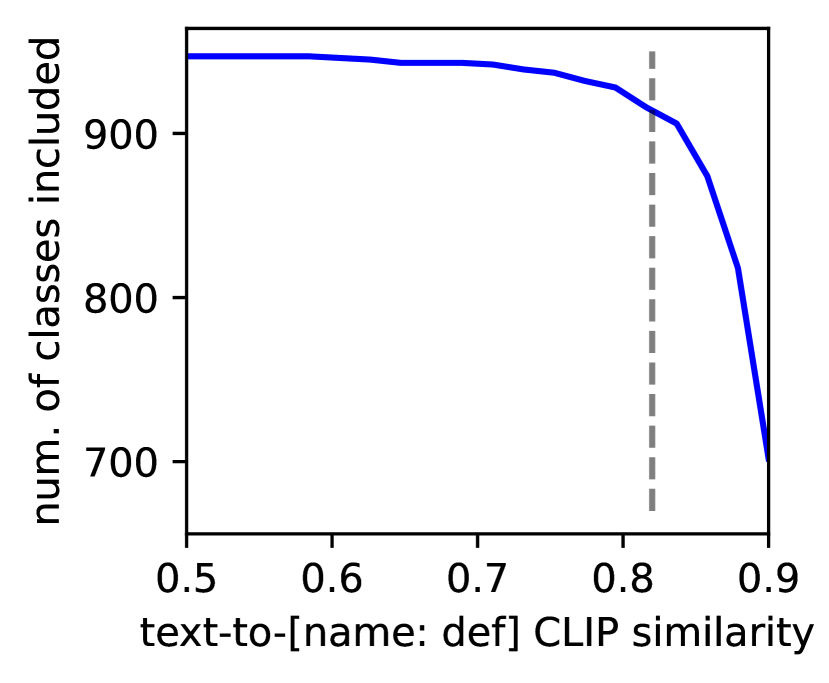
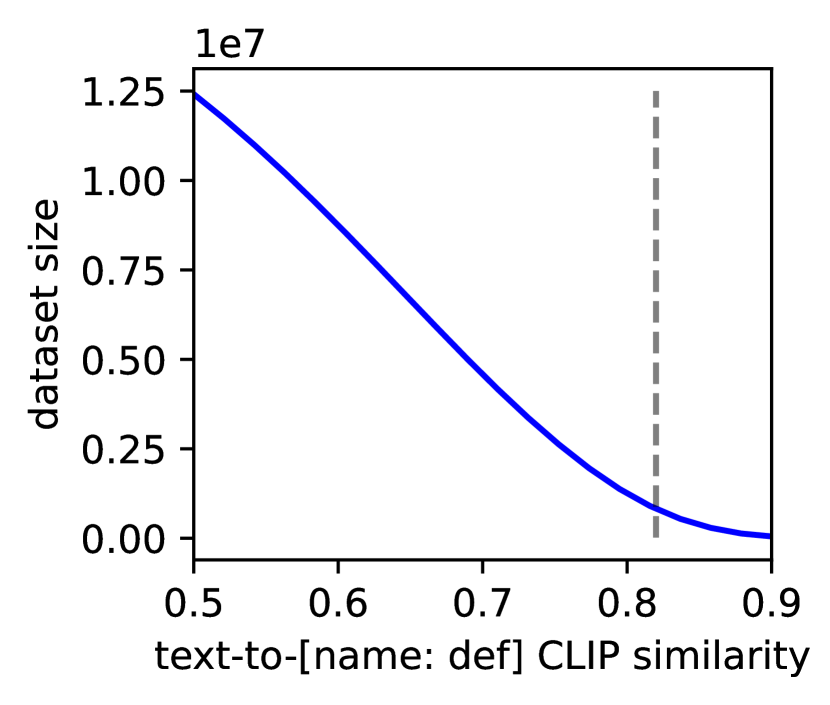
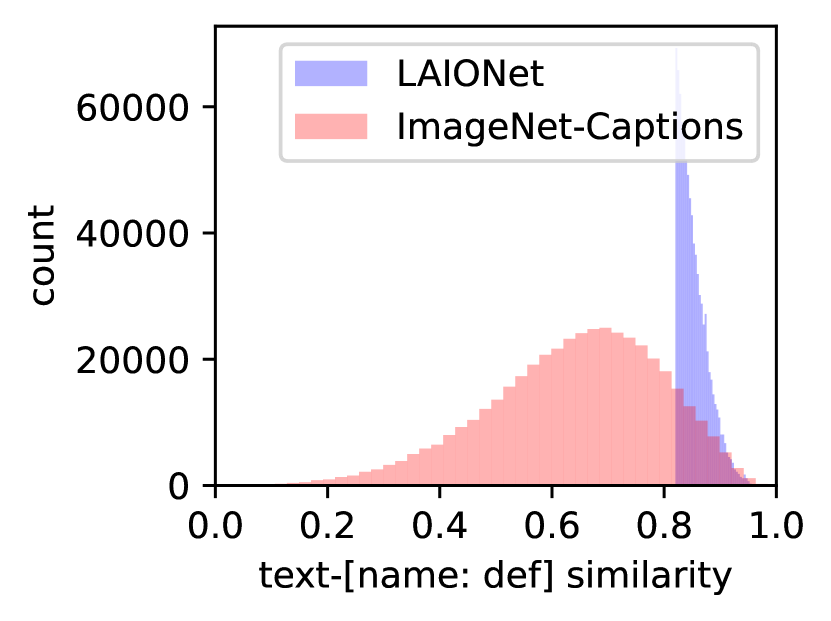
Out of LAION M samples, M of them passed the first condition. The second condition ensures the lemma as found in the LAION sample has the intended meaning. To quantify the similarity of the LAION text and a synset, we first create a textual representation for the synset by concatenating its name and definition (to be called the synset text). We then calculate the embedding vectors for both the synset text and LAION text using CLIP and compute their cosine similarity. Figure 3(a) illustrates the distribution of these similarities. We drop the samples below a certain level of similarity and next explain how to determine this threshold.
In general, a high value for textual similarity ensures the LAION text is describing the same object as the synset. But as Figure 3(b) shows, we cannot set a very high similarity threshold since the extracted dataset will lose its coverage over the ImageNet’s k classes. We found the threshold of the highest reasonable choice as it allowed for covering most classes while going beyond it sharply reduced the number of covered classes (Figure 3(b)) with no significant reduction in the dataset size (Figure 3(c)). Furthermore, in Section 4 (Figure 9(b)), using the restored captions of ImageNet, we show a textual similarity of above is sufficient to ensure a sample belongs uniquely to the synset. This finding supports the conservative nature of our threshold at . Look at Appendix A for an example of when the second step of filtering is necessary and why our chosen threshold is conservative.
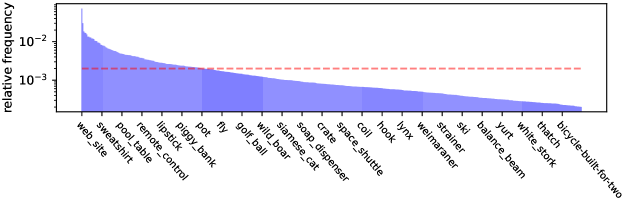
From the samples that passed the two conditions, we dropped ones with more than one label to simplify future evaluation on the dataset. We also dropped images tagged as not-safe-for-work. The final dataset, which we call LAIONet, consists of k samples from ImageNet classes, sufficiently large for fine-grained evaluation purposes at statistical significance. Unlike ImageNet which provides about the same number of images per class, the number of samples in LAIONet reflects the natural distribution of each class. As Figure 4 shows, there is large variation in the relative frequency of the classes in LAIONet. Later we will use these frequencies to compare the performance of models in frequent and infrequent classes.
Are LAIONet images harder to classify? To find out, we compare CLIP zero-shot accuracy on LAIONet and ImageNet. For every image, we predict the label of the image based on what synset has the highest cosine similarity between the image embedding and the synset text embedding. To make accuracy estimates on LAIONet comparable with ImageNet, we calculate accuracy as the average recall across classes, similar to the setup of ImageNet validation set with images per class. We found CLIP has a zero-shot top and top accuracy of and on LAIONet while these numbers are and respectively, for ImageNet. Hence, at least from the CLIP view, LAIONet images are not harder to classify. But note that the CLIP text embeddings are jointly trained with the image embeddings, possibly giving CLIP an advantage on LAIONet. Appendix B provides a more detailed analysis by assessing CLIP zero-shot recall for each class, revealing that there are a greater number of classes in which CLIP performs better on LAIONet compared to ImageNet. In addition, as a more direct assessment of the degree of difficulty involved in identifying an intended object in LAIONet, we directly calculated the similarity of an image to its associated synset using CLIP image and text embeddings. We found no evidence that image-to-synset similarity is higher in ImageNet. Look at Appendix C for the details of the analysis.
3 LAIONet versus ImageNet
We begin to understand the differences between the two datasets by looking at the accuracy of various ImageNet classifiers on LAIONet. After observing a significant accuracy drop, we consider the disparity in intra-class diversity as a possible explanation.
3.1 Comparing accuracy
We consider four model families: ResNet [He et al., 2016], Vision Transformers (ViT) [Dosovitskiy et al., 2021], modernized ConveNet (ConvNeXt) [Liu et al., 2022], and Bidirectional Encoder representation from Image Transformers (BEiT) [Bao et al., 2022]. All models are trained on ImageNet without extra training data. We use various versions of each model in terms of the size (small, base, large, etc.), image resolution (x or x), patch resolution (x or x), and whether models are pre-trained on the complete ImageNet with k classes or not. All models come from HuggingFace (huggingface.co) checkpoints. On a single GPU, the results can be reproduced in less than a day using the accompanying code.
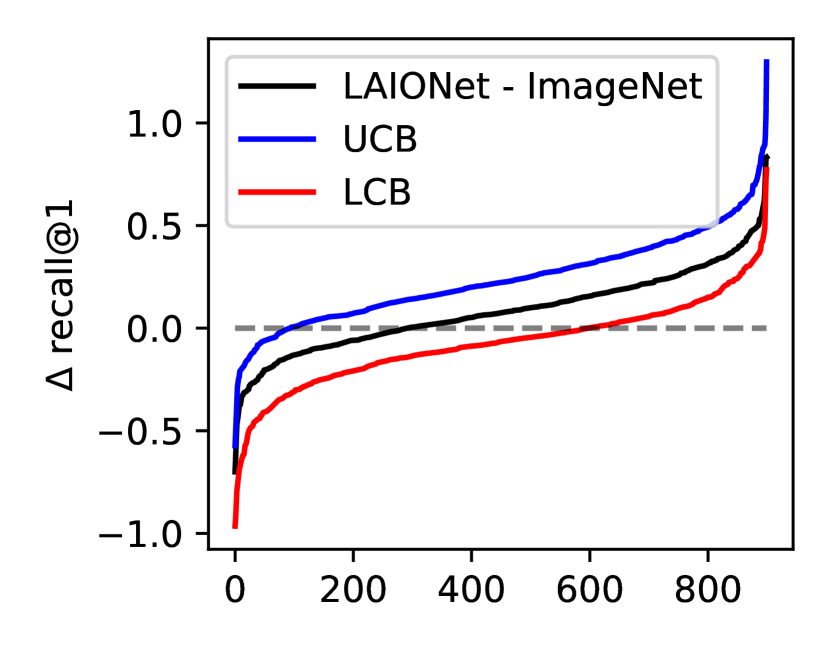
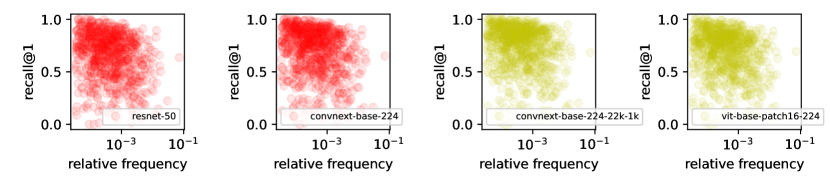
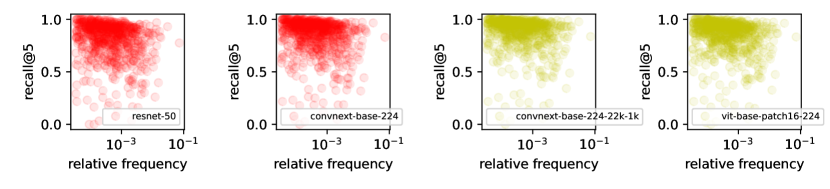
We first compare the (equally weighted) accuracy defined by the average of recalls across the classes covered by LAIONet. Figure 1 compares the top and top accuracy on ImageNet and LAIONet. In most of the highly accurate models, accuracy drops by percentage points when estimated on LAIONet with models pre-trained on ImageNet-k showing slightly more robustness.
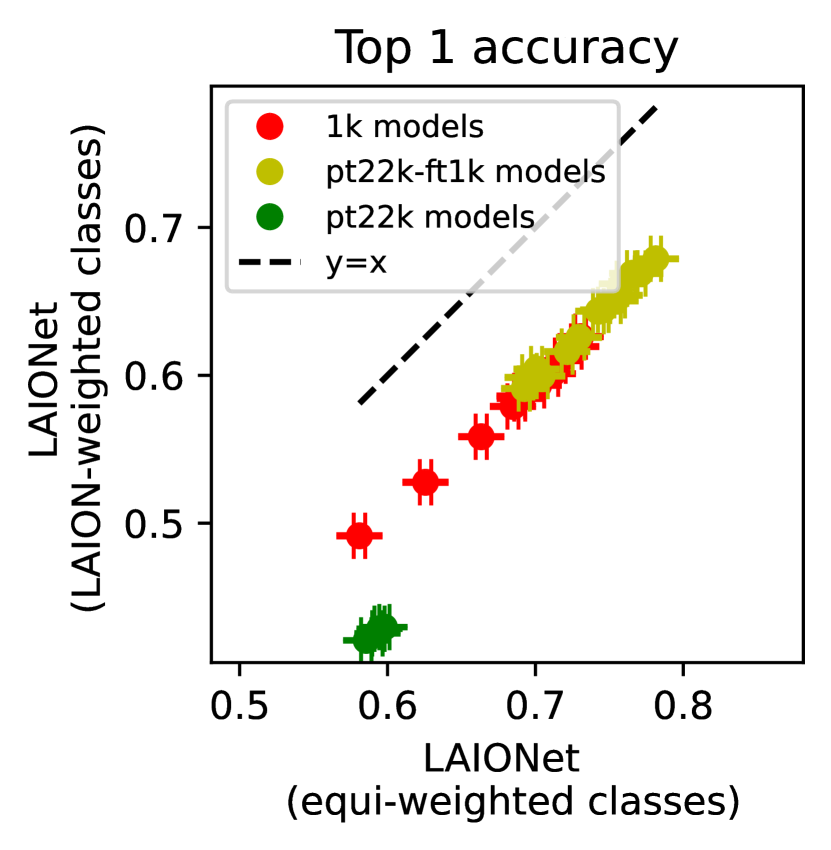
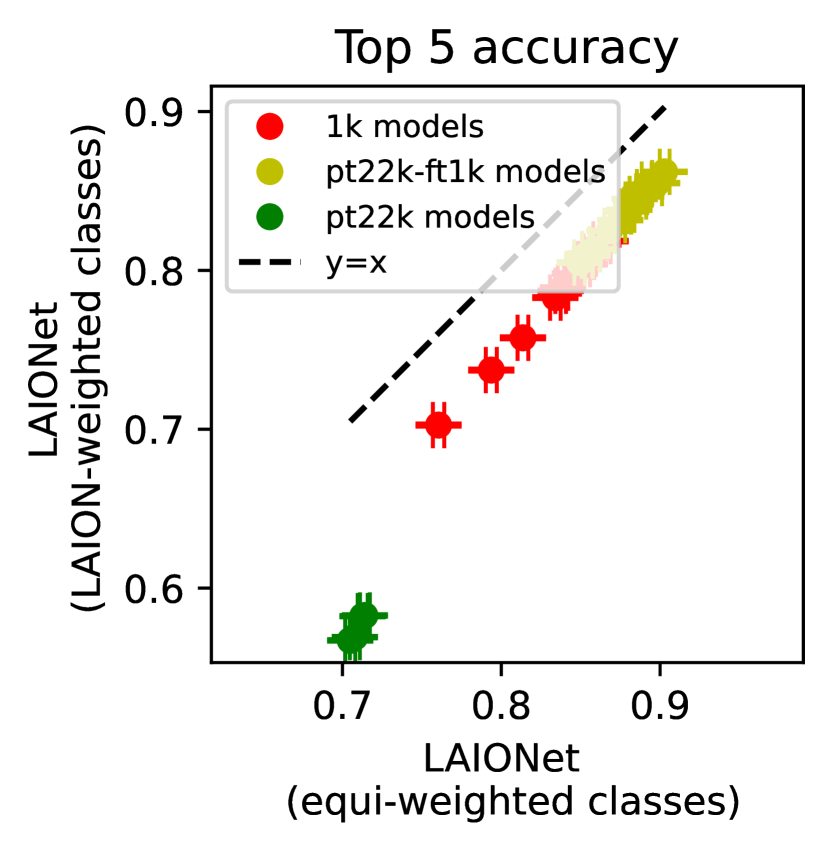
Next, we weigh each class according to how frequent it is in LAIONet. We use these relative frequencies to weight recalls in each class and obtain a LAION-weighted accuracy. Figure 5 compares LAION-weighted and equally-weighted accuracy evaluated on LAIONet. The LAION-weighted accuracy is consistently lower by to percentage points. This suggests that ImageNet-trained models are performing worse when the class is describing a more common object. For further direct evidence of this claim, look at Appendix D.1.
3.2 Comparing intra-class similarity
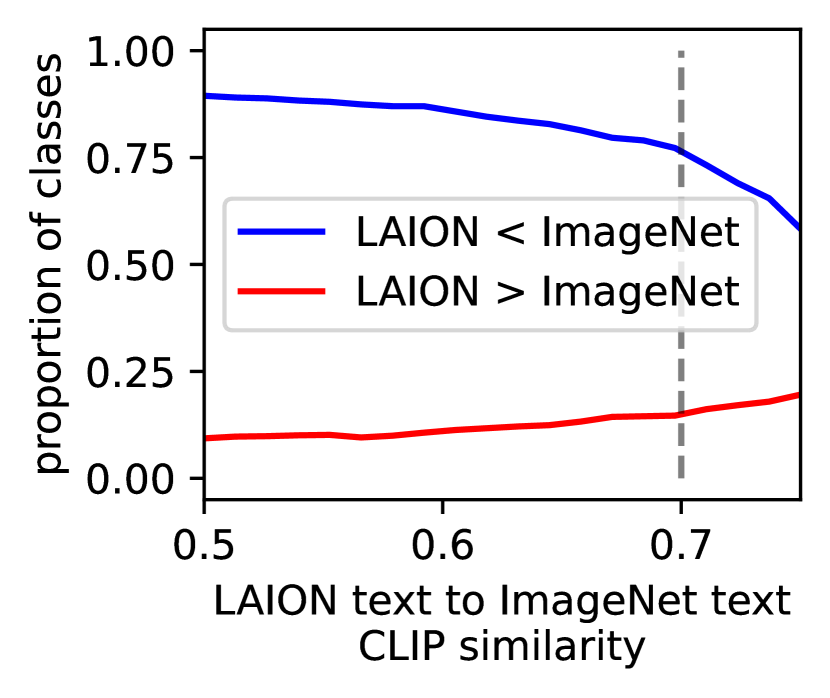
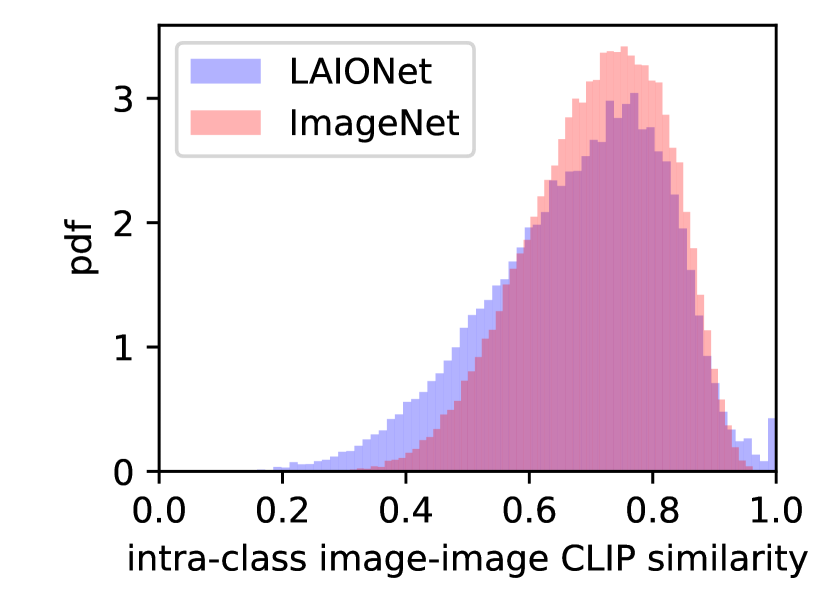
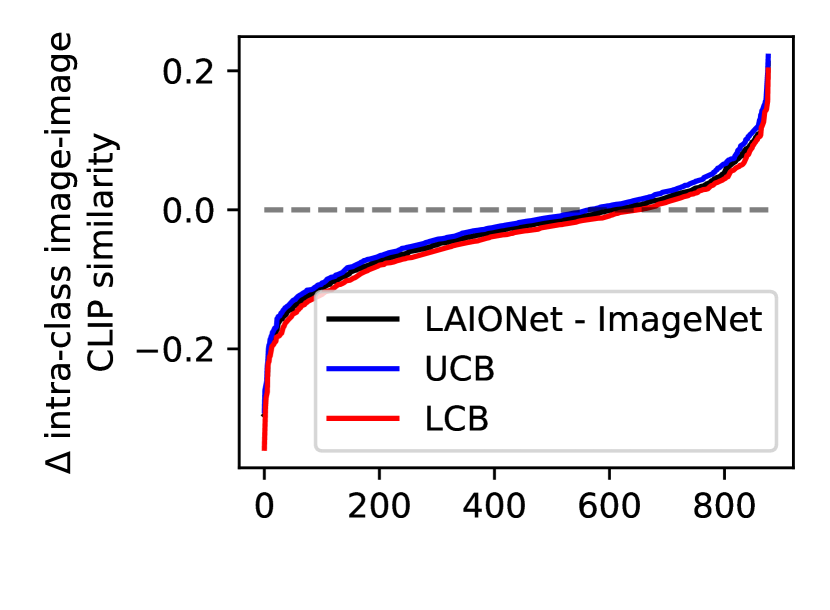
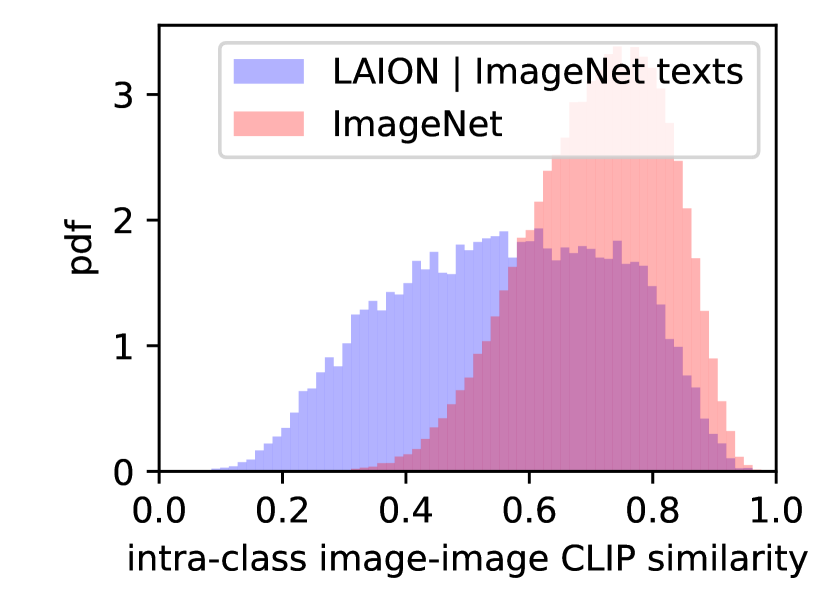
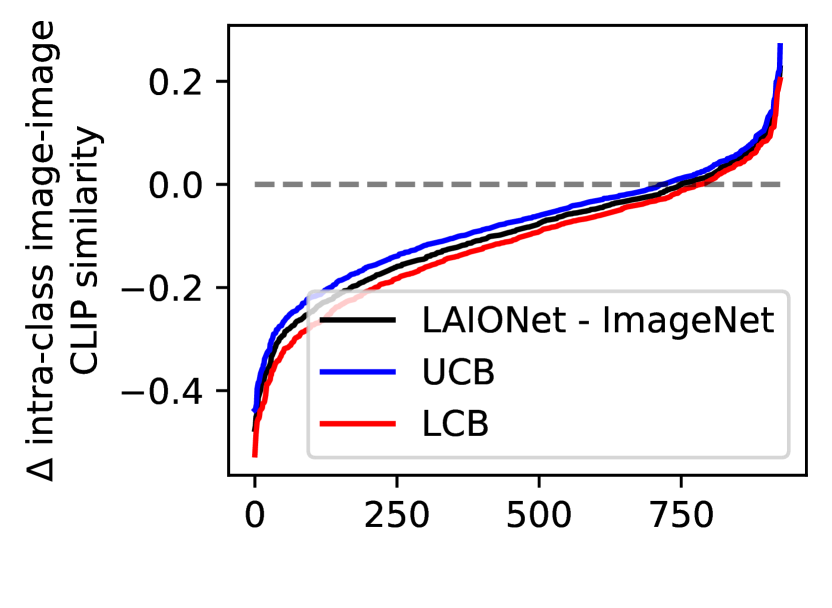
While LAIONet images are in a precise sense not more difficult than ImageNet (Section 2), there is another factor that can explain the accuracy drop: the intra-class similarity of images. We define this similarity as the pairwise similarity of the images from the same class, measured by the cosine similarity of their CLIP image embeddings. The lower these similarity values, the more diverse the images from that class. Figure 6(a) shows the distribution of intra-class similarities aggregated over all the classes. To make the distributions comparable, we sampled (with replacement) the similarities from LAIONet to match ImageNet. The left tail of the LAIONet intra-class similarity distribution makes it clear that LAIONet overall provides a more diverse set of images. To observe the effect in greater detail, for each class, Figure 6(b) shows the average intra-class similarity of LAIONet images subtracted by the average intra-class similarity of ImageNet images from the same class. In almost two-thirds of the classes, LAIONet has significantly lower intra-class similarity. This provides further evidence that LAIONet images exhibit greater variability within each class.
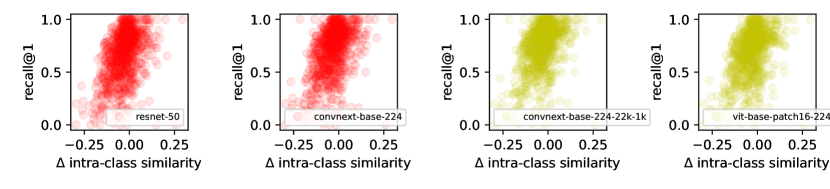
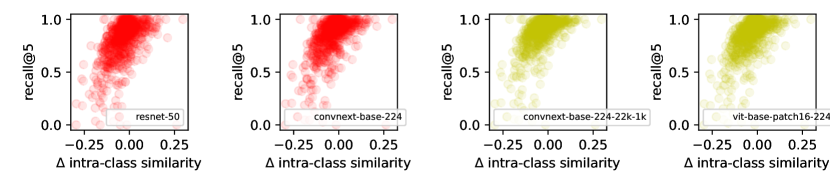
Looking for the lost accuracy, Figure 7 demonstrates in the classes where LAIONet is more diverse than ImageNet, indicated by lower intra-class similarity, models perform poorly as measured by their recall rates. Together with our observation that LAIONet exhibits lower overall intra-class similarity, these findings support our argument that the difference in intra-class similarity is a significant factor contributing to the decrease in equally-weighted accuracy. In Appendix D.2, we also show a weak correlation between the class frequency and the intra-class similarity, partially explaining why models have low LAION-weighted accuracy.
4 Diagnosing ImageNet
As is standard modeling practice, we think of a data generating process that for a given class generates a pair of image and text . Ideally, when we search for images of a particular class , we would like to draw samples from distribution . Unless we have access to the generative process or we have a completely random set of images all correctly labeled, drawing samples directly from , however, will not be possible. In particular, none of these options are available when researchers collect a new dataset. Instead, researchers have to define a selection mechanism for choosing images. What we observe is the conditional distribution of given
In creating LAIONet, we relied on texts to select the samples. LAIONet images follow , where if is sufficiently similar to (Figure 2(a)). With our conservative selection criteria, we can assume every passed our similarity threshold is generated from the intended . Therefore, . Generally, an image carries much more information than the text. So, for the images of a certain class, conditioning on the text alone should not alter the distribution significantly. Intuitively speaking, . In our setting, a weaker independence is sufficient to show LAIONet images follow the desired distribution. Even if information from beyond is present in , since we deliberately refrained from searching for visual descriptions in the text, we expect to be independent from for a given . Therefore, we have reason to hope .
In general, a selection can rely on both text and image (Figure 2(b)) directly. In this case, the distribution of observed images can be far from the desired distribution . We believe this has happened in the collection of ImageNet, primarily through human annotators examining and acting on images. Incorporation of visual features at the side of the search engine provider is another plausible mechanism. While we may not be able to pinpoint the exact mechanism at play, we next demonstrate through three experiments that there is a strong link between the image and the selection criterion in the creation of ImageNet.
4.1 Weakening the image-to-selection link makes ImageNet more like LAIONet
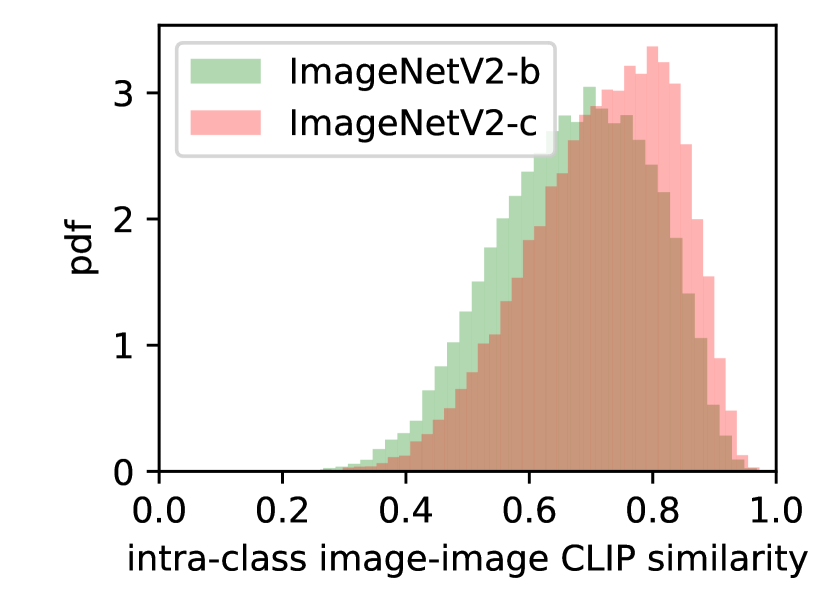
Image annotation is one clear mechanism by which the image influences selection . Changing the strictness of annotation allows us to modulate the strength of this mechanism and measure its effect. This experiment is possible due to the availability of ImageNetV2 [Recht et al., 2019] that comes with three different versions. The three versions of ImageNetV2, called a, b, and c, differ in the level of agreement among annotators. More precisely, each image comes with a MTurk selection frequency which is what fraction of MTurk workers selected the image to be from the target class. ImageNetV2 versions a, b, and c have an average MTurk selection frequency of , , and , respectively. Note that version b has the lowest and version c has the highest selection frequency.
We first observe that allowing for more disagreement among annotators results in the inclusion of more diverse images. Figure 8(a) shows the distribution of intra-class similarity for ImageNetV2 versions b and c. One can see that in version b with the lowest average MTurk selection frequency, the intra-class similarity is shifted toward lower values.
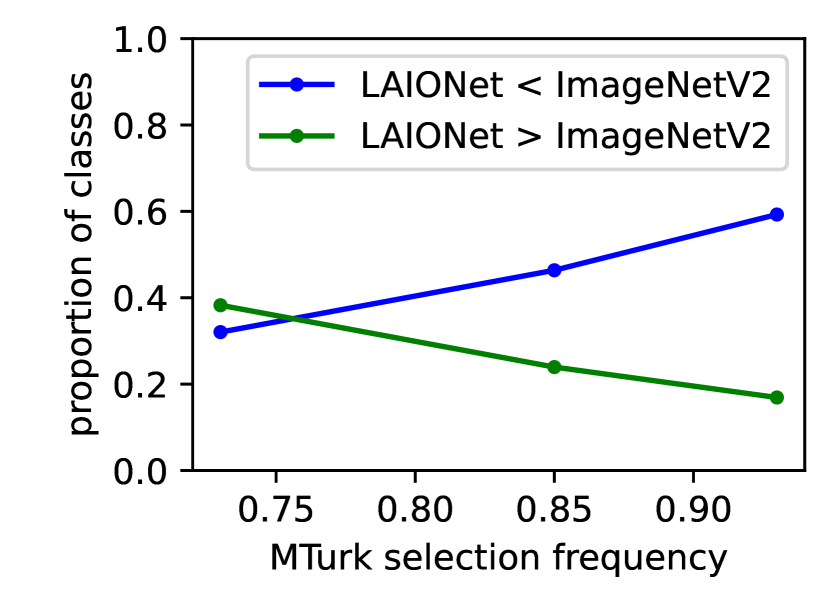
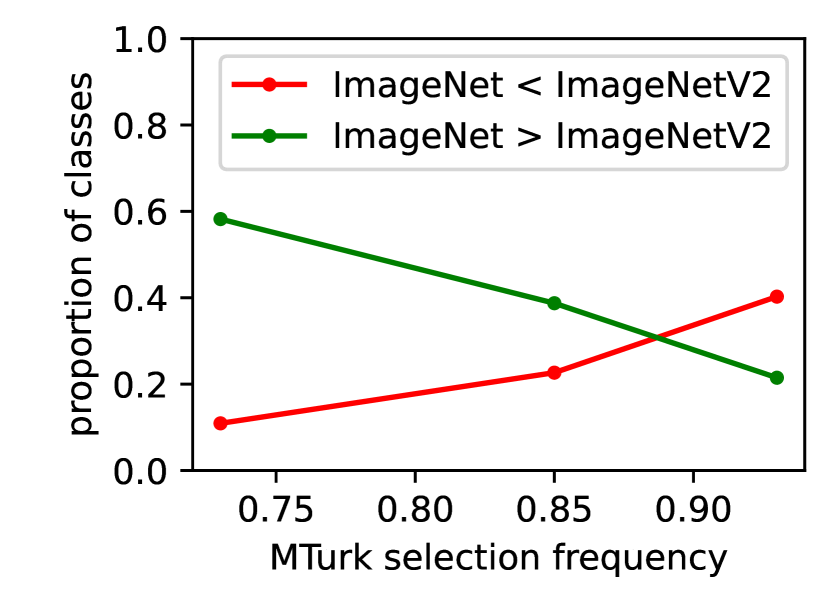
We further show as the average MTurk selection frequency increases, ImageNetV2 becomes more similar to ImageNet and less similar to LAIONet. In this regard, to compare two datasets, we count the number of classes in which the first dataset has significantly lower intra-class similarity than the second dataset, and vice versa. Figure 8(b) compares LAIONet and three versions of ImageNetV2. As the figure suggests, LAIONet and ImageNetV2 are quite similar when the average MTurk selection frequency is low (ImageNetV2 version b) but as the MTurk selection frequency increases, ImageNetV2 shows higher intra-class similarity than LAIONet. At the same time, Figure 8(c) shows ImageNetV2 becomes more similar to ImageNet as we increase the MTurk selection frequency. These observations show the impact the image has on the selection, particularly during annotation, is significant and can partially explain the divergence between LAIONet and ImageNet.
4.2 Text alone cannot explain why an image is selected into ImageNet
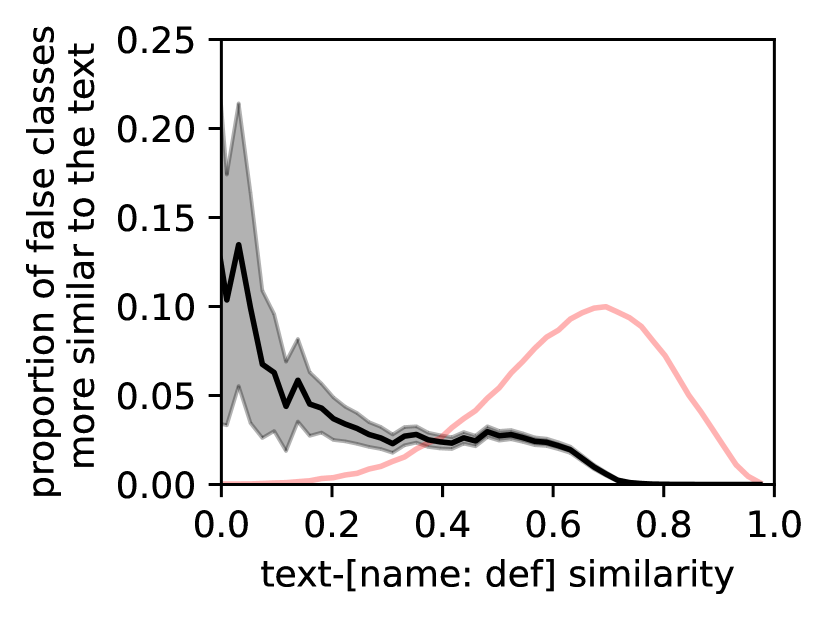
ImageNet-Captions [Fang et al., 2022b] is a subset of ImageNet-k training data with restored title, description, and tags from Flickr. We assume the samples in ImageNet-Captions are a random subset of the original ImageNet and the captions are accurately restored. If there was no link , the accompanying caption of an image in ImageNet-Captions should be able to explain why this image is selected. We follow Fang et al. [2022b] and define the text as the title, description, and tags concatenated. Figure 9(a) illustrates the similarity between the texts and their respective synsets using CLIP text embeddings. Although most of the texts have a high similarity of or above to their synsets, the distribution has a heavy left tail with very low similarities. The fact that a text has low similarity to the intended synset does not necessarily mean it could not be chosen by the search engine. We further show many of the texts that have low similarity to the intended synsets actually have high similarity to numerous other synsets, making them less likely to have appeared for the intended meaning. For every text, we find the similarity to all synsets, i.e. the similarity to their names and definitions, and count the proportion of unintended synsets (false classes) which are more similar to the text than the intended synset. A low value for this proportion shows the text well represents its intended synset whereas a significant non-zero value indicates that there are considerable other synsets that are more strongly present in the text. As Figure 9(b) demonstrates, for a text with low similarity to its synset there are on average (equivalently, ) or even more other synsets more similar to the text. These observations show that at least based on the restored texts in ImageNet-Captions, the text alone cannot fully explain why an image is selected and another mechanism should have been at play.
4.3 ImageNet, had it been created solely searching texts, does not resemble current ImageNet
If the link from to did not exist, regardless of how the selection algorithms works, would look similar in both graphs of Figure 2. To test this hypothesis, we extract a new dataset from LAION. For every image in ImageNet with corresponding text in ImageNet-Captions, we find the LAION sample with the most similar text to measured by CLIP textual similarity. We only keep a LAION sample if the similarity is above . This choice ensures the two texts are sufficiently similar as we can consider them roughly the same while the dataset covers more than of the ImageNet classes. We provide further analysis of this choice in Appendix E.
As Figure 10(a) suggests, images in the new dataset have a significantly lower intra-class similarity. In other words, the natural images extracted from LAION based on ImageNet texts show a higher intra-class variation than the original ImageNet. Looking at each class separately, Figure 10(b) shows in almost of the classes, the images from the new dataset are significantly more diverse (have lower intra-class similarity). These observations reject the hypothesis that the graphs of Figure 2 have the same structure and show a potential leak from the image to the selection.
5 Conclusion
In conclusion, we argue that the image-to-selection mechanism played a significant role in the creation of ImageNet, distinguishing it from LAION. We demonstrated this through three experiments. First, we modulated the speculated link from image to selection, showing the significant contribution this mechanism has in reducing the diversity of the selected images. The next two experiments rejected the hypothesis that image plays no or negligible role in the selection by showing ImageNet captions cannot solely explain the selection.
This insight carries valuable implications for dataset creation efforts in general. When developing a new dataset, we advise selecting candidate instances based on an information bottleneck, like a succinct textual description of the instance, rather than the full instance. This will mitigate the selection bias that may otherwise distort the distribution of data conditional on selection.
Acknowledgments
This project originated from formative research conversations with Rediet Abebe. We thank Ludwig Schmidt for valuable comments and suggestions.
References
- Bao et al. [2022] H. Bao, L. Dong, S. Piao, and F. Wei. BEit: BERT pre-training of image transformers. In International Conference on Learning Representations, 2022. URL https://openreview.net/forum?id=p-BhZSz59o4.
- Deng et al. [2009] J. Deng, W. Dong, R. Socher, L.-J. Li, K. Li, and L. Fei-Fei. Imagenet: A large-scale hierarchical image database. In 2009 IEEE conference on computer vision and pattern recognition, pages 248–255. Ieee, 2009.
- Dosovitskiy et al. [2021] A. Dosovitskiy, L. Beyer, A. Kolesnikov, D. Weissenborn, X. Zhai, T. Unterthiner, M. Dehghani, M. Minderer, G. Heigold, S. Gelly, J. Uszkoreit, and N. Houlsby. An image is worth 16x16 words: Transformers for image recognition at scale. In International Conference on Learning Representations, 2021. URL https://openreview.net/forum?id=YicbFdNTTy.
- Engstrom et al. [2020] L. Engstrom, A. Ilyas, S. Santurkar, D. Tsipras, J. Steinhardt, and A. Madry. Identifying statistical bias in dataset replication. In International Conference on Machine Learning, pages 2922–2932. PMLR, 2020.
- Fang et al. [2022a] A. Fang, G. Ilharco, M. Wortsman, Y. Wan, V. Shankar, A. Dave, and L. Schmidt. Data determines distributional robustness in contrastive language image pre-training (clip). In International Conference on Machine Learning, pages 6216–6234. PMLR, 2022a.
- Fang et al. [2022b] A. Fang, G. Ilharco, M. Wortsman, Y. Wan, V. Shankar, A. Dave, and L. Schmidt. Data determines distributional robustness in contrastive language image pre-training (clip). In International Conference on Machine Learning, pages 6216–6234. PMLR, 2022b.
- Geirhos et al. [2019] R. Geirhos, P. Rubisch, C. Michaelis, M. Bethge, F. A. Wichmann, and W. Brendel. Imagenet-trained CNNs are biased towards texture; increasing shape bias improves accuracy and robustness. In International Conference on Learning Representations, 2019. URL https://openreview.net/forum?id=Bygh9j09KX.
- He et al. [2016] K. He, X. Zhang, S. Ren, and J. Sun. Deep residual learning for image recognition. In Proceedings of the IEEE conference on computer vision and pattern recognition, pages 770–778, 2016.
- Huh et al. [2016] M. Huh, P. Agrawal, and A. A. Efros. What makes imagenet good for transfer learning? arXiv preprint arXiv:1608.08614, 2016.
- Idrissi et al. [2023] B. Y. Idrissi, D. Bouchacourt, R. Balestriero, I. Evtimov, C. Hazirbas, N. Ballas, P. Vincent, M. Drozdzal, D. Lopez-Paz, and M. Ibrahim. Imagenet-x: Understanding model mistakes with factor of variation annotations. In The Eleventh International Conference on Learning Representations, 2023. URL https://openreview.net/forum?id=HXz7Vcm3VgM.
- Li et al. [2023] Z. Li, I. Evtimov, A. Gordo, C. Hazirbas, T. Hassner, C. C. Ferrer, C. Xu, and M. Ibrahim. A whac-a-mole dilemma: Shortcuts come in multiples where mitigating one amplifies others. In Proceedings of the IEEE/CVF Conference on Computer Vision and Pattern Recognition, pages 20071–20082, 2023.
- Liu et al. [2022] Z. Liu, H. Mao, C.-Y. Wu, C. Feichtenhofer, T. Darrell, and S. Xie. A convnet for the 2020s. In Proceedings of the IEEE/CVF Conference on Computer Vision and Pattern Recognition, pages 11976–11986, 2022.
- Miller [1998] G. A. Miller. WordNet: An electronic lexical database. MIT press, 1998.
- Nguyen et al. [2022] T. Nguyen, G. Ilharco, M. Wortsman, S. Oh, and L. Schmidt. Quality not quantity: On the interaction between dataset design and robustness of CLIP. In A. H. Oh, A. Agarwal, D. Belgrave, and K. Cho, editors, Advances in Neural Information Processing Systems, 2022. URL https://openreview.net/forum?id=LTCBavFWp5C.
- Radford et al. [2021] A. Radford, J. W. Kim, C. Hallacy, A. Ramesh, G. Goh, S. Agarwal, G. Sastry, A. Askell, P. Mishkin, J. Clark, et al. Learning transferable visual models from natural language supervision. In International conference on machine learning, pages 8748–8763. PMLR, 2021.
- Recht et al. [2019] B. Recht, R. Roelofs, L. Schmidt, and V. Shankar. Do imagenet classifiers generalize to imagenet? In International conference on machine learning, pages 5389–5400. PMLR, 2019.
- Schölkopf et al. [2012] B. Schölkopf, D. Janzing, J. Peters, E. Sgouritsa, K. Zhang, and J. Mooij. On causal and anticausal learning. In International Coference on International Conference on Machine Learning, page 459–466, 2012.
- Schuhmann et al. [2021] C. Schuhmann, R. Vencu, R. Beaumont, R. Kaczmarczyk, C. Mullis, A. Katta, T. Coombes, J. Jitsev, and A. Komatsuzaki. Laion-400m: Open dataset of clip-filtered 400 million image-text pairs. arXiv preprint arXiv:2111.02114, 2021.
- Schuhmann et al. [2022] C. Schuhmann, R. Beaumont, R. Vencu, C. W. Gordon, R. Wightman, M. Cherti, T. Coombes, A. Katta, C. Mullis, M. Wortsman, P. Schramowski, S. R. Kundurthy, K. Crowson, L. Schmidt, R. Kaczmarczyk, and J. Jitsev. LAION-5b: An open large-scale dataset for training next generation image-text models. In Thirty-sixth Conference on Neural Information Processing Systems Datasets and Benchmarks Track, 2022. URL https://openreview.net/forum?id=M3Y74vmsMcY.
- Vogel et al. [2022] F. Vogel, N. Shvetsova, L. Karlinsky, and H. Kuehne. Vl-taboo: An analysis of attribute-based zero-shot capabilities of vision-language models. CoRR, abs/2209.06103, 2022. URL https://doi.org/10.48550/arXiv.2209.06103.
- Xiao et al. [2021] K. Y. Xiao, L. Engstrom, A. Ilyas, and A. Madry. Noise or signal: The role of image backgrounds in object recognition. In International Conference on Learning Representations, 2021. URL https://openreview.net/forum?id=gl3D-xY7wLq.
Appendix A Further inspection of LAIONet
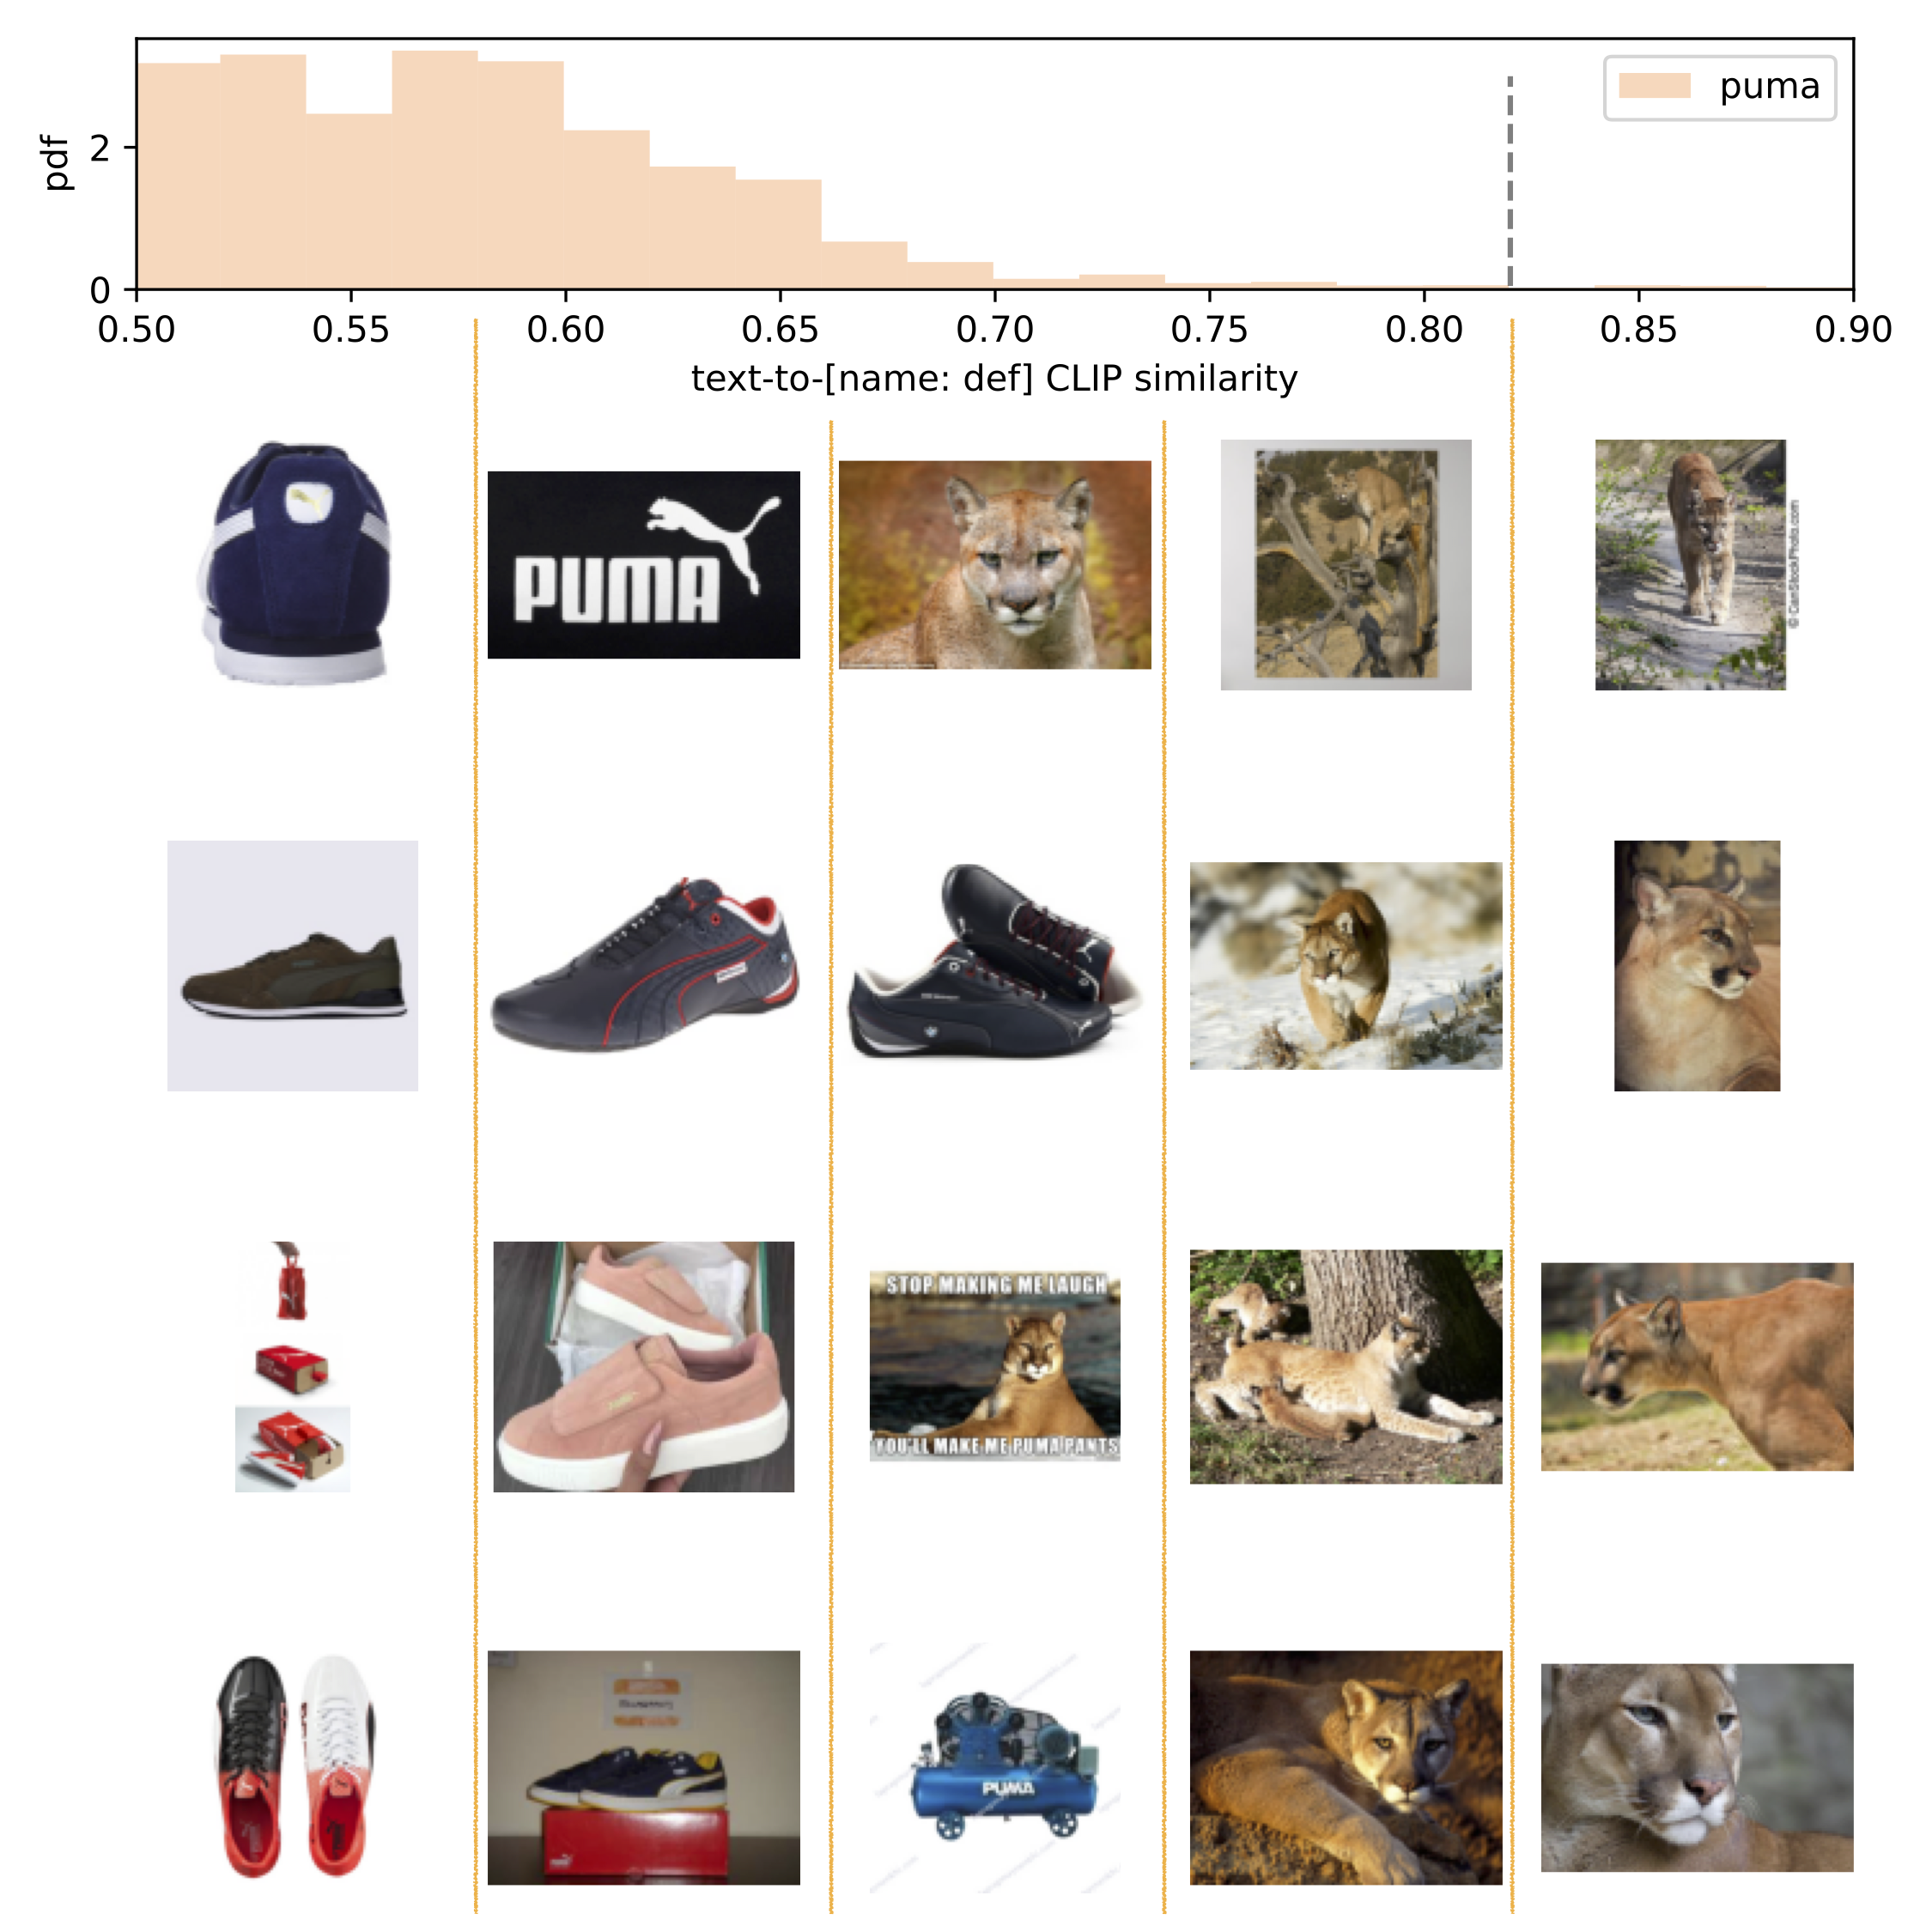
In Section 2, we described how LAIONet is generated through substring matching LAION texts with ImageNet synset lemmas, followed by filtering out the cases where the LAION text is not sufficiently similar to the synset name and definition as measured with the cosine similarity of CLIP embeddings. A critical choice in the second filtering step is the choice of the minimum required textual similarity. We conservatively chose this threshold to be the largest value such that the remaining examples cover a large number of ImageNet’s classes. To show this filtering is necessary and our threshold of is conservative, we have provided an example in Figure 11. Here the synset “cougar” has lemma “puma”. From WordNet definition, “cougar” is a “large American feline resembling lion”. But the common usage of “puma” on the web is about a brand. As Figure 11 shows for small similarity to the synset, data most likely will represent the brand instead of the animal. As we increase the similarity threshold, the examples become more and more likely to be from the intended meaning. Our manual inspections show similar to this example, the chosen threshold of always results in high-quality matching to the intended meaning of the synset even if the web is dominated by other meanings.
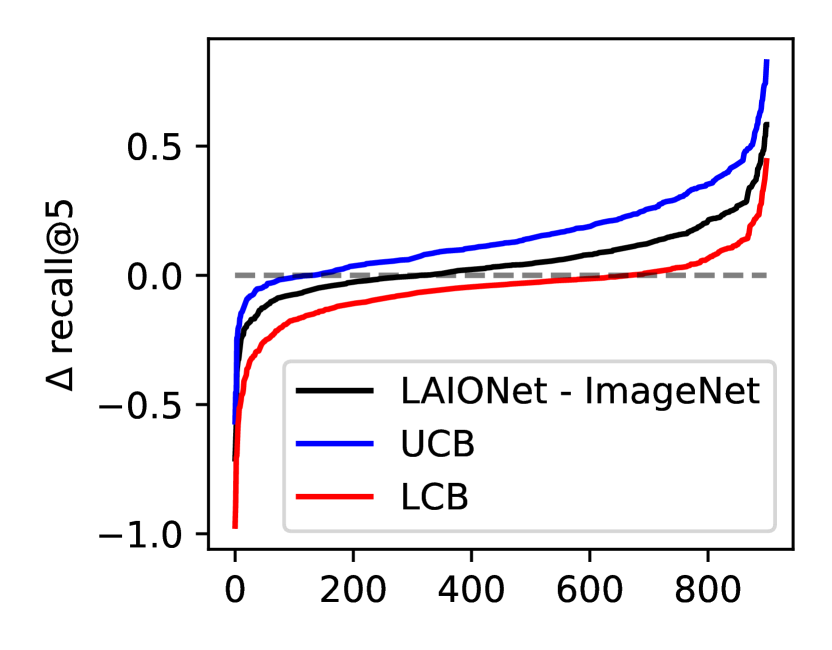
Appendix B Further insights on CLIP zero-shot accuracy
In Section 2 we observed that CLIP has a to percentage points higher accuracy on LAIONet. With finer details, Figure 12 shows CLIP zero-shot recall for each class in LAIONet minus the corresponding number in ImageNet. Considering confidence intervals, CLIP has higher zero-shot recall@ on LAIONet in one-third of the classes while the opposite is true only for one-tenth of the classes. Consistently, in terms of recall@, CLIP has a higher recall on LAIONet in one-fourth of the classes while the converse is true for only of the classes. Overall, LAIONet seems to be a slightly easier dataset for CLIP.
Appendix C Further evidence on the (non)difficulty of LAIONet
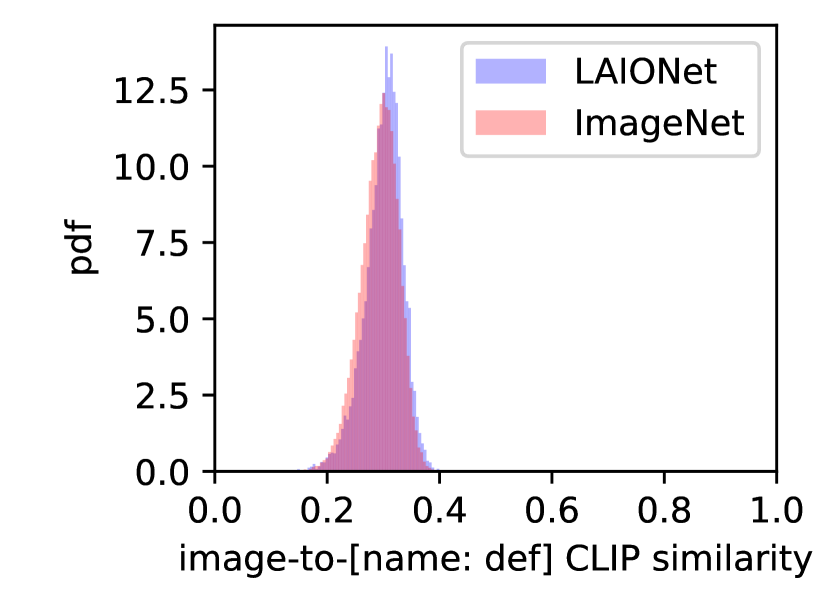
To obtain a better idea of how hard is it to recognize an object in LAIONet, we calculate the similarity of the images to the texts of their associated synsets using CLIP embeddings. We measure this similarity as the cosine similarity of the image embedding with the embedding of the synset text, i.e., the name of the synset followed by its definition. A high value of image-to-synset similarity indicates CLIP is able to identify an object from the synset in the image. On the other hand, a low value could indicate that the intended object is either absent from the image or difficult to recognize. We compare the image-to-synset similarities obtained from the ImageNet validation set and LAIONet.
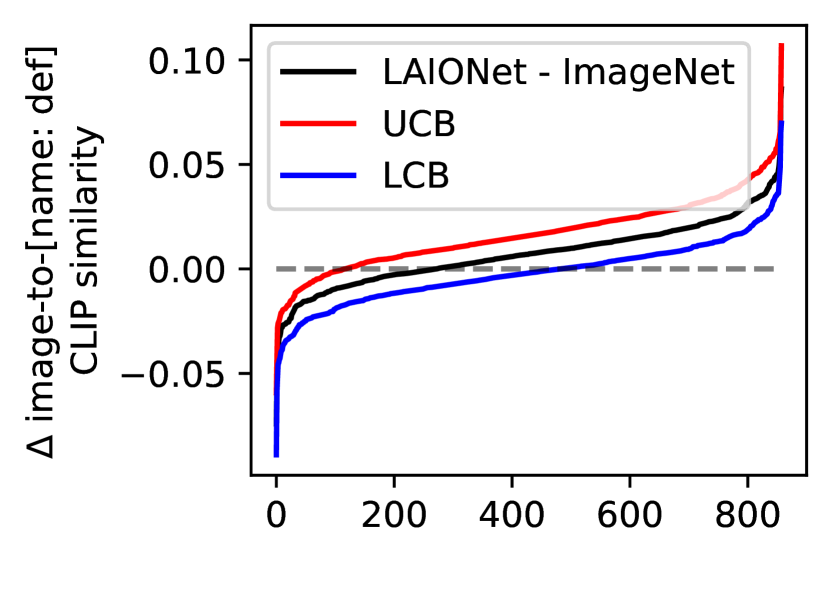
Figure 13(a) illustrates the distribution of image-to-synset similarity for LAIONet and ImageNet. To ensure these distributions are comparable, we sampled LAIONet with replacement to match the number of images per class in the ImageNet validation set. As the figure suggests, the two datasets are not significantly different. In a more fine-grained test, we compared the image-to-synset similarity of the LAIONet and ImageNet for each class. Figure 13(b) shows the average similarity in each class for LAIONet subtracted by the average similarity in the same class for ImageNet along upper and lower confidence bounds. Overall, LAIONet images have significantly higher similarity to their respective synsets in of the classes while the converse is true only for of the classes. This provides additional evidence that identifying intended objects in LAIONet should not be more difficult.
Appendix D The relation of recall, relative frequency, and intra-class similarity
D.1 Recall versus relative frequency
In Section 3.1 we observed accuracy drops when we weight different classes according to their frequency in LAIONet. We attributed this decrease to the models performing worse on more frequent classes. To directly observe this, Figure 14 shows the recall in each class versus the relative frequency of the class in LAIONet. One can see there is a weak but consistent trend that more frequent classes are more likely to be misclassified.
D.2 Relative frequency versus intra-class similarity
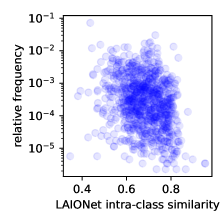
Figure 6(b) shows the relative frequency of different classes versus the average intra-class similarity of LAIONet images. As one might expect, the more frequent a class, the lower the intra-class similarity in LAIONet, but the relationship is weak with a Spearman correlation coefficient of .
D.3 Recall versus intra-class similarity
Appendix E On the choice of similarity threshold in extracting the dataset of Section 4.3
In Section 4.3, we selected a similarity threshold of as the minimum requirement for similarity between LAION text and ImageNet text in order to include a sample from LAION. Ideally, we look for LAION examples with identical text as the ImageNet but due to the limited number of samples available in LAION, this is not possible. As Figure 3(b) shows, increasing the similarity threshold beyond the chosen level of significantly decreases the number of covered classes. Meanwhile, for larger thresholds, the new dataset looks more like ImageNet but is still distinguishable. As Figure 16(b) shows, the proportion of classes with significantly lower intra-class similarity in ImageNet increases as the threshold increases, while the proportion of classes with significantly lower intra-class similarity in the new dataset decreases. The gap still persists but can potentially become smaller in the region our data cannot cover. In sum, the new dataset extracted based on ImageNet looks unlike ImageNet but to the extent it is possible to find similar texts in LAION.