Quadtree features for machine learning on CMDs
Abstract
The upcoming facilities like the Vera C. Rubin Observatory will provide extremely deep photometry of thousands of star clusters to the edge of the Galaxy and beyond, which will require adequate tools for automatic analysis, capable of performing tasks such as the characterization of a star cluster through the analysis of color-magnitude diagrams (CMDs). The latter are essentially point clouds in N-dimensional space, with the number of dimensions corresponding to the photometric bands employed. In this context, machine learning techniques suitable for tabular data are not immediately applicable to CMDs because the number of stars included in a given CMD is variable, and equivariance for permutations is required. To address this issue without introducing ad-hoc manipulations that would require human oversight, here we present a new CMD featurization procedure that summarizes a CMD by means of a quadtree-like structure through iterative partitions of the color-magnitude plane, extracting a fixed number of meaningful features of the relevant subregion from any given CMD. The present approach is robust to photometric noise and contamination and it shows that a simple linear regression on our features predicts distance modulus (metallicity) with a scatter of dex ( dex) in cross-validation.
1 Introduction
The photometric study of stellar populations typically relies on point-spread-function fitting to measure magnitudes in relevant bands. These are then combined to derive color-magnitude diagrams (CMDs) which are used to reconstruct stellar population characteristics. By comparing theoretical stellar evolutionary tracks and isochrones with the location of CMD landmarks (in terms of color and magnitude) such as the Red Clump, Horizontal Branch, turn-off, etc. we can estimate the age, metallicity, reddening, and distance in resolved Open Clusters (OCs) and Globular Clusters (GCs; e.g. Cassisi & Salaris, 2013). Properties, such as the width of the evolutionary sequences or turn-off broadening, measure binary fraction or dispersion in age, metallicity, and rotational velocity (e.g. Milone et al., 2012).
Currently, the highest quality CMDs are derived from Hubble Space Telescope (HST) photometry which, however, was far limited to very small sections of the clusters given the small field of view (FOV; x arcmin) and WFC3 –HST’s most advanced camera– that has a magnitude limit of up to V25.5. On the other hand, the upcoming facility Vera C. Rubin Observatory will have a FOV of square degrees and a magnitude limit of in the r band over most of the southern hemisphere. Then, it is expected to yield accurate turn-off photometry of all star clusters in its survey volume out to the edge of the Milky Way (MW). Alongside opportunities, the volume of data (roughly TB/night) collected will bring extraordinary challenges in data handling, and developing new approaches to reduction and analysis strategies.
In particular, the most common approaches to studying CMDs of stellar clusters are optimized for much smaller datasets and hence samples of stars which generally require a high degree of human intervention in parsing and examining the data. These present substantial drawbacks: high latency on large datasets, some subjectivity in the CMD landmark definitions, and in turn on properties measurement, in the outlier treatment, etc. The latter issue has been recently addressed by several authors by using a Bayesian approach (Bailer-Jones, 2011), however, it does not fully remove the need to define the location of CMD landmarks and it is time-demanding. Other techniques have been proved, such as the ASteCa package (Perren, 2015), nevertheless, it is not time-efficient and it presents problems handling CMDs with differential reddening.
In this context, we present a new method for calculating a set of numeric features from a given CMD with the main goals of speed and robustness to deviations from ideal conditions. Our approach is based on recursively partitioning the CMD plane splitting the relevant coordinate -color or magnitude- at its median. This bears a close similarity with the computation of a quadtree data structure. It can be easily extended to higher dimensions -for instance in the case of multi-band photometry.
1.1 State of the art
CMDs are the result of extracting photometric information from images. The latter can in principle be directly fed into a convolutional neural network (see e.g. Chardin & Bianchini, 2021), but CMDs have superior interpretability for astronomers and fit well into established data-analysis pipelines. Arguably, the first widely adopted architecture able to deal with point cloud data with the characteristics of the typical CMD is the deep set architecture (Zaheer et al., 2017). Looking for citations to this paper within the Astronomy Library at the Harvard abstract service returns a grand total of nine papers (on Wed, Jun 14, 2023). All of these are in cosmology, except for van Groeningen et al. (2023), which applies to membership determination in OCs using Gaia DR3 data (Gaia Collaboration et al., 2022). In general, deep sets and other deep learning approaches, such as graph neural networks (see Wu et al., 2021, for a review) are not built from the ground up for interpretability. It is thus understandable that astronomers look for interpretable featurization of CMDs; nonetheless, to be useful, these must be computed efficiently and without ad-hoc human interventions.
 |
 |
 |
 |
2 Data
As a benchmark for our featurization approach, we selected the photometric sample from the HST Treasury GO10775 “An ACS Survey of Galactic Globular Cluster” (Sarajedini et al., 2007), in its release through the database from the HST Treasury Program GO 13297 (Piotto et al., 2015). For details of the observations and data reduction, we refer the interested reader to Nardiello et al. (2018). We retrieved photometric catalogs in the ACS F606W and F814W bands for a total of 56 GCs, with [Fe/H] ranging from to dex, distance modulus (DM) (m-M)V from 12.3 to 17.6 mag and reddening E(B-V) from negligible to mag. To minimize the field contamination we considered as a cluster member, stars with a membership probability higher than (based on Nardiello et al., 2018).
 |
3 Method
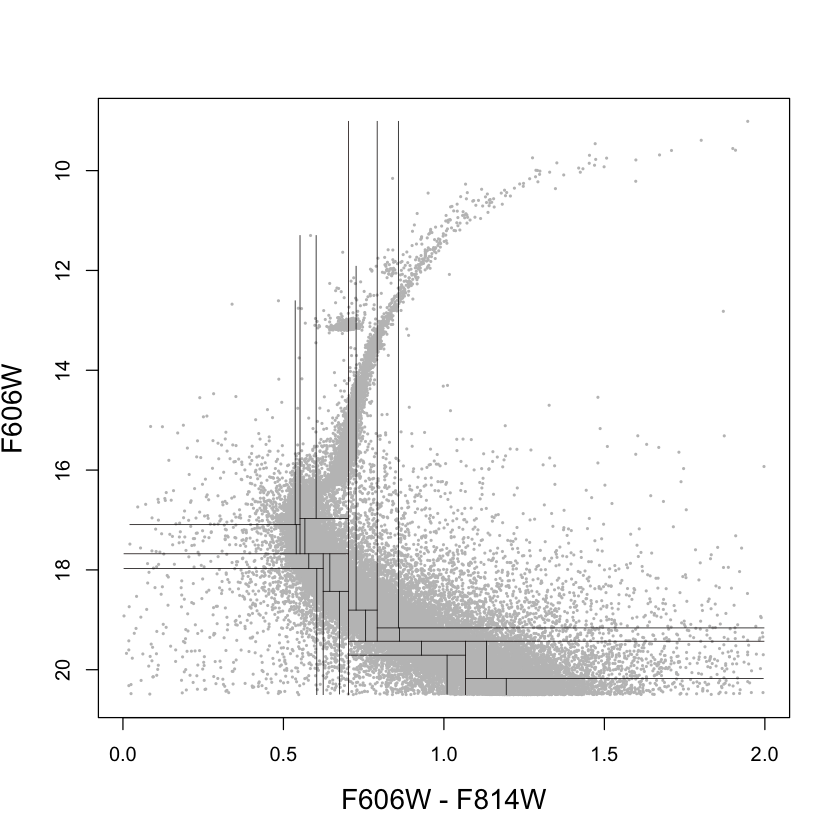
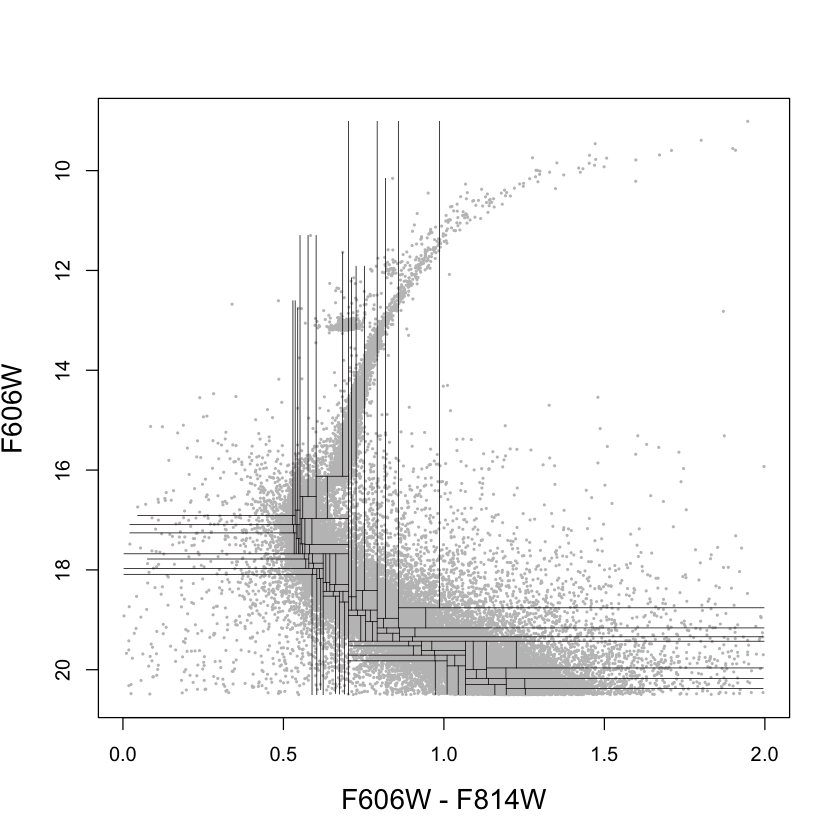
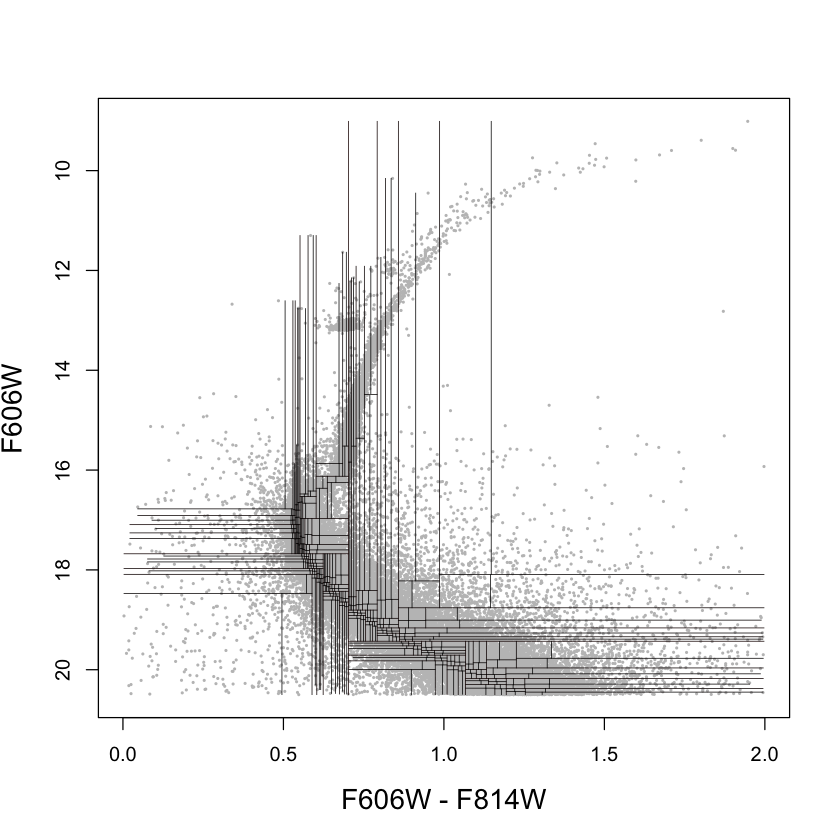
To convert CMDs into a fixed set of features, we calculate the median color and then split the CMD into two parts based on this median. Our featurization approach is rendered in pseudocode in algorithm 1 and illustrated visually in Fig. 1. For each resulting half, we repeat the process and calculate the median magnitude. This process is repeated recursively –by the function f– until a desired level (fixed by the user) of detail is reached. Because each split divides the number of points by two, increasing the depth may yield features that depend on the colors and magnitudes of just a few stars. Thus the depth of the recursion, k, should be set with the total number of stars in the CMD in mind, which may range from to for OCs and GCs, respectively. It is worth noticing that the recursion depth defines the dimensionality of the feature vector which in the present analysis ranges from to . Then, the features have a fixed size avoiding the variable size of point clouds.
The median calculation drives the time complexity of the algorithm once the depth of the recursion is set. The median can be found by sorting in or using specialized algorithms such as quickselect or median of medians which reach in the typical case but with a worst case of (Blum et al., 1973). The sampling error of the median decreases as , similarly to that of the mean, under the assumption of normality, even though with a slightly larger constant of . However, a great advantage of computing medians is that they are robust to outliers, having a breaking point of . Outliers due to contamination, blending, and photometric errors are commonplace in CMDs, making our featurization procedure particularly suitable for this application. In the following, we run a series of empirical tests to corroborate this theoretical expectation.
 |
 |
 |
 |
 |
 |
 |
 |
4 Results
-
•
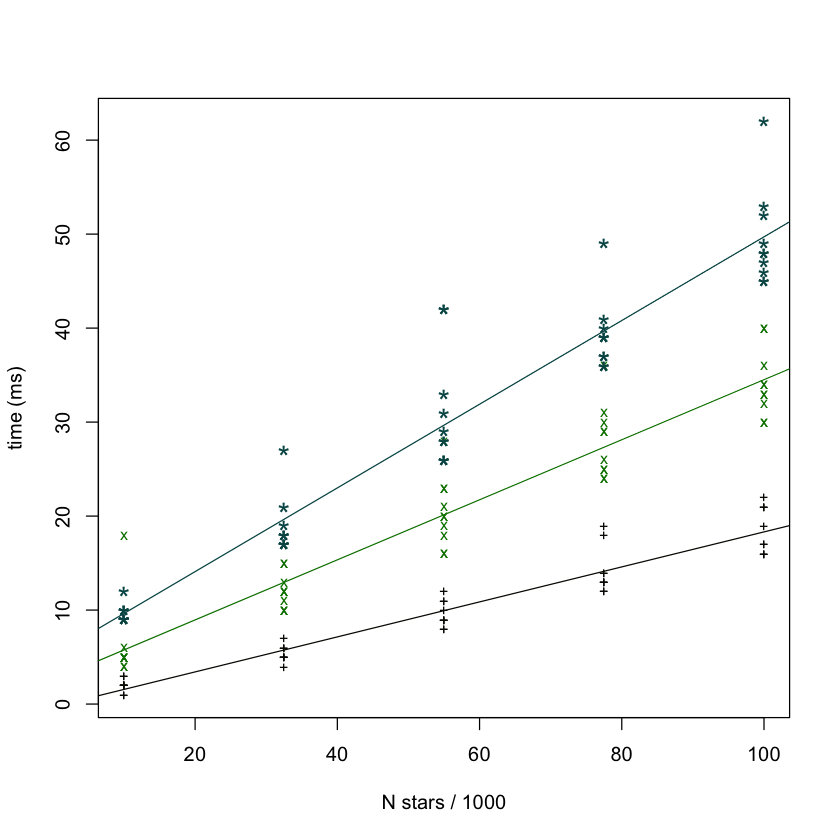
Speed: We tested this empirically on a low-performance machine -an early 2015 MacBook Air. The algorithm was implemented as a recursive function in R (version 3.5.1), an interpreted language not optimized for performance. We also note in passing that the process of computing our features can be easily parallelized, because after each split we have two 2D point clouds that can be processed independently from each other; however, the code we used for the test was not parallelized, and run serially on one core only. To this end, we consider a random point cloud containing up to stars. The scaling appears linear in the number of stars (See Fig. 2), taking about , , and s per thousand stars processed for a tree of depth , , and respectively. This suggests that our features could be calculated in real-time at the end of a pipeline that processes raw data into CMDs, adding little overhead.
-
•
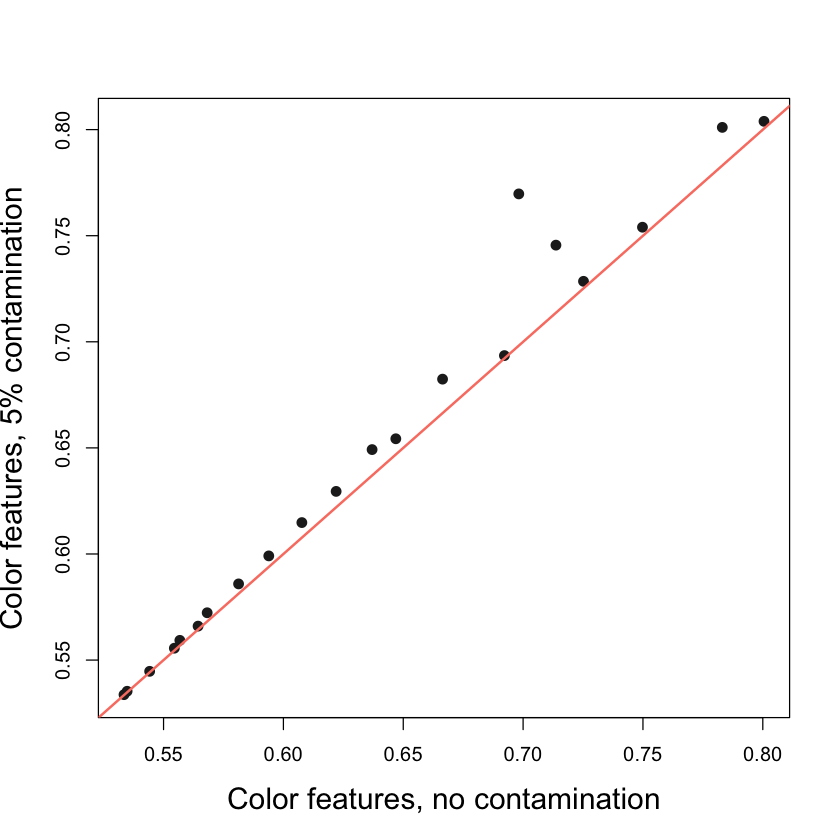
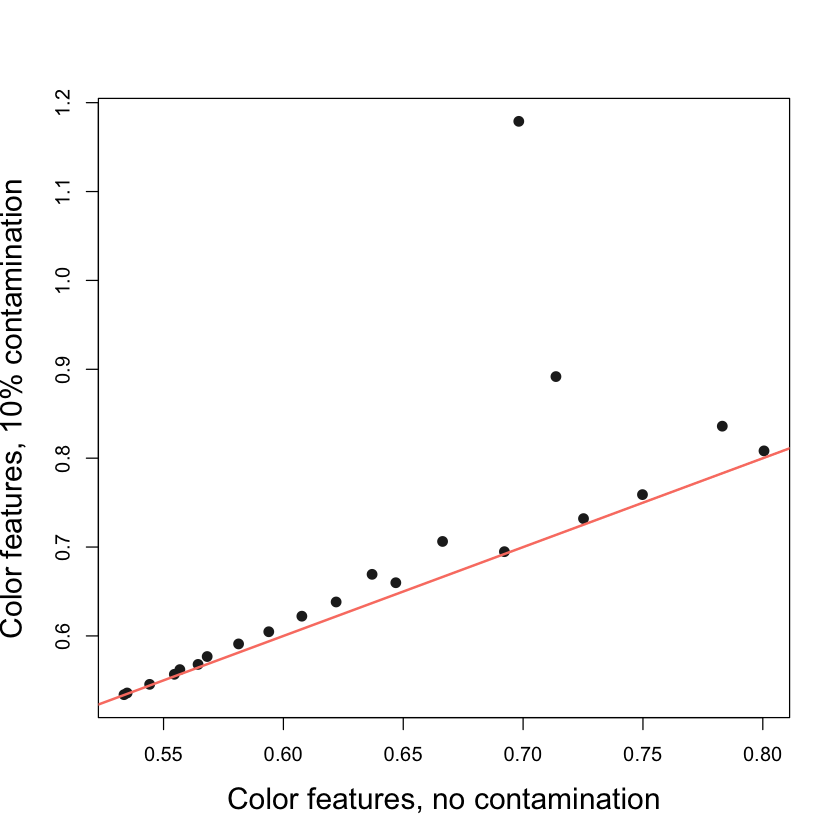
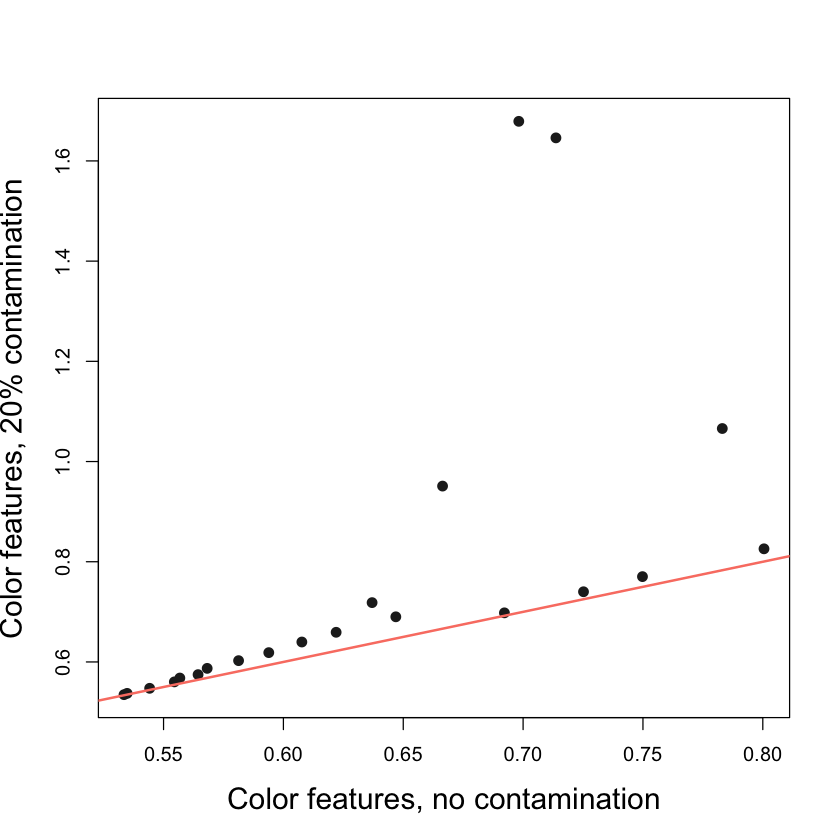
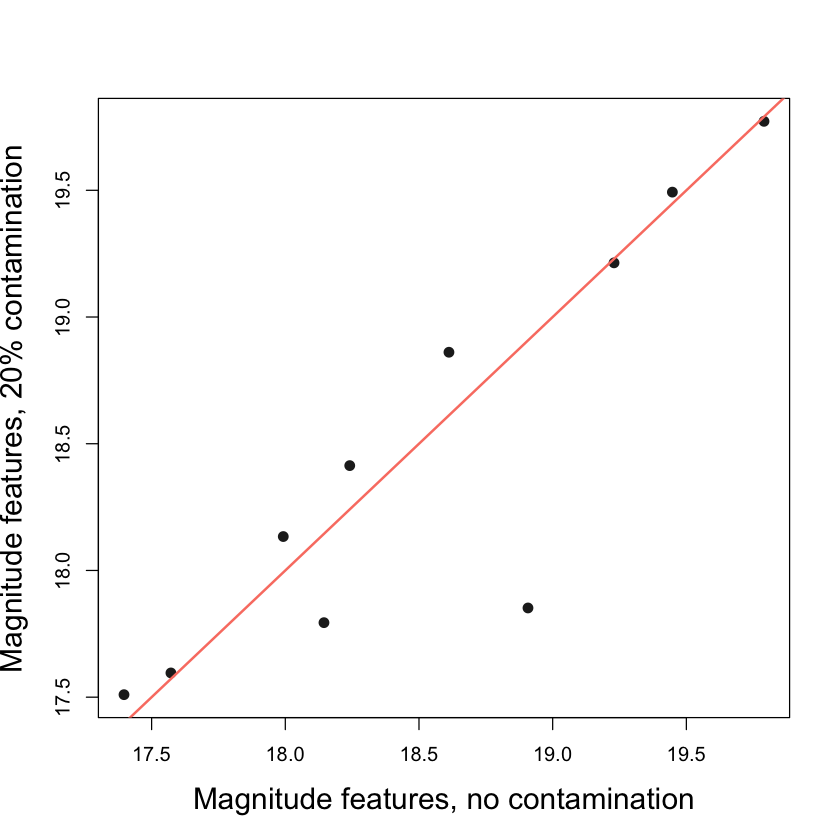
Robustness to contamination: We measure the effects of contamination by foreground stars on our features by taking the one CMD of the sample (NGC 104) and adding contaminants in varying proportions. We use trilegal (e.g., Vanhollebeke et al., 2009) to model MW contamination in the direction of NGC 104 for this purpose. In this test, we analyze the effect on the color and magnitude medians calculated after adding a fraction of contaminants corresponding to , , , and on our features using a quadtree of depth 5 (see Fig. 3 and Fig. 4). The results show that low to moderate contamination levels disrupt only a subset of features, leaving the others intact. The disrupted features correspond to deeper levels of the quadtree, where the median has been calculated on a limited number of stars. Given that the breakpoint of the median corresponds to of the data, even in the worst-case scenario where an adversary can place contaminants arbitrarily, contaminants are required to affect a median at depth (having defined as the root of the tree containing the whole CMD) because such a median is calculated on stars. We thus expect a contamination level of at least % to be required to affect a single feature. Our test empirically demonstrates this, where contamination at essentially does not affect our features, and contamination at makes one color median and one magnitude median deviate, with the other features essentially unaffected.
-
•
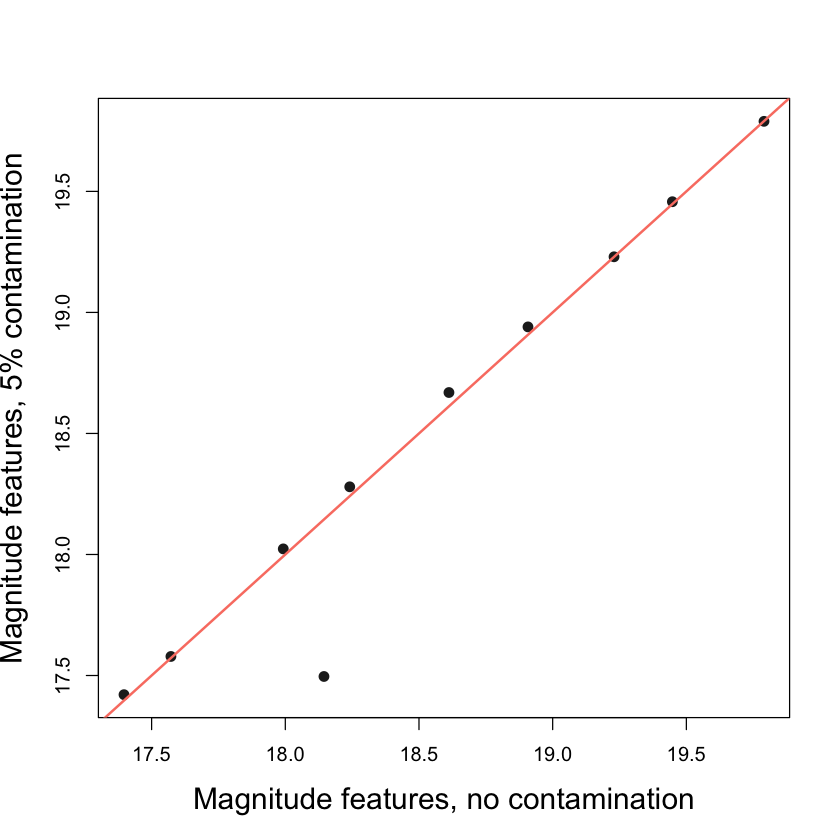
Robustness to photometric error: We added artificial photometric error to the CMD of NGC 104 to mimic the observational ones.
-
•
Reddening and differential reddening: Since our features are the color and magnitude medians on relevant rectangular patches in the CMD plane –in the presence of a constant reddening– they respond to this rigid translation with a constant shift. For instance, for a reddening of E(B-V)=0.1, the reddening vector in the V, B-V plane would be , so the color and magnitude features will be increased by and , respectively. For differential reddening by adding random Gaussian noise to the modulus of the reddening vector while keeping its direction constant. Because our features are medians on the stars that fall in the relevant quadrant, their sampling error is related to the individual error on stellar magnitudes and colors as assuming that the individual error is normal, with . Since the branching of the tree at depth calculates the median color or magnitude of stars where is the total number of stars in the CMD, even at which is the maximum value we considered, even if . This reduces the error by more than a factor of 3, and most points fall within the one-sigma.
-
•
Dimensionality reduction of a set of GC CMDs: We performed t-SNE analysis on our features with a tree of depth on a sample of GCs. Fig. 5 shows the t-SNE plot which displays a visually compelling structure that suggests a meaningful distribution of the data points in the feature space111Note, however, that the appearance of the plot depends on t-SNE hyperparameter perplexity, which was set to in our case, purposefully singling out small groups of similar CMDs., with similar-looking CMDs often appearing near each other.
-
•
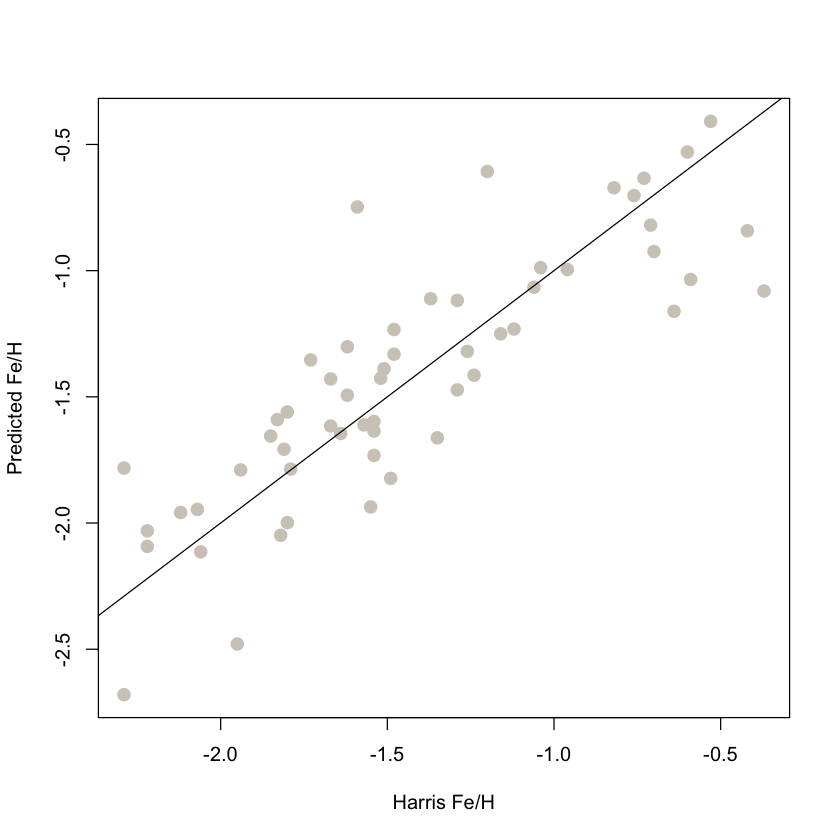
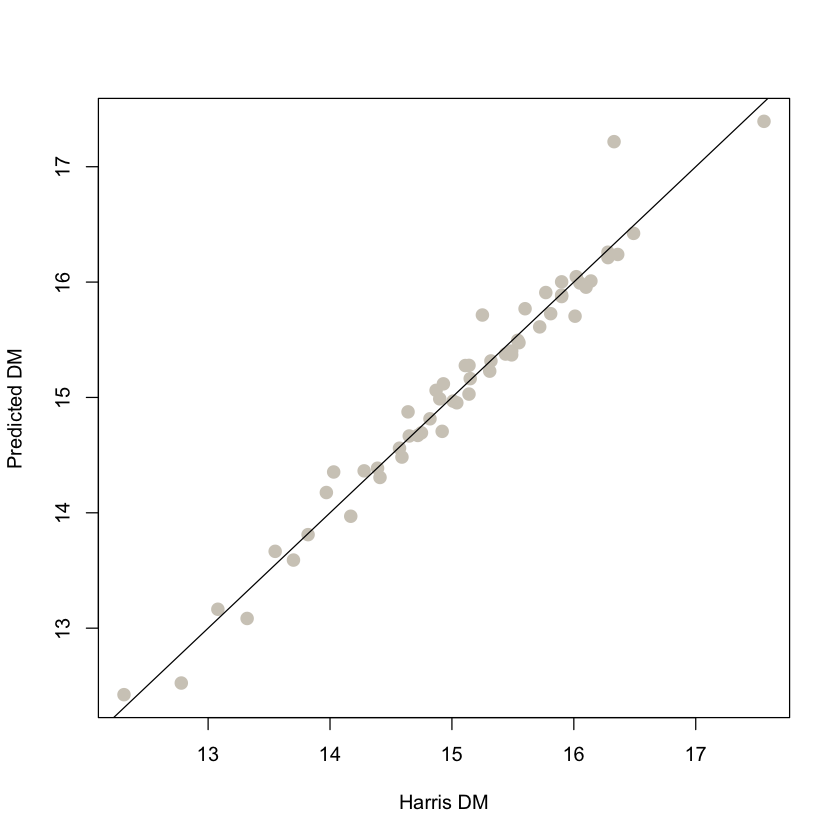
Supervised regression on a set of GC CMDs: We calculated our features with a tree of depth on a sample of GCs, resulting in features for each GC. We trained a simple linear regression model. Fig. 6 shows the predicted [Fe/H] (left panel) and DM (left panel) on our data set, evaluating its performance in terms of rms error in leave-one-out cross-validation. Even with a simple model the scatter in predicted metallicity is dex and in distance modulus mag.

 |
 |
5 Discussion and conclusions
Astronomy has recently seen a progressive increase in machine learning applications, driven by the availability of tools and the sheer volume of data. While the use of deep learning tools for the analysis of images and spectra is now commonplace, point cloud data is lagging behind. While point-cloud deep learning approaches (e.g. Guo et al., 2020) can be tailored to astronomical data, astronomers doubtlessly find value in extracting tabular features from point clouds, as in the case of color-magnitude diagrams. For this application, no out-of-the-box solution is available at present. In this work, we presented a featurization approach that is fast to compute, effective in concisely describing the data, and robust to photometric error and outliers. We demonstrated these properties empirically on actual astronomical data and articulated their theoretical underpinning where applicable. This technique overcomes the problems present in the methods used in astronomy for this kind of analysis such as the time-consuming and data handling.
Acknowledgements
J.S-U and his work were supported by the National Agency for Research and Development (ANID)/Programa de Becas de Doctorado en el extranjero/DOCTORADO BECASCHILE/2019-72200126. MP acknowledges financial support from the European Union’s Horizon 2020 research and innovation programme under the Marie Sklodowska-Curie grant agreement No. 896248. This work was partially funded by the PRIN INAF 2019 grant ObFu 1.05.01.85.14 (’Building up the halo: chemo-dynamical tagging in the age of large surveys’, PI. S. Lucatello)
References
- Bailer-Jones (2011) Bailer-Jones, C. A. L. Bayesian inference of stellar parameters and interstellar extinction using parallaxes and multiband photometry. \mnras, 411(1):435–452, February 2011. doi: 10.1111/j.1365-2966.2010.17699.x.
- Blum et al. (1973) Blum, M., Floyd, R. W., Pratt, V. R., Rivest, R. L., Tarjan, R. E., et al. Time bounds for selection. J. Comput. Syst. Sci., 7(4):448–461, 1973.
- Cassisi & Salaris (2013) Cassisi, S. and Salaris, M. Old Stellar Populations: How to Study the Fossil Record of Galaxy Formation. John Wiley & Sons, Ltd, 2013.
- Chardin & Bianchini (2021) Chardin, J. and Bianchini, P. Predicting images for the dynamics of stellar clusters (-DOC): a deep learning framework to predict mass, distance, and age of globular clusters. \mnras, 504(4):5656–5670, July 2021. doi: 10.1093/mnras/stab737.
- Gaia Collaboration et al. (2022) Gaia Collaboration, Vallenari, A., Brown, A. G. A., Prusti, T., de Bruijne, J. H. J., Arenou, F., Babusiaux, C., Biermann, M., Creevey, O. L., Ducourant, C., Evans, D. W., Eyer, L., Guerra, R., Hutton, A., Jordi, C., Klioner, S. A., Lammers, U. L., Lindegren, L., Luri, X., Mignard, F., Panem, C., Pourbaix, D., Randich, S., Sartoretti, P., Soubiran, C., Tanga, P., Walton, N. A., Bailer-Jones, C. A. L., Bastian, U., Drimmel, R., Jansen, F., Katz, D., Lattanzi, M. G., van Leeuwen, F., Bakker, J., Cacciari, C., Castañeda, J., De Angeli, F., Fabricius, C., Fouesneau, M., Frémat, Y., Galluccio, L., Guerrier, A., Heiter, U., Masana, E., Messineo, R., Mowlavi, N., Nicolas, C., Nienartowicz, K., Pailler, F., Panuzzo, P., Riclet, F., Roux, W., Seabroke, G. M., Sordoørcit, R., Thévenin, F., Gracia-Abril, G., Portell, J., Teyssier, D., Altmann, M., Andrae, R., Audard, M., Bellas-Velidis, I., Benson, K., Berthier, J., Blomme, R., Burgess, P. W., Busonero, D., Busso, G., Cánovas, H., Carry, B., Cellino, A., Cheek, N., Clementini, G., Damerdji, Y., Davidson, M., de Teodoro, P., Nuñez Campos, M., Delchambre, L., Dell’Oro, A., Esquej, P., Fernández-Hernández, J., Fraile, E., Garabato, D., García-Lario, P., Gosset, E., Haigron, R., Halbwachs, J. L., Hambly, N. C., Harrison, D. L., Hernández, J., Hestroffer, D., Hodgkin, S. T., Holl, B., Janßen, K., Jevardat de Fombelle, G., Jordan, S., Krone-Martins, A., Lanzafame, A. C., Löffler, W., Marchal, O., Marrese, P. M., Moitinho, A., Muinonen, K., Osborne, P., Pancino, E., Pauwels, T., Recio-Blanco, A., Reylé, C., Riello, M., Rimoldini, L., Roegiers, T., Rybizki, J., Sarro, L. M., Siopis, C., Smith, M., Sozzetti, A., Utrilla, E., van Leeuwen, M., Abbas, U., Ábrahám, P., Abreu Aramburu, A., Aerts, C., Aguado, J. J., Ajaj, M., Aldea-Montero, F., Altavilla, G., Álvarez, M. A., Alves, J., Anders, F., Anderson, R. I., Anglada Varela, E., Antoja, T., Baines, D., Baker, S. G., Balaguer-Núñez, L., Balbinot, E., Balog, Z., Barache, C., Barbato, D., Barros, M., Barstow, M. A., Bartolomé, S., Bassilana, J. L., Bauchet, N., Becciani, U., Bellazzini, M., Berihuete, A., Bernet, M., Bertone, S., Bianchi, L., Binnenfeld, A., Blanco-Cuaresma, S., Blazere, A., Boch, T., Bombrun, A., Bossini, D., Bouquillon, S., Bragaglia, A., Bramante, L., Breedt, E., Bressan, A., Brouillet, N., Brugaletta, E., Bucciarelli, B., Burlacu, A., Butkevich, A. G., Buzzi, R., Caffau, E., Cancelliere, R., Cantat-Gaudin, T., Carballo, R., Carlucci, T., Carnerero, M. I., Carrasco, J. M., Casamiquela, L., Castellani, M., Castro-Ginard, A., Chaoul, L., Charlot, P., Chemin, L., Chiaramida, V., Chiavassa, A., Chornay, N., Comoretto, G., Contursi, G., Cooper, W. J., Cornez, T., Cowell, S., Crifo, F., Cropper, M., Crosta, M., Crowley, C., Dafonte, C., Dapergolas, A., David, M., David, P., de Laverny, P., De Luise, F., De March, R., De Ridder, J., de Souza, R., de Torres, A., del Peloso, E. F., del Pozo, E., Delbo, M., Delgado, A., Delisle, J. B., Demouchy, C., Dharmawardena, T. E., Di Matteo, P., Diakite, S., Diener, C., Distefano, E., Dolding, C., Edvardsson, B., Enke, H., Fabre, C., Fabrizio, M., Faigler, S., Fedorets, G., Fernique, P., Fienga, A., Figueras, F., Fournier, Y., Fouron, C., Fragkoudi, F., Gai, M., Garcia-Gutierrez, A., Garcia-Reinaldos, M., García-Torres, M., Garofalo, A., Gavel, A., Gavras, P., Gerlach, E., Geyer, R., Giacobbe, P., Gilmore, G., Girona, S., Giuffrida, G., Gomel, R., Gomez, A., González-Núñez, J., González-Santamaría, I., González-Vidal, J. J., Granvik, M., Guillout, P., Guiraud, J., Gutiérrez-Sánchez, R., Guy, L. P., Hatzidimitriou, D., Hauser, M., Haywood, M., Helmer, A., Helmi, A., Sarmiento, M. H., Hidalgo, S. L., Hilger, T., Hładczuk, N., Hobbs, D., Holland, G., Huckle, H. E., Jardine, K., Jasniewicz, G., Jean-Antoine Piccolo, A., Jiménez-Arranz, Ó., Jorissen, A., Juaristi Campillo, J., Julbe, F., Karbevska, L., Kervella, P., Khanna, S., Kontizas, M., Kordopatis, G., Korn, A. J., Kóspál, Á., Kostrzewa-Rutkowska, Z., Kruszyńska, K., Kun, M., Laizeau, P., Lambert, S., Lanza, A. F., Lasne, Y., Le Campion, J. F., Lebreton, Y., Lebzelter, T., Leccia, S., Leclerc, N., Lecoeur-Taibi, I., Liao, S., Licata, E. L., Lindstrøm, H. E. P., Lister, T. A., Livanou, E., Lobel, A., Lorca, A., Loup, C., Madrero Pardo, P., Magdaleno Romeo, A., Managau, S., Mann, R. G., Manteiga, M., Marchant, J. M., Marconi, M., Marcos, J., Marcos Santos, M. M. S., Marín Pina, D., Marinoni, S., Marocco, F., Marshall, D. J., Polo, L. M., Martín-Fleitas, J. M., Marton, G., Mary, N., Masip, A., Massari, D., Mastrobuono-Battisti, A., Mazeh, T., McMillan, P. J., Messina, S., Michalik, D., Millar, N. R., Mints, A., Molina, D., Molinaro, R., Molnár, L., Monari, G., Monguió, M., Montegriffo, P., Montero, A., Mor, R., Mora, A., Morbidelli, R., Morel, T., Morris, D., Muraveva, T., Murphy, C. P., Musella, I., Nagy, Z., Noval, L., Ocaña, F., Ogden, A., Ordenovic, C., Osinde, J. O., Pagani, C., Pagano, I., Palaversa, L., Palicio, P. A., Pallas-Quintela, L., Panahi, A., Payne-Wardenaar, S., Peñalosa Esteller, X., Penttilä, A., Pichon, B., Piersimoni, A. M., Pineau, F. X., Plachy, E., Plum, G., Poggio, E., Prša, A., Pulone, L., Racero, E., Ragaini, S., Rainer, M., Raiteri, C. M., Rambaux, N., Ramos, P., Ramos-Lerate, M., Re Fiorentin, P., Regibo, S., Richards, P. J., Rios Diaz, C., Ripepi, V., Riva, A., Rix, H. W., Rixon, G., Robichon, N., Robin, A. C., Robin, C., Roelens, M., Rogues, H. R. O., Rohrbasser, L., Romero-Gómez, M., Rowell, N., Royer, F., Ruz Mieres, D., Rybicki, K. A., Sadowski, G., Sáez Núñez, A., Sagristà Sellés, A., Sahlmann, J., Salguero, E., Samaras, N., Sanchez Gimenez, V., Sanna, N., Santoveña, R., Sarasso, M., Schultheis, M., Sciacca, E., Segol, M., Segovia, J. C., Ségransan, D., Semeux, D., Shahaf, S., Siddiqui, H. I., Siebert, A., Siltala, L., Silvelo, A., Slezak, E., Slezak, I., Smart, R. L., Snaith, O. N., Solano, E., Solitro, F., Souami, D., Souchay, J., Spagna, A., Spina, L., Spoto, F., Steele, I. A., Steidelmüller, H., Stephenson, C. A., Süveges, M., Surdej, J., Szabados, L., Szegedi-Elek, E., Taris, F., Taylo, M. B., Teixeira, R., Tolomei, L., Tonello, N., Torra, F., Torra, J., Torralba Elipe, G., Trabucchi, M., Tsounis, A. T., Turon, C., Ulla, A., Unger, N., Vaillant, M. V., van Dillen, E., van Reeven, W., Vanel, O., Vecchiato, A., Viala, Y., Vicente, D., Voutsinas, S., Weiler, M., Wevers, T., Wyrzykowski, L., Yoldas, A., Yvard, P., Zhao, H., Zorec, J., Zucker, S., and Zwitter, T. Gaia Data Release 3: Summary of the content and survey properties. arXiv e-prints, art. arXiv:2208.00211, July 2022. doi: 10.48550/arXiv.2208.00211.
- Guo et al. (2020) Guo, Y., Wang, H., Hu, Q., Liu, H., Liu, L., and Bennamoun, M. Deep learning for 3d point clouds: A survey. IEEE transactions on pattern analysis and machine intelligence, 2020.
- Milone et al. (2012) Milone, A. P., Piotto, G., Bedin, L. R., Aparicio, A., Anderson, J., Sarajedini, A., Marino, A. F., Moretti, A., Davies, M. B., Chaboyer, B., Dotter, A., Hempel, M., Marín-Franch, A., Majewski, S., Paust, N. E. Q., Reid, I. N., Rosenberg, A., and Siegel, M. The ACS survey of Galactic globular clusters. XII. Photometric binaries along the main sequence. \aap, 540:A16, April 2012. doi: 10.1051/0004-6361/201016384.
- Nardiello et al. (2018) Nardiello, D., Libralato, M., Piotto, G., Anderson, J., Bellini, A., Aparicio, A., Bedin, L. R., Cassisi, S., Granata, V., King, I. R., Lucertini, F., Marino, A. F., Milone, A. P., Ortolani, S., Platais, I., and van der Marel, R. P. The Hubble Space Telescope UV Legacy Survey of Galactic Globular Clusters - XVII. Public Catalogue Release. \mnras, 481(3):3382–3393, December 2018. doi: 10.1093/mnras/sty2515.
- Perren (2015) Perren, G. ASteCA: Automated Stellar Cluster Analysis. Astrophysics Source Code Library, record ascl:1505.002, May 2015.
- Piotto et al. (2015) Piotto, G., Milone, A. P., Bedin, L. R., Anderson, J., King, I. R., Marino, A. F., Nardiello, D., Aparicio, A., Barbuy, B., Bellini, A., Brown, T. M., Cassisi, S., Cool, A. M., Cunial, A., Dalessandro, E., D’Antona, F., Ferraro, F. R., Hidalgo, S., Lanzoni, B., Monelli, M., Ortolani, S., Renzini, A., Salaris, M., Sarajedini, A., van der Marel, R. P., Vesperini, E., and Zoccali, M. The Hubble Space Telescope UV Legacy Survey of Galactic Globular Clusters. I. Overview of the Project and Detection of Multiple Stellar Populations. \aj, 149(3):91, March 2015. doi: 10.1088/0004-6256/149/3/91.
- Sarajedini et al. (2007) Sarajedini, A., Bedin, L. R., Chaboyer, B., Dotter, A., Siegel, M., Anderson, J., Aparicio, A., King, I., Majewski, S., Marín-Franch, A., Piotto, G., Reid, I. N., and Rosenberg, A. The ACS Survey of Galactic Globular Clusters. I. Overview and Clusters without Previous Hubble Space Telescope Photometry. \aj, 133(4):1658–1672, April 2007. doi: 10.1086/511979.
- van Groeningen et al. (2023) van Groeningen, M. G. J., Castro-Ginard, A., Brown, A. G. A., Casamiquela, L., and Jordi, C. A machine learning-based tool for open cluster membership determination in Gaia DR3. arXiv e-prints, art. arXiv:2303.08474, March 2023. doi: 10.48550/arXiv.2303.08474.
- Vanhollebeke et al. (2009) Vanhollebeke, E., Groenewegen, M. A. T., and Girardi, L. Stellar populations in the Galactic bulge. Modelling the Galactic bulge with TRILEGAL. \aap, 498(1):95–107, April 2009. doi: 10.1051/0004-6361/20078472.
- Wu et al. (2021) Wu, Z., Pan, S., Chen, F., Long, G., Zhang, C., and Yu, P. S. A comprehensive survey on graph neural networks. IEEE Transactions on Neural Networks and Learning Systems, 32(1):4–24, 2021. doi: 10.1109/TNNLS.2020.2978386.
- Zaheer et al. (2017) Zaheer, M., Kottur, S., Ravanbakhsh, S., Poczos, B., Salakhutdinov, R., and Smola, A. Deep Sets. arXiv e-prints, art. arXiv:1703.06114, March 2017. doi: 10.48550/arXiv.1703.06114.
Contribution of Latin authors
The first author is Latin and wrote part of this extended abstract and contributed to the early discussion and brainstorming that resulted in the adoption of quadtree features for CMDs. The Latin author will be the presenting author in the conference.