On the H faintness of the North Polar Spur
Abstract
The ratio of H intensity to 1.4 GHz radio continuum intensity in the North Polar Spur (NPS) is measured to be , two orders of magnitude smaller than the values of observed in the typical shell-type old supernova remnants, Cygnus Loop and S147. The extremely low H-to-radio intensity ratio favours the Galactic-Centre explosion model for NPS, which postulates a giant shock wave at a distance of several kilo parsecs in the hot and low-density Galactic halo with low hydrogen recombination rate, over the local supernova(e) remnant model.
keywords:
ISM: individual objects: (North Polar Spur) – ISM: shock waves – ISM: bubbles – Galaxy: centre – galaxies: individual: objects (the Milky Way)1 Introduction
The North Polar Spur (NPS) forms the northeastern edge of the giant Galactic bubble, composing the Loop I of radio continuum [Haslam et al. 1982] and X-ray emissions [Snowden et al. 1997, Predehl et al. 2020] with the brightest ridge at [Sofue & Reich 1979]. Due to the sharp-edged shell-like morphology, the NPS is interpreted as a spherical shock wave driven by an explosive energy release at the loop centre.
There are two ideas to explain the origin of the explosion. One is the explosion(s) of nearby supernova(e) [Hanbury Brown et al. 1960, Berkhuijsen et al. 1971, Egger & Aschenbach 1995, Aschenbach & Leahy 1999, Wolleben 2007, Dickinson 2018] in the Sco-Cen OB Associations at a distance of pc [de Zeeuw et al. 1999]. This hypothesis assumes supernova remnant(s) expanding in the low temperature, high density ISM at eV ( K), H cm-3, and height pc inside the Galactic disc. However, when most of nearby shell-type SNRs with angular diameters were optically identified by red (H)-sensitive emulsions [van den Bergh et al. 1973], the absence of H counterpart to NPS, if it is the closest SNR(s), has been a mystery for over half a century [Sofue et al. 1974]. In fact, this problem was already pointed out in the earliest paper which suggested the SNR idea for the first time [Hanbury Brown et al. 1960].
The other idea is an explosion in the Galactic nucleus or a starburst in the Galactic Centre (GC) [Sofue 1977, Sofue et al. 2016, Kataoka et al. 2018], which postulates a shock wave propagating in the hot, low-density halo with keV ( K) and H cm-3 at kpc. Because of the high temperature the gas is almost perfectly ionized and the hydrogen recombination is limited, so that the H absence may not contradict this idea.
In the present paper, we revisit this classical issue of NPS’s optical dimness, which appears to have not been explored by quantitative analysis based on the observational data. We examine the ratio of H intensity to radio continuum intensity in the NPS and in the most typical shell-type SNRs, Cygnus Loop and S147 [van den Bergh et al. 1973], and focus on the difference in the radiation processes in the shock fronts expanding into the Galactic halo and into the disc.
(K)
2 Optical vs radio continuum emissions
2.1 Data and measured quantities
The radio continuum data were taken from the 408 MHz Bonn-Parkes [Haslam et al. 1982], 1420 MHz Stockert-Villa Elisa [Reich et al. 2001] all-sky survey, and 1420 MHz Bonn 100-m Galactic plane survey [Reich et al. 1990, Reich et al. 1997]. Also, radio surveys at 22 [Roger et al. 1999], 150 [Landecker & Wielebinski 1970], and 820 [Berkhuijsen 1971]. We use the brightness temperature in K which is related to the surface brightness by in erg cm-2 s-1 sr-1 Hz-1. We also use the integrated intensity at GHz defined by
| (1) |
in unit of erg cm-2 s-1 sr-1 in order to compare with the H intensity. The H data were taken from the Wisconsin H all-sky map (WHAM) [Haffner et al. 2003, Haffner et al. 2010], and the intensity unit is Rayleigh (R) defined by
| (2) |
at H, and 1 R corresponds to emission measure of cm-6 pc for gas at a temperature of 8000 K [Haffner et al. 2003].
As we are interested in the H-to-radio continuum intensity ratio, we introduce a parameter, , defined by
| (3) |
Here, the radio brightness at K corresponds to erg cm-2 s-1 sr-1. So, a region with R and K has the intensity ratio of .
2.2 All-sky maps
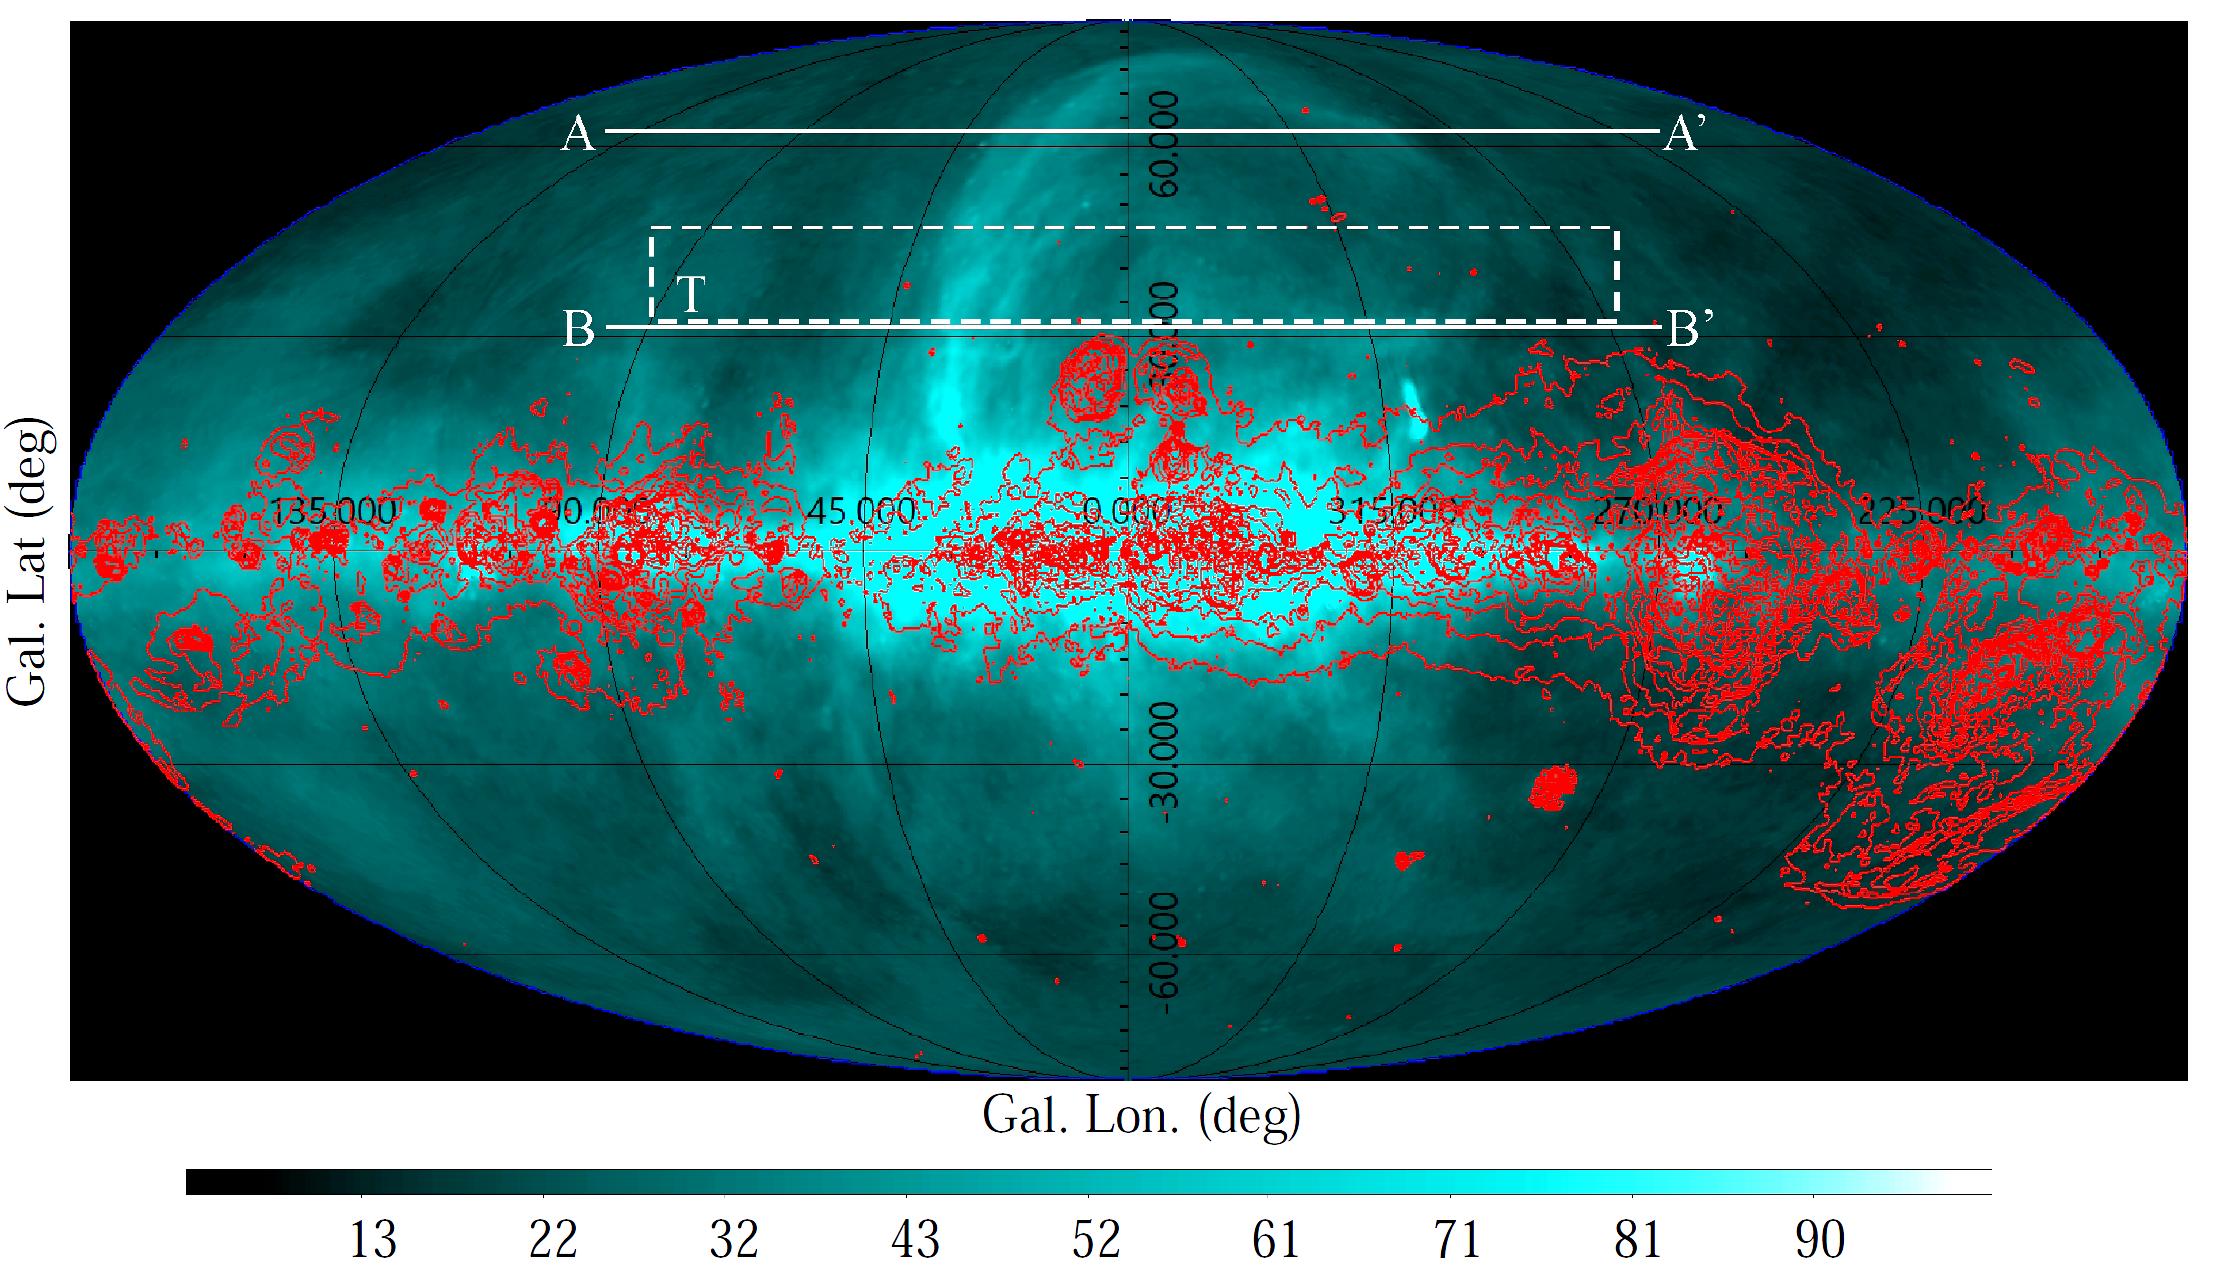
Figure 1 shows the all-sky radio brightness () map at 408 MHz in the coordinates obtained from the Bonn-Parkes survey [Haslam et al. 1982] overlaid with contours of the H intensity () map from the WHAM survey [Haffner et al. 2003]. The FWHM resolution of the 408 MHz map is . The H data had a resolution of , while the contours here are drawn after smoothing to the same resolution as radio. We immediately notice that Loop I, including NPS, is invisible or very weak in H despite the high radio brightness even toward the most prominent ridge at and .
2.3 Perpendicular optical filaments in the Aquila Rift
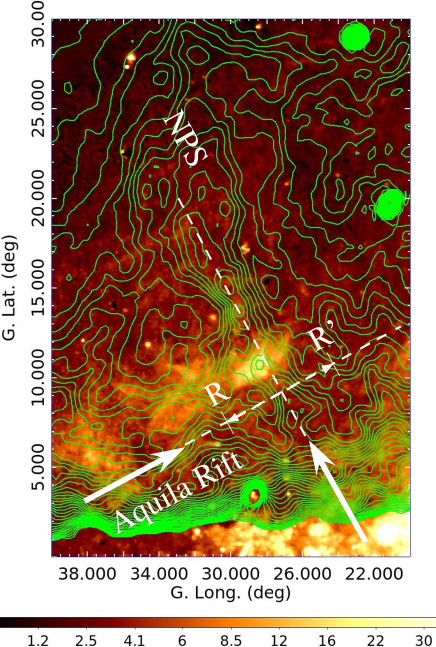
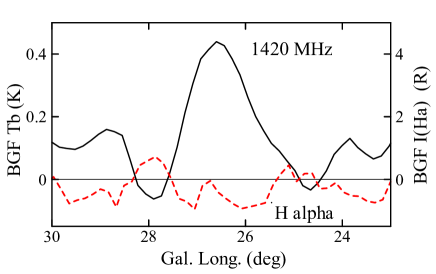
Figure 2 enlarges the radio map at 1420 MHz [Reich et al. 2001] around the brightest region of the NPS by contours superposed on the H intensity map. The figure shows several H filaments running parallel to the Aquila Rift, which is the dark absorption belt from to , with R at position angle of PA, but they cross the NPS at right angle. The perpendicular orientation indicates that these H filaments are not related to NPS. We also stress that the darkest part of the Rift at shows no enhancement across NPS as shown by a comparison of the cross sections of radio and H intensities in the lower panel of Fig. 2. This means that no H feature associated with NPS exists in front of the Aquila Rift whose distance is pc [Sofue 2015, Sofue & Nakanishi 2017], which contradicts the local origin model for Loop I. However, it does not necessarily deny the possibility that there is H associated with NPS, if it is located behind the Rift. In either case, it is difficult to determine how much of the H feature is associated with the NPS. We therefore exclude this region from quantitative measurements, and restrict our analysis to the spur at higher latitudes than .
2.4 Intensity profiles
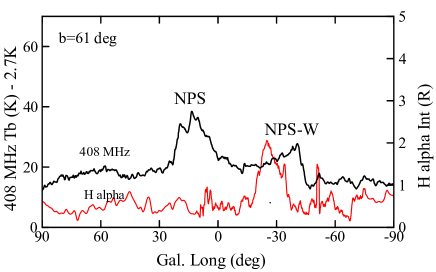
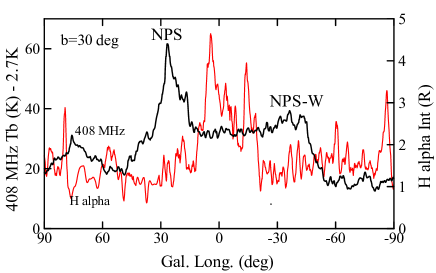
Fig. 3 shows horizontal cross sections of the 408 MHz radio brightness and H intensity across the NPS and NPS West, or across the Loop I, at and along lines AA’ and BB’ in Fig. 1, respectively. The radio profiles exhibit a typical double-horn structure indicative of the intensity variation across a spherical shocked shell. On the other hand, the H intensity distribution is almost flat except for the broad enhancements by local HII regions ( at and at ), which are unrelated to the NPS.
A - A’
B - B’
2.5 Intensity-intensity plots
The faintness of H emission in NPS can be more quantitatively displayed by plotting the H intensity against radio intensity in and around the objects using the so-called plots. Fig. 4 shows H intensity in the squared area ’T’ of Fig. 1 across the NPS-E (east) and NPS-W (west) plotted against 408 MHz after subtracting the 2.7 K cosmic background emission. Open circles are running means around individual centres of the bins with the bars indicating the dispersion in H intensity.
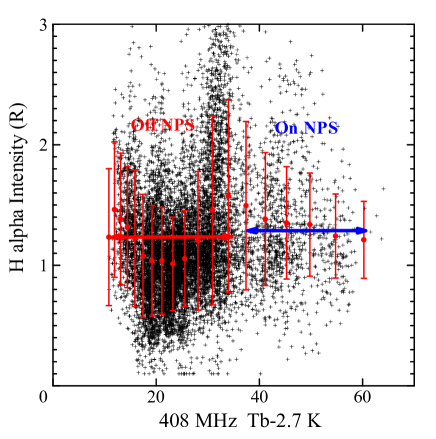
The mean H intensity in the OFF NPS region with K is measured to be R, representing the mean Galactic emission [Haffner et al. 2003] as indicated by the left side arrow marking the region in Fig. 4. The NPS shows up as the high- extension at K in the ON-NPS region marked by the right side arrow. So, we here define the NPS in this plot as the area with K, or K for spectral index of . We, then, measure the mean H intensity in this ON-NPS region to be R. Although the excess of ON-NPS over OFF-NPS value is R, we here estimate the excess to be R, considering the scatter and dispersion of the plotted values. This yields the H-to-radio intensity ratio of at 1.4 GHz.
The H intensity yields the upper limit to the emission measure as cm-6 pc for assumed electron temperature K. The values may be compared with those estimated for the SNR, Cygnus Loop, where K and R, yielding , and cm-6 pc for K as obtained from individual H observations [Hester et al. 1986]. We list the estimated values in table 1.
3 Comparison with SNRs
3.1 Maps
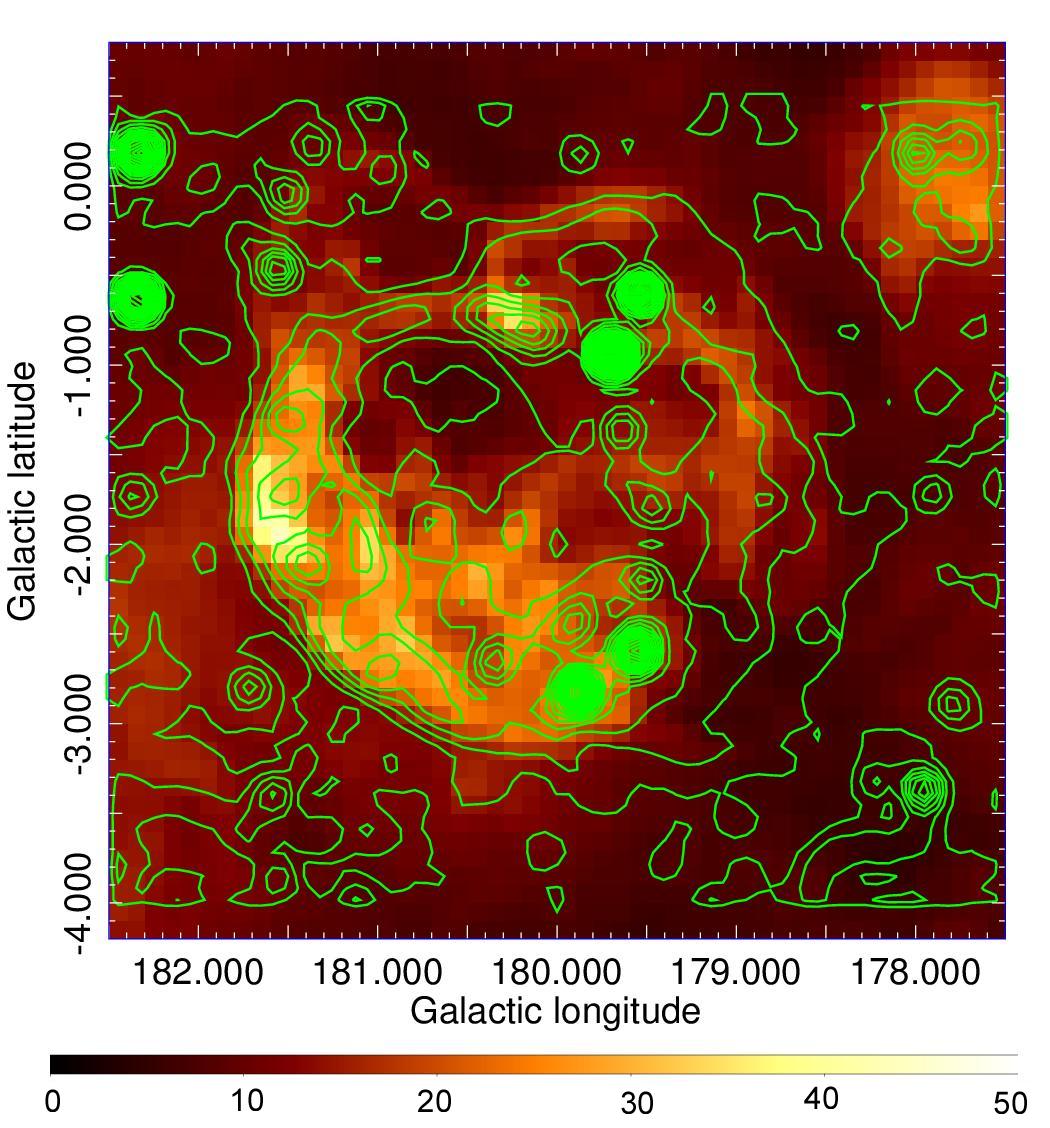
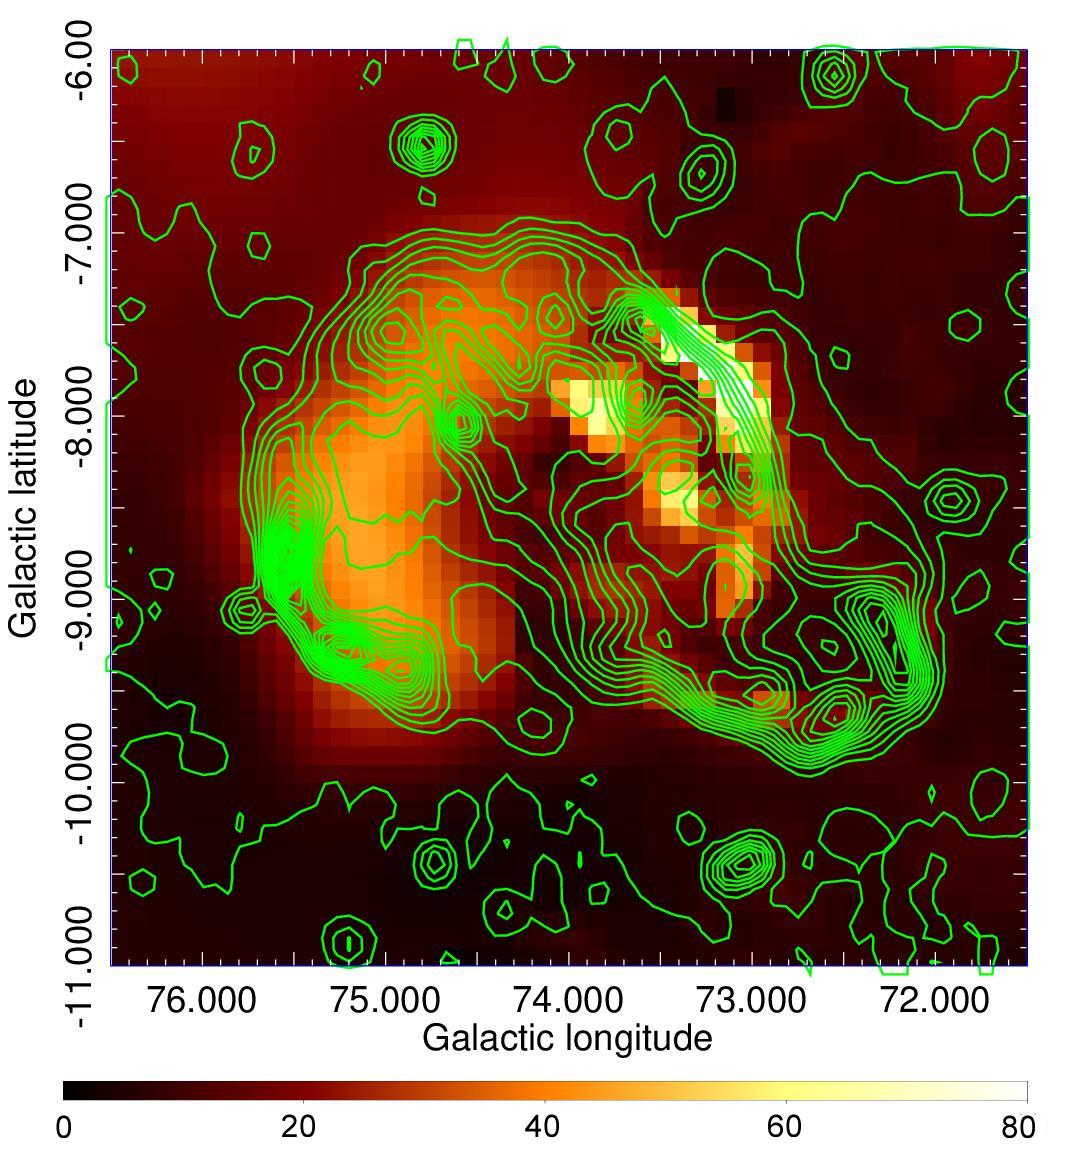
Fig. 5 shows overlays of radio continuum brightness at 1420 MHz of the Cygnus Loop and S147 on H intensity maps, where the radio maps were taken from the Bonn-100m Galactic plane survey [Reich et al. 1990, Reich et al. 1997]. The SNRs are visible both in radio and H emissions. Such H-radio association is often observed in Galactic radio SNRs [Uyanıker et al. 2004, Xiao et al. 2008], and seems also to happen in the spiral galaxy M31 [Braun & Walterbos 1993]. On the other hand, H is hardly visible in the NPS despite the clear and sharp radio ridge as shown in Figs 1 and 2. The NPS is, thus, extraordinarily fainter in H compared with the usual SNRs.
3.2 Spectra (SED)
Fig. 6 shows variation of peak intensities at various frequencies along the NPS ridge as obtained using background-filtered (BGF) maps [Sofue & Reich 1979] of the radio and H sky surveys. The BGF subtracts background emission and creates a nearly zero-adjusted intensity distribution of sources with scale sizes greater than a smoothing beam width111The ’background’ is defined as a smoothed map after iterative clipping of peaky sources, so that it traces the valleys of the intensity distribution. . We used a box-shaped one-dimensional smoothing beam with full width of in the longitude direction at each latitudinal grid. The one-dimensional smoothing was so chosen that it avoids unnecessary smearing effect by the steep intensity gradient perpendicular to the Galactic disc. Although the angular resolutions are different at different frequencies, the NPS is sufficiently resolved, and we used the peak intensities read on the thus obtained BGF maps for the spectral analysis in this section.
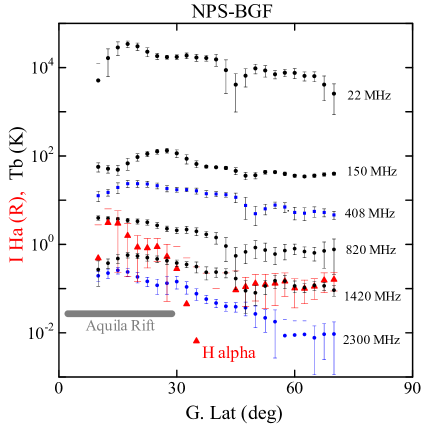
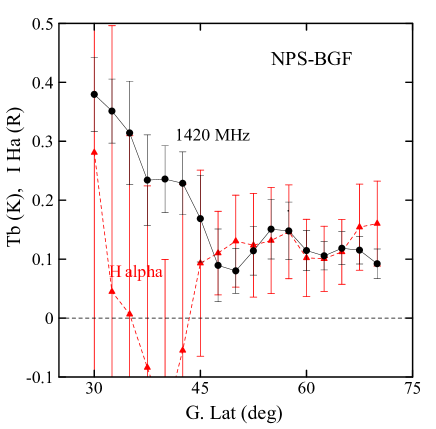
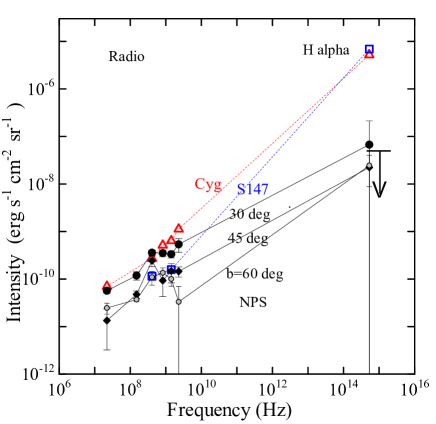
Fig. 7 shows a spectral energy distribution (SED) of the NPS at , and as obtained from the intensity plot along the NPS ridge shown in Fig. 6. We also plot SEDs of the northern shell edge of Cygnus Loop and eastern edge of S147. The background emissions around SNRs are subtracted by measuring averaged brightness in a small area without significant emission features about half a shell radius outside each shell edge at the same Galactic latitude. The H extinction has been corrected by and 0.6 mag., respectively, for Cygnus Loop and S147, as described in section 3.4. However, the correction is not applied to the NPS, because we here compare the spectra, when they are assumed to be the same type (SNR-type) objects, and so the NPS is assumed to be located at a distance of pc with negligible extinction.
The radio spectra of NPS and SNRs are consistent with those from more accurate analyses [Iwashita et al. 2023, Xiao et al. 2008, Uyanıker et al. 2004], and show that the radio intensities of the NPS and SNRs are comparable. However, a significant difference is found at H, where the NPS is fainter than SNRs by two orders of magnitude. The upper limit to the H intensity of the NPS as obtained from the analysis is indicated by the arrow.
3.3 TT
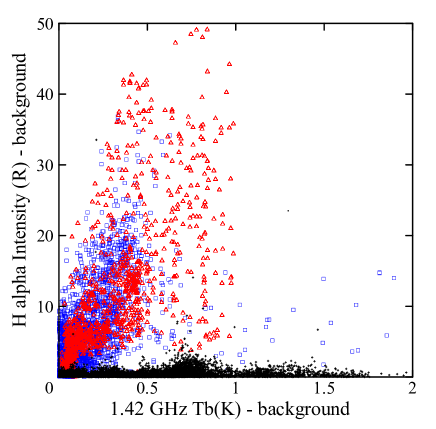
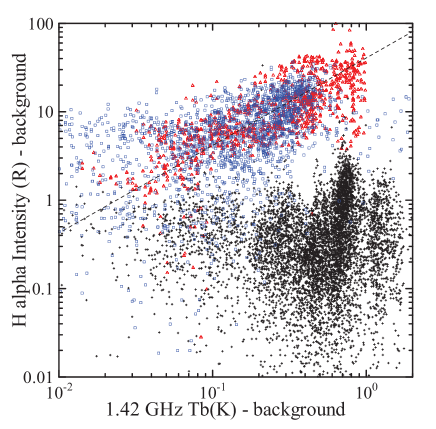
In Fig. 8 we display plots in linear and logarithmic scaling for the SNRs shown in Fig. 5 in comparison with that of the NPS in region T of Fig. 1. The lowest values of H and radio intensities in each plot representing the background emission are subtracted. The plots for the SNRs indicate that the H intensity is well correlated with the radio intensity by a relation . Using the gradient of the linear plot in the upper panel we obtain the H-to-radio intensity ratio of both for Cygnus Loop and S147. On the other hand, the NPS’s plot shows no clear correlation between H and radio intensities.
| Object | Quantity | EM (cm-6 pc ) | (K) | Remark | |
| NPS | X ray (3/4 keV) | cts/s/amin2 | (0.3 keV) | 1, 2, 3 | |
| H for X-ray | R | ibid () | for K | ||
| H observed here | R | for K | |||
| H observed here | R | for K | |||
| Radio 1.42 GHz | K | ||||
| H/radio intensity ratio | |||||
| Cygnus Loop | Xray (3/4 keV) | cts/s/amin2 | (0.5 keV) | 4 | |
| H | R | for K | 5 | ||
| Radio 1.42 GHz | K | ||||
| H/radio intensity ratio | Fig. 8. |
1. X-ray intensity was read from ROSAT all-sky map at 3/4 keV (R4 band) [Snowden et al. 1997] (1 cts/s/arcmin2 = 400 Jy sr-1 erg cm-2 s-1 keV-1); 2,3:[Kataoka et al. 2013, Yamamoto et al. 2022]; 4. [Uchida et al. 2008]; 5.[Hester et al. 1986].
3.4 Interstellar extinction
The radio continuum emissions are absorption free in the circumstances discussed here regardless of the distance. In the SNR hypothesis, which assumes a distance to NPS less than pc, the interstellar dust extinction of the H emission is negligible in the entire Loop I even at low or zero latitudes, because it is located in front of the Aquila Rift at a distance of kpc [Sofue 2015, Sofue & Nakanishi 2017]. This assumption is used in the figures where NPS and SNRs are compared.
The SNR Cygnus Loop is observed to have mag, or [Fesen et al. 2018]. S147 has foreground extinction of mag () [Fesen et al. 1985], and mag or including the internal extinction [Chen et al. 2017]. Therefore, the H intensities observed toward Cygnus Loop and S147 in Fig. 5 and 8 are under-estimated by about factors of 1.2 and 1.7, respectively. These factors for the SNRs are corrected in Fig. 7 in order to compare with NPS as a local object with negligible extinction.
In the GC explosion hypothesis of NPS, which assumes a distance of kpc, the optical (visual) extinction can be estimated by the general law relating it to HI column density, , by
| (4) |
[Predehl & Schmitt 1995]. Measuring the HI column density from the all-sky integrated HI intensity map [Kalberla et al. 2007], we obtain H cm-2 at , at , and at . Then, assuming [Gordon et al. 2003]
| (5) |
we obtain , 0.31 and mag. at , , and , respectively. Or, the H intensities are under-estimated by a factor of 1.6, 1.3 and 1.07, respectively, at these latitudes. The region closer to the low galactic latitudes of NPS suffers from heavier extinction by the dust lane of the Aquila Rift, where we cannot give a conclusive discussion.
4 Summary and Discussion
4.1 Summary
Analysis has shown that the H-to-1.4 GHz intensity ratio for NPS () is more than two orders of magnitude smaller than that for typical shell-type SNRs, Cygnus Loop and S147 (). No evidence of H association was found along NPS, even towards the brightest and sharpest ridge at . The low H intensity favours the GC explosion model, which postulate the distance of kpc, over the local supernova explosion model.
Below we discuss the implication of the results for the two models about the origin of NPS. In either model of local or GC origin, it should be noted that NPS is much larger in size than the other known SNRs or bubbles. This may lead to various differences in environments and physical conditions where the NPS is situated. The value would be useful to distinguish such differences from each other regardless of the size and distance.
4.2 On the local bubble model
It is difficult to interpret the H-dark NPS as an ordinary supernova remnant such as the Cygnus Loop or S147 that exploded in the dense ( H cm-3) and cold ( K) Galactic disc, where the hydrogen recombination is high and the shock compressed shells efficiently emit H line at R. If NPS is a remnant of multiple supernovae exploded in a local OB association, much stronger shock waves would cause brighter H. If it is a similar object to the Orion-Eridanus super bubble [Pon et al. 2016] as seen in Fig. 1 around , it should be as bright as R. If it is associated with high-latitude HI spurs at local velocities [Heiles et al. 1980], then the shocked area in touch with the NPS should emit H by the same mechanism as above. Thus, the local origin models have difficulty explaining the H faintness of NPS.
4.3 On the GC explosion model
The H faintness can be naturally explained by the GC explosion model. The model postulates a shock wave propagating in the Galactic halo at K. The temperature in NPS is observed to be much higher at K, while the emission measure is rather small at cm-6 pc [Kataoka et al. 2013, Kataoka et al. 2018, Yamamoto et al. 2022]. In such a hot plasma the hydrogen recombination rate is times that in the ISM at K, [Hummer 1994]. Knowing that 1 R at this temperature corresponds to 2.25 cm-6 pc [Haffner et al. 2003], it leads to R, which is consistently below the observed upper limit of R. Thus, the GC bubble model seems plausible to explain the observed H faintness of the NPS.
The H property of NPS gives further constraint on the GC origin model. A galactic-scale wind such as observed in starburst galaxy NGC 3079 [Cecil et al. 2002] or M82 [Lehnert et al. 1999] presumes a large H shell in the halo. However, such an H shell is not observed in NPS. So, NPS may be a more spherical bubble directly exposed to the halo’s hot plasma. Even so, the root region might emit H associated with the 1-kpc conical wind of HI [Sofue 2022, Sofue & Kataoka 2021] and X-ray [Bland-Hawthorn & Cohen 2003], but it is hidden behind the Aquila Rift. In this case the NPS will be a giant bubble similar to that observed in NGC 253, where 1-kpc scale H wind blows near the nucleus [Westmoquette et al. 2011] and a giant X-ray and radio bubbles are expanding into the halo [Sofue & Vogler 2001].
Acknowledgements
The data analysis was carried out on the computer system at the Astronomy Data Center of the National Astron. Obs. of Japan. The authors are indebted to the groups of the Bonn-Stockert radio (Dr. P. and W. Reich) and WHAM (Dr. L. M. Haffner) surveys for the archival data base. A part of this research was supported by Japan Science and Technology Agency (JST) ERATO Grant Number JPMJER2102 and JSPS Kakenhi Grant Number 20K20923, Japan.
Data availability
The radio and H fits data were downloaded from the URL:
https://lambda.gsfc.nasa.gov/product/foreground/ fg_diffuse.html,
and
http://www3.mpifr-bonn.mpg.de/survey.html.
Conflict of interest
The authors declare that there is no conflict of interest.
References
- [Aschenbach & Leahy 1999] Aschenbach, B., Leahy, D. A. 1999, A&A, 341, 602
- [Berkhuijsen 1971] Berkhuijsen, E. M. 1971, A&A, 14, 359
- [Berkhuijsen et al. 1971] Berkhuijsen, E. M., Haslam, C. G. T., Salter, C. J. 1971, A&A, 14, 252
- [Bland-Hawthorn & Cohen 2003] Bland-Hawthorn, J., Cohen, M. 2003, ApJ, 582, 246
- [Braun & Walterbos 1993] Braun, R., Walterbos, R. A. M. 1993, A&AS, 98, 327
- [Cecil et al. 2002] Cecil, G., Bland-Hawthorn, J., Veilleux, S. 2002, ApJ, 576, 745
- [Chen et al. 2017] Chen, B.-Q., Liu, X.-W., Ren, J.-J. et al. 2017, MNRAS, 472, 3924
- [de Zeeuw et al. 1999] de Zeeuw, P. T., Hoogerwerf, R., de Bruijne, J. H. J. et al. 1999, AJ, 117, 354
- [Dickinson 2018] Dickinson, C. 2018, Galaxies, 6, 56.
- [Egger & Aschenbach 1995] Egger, R. J., Aschenbach, B. 1995, A&A, 294, L25
- [Fesen et al. 1985] Fesen, R. A., Blair, W. P., Kirshner, R. P. 1985, ApJ, 292, 29
- [Fesen et al. 2018] Fesen, R. A., Neustadt, J. M. M., Black, C. S. et al. 2018, MNRAS, 475, 3996
- [Gordon et al. 2003] Gordon, K. D., Clayton, G. C., Misselt, K. A. et al. 2003, ApJ, 594, 279
- [Haffner et al. 2003] Haffner, L. M., Reynolds, R. J., Tufte, S. L. et al. 2003, ApJS, 149, 405
- [Haffner et al. 2010] Haffner, L. M., Reynolds, R. J., Madsen, G. J. et al. 2010, The Dynamic Interstellar Medium: A Celebration of the Canadian Galactic Plane Survey, 438, 388 doi:10.48550/arXiv.1008.0612
- [Hanbury Brown et al. 1960] Hanbury Brown, R., Davies, R. D., Hazard, C. 1960, The Observatory, 80, 191
- [Haslam et al. 1982] Haslam, C. G. T., Salter, C. J., Stoffel, H., Wilson, W. E. 1982, AAS, 47, 1
- [Heiles et al. 1980] Heiles, C., Chu, Y.-H., Troland, T. H. et al. 1980, ApJ, 242, 533
- [Hester et al. 1986] Hester, J. J., Raymond, J. C., Danielson, G. E. 1986, ApJ, 303, L17
- [Hummer 1994] Hummer, D. G. 1994, MNRAS, 268, 109
- [Iwashita et al. 2023] Iwashita, R., Kataoka, J., Sofue, Y. 2023, submitted to MNRAS.
- [Jonas & Baart 1995] Jonas, J. L. Baart, E. E. 1995, ApSS, 230, 351
- [Kalberla et al. 2007] Kalberla P. M. W., Dedes L., Kerp J., Haud U., 2007, A&A, 469, 511
- [Kataoka et al. 2013] Kataoka, J., Tahara, M., Totani, T. et al. 2013, ApJ, 779, 57
- [Kataoka et al. 2018] Kataoka J., Sofue Y., Inoue Y., Akita M., Nakashima S., Totani T., 2018, Galax, 6, 27
- [Kataoka et al. 2021] Kataoka J., Yamamoto, M., Nakamura, Y. et al., 2021, ApJ, 908, 14
- [Lallement et al. 2022] Lallement, R., Vergely, J. L., Babusiaux, C. et al. 2022, A&A, 661, A147
- [Landecker & Wielebinski 1970] Landecker, T. L., Wielebinski, R. 1970, Australian Journal of Physics and Astrophysics Supplement 16, 1
- [Lehnert et al. 1999] Lehnert, M. D., Heckman, T. M., Weaver, K. A. 1999, ApJ, 523, 575
- [Pon et al. 2016] Pon, A., Ochsendorf, B. B., Alves, J. et al. 2016, ApJ, 827, 42
- [Predehl & Schmitt 1995] Predehl, P, Schmitt, J. H. M. M. 1995, A&A, 293, 889
- [Predehl et al. 2020] Predehl, P., Sunyaev, R. A., Becker, W. et al. 2020, Nature, 588, 227
- [Reich et al. 1990] Reich, W., Reich, P., Fürst, E. 1990, A&AS, 83, 539
- [Reich et al. 1997] Reich, P., Reich, W., Fürst, E. 1997, A&AS, 126, 413
- [Reich et al. 2001] Reich, P., Testori, J. C., Reich, W. 2001, A&A, 376, 861
- [Roger et al. 1999] Roger, R. S., Costain, C. H., Landecker, T. L. et al. 1999, A&AS, 137, 7
- [Snowden et al. 1997] Snowden S. L. et al., 1997, ApJ, 485, 125
- [Sofue 1977] Sofue, Y. 1977, AA 60, 327
- [Sofue 2015] Sofue, Y. 2015, MNRAS, 447, 3824
- [Sofue 2022] Sofue, Y. 2022, PASJ, 74, L23
- [Sofue et al. 2016] Sofue Y., Habe A., Kataoka J. et al. 2016, MNRAS, 459, 108
- [Sofue et al. 1974] Sofue, Y., Hamajima, K., Fujimoto, M. 1974, PASJ, 26, 399
- [Sofue & Kataoka 2021] Sofue, Y., Kataoka, J. 2021, MNRAS, 506, 2170
- [Sofue & Nakanishi 2017] Sofue, Y ., Nakanishi, H. 2017, MNRAS, 464, 783
- [Sofue & Reich 1979] Sofue, Y., Reich, W. 1979 AAS 38, 251
- [Sofue & Vogler 2001] Sofue, Y, Vogler, A. 2001, A&A, 370, 53
- [Uchida et al. 2008] Uchida, H., Tsunemi, H., Katsuda, S. et al. 2008, ApJ, 688, 1102
- [Uyanıker et al. 2004] Uyanıker, B., Reich, W., Yar, A. et al. 2004, A&A, 426, 909
- [van den Bergh et al. 1973] van den Bergh, S., Marscher, A. P., Terzian, Y. 1973, ApJS, 26, 19
- [Westmoquette et al. 2011] Westmoquette, M. S., Smith, L. J., Gallagher, J. S. 2011, MNRAS, 414, 3719
- [Wolleben 2007] Wolleben, M. 2007, ApJ, 664, 349
- [Xiao et al. 2008] Xiao, L., Fürst, E., Reich, W. et al. 2008, A&A, 482, 783
- [Yamamoto et al. 2022] Yamamoto, M., Kataoka, J., Sofue, Y. 2022, MNRAS, 512, 2034