Particle-Based Simulations of Electrophoretic Deposition with Adaptive Physics Models
Abstract
This work represents an extension of mesoscale particle-based modeling of electrophoretic deposition (EPD), which has relied exclusively on pairwise interparticle interactions described by Derjaguin-Landau-Verwey-Overbeek (DLVO) theory. With this standard treatment, particles continuously move and interact via excluded volume and electrostatic pair potentials under the influence of external fields throughout the EPD process. The physics imposed by DLVO theory may not be appropriate to describe all systems, considering the vast material, operational, and application space available to EPD. As such, we present three modifications to standard particle-based models, each rooted in the ability to dynamically change interparticle interactions as simulated deposition progresses. This approach allows simulations to capture charge transfer and/or irreversible adsorption based on tunable parameters. We evaluate and compare simulated deposits formed under new physical assumptions, demonstrating the range of systems that these adaptive physics models may capture.
keywords:
American Chemical Society, LaTeXIR,NMR,UV
1 Introduction
Electrophoretic deposition (EPD) is a well-studied process where colloidal particles, driven by an electric field, accumulate at an electrode to form a deposit. The accessible property space of these resulting deposits is enormous due to the large number of independently tunable parameters governing EPD, such as the electrode substrate , electric field strength and waveform , particle morphology and loading , supernatant characteristics , and so on. As such, EPD is found in a wide variety of applications, ranging from neural electrodes 1, 2, biomaterials processing 3, 4, 5, high-contrast low-voltage 6, 7 and quantum dot-based displays 8, battery 9 and supercapacitor 10 manufacturing, fog harvesting 11, superhydrophobic 12 and energetic 13 coatings, etc. Though efforts to optimize EPD deposits must be application-specific, the community typically relies on a general set of long-standing models for the stability of colloids and their deposition. For instance, particles are assumed to interact strictly according to Derjaguin-Landau-Verwey-Overbeek (DLVO) theory and adhere to a deposition rate that scales linearly with the strength of a uniformly applied field 14.
Fortunately, numerous models exist to accommodate the nuances of actual EPD systems. Ferrarri, et. al.’s extensive review 15 lays out several analytical expressions that account for commonly encountered EPD scenarios, including flat 14 and cylindrical electrodes 16 with variable 17 and/or highly concentrated 18 particle loading. Empirically validated models exist that account for suspension resistivity variations alone 19 and in combination with solid loading 20. Several models rely on finite element analysis (FEA) to simulate coating at the industrial-scale 21 and deposit thickness variations that result from electrode edge effects 22. A recent multi-physics FEA model accounts for transient phenomena arising in a specialized EPD cell with cross flow across empirical time and length scales. It reproduces actual deposit morphologies over a wide range of inlet flow rates and applied voltages 23. Finite element based approaches offer unique insights, specifically into how the deposition thickness evolves under (possibly) complicated electrode geometries and electric, flow, and particle concentration fields.
Particle-based models (PBMs) elucidate how deposit microstructure depends on the interplay between inter-particle and electric field forces during deposition. Specifically, PBMs compute the trajectory of all colloidal particles in a simulated control volume using Newton’s equations of motion and assumed interaction potentials that model particle-particle interactions in a suspension bounded by a charged electrode. As such, PBMs reveal how particles accumulate at the electrode, though typically over shorter time scales than FEA-based simulations due to greater computational expense. PBM simulations accurately reproduce analytical models of bulk electrophoretic motion across an expansive experimentally relevant regime 24 and have elucidated how the degree of ordering within multi-layed deposits depends on both ionic concentration and field strength 25. The same PBM applied to sub-monolayer deposits revealed correlations between electrochemical properties and composition of the supernatant with coating homogeneity 2. PBM particle-spacing predictions were experimentally validated using a novel EPD cell that enables in situ characterization. Considering long-standing critiques of DLVO 26 applied to the wide range of available colloidal suspensions, it is fortunate that the underlying inter-particle potential computed by PBMs is fully customizable.
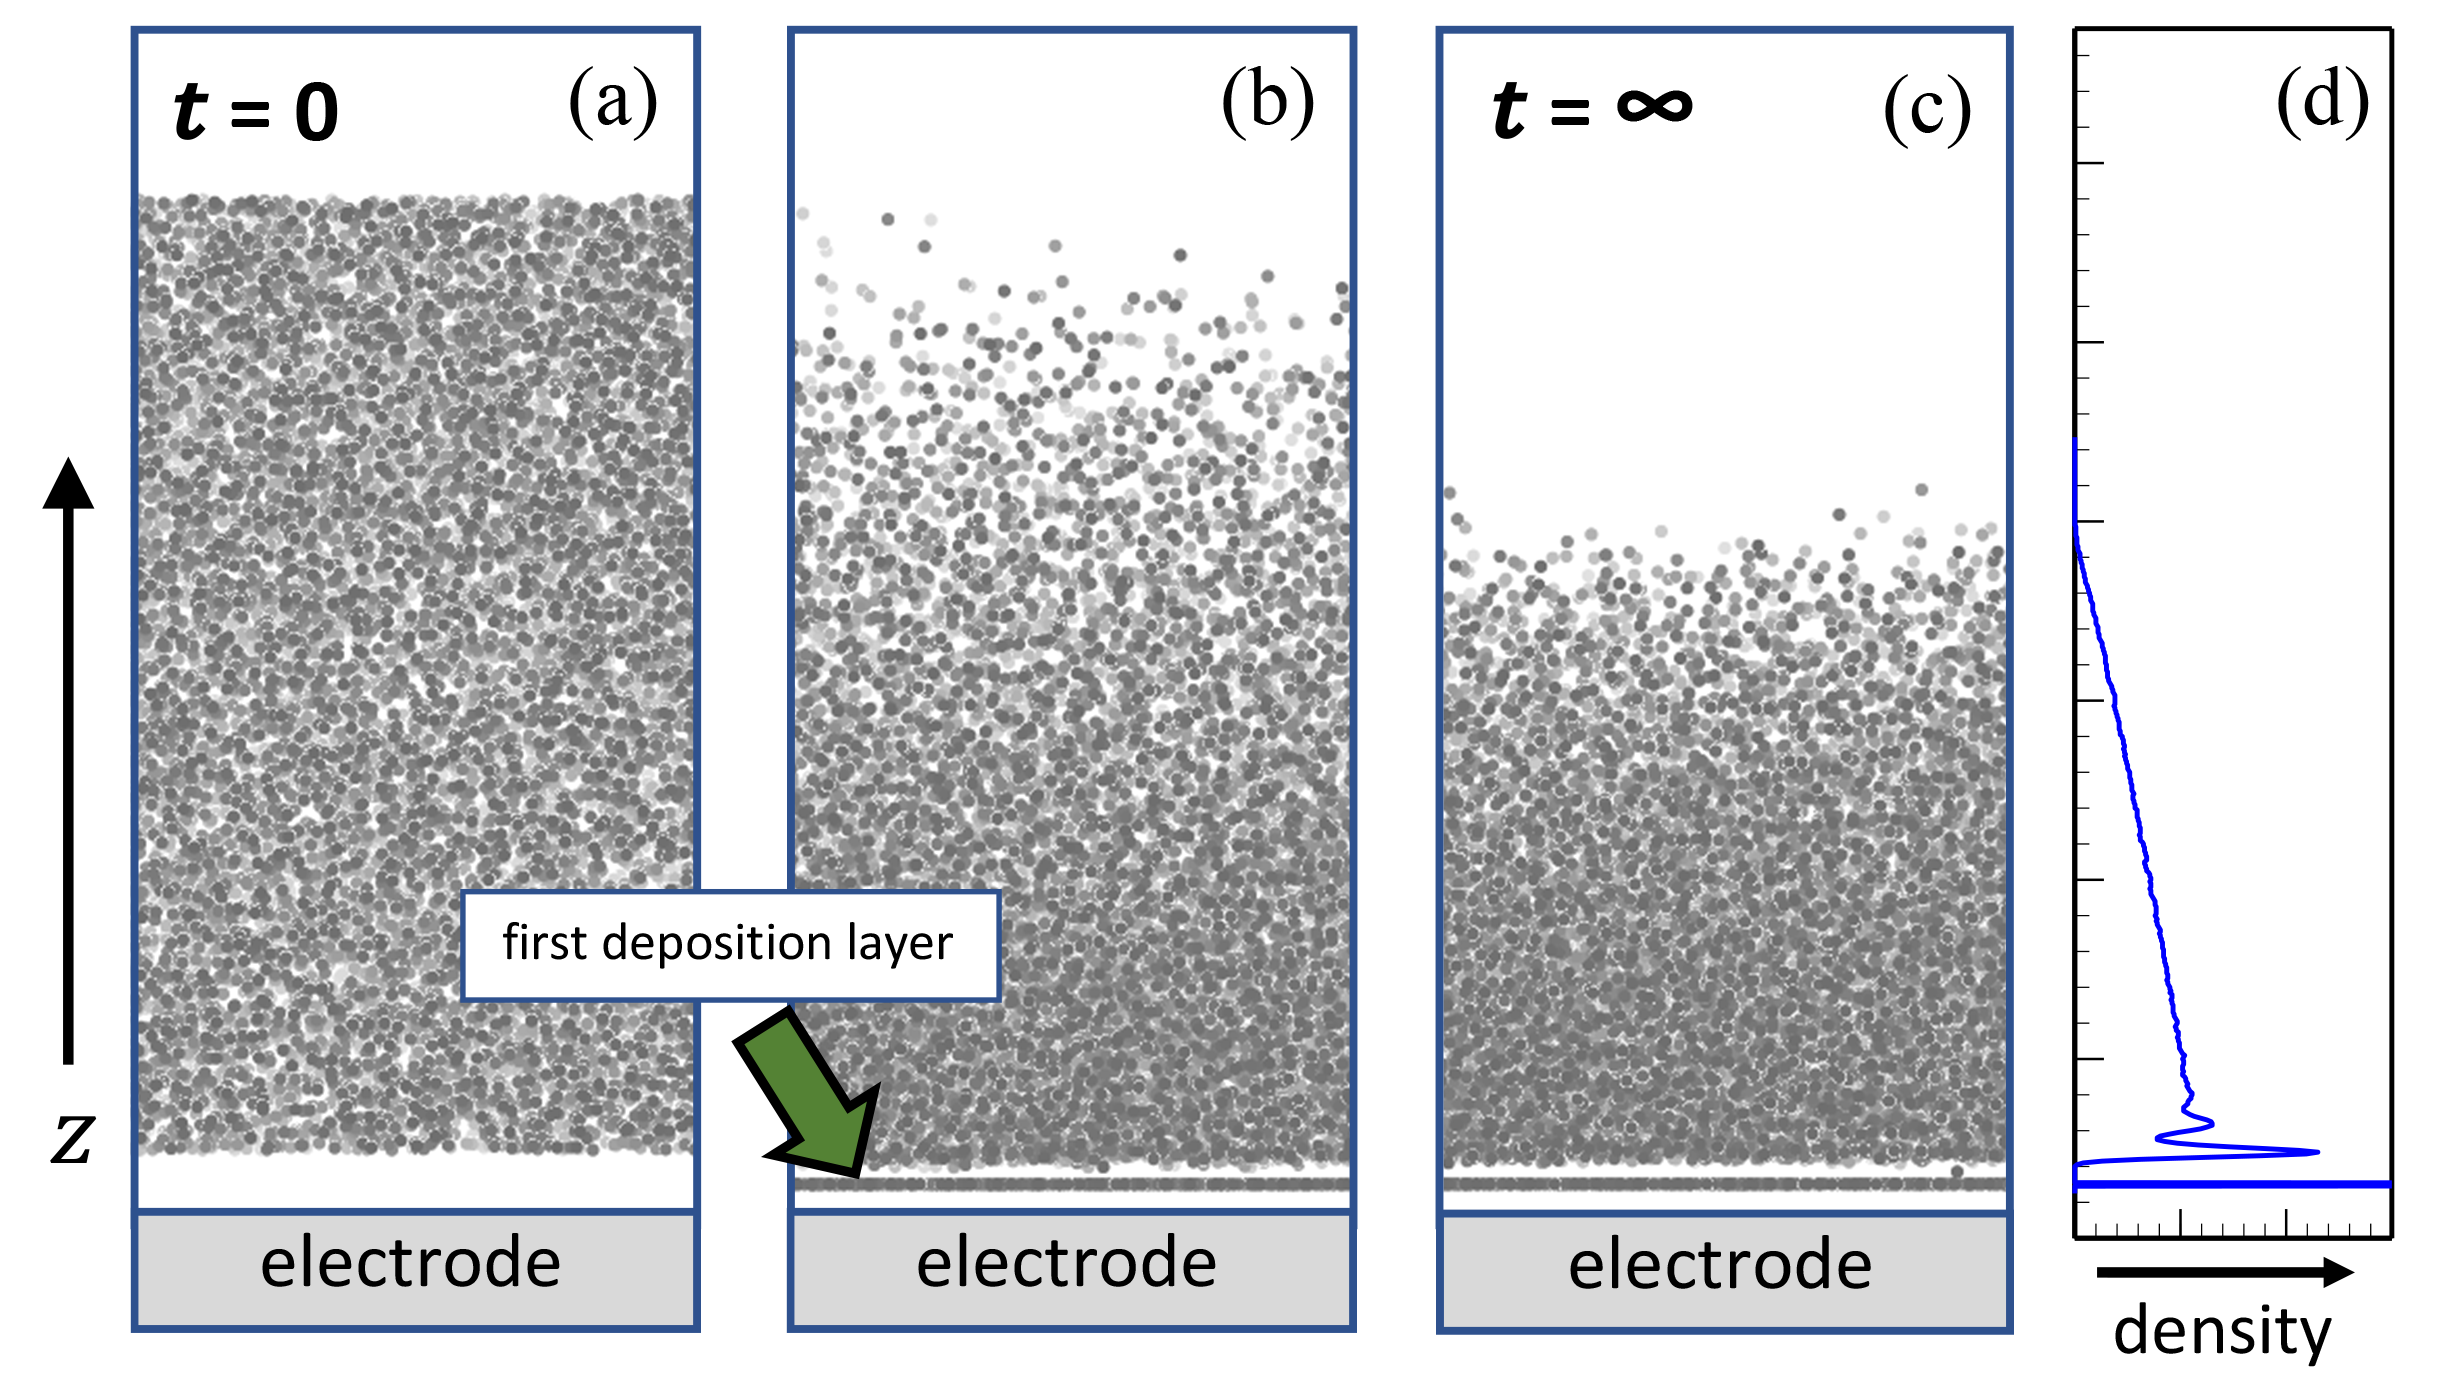
To date, PBMs exclusively assumed that interparticle interactions are of a fixed functional form that follows DLVO theory. Figure 1 shows representative simulation snapshots from a particle-based EPD simulation. Panel (a) shows the starting configuration, which consists of randomly distributed colloid particles. When the external electric field is applied (panel (b)), the particles begin to migrate in the direction, toward the electrode, assembling into a deposit. Panel (c) shows the representative simulation at equilibrium. We note that the position of each particle is stored and represented as a point, not a space-filling sphere, in these simulations and the data shown in this work. This representation allows us to clearly observe surface-induced ordering of the deposits onto the geometrically flat electrode in the snapshots by illustrating each particle as a gray point whose radius is smaller than the particle’s physical radius. The apparent ‘space’ between the first deposition layer and the electrode (and the first layer and the bulk deposit) emerges from and is enhanced by this representation. Gray rectangles are included in this overview figure to indicate the position of the electrode. Subsequent simulation snapshots show only the particles. The density profile in panel (d) corresponds to the equilibrium configuration in (c) and quantifies the surface-induced ordering. We again note that this data captures the center points of the particles. Density profiles specifically report the density of the particles’ centers, not a bulk density, which enhances our ability to observe ordering of particles in the deposit.
In this conventional PBM approach, interparticle interactions and colloidal motions described by an unchanging physics model persist at all times during deposition. Given the diversity of colloidal suspension and deposition conditions, we argue that many EPD systems of interest exhibit behavior not described by a static set of pairwise interactions defined a priori. Thus, we pose a PBM framework that allows for exploration of particles with physics models that may change on-the-fly according to a set of pre-defined heuristics. With these new models, we simulated parameter sweeps that vary the applied electric field and characteristic interparticle electrostatic repulsion. Specifically we simulate conditions that can occur in real systems in which particles can discharge and/or become immobile upon deposition e.g. when a metal nanoparticle deposits on a metal surface and forms a covalent or metallic bond at the interface. It is beyond the scope of this work to explore all parameter space made accessible by these new simulation protocols. Nevertheless, we simulate experimentally-accessible EPD conditions and compare particle packing density and degree of ordering resulting from the four model types. Further, the physical parameters used in these simulations may be adjusted to explore any EPD system of interest.
2 Model and simulation details
2.1 Interaction potentials
Mesoscale particle dynamics simulations are based on the work of Giera and collaborators. 25 We refer the reader to this work for a full description of interaction potentials and model parameterization, but summarize the components most salient to the present work here.
The total energy acting on a colloid particle is a combination of the pairwise sum of solvent-colloid, colloid-colloid, and system-colloid interactions,
| (1) |
where is the distance between an - colloid pair and is a colloid’s distance from the electrode, here represented by a flat, uncharged plane in the - plane. The solvent is treated implicitly by adding pairwise dissipative lubrication and Brownian forces. 27, 28, 29, 30, 31
Pairwise colloidal interactions are treated with the DLVO potential,
| (2) |
which represents the sum of screened electrostatic repulsions by a variant of the Yukawa potential, 32 , and captures steric repulsion and van der Waals attractions separately 33 as detailed in Reference 25. Since this work is inspired by the deposition of platinum nanoparticles we use a different value for the Hamaker constant than Reference 25, where the model was based on polystyrene particles: J in this work versus J in Reference 25.34, 35 The Yukawa potential has an exponential form, , in which the Debye length () is the characteristic interparticle distance where electrostatic repulsion between particles is important. In this work we consider several values of , defined as
| (3) |
where is the relative permittivity of the solvent, is the permittivity of free space, is Boltzmann’s constant, and is temperature. We note that this definition of holds for colloidal suspensions in a symmetrical electrolyte with , is the elementary charge, and is the bulk concentration of ions. As Eq. 3 indicates, the electrostatic repulsion between colloids is easy to tune empirically, especially in aqueous suspensions, e.g. increases as decreases via dilution, vice versa. For our particle-based simulations, the computational expense scales with the number of pairwise energies with , which increases with .
Interactions of the colloid with the electrode, , and the electric field, are single body potentials, i.e., a function of the particles’ -position. The colloid-wall interaction prevents the particles from moving through the simulation cell wall in the -direction, resulting in simulated deposition. Electrophoretic motion is simulated by application of a uniform, external electric field
| (4) |
where is the strength of the electric field and is the effective charge on a colloid particle in the direction perpendicular to the electrode, obtained from a force balance on a colloid particle experiencing steady-state hydrodynamics drag in an electric field. 36
2.2 Alternative deposition models
As described earlier, we introduce two new physical scenarios that may be employed individually or simultaneously to more accurately simulate a wide range of EPD applications.
In the first scenario, immobile, we consider systems where particle mobility decreases after deposition and model the extreme case of completely immobile deposited particles, e.g. when practically irreversible chemical bonds between particle and wall or particle and particle form upon deposition. Our implementation consists of two parts. The first tracks each particle-electrode distance (equivalent to in these simulations). When a given particle is within a cutoff distance () of the electrode, the particle is flagged as deposited and prevented from moving by removing it from the molecular dynamics integrator. Though this renders the particle immobile, the particle continues to be accounted for in all interaction potential calculations; the particle is only rendered immobile. The second component of this implementation accounts for similar deposition beyond the first colloid layer, necessary since all deposited particles beyond the first layer would have . To handle this deposition, we track the separation distances of all deposited-suspended - pairs during the simulation. If any mobile colloid particle is within of a deposited particle, the mobile particle is flagged as deposited and similarly removed from the integrator. Figure 2 (a) and (b) are schematics of this two part implementation.
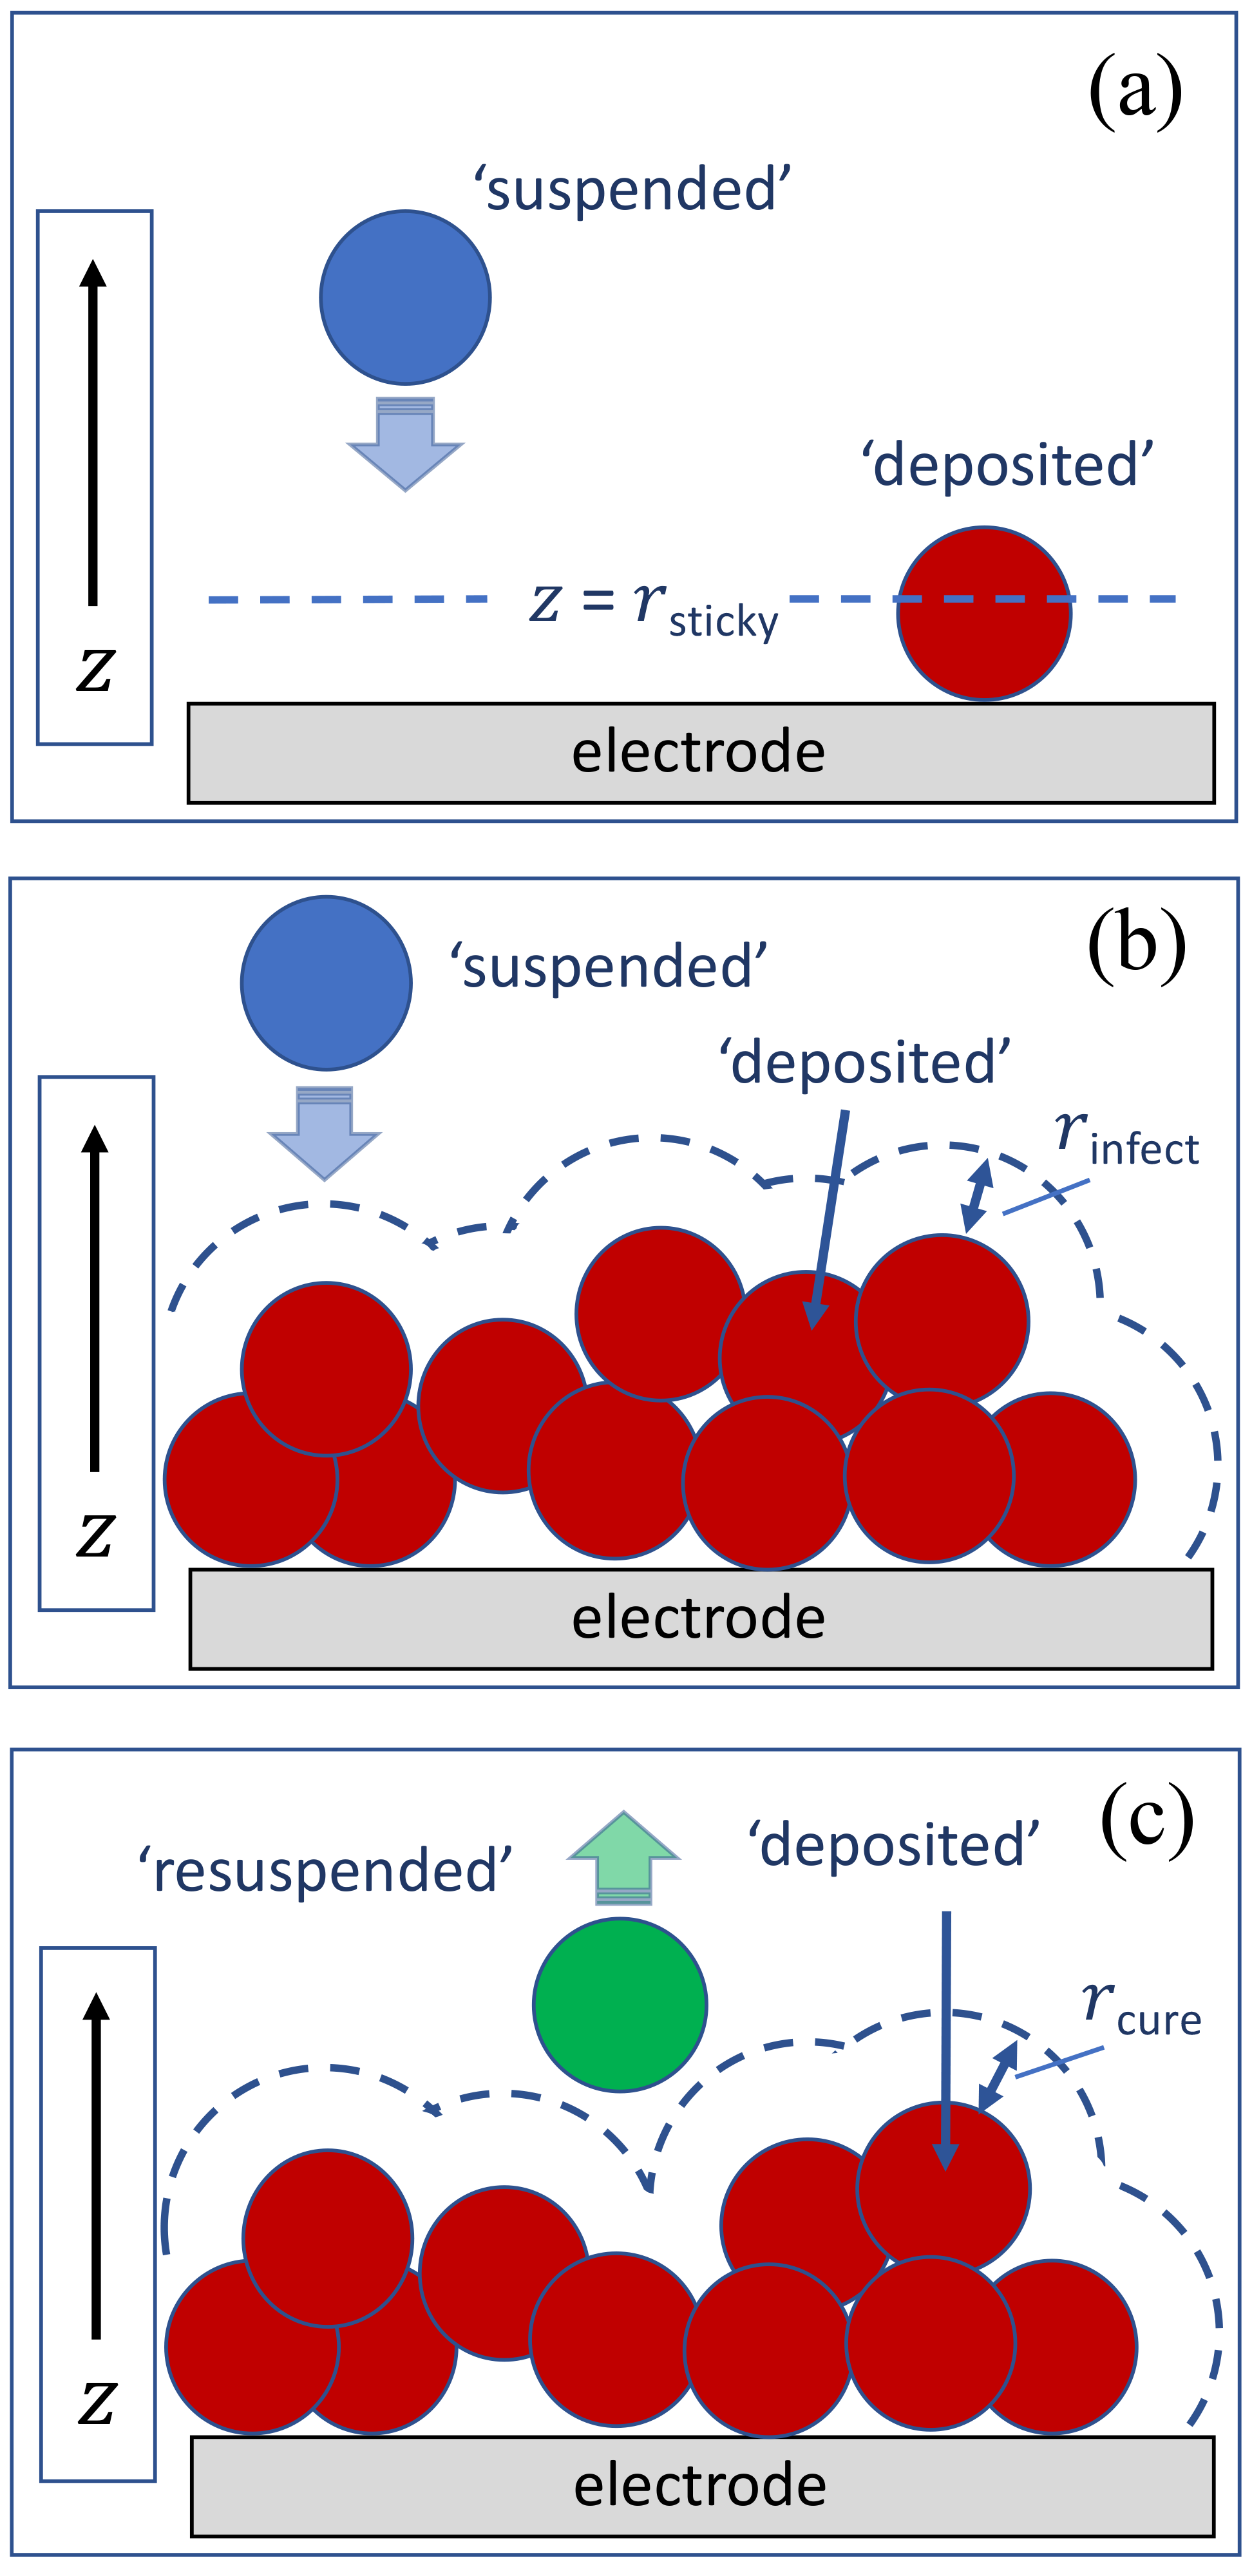
Another physically-relevant case not captured by existing PBMs is when a particle’s charge changes upon deposition due to being in intimate contact with the electrode, e.g. when a conductive contact between a metal particle and a metal electrode is established. This case includes particles deposited directly onto the electrode and particles that come into contact with the accumulating deposit, which is in contact with the electrode. Our proof-of-concept simulations capture this by making deposited particles assume the electrostatic interaction behavior of the electrode, in practice by zeroing the Yukawa potential between deposited and non-deposited particles. We refer to this scenario as decharge. This change to the newly-deposited particle’s force field is made when the particle-electrode distance is less than a designated cutoff distance, similar in implementation to the particle immobilization detailed above. Also similar to the immobilization scheme, particles tagged as deposited can ‘infect’ other particles that move within a cutoff distance of an altered particle. These other particles are then tagged as deposited and their force fields are modified accordingly. These implementations are summarized by the schematics in Figure 2(a) and (b). However, because these ‘infected’ particles may be mobile, additional considerations must be made for the case of desorption or resuspension. If no further adjustments were made, a rogue modified particle could become resuspended, diffuse into the bulk, and propagate its electrode-like ‘decharge’ electrostatics into the bulk suspension. To counter this non-physical behavior we add an additional state, ‘resuspended,’ where the ‘infected’ particle retains the altered electrostatics but loses the ability to change the electrostatics of other particles. This third scheme, shown in Figure 2 (c), flags the deposited particle as resuspended if it is not within a cutoff distance of either the electrode or other deposited particles.
The three schemes in Figure 2 were implemented as subroutines (‘fixes’) compatible with the 19-March-2020 release of the open source molecular dynamics environment LAMMPS. 37, 38 Source code for these schemes, named fix sticky, fix infect, and fix cure, is included in the Supporting Information.
In practice, combinations of the three implementations shown in Figure 2, sticky, infect, and cure, are applied to modify the physics models of colloid particles on-the-fly, enabling the immobile and/or decharge scenarios. Table 1 summarizes the changes to ‘deposited’ colloids when using any permutation of these alternative deposition models. For the remainder of this work, we use the nomenclature standard/decharge and mobile/immobile to indicate the off/on states of the two scenarios.
| Model Type | if = ‘deposited’… | |
|---|---|---|
| … | …immobilize? | |
| standard/mobile | no | no |
| decharge/mobile | yes | no |
| decharge/immobile | yes | yes |
| standard/immobile | no | yes |
2.3 Simulation parameters
The proof-of-principle simulations presented in this work model a system of 10 nm diameter spherical platinum particles in an aqueous suspension, as in on our earlier studies of neural electrode coatings. 1, 39 Table 2 summarizes the physical parameters used to specify these simulations. We note that two parameters of particular interest to EPD researchers, Debye length () and electric field strength (), were varied in our simulations. Three values of , 0.5, 5.0, and 50.0 nm, and three values of , 10, 50, and 250 kV/m, were used. The Yukawa potential for each respective was implemented with a smooth cutoff at the distance where was less than 1% of . See the Supporting Information for the determination of Yukawa potential cutoff distances. Varying and resulted in 9 parameter-based permutations and 4 deposition model permutations: a total of 36 total EPD simulations.
Each simulation consisted of 25,920 particles in a nm box at a bulk volume fraction of 0.05. In this bulk arrangement, the mean pairwise spacing of the particles equals . Starting configurations were generated by sequentially assigning randomized positions to particles whose pairwise distances are . Though smaller initial interparticle spacings are physically permissible, this approach led to the most robust performance of the LAMMPS integrator. The simulation cells are periodic in and with the short dimension () normal to the electrode. The periodic dimensions for all simulations were set to be twice the longest force cutoff distance, nm.
| description | symbol | value(s) |
|---|---|---|
| particle density | ||
| particle radius | ||
| number of particles | 25920 | |
| bulk volume fraction | 0.05 | |
| zeta potential | ||
| Hamaker constant34, 35 | J | |
| relative permittivity | 78.38 | |
| dynamic viscosity | ||
| temperature | ||
| Debye length | 0.5, 5, 50 nm | |
| electric field strength | 10, 50, 250 kV/m | |
| electrode deposition cutoff | 2.0 | |
| deposition proximity cutoff | 1.2 | |
| resuspension proximity cutoff | 1.4 |
Molecular dynamics simulations were performed using an integration time step of 10 ps. The simulated depositions were allowed to progress for 1 ms ( steps) and configurations were stored every steps. The computational resources required for these simulations is a strong function of . Using Lawrence Livermore National Laboratory’s Quartz supercomputer, with 2 18-core Intel Xeon E5-2695 processors per node, =0.5 nm simulations were completed in 17 hours of wall time on 8 nodes. Simulations with the longest Debye length, =50.0 nm, required 14 days of wall time on 25 nodes.
3 Results and discussion
Here we present an overview of the four model scenarios described in Table 1. Each scenario was run with three Debye lengths and under three electric fields for a total of 36 EPD simulations. This simulation set provides insights into various non-ideal deposition behaviour that can arise in real EPD systems, but are not accounted for in the standard DLVO particle-based model, termed here as standard/mobile. We present a quantitative overview of the four cases, discussing pertinent empirical systems that may exhibit such deposition phenomena. We then walk through our analysis of density profiles and first-layer particle ordering and present quantitative comparisons between the EPD model types across our simulation set.
Figure 3 shows snapshots of simulated EPD after 1 ms of simulation time for each of these extremes of possible physical EPD phenomena. These representative simulations are all performed with = 5.0 nm and a large, though experimentally accessible, electric field of = 250 kV/m. Panel (a) shows the standard/mobile approach, which simulates deposition using consistent application of DLVO interaction potentials and physics model detailed in above and in Reference 25. We represent the colloid particles in Figure 3a with gray color to emphasize that none of the new deposition modes introduced in this work are implemented in the standard/mobile simulations: The physics model for bulk, deposited, and re-suspended colloid particles is constant.
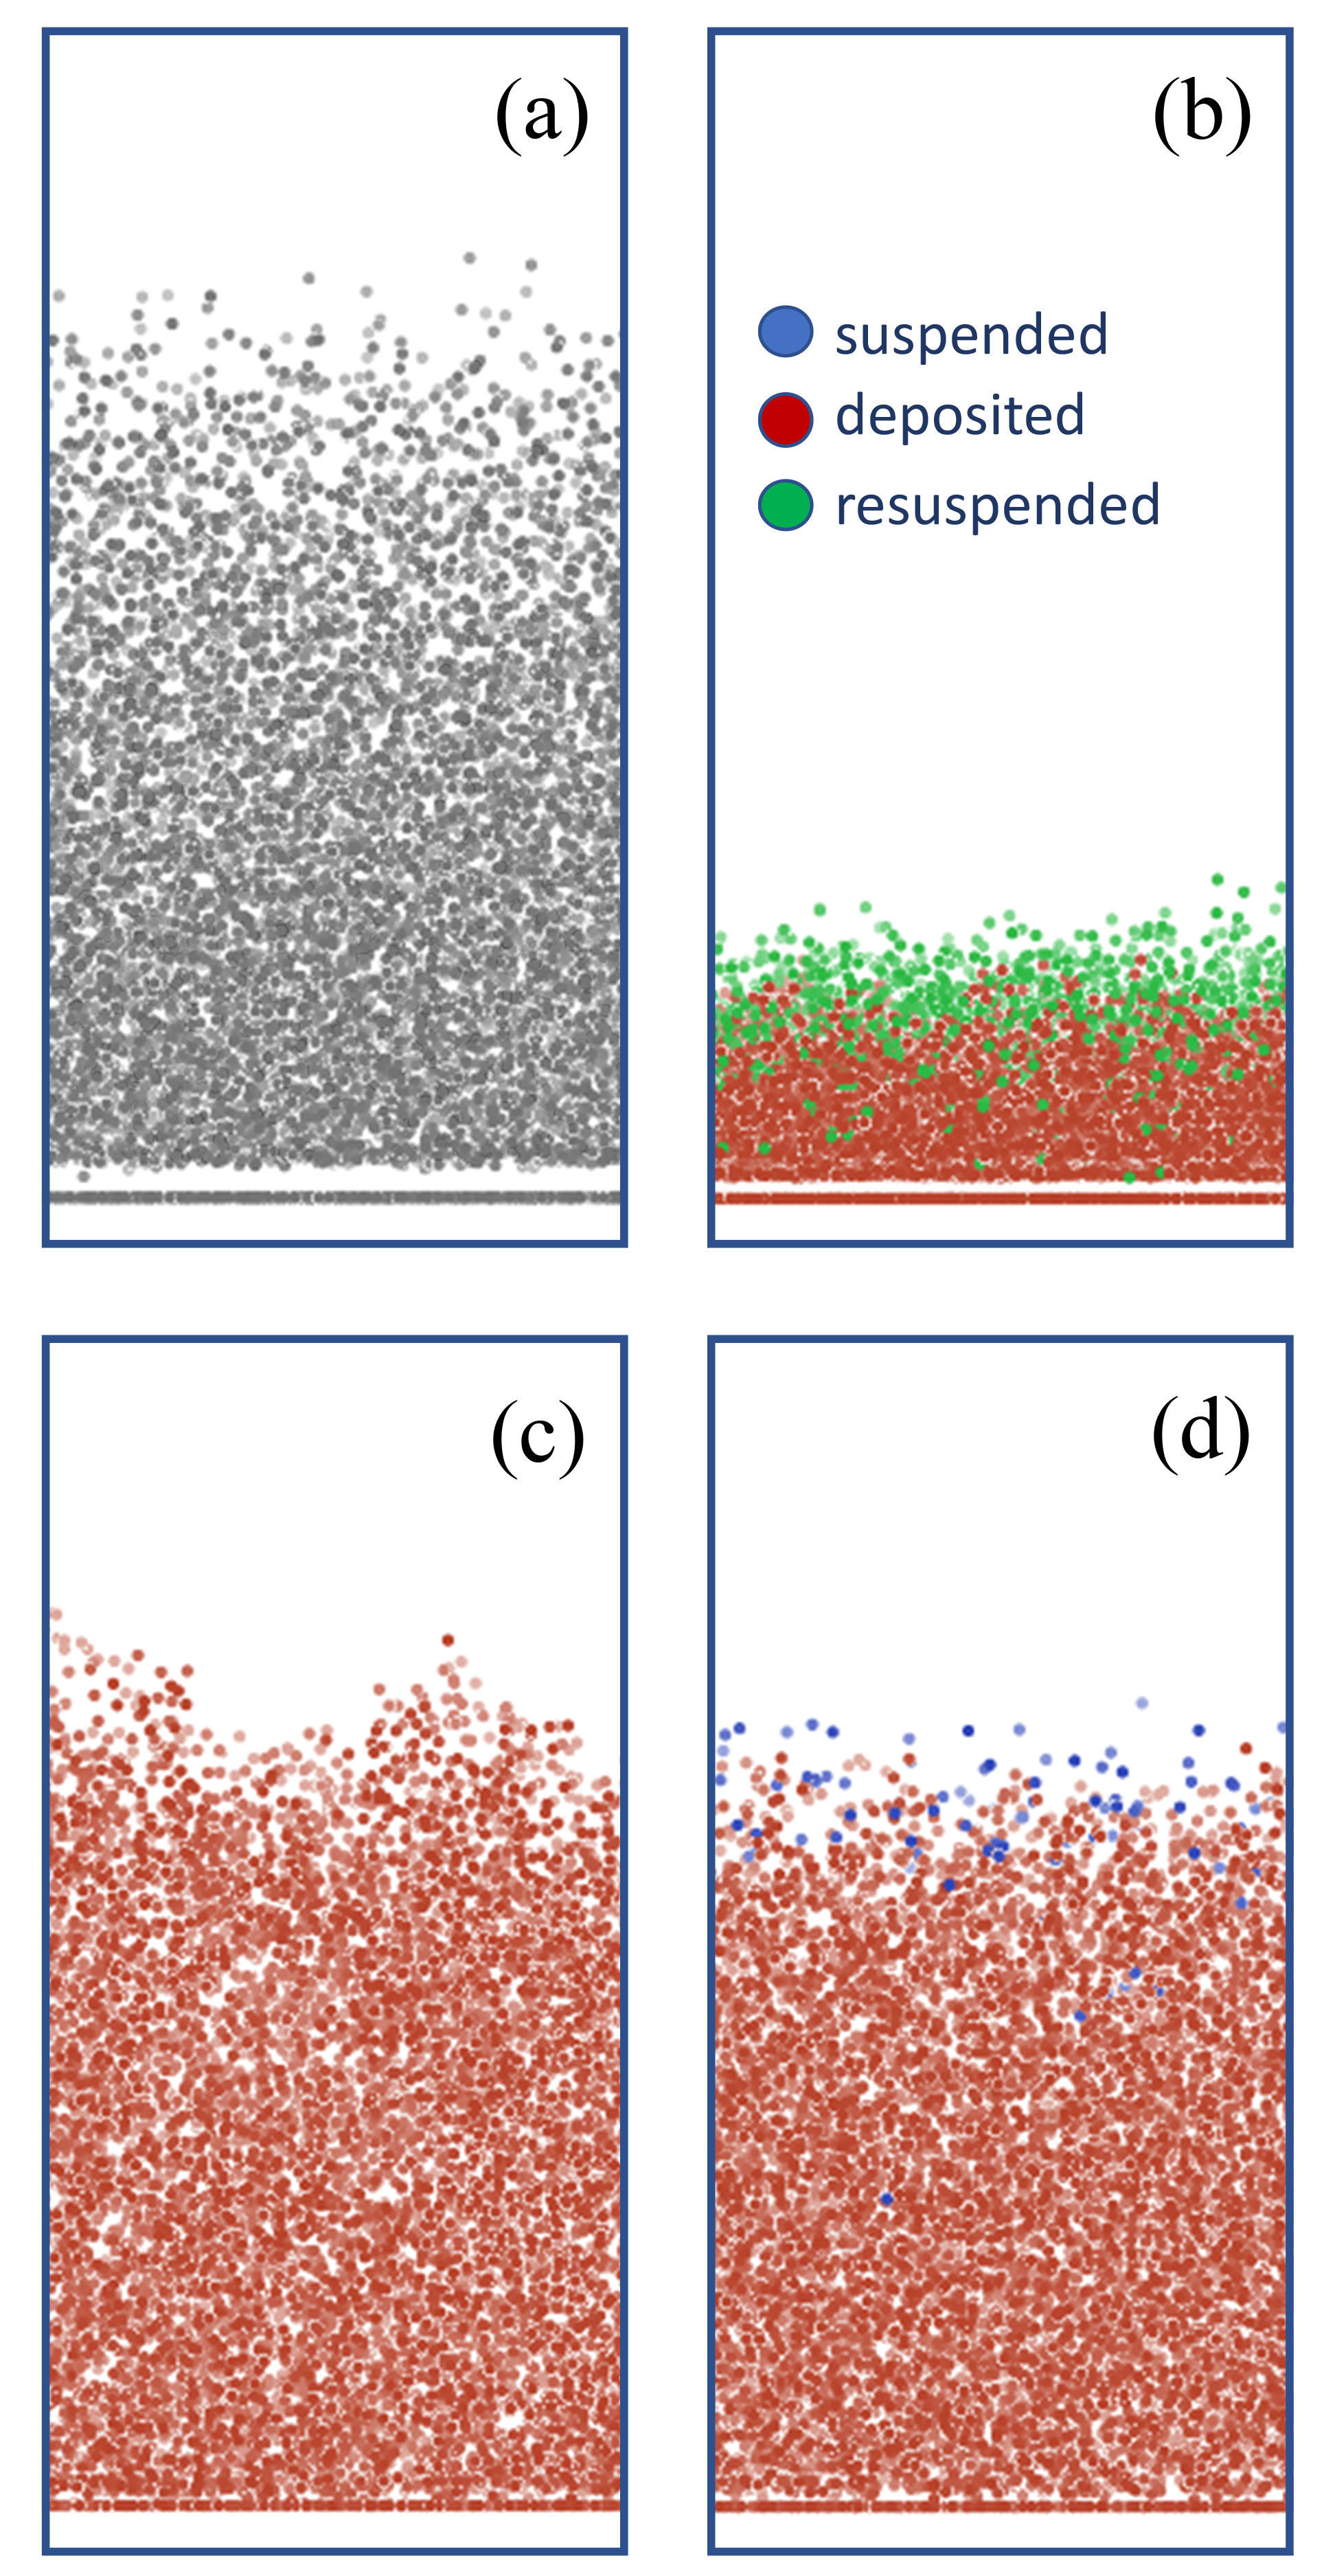
In Figure 3a the first deposition layer is isolated from the rest of the deposit, separation due to the close-packing at the planar electrode and a combination of electrostatic repulsion and excluded volume due to the colloids’ size. Subsequent layers of the deposited colloid quickly become less ordered and the density of the deposit decreases toward the bulk. For DLVO colloidal suspensions with large Debye lengths, thick and/or dense deposits are unlikely to form where mobile particles must overcome a repulsive energy barrier from already-deposited particles. Indeed, deposits under these conditions are known to resuspend in the absence of the electric field 6, 7. These empirical observations and complementary simulation results fit within the standard DLVO paradigm. However, in some sense, they are counter-intuitive considering how researchers routinely create dense, lasting deposits under a wide variety of conditions. The implementation of DLVO theory as a conventional pairwise additive molecular dynamics force field is too limited a framework to capture many EPD approaches. We present three additional EPD simulation scenarios with physics models that adapt to particles’ local environments on-the-fly in an effort to explore new physical effects beyond conventional particle-based simulation methods.
Figure 3(b) shows the decharge/mobile approach. Several features of this deposit differ significantly from (a). The excluded region between the first deposition layer and bulk deposit is smaller due to the removal of particle-particle electrostatic repulsion in the deposited material. The lack of this repulsion also results in a much denser deposit, as thick as the standard/mobile deposit in (a). In (b) we color particles according to whether they are deposited (touching the electrode or within of deposited particles) or resuspended (once-deposited particles that migrated beyond of the deposit). Experimental systems that exhibit this behavior include examples in which functionalized or ligand-coated particle and electrode surfaces can exchange charge via acid-base interactions 40.
Snapshots of the immobile simulations, shown in Figure 3(c) and (d), appear similar. In both snapshots, the separation of the first deposited layer of particles is less apparent than in either of the mobile simulations and the thickness of the two deposits is similar. The most obvious difference between the two snapshots is the persistence of some suspended particles in (d), the standard/immobile case, since the repulsive electrostatic forces are still present after particles are tagged as deposited and made immobile. The decharge/immobile case in Figure 3(c) is representative of ligand-free metallic particle suspensions 41. Another example of the decharge/immobile case is the absorption of Pt nanoparticles on oxidic supports, where Marzun et al. demonstrated that charge transfer could be observed by monitoring surface charge density and zeta potential . 42 In this example the decharge scenario would be applicable even though there was no externally applied electric field. Figure 3(d), characterized by the standard/immobile scenario, can occur when a gelation agent immobilizes particles at the electrode. Application drivers for this design include sensing, energy conversion, and catalysis. 43, 44 Additionally, studying the differences between decharge/immobile and standard/immobile scenarios may provide insights into how the nature of particle-electrode bonding affects the emergent deposit.
3.1 Quantifying simulated EPD
Our quantitative analysis of the 36 EPD simulation set focuses on two main features: the density profile and the spatial arrangement of the first layer of colloid particles at the planar electrode. Figure 4 shows representative data for the case of standard/mobile, =, and =250 kV/m.
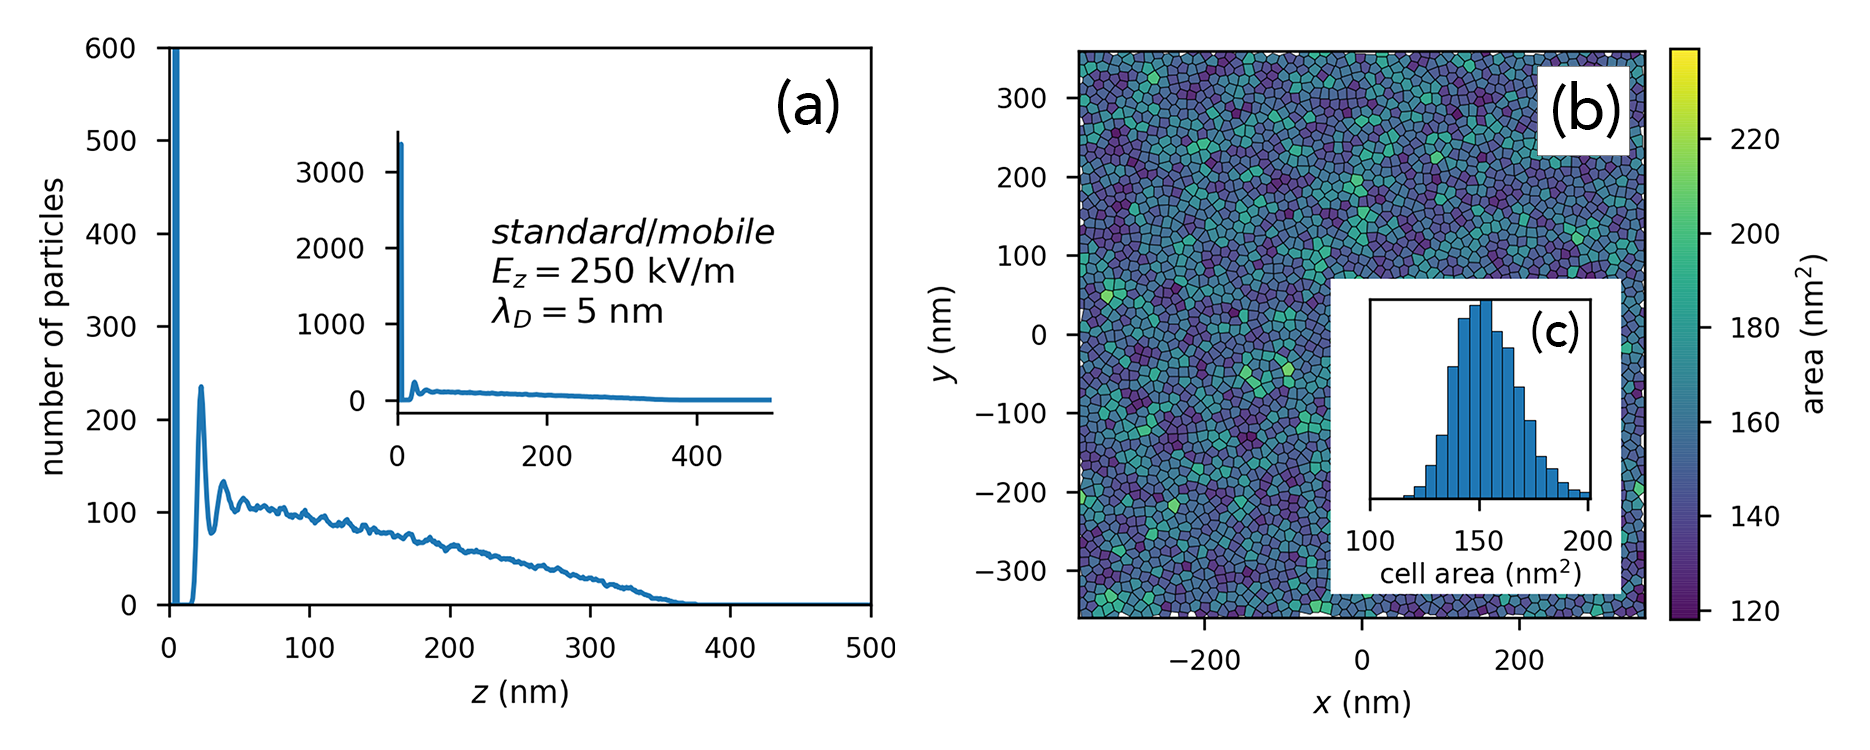
The density profiles in panel (a) are the average of the final thousand stored configurations of the 1 ms MD trajectory. We note that additional sampling beyond the final frame of immobile depositions does not reduce statistical noise in the deposit. For all density profiles the vertical axis is shortened, truncating the peak that corresponds to the first layer of deposited particles to enable better inspection of the bulk deposit. The inset of Figure 4a shows same density profile with full range of the vertical axis.
Figure 4(b) shows the first layer of deposited particles as a Voronoi diagram. Construction of Voronoi diagrams in this work is as follows: We isolate the first deposited layer by extracting all particles from the last stored configuration of a simulation trajectory and projecting them onto a plane by removing the Cartesian coordinate. For the given set of particles at the electrode , each particle has a corresponding Voronoi cell, , which contains every point in the plane whose euclidean distance to is less than the distance to any other particle at the electrode. Each Voronoi cell represents one particle. In this work, Voronoi diagrams representing the first deposition layer are calculated and visualized using an in-house customization of the freud Python library, where the color of each Voronoi cell corresponds to its area. 45, 46 The inset Figure 4(c) is a histogram of the Voronoi cell sizes, which represents the electrode surface area occupied by the deposited colloid particles. Voronoi analysis has previously been applied to analyze scanning electron microscopy images of EPD monolayer films where the particles were characterized by the number of sides on its Voronoi cell, corresponding to the number of nearest neighbor particles. 47 Voronoi analysis presents a straightforward way survey surface coverage by EPD and to directly and quantitatively compare particle-based simulations and experiment.
3.2 Behavior of deposition models
The density profiles in Figure 5 provide direct, quantitative insight into the simulated deposits. In (a), the standard/mobile simulation, three layers of decreasing ordering are visible before the particle density decays to a smooth, monotonically decreasing profile, ending at from the electrode. The density profile (b), corresponding to the decharge/mobile reflects the changes to the deposited particles’ physics model: deactivation of the electrostatic repulsion between the particles. Removing this repulsive component of the DLVO model decouples the ordering of the deposit from , enabling the deposited particles to pack more closely together. This results in much more ordering, similar to hard sphere packing, and 5 well-defined peaks that correspond to the first 5 layers of the deposit.
The immobile approaches are shown in Figure 5(c) and (d). We again note that, since deposited particles are made completely immobile, statistical noise may not be reduced by time-averaging snapshots. This results in significantly noisier density profiles for the immobile cases. To a first approximation, (c) and (d) look similar, with high density layers at the electrode followed by significantly less ordered second layers. The bulk of each deposit has a flat profile relative to the mobile cases.
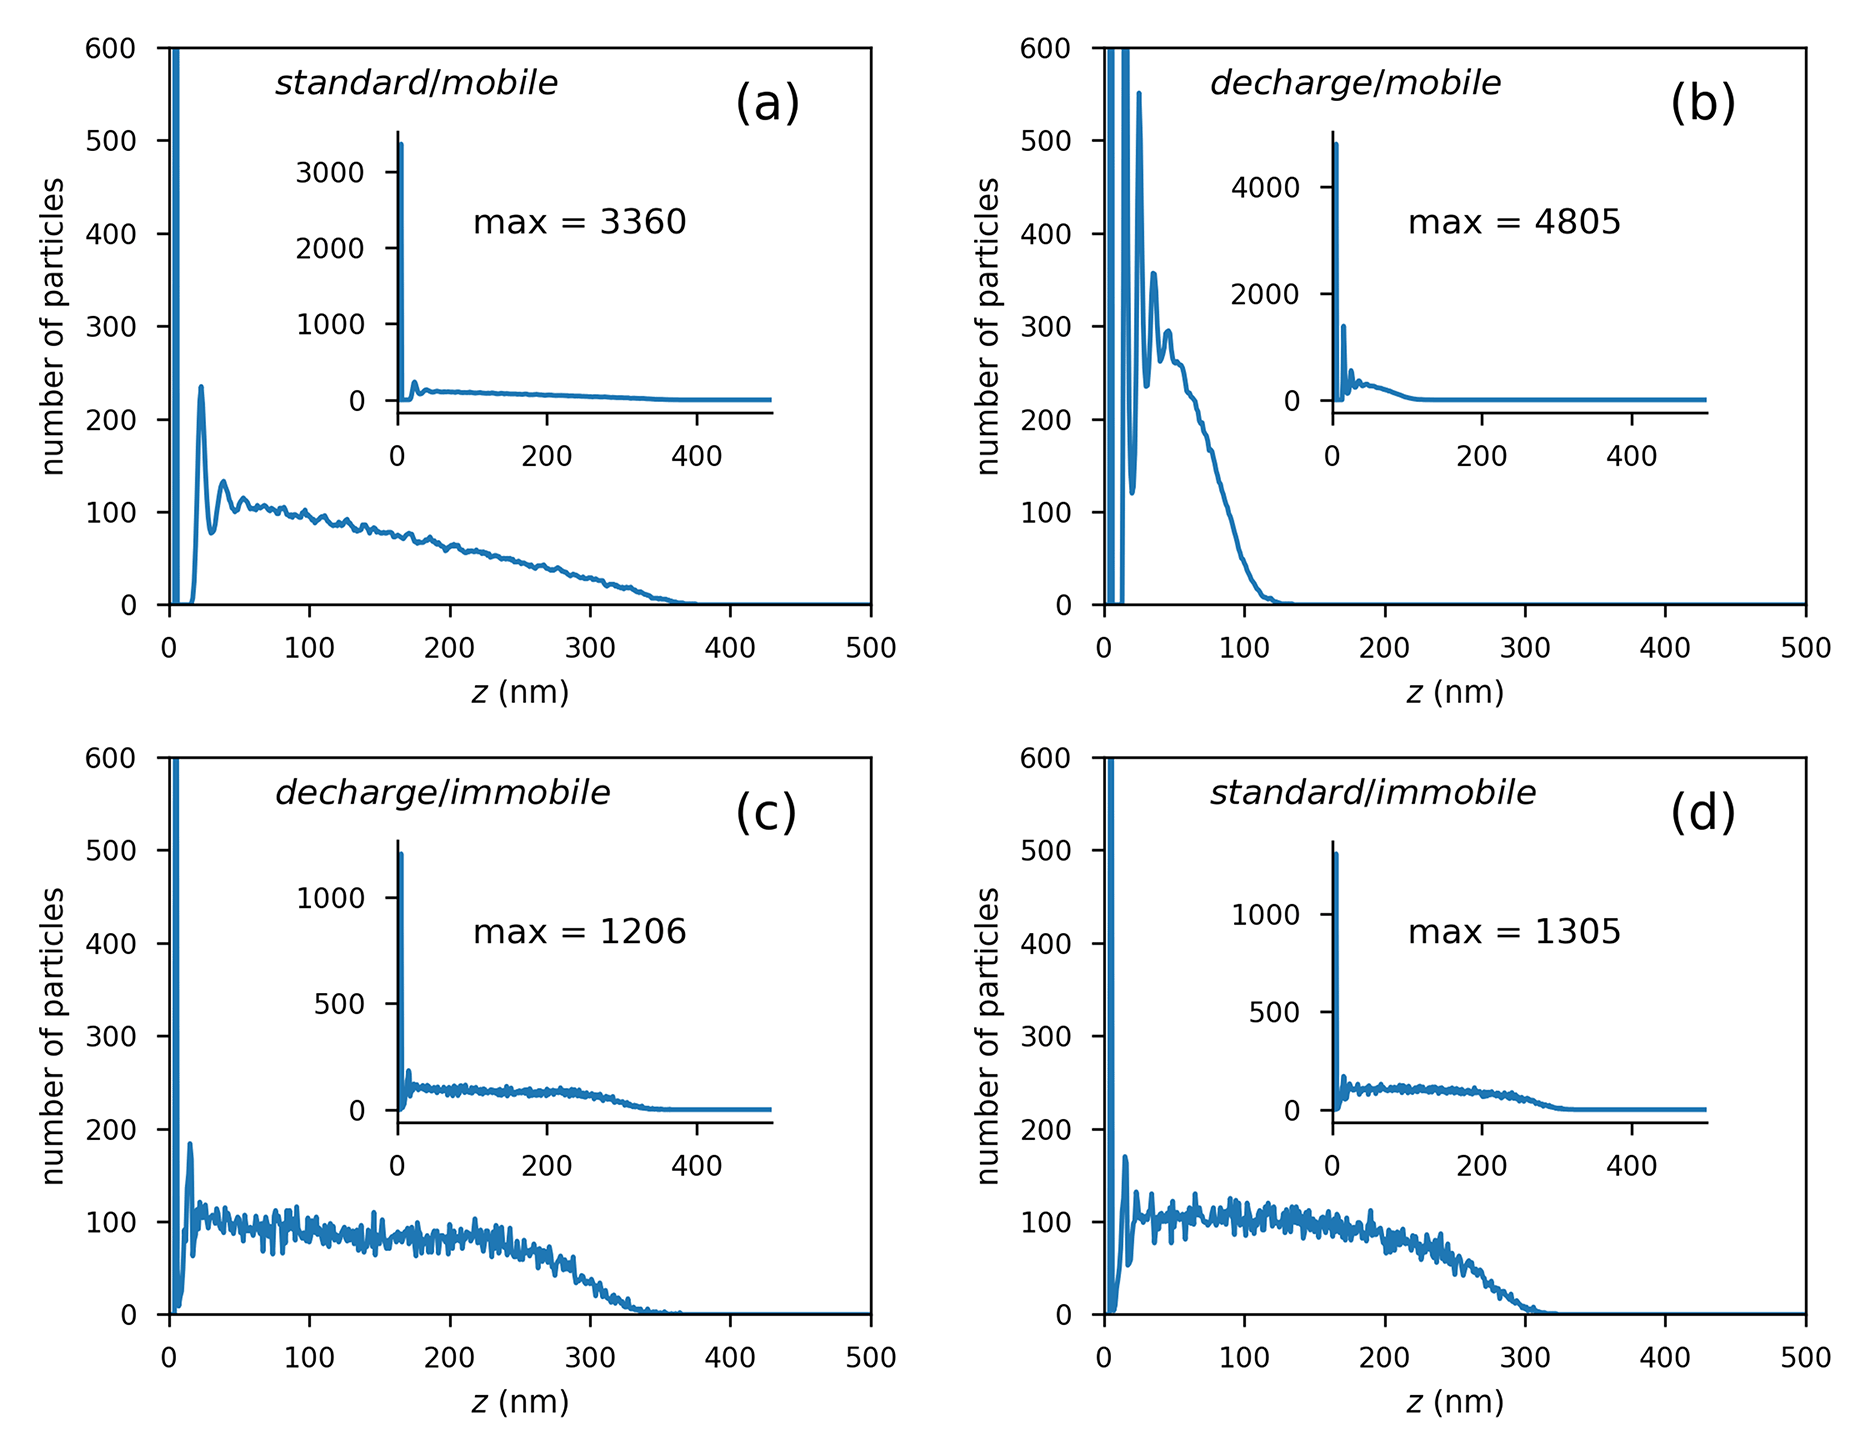
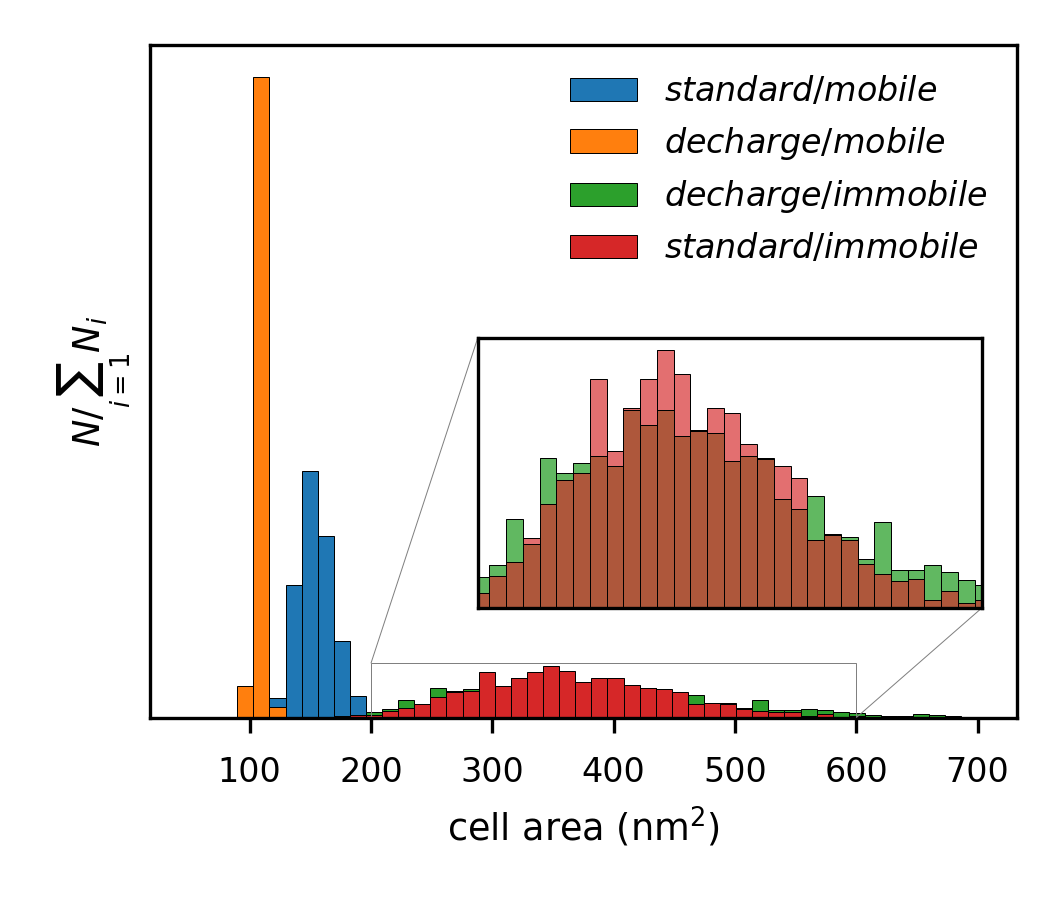
Figure 6 shows representative Voronoi diagrams of the first layer of deposited particles at the electrode for each of the four deposition models, with = 5.0 nm and = 250 kV/m for all cases. The area of each Voronoi cell corresponds to the area of the electrode occupied by a given particle; the number of cells corresponding to the number of particles at the electrode. Panel (a) is the standard/mobile case, which corresponds to simulations presented in earlier work. 25 Implementation of the decharge model, Figure 6(b), results in a more densely packed layer of particles at the electrode, agreeing with data from the density profiles in Figure 5. Histograms of these Voronoi cell areas are overlaid and shown in Figure 7, where the standard/mobile distribution is centered at . The decharge/mobile particles are more closely packed, with a considerably smaller variance and an average area of . When projecting the first deposition layer onto a plane, this corresponds to 73% of the particles’ area covering the electrode surface versus 51% in the standard/mobile case and 90.7% for the case of a hexagonal lattice: the ideal, highest-density configuration for packing circles in a plane. 48
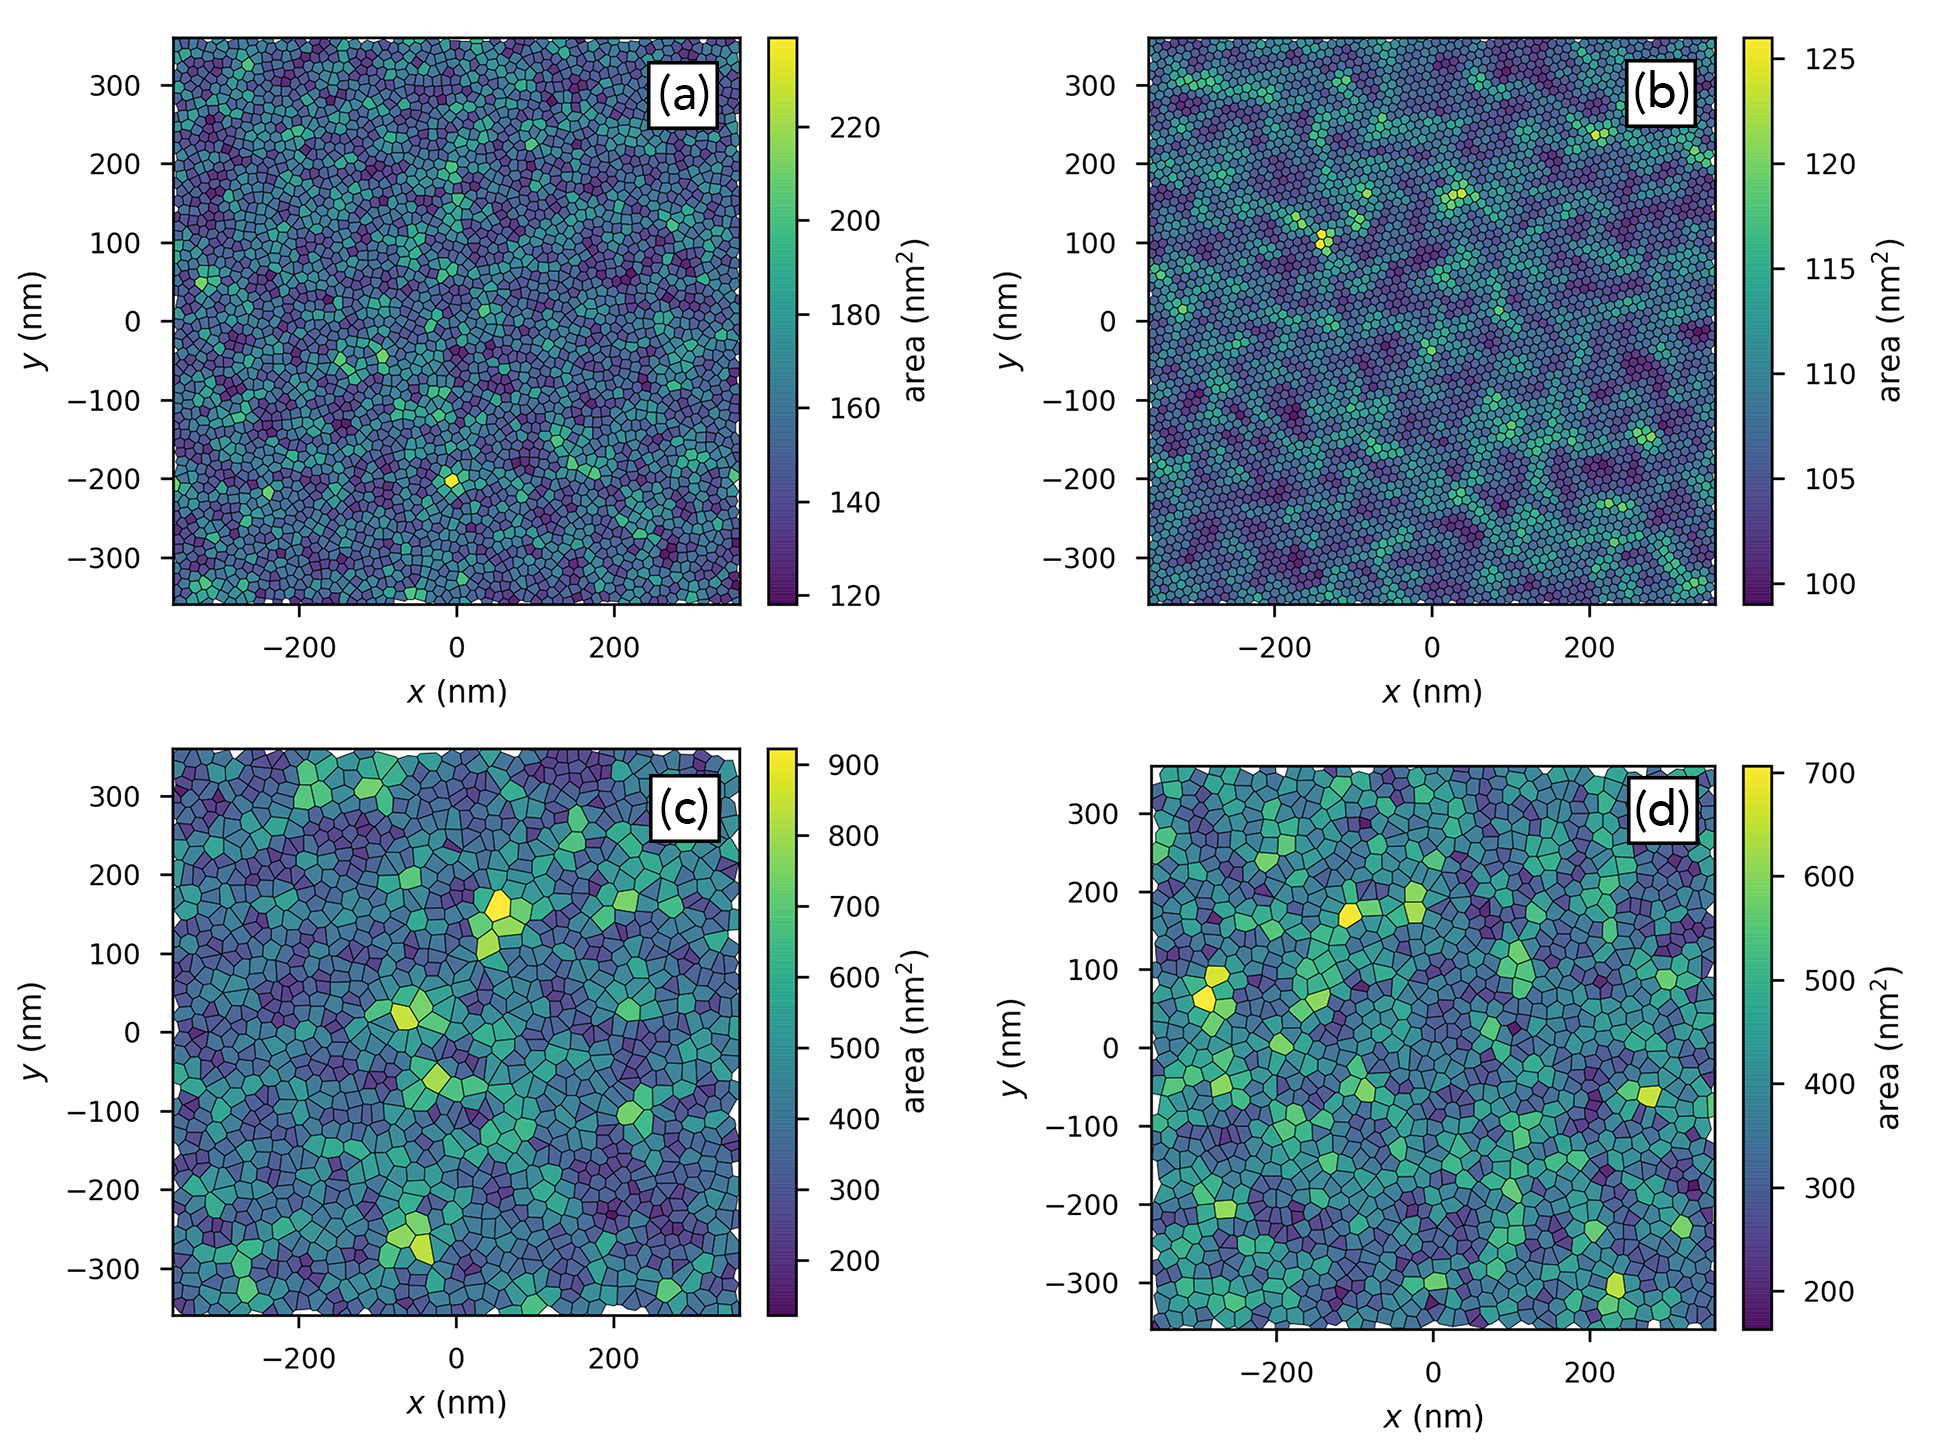
The immobile cases, shown in Figure 7(c) and (d), show significantly less dense packing at the electrode. Although the electrostatics of the deposits formed in the decharge/immobile (c) and standard/immobile (d) cases differ substantially, the average Voronoi cell areas are within 4%. This indicates that the separation and ordering of the particles at the electrode in these simulations is a strong function of particle deposition parameters, and , and not dominated by electrostatic repulsion as in the mobile cases. This similar behavior at the electrode is due to the suspended particles descending with identical physics until they interact with the electrode, then becoming ‘deposited’ and made immobile. In the first layer changes in the systems’ electrostatics (i.e. ) are relatively small. As the deposited layers grow, differences in the deposits’ electrostatics increase which results in the differences observed in the immobile density profiles in Figure 5(c) and (d). The standard simulation, which retains DLVO behavior throughout the deposit, results in additional suspension-deposit particle-particle repulsion and a slightly more well-ordered and more dense deposition. This repulsion is seen qualitatively in Figure 3(d) where a few particles remain suspended (blue) above the deposit after the simulation has concluded. Other instances of this behavior are observed within the selected parameter sweep data presented in the following sections.
3.3 Varying electric field for fixed Debye length of 5 nm
Figure 8 shows density profiles, where each panel contains data for a single deposition model. The three curves in each panel correspond to different field strengths : 10 (blue), 50 (orange), and 250 (green) kV/m. The Debye length, , is 5 nm for all 12 simulations shown in Figure 8. For all deposition models high field strength results in a more dense deposit, although the deposits vary greatly between deposition models. The mobile deposition models, panels (a) and (b), show similar trends, with higher packing within the decharge case due to the loss of interparticle electrostatic repulsion upon deposition. Although not readily apparent in the density profiles, all decharge/mobile cases have a significant layer of ‘resuspended’ particles adjacent to the particles tagged as ‘deposited,’ as seen in Figure 3(b). This layer of particles, electrostatically perturbed by contact with the electrode but suspended in solution, appears to act as a passivation layer, particularly at lower fields, preventing suspended particles in the bulk from reaching the electrode (or deposited particles in intimate contact with the electrode) and losing their electrostatic character. This effect may be made more evident by removing the ‘resuspension’ scheme (see Figure 2(c)). With fix cure disabled, deposited particles that diffuse away from the electrode move through the bulk suspended colloid, removing the electrostatic repulsion from all suspended particles they encounter and all decharge/mobile simulations result in a dense-packed deposit. Using the terminology of our LAMMPS implementation, fix cure is a first-order approximation to prevent this nonphysical runaway electrostatic deactivation by fix infect.
The immobile cases in panels (c) and (d) appear similar to each other when compared to the mobile cases. Upon close inspection decharge/immobile and standard/immobile density profiles show differences that result from the deposits’ dissimilar electrostatic behavior. Since particles are made immobile upon deposition these cases isolate the effect of deposit-suspension repulsion. This repulsion affects the ordering of the deposits in the standard case, resulting in slightly higher density packing near the electrode. In the decharge case the lack of deposit-suspension interaction permits a stochastic deposition; this lack of ordering results in the observed lower densities. During immobile in silico deposition, the fraction of particles tagged as ‘deposited,’ varies more dramatically in simulations where deposit-suspension electrostatic repulsion becomes stronger than the applied field, k V/m. The density profiles in (c) and (d) corresponding to k V/m (orange curves) show more interesting differences. In (c), the decharge case, the rapid density decrease between 400 and 500 nm indicates the upper boundary of the deposit. A similar decrease is not observed in (d), although a slight decrease at around 250-300 nm occurs before the density plateaus. The inset images in panels (c) and (d), simulation snapshots corresponding to k V/m, reveal the origin of these density features: deposit-suspension repulsion in (d) limits the extent of deposition, even in our immobilize protocol, which implements the most liberal case of immobile particle deposition.
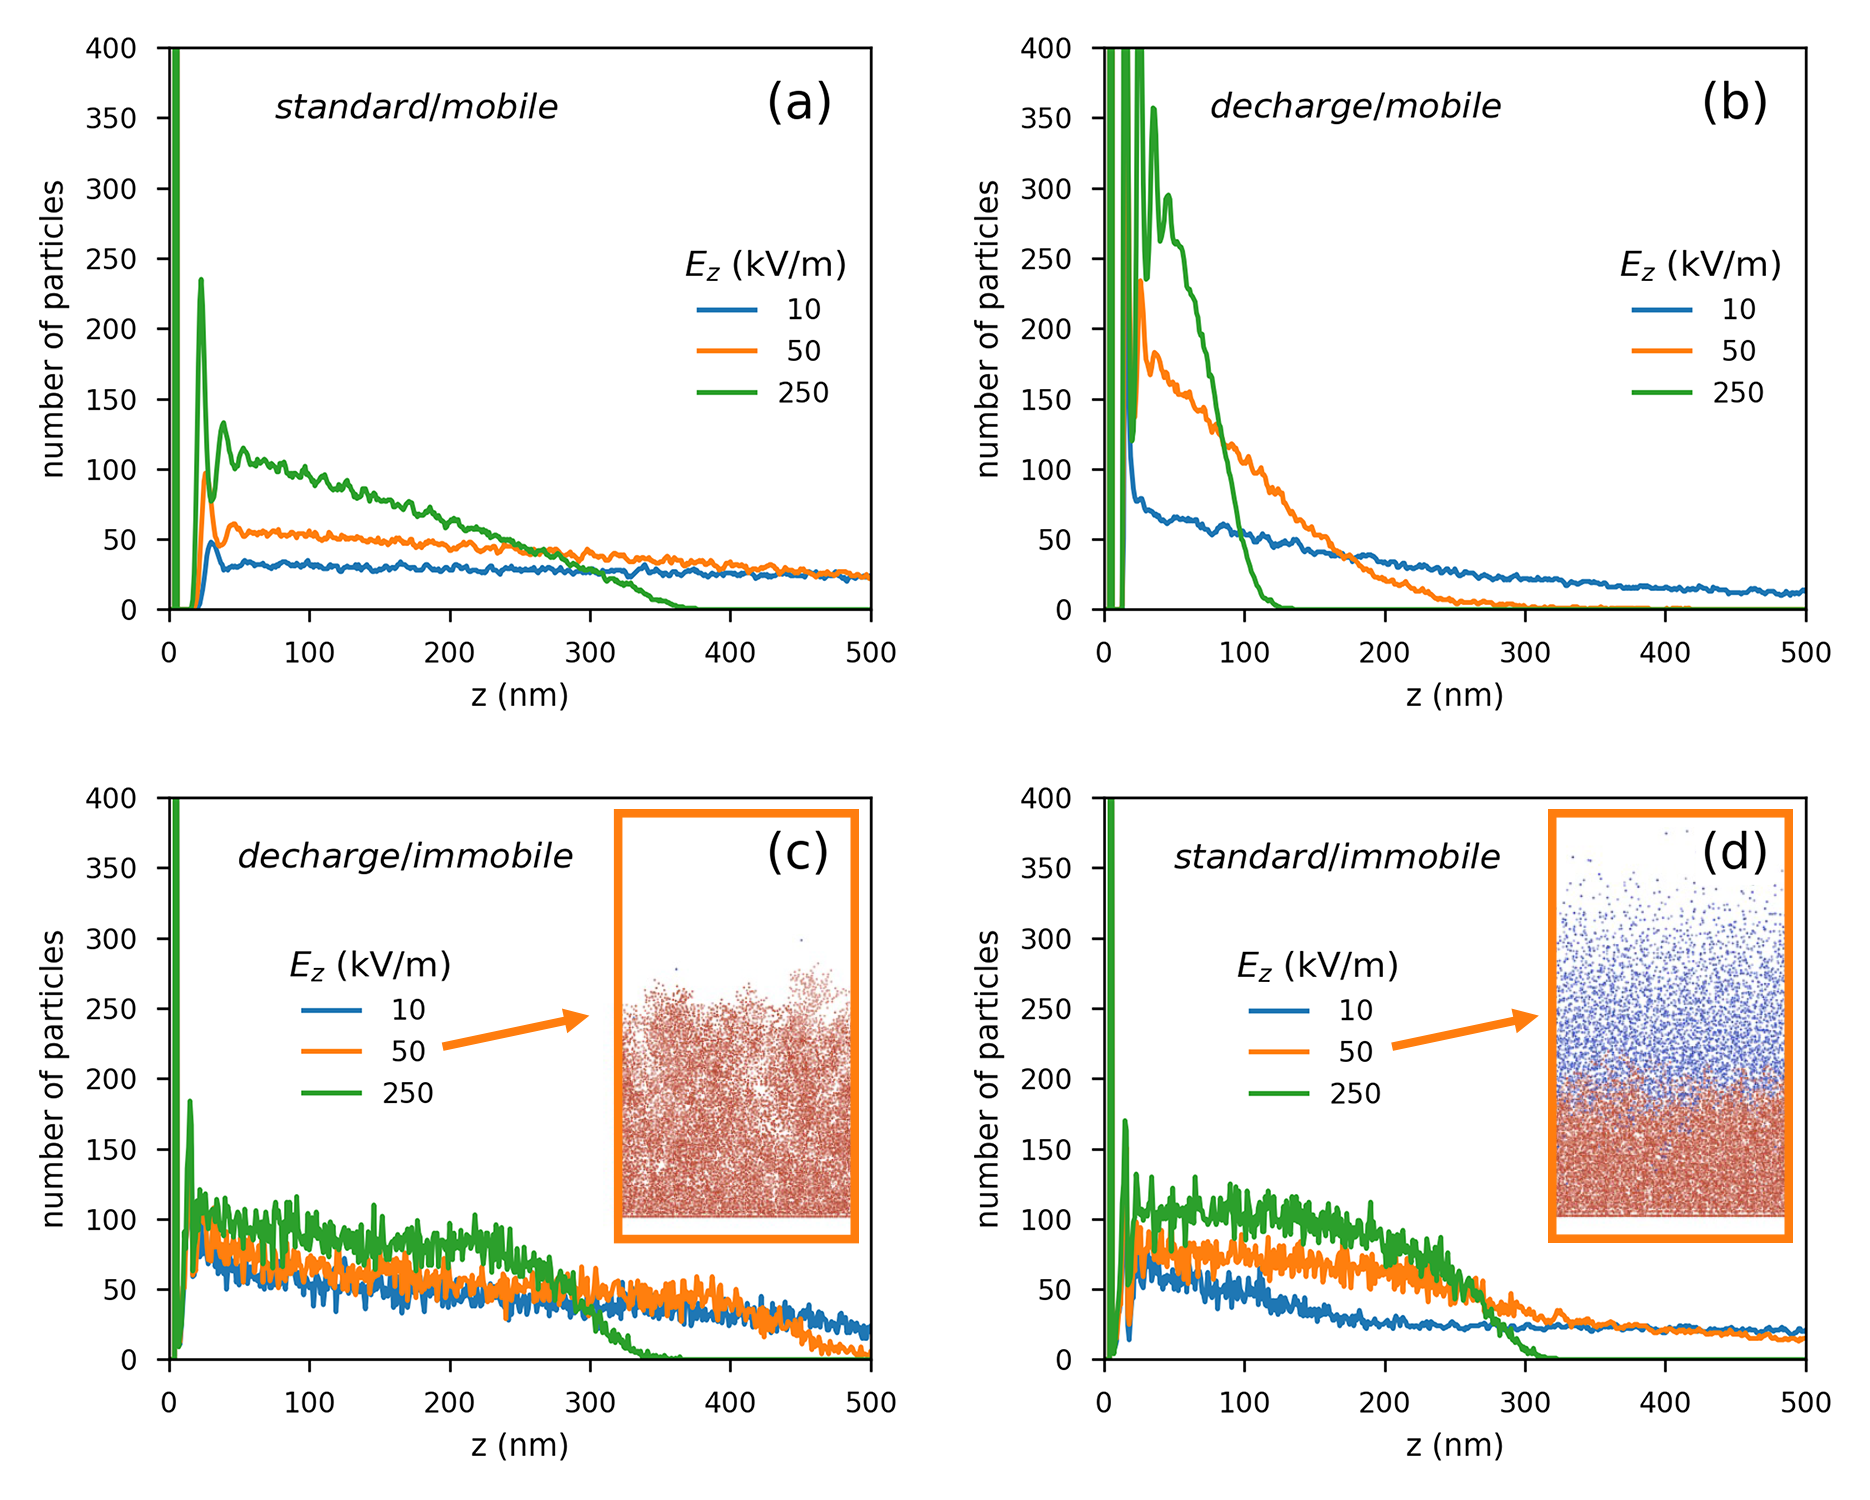
Figure 9 shows Voronoi diagrams for the standard/mobile simulations for selected . For this deposition model colloid spacing at the electrode decreases with increasing field, showcasing the interplay between interparticle repulsion and , the primary driving force of particle deposition at the electrode. Histograms of the Voronoi cell areas in panel (d) are an alternate presentation of these areas; more succinct but sacrificing the overview of spatial homogeneity of the particles’ effective areas. Approximating each cell as a circle estimates the effective radius of particles at the surface, 9.4, 8.6, and 7.0 nm for the 10, 50, and 250k V/m fields, respectively, as compared 5.25 nm for the case of ideal packing of circles in a plane. This phenomenon of more dense and clustered deposits at higher field strength has been experimentally observed for Pt nanoparticle deposition. 49
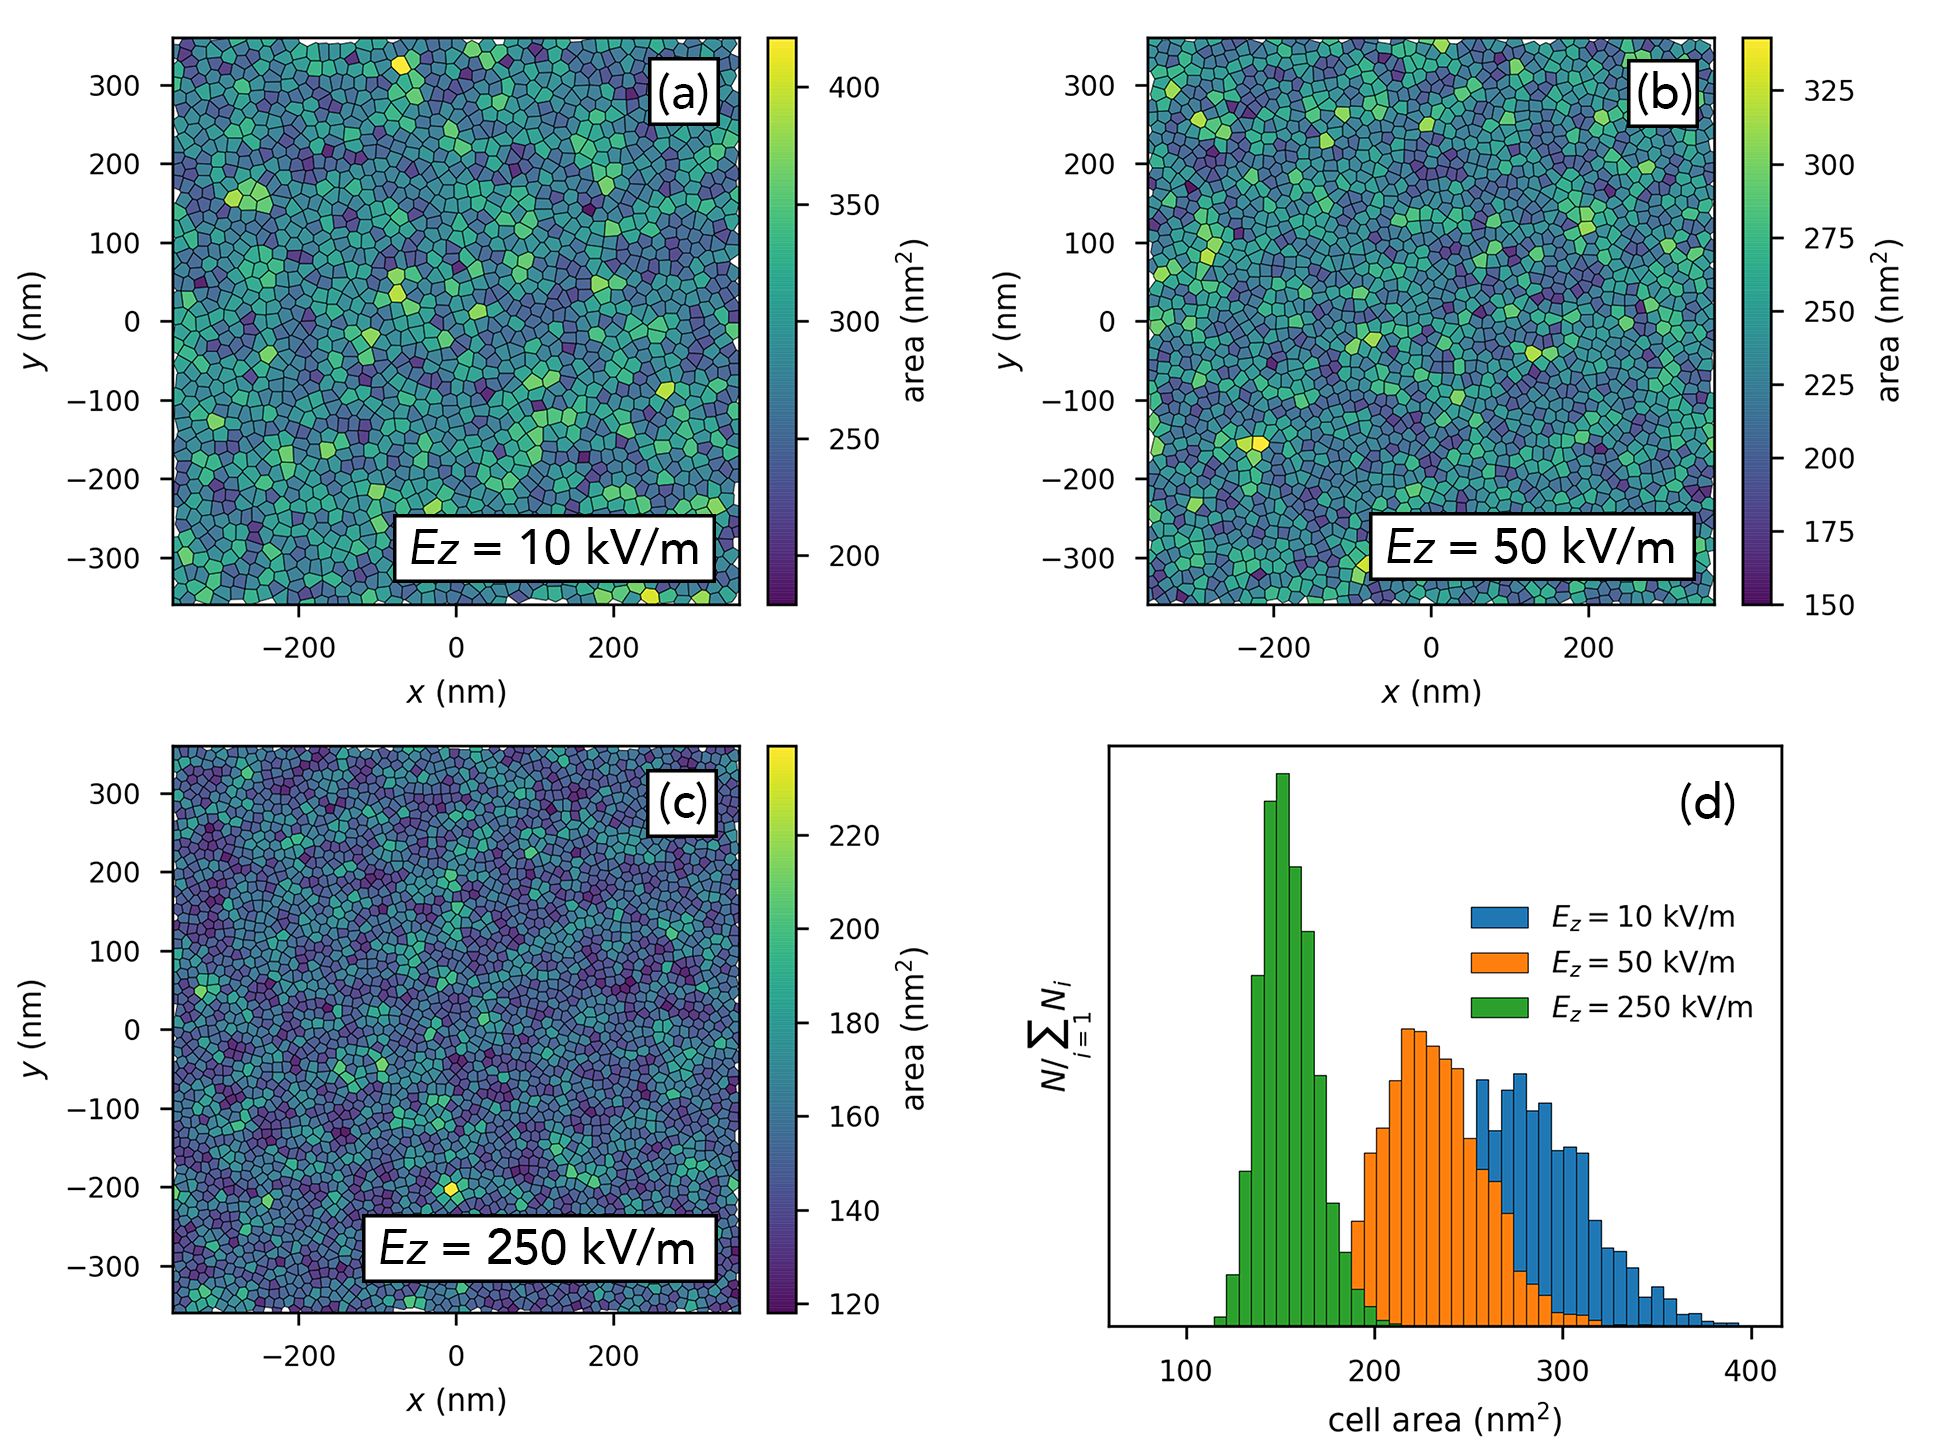
Panel (d) shows distributions of the Voronoi areas for panels (a) - (c).
3.4 Varying Debye length for fixed electric field of 250 kV/m
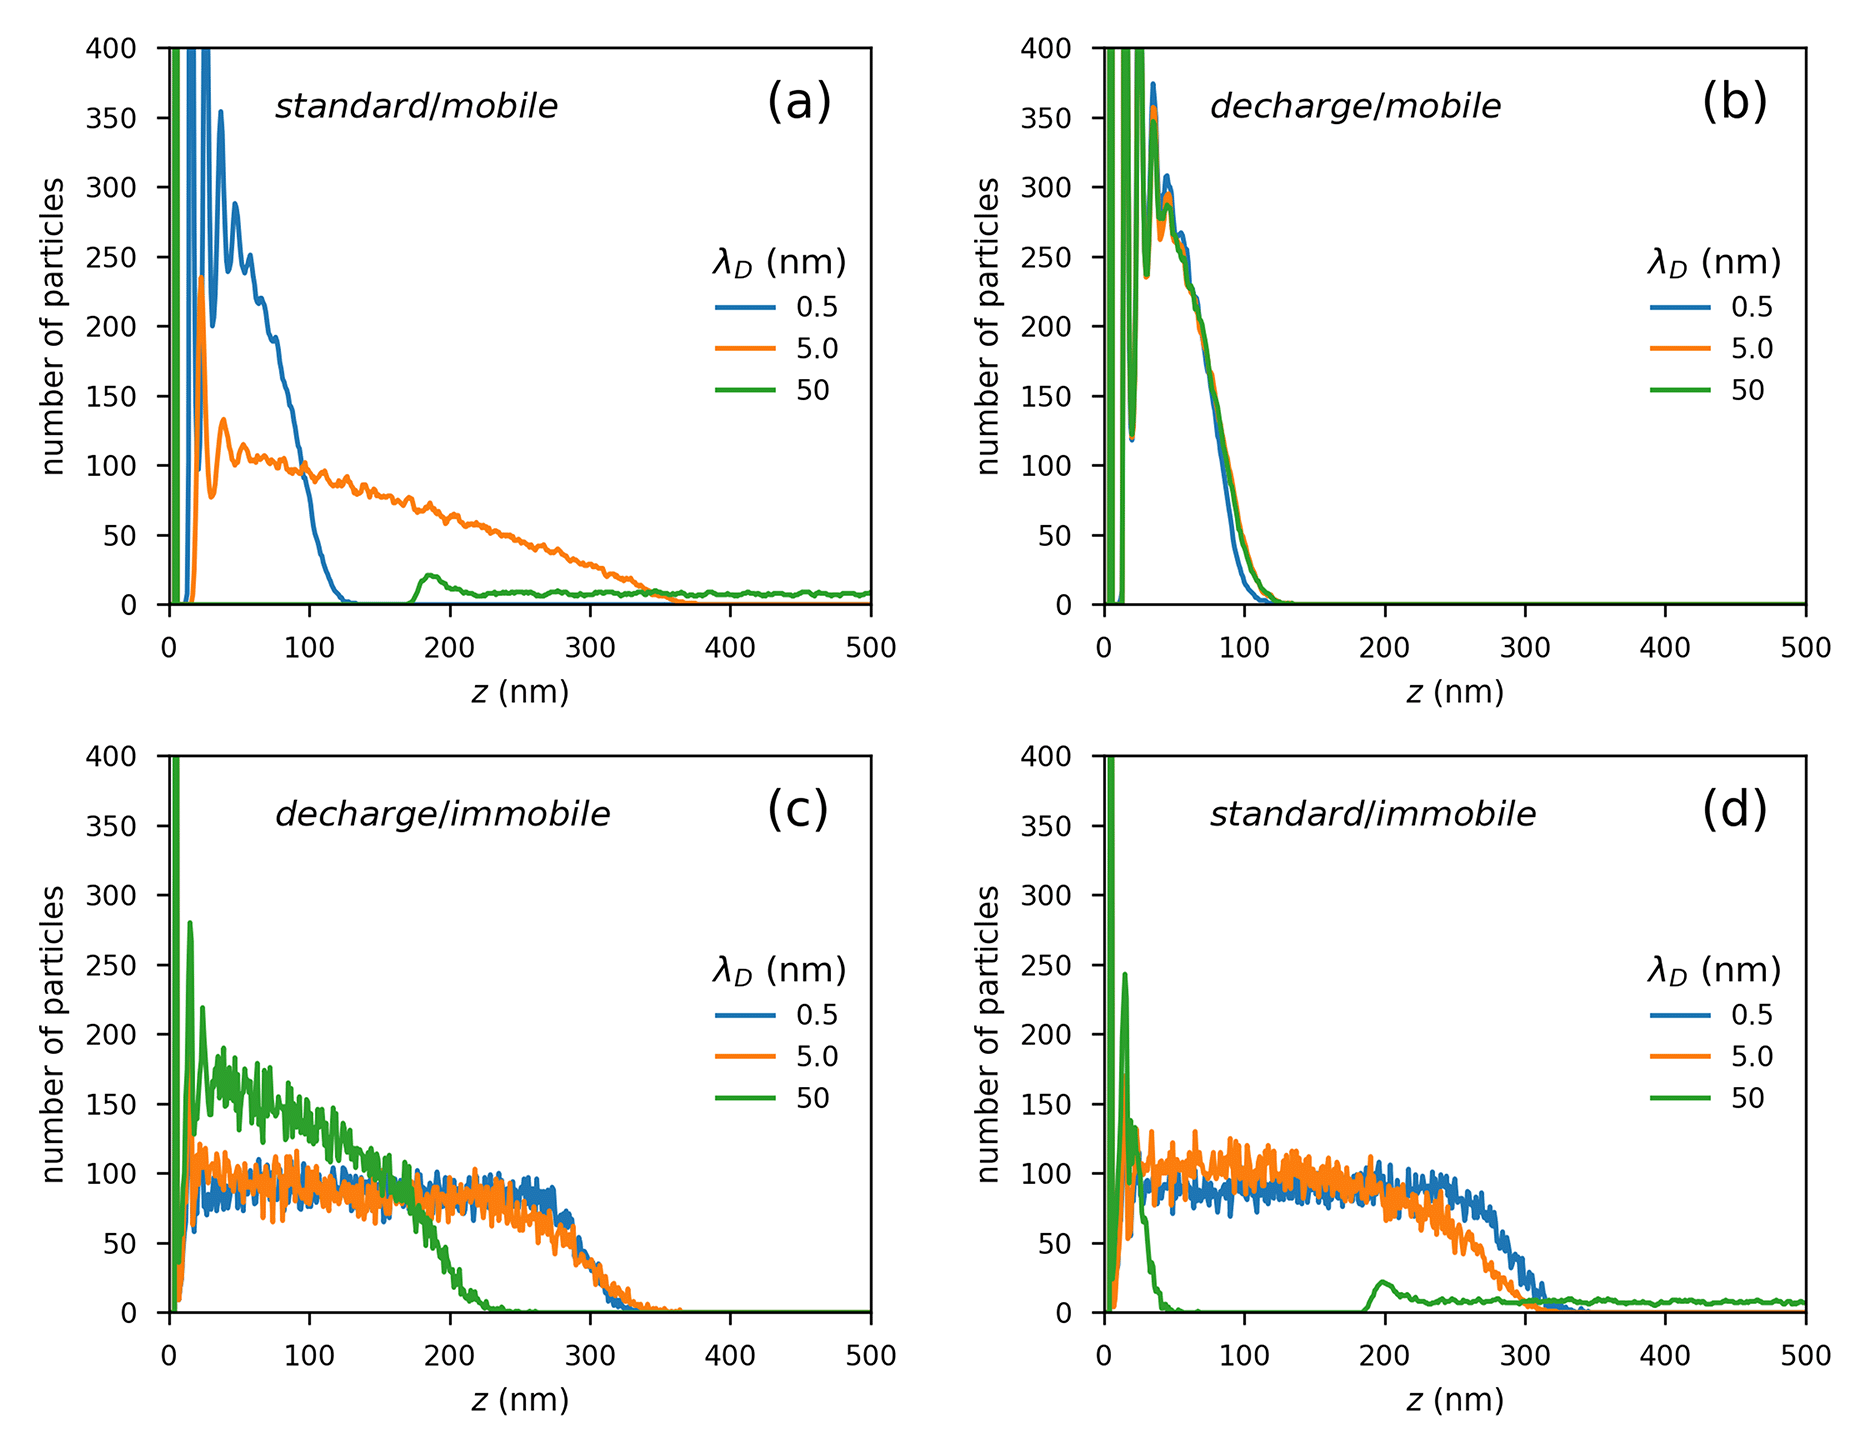
Figure 10 shows density profiles that result from varying the Debye length () of the colloid particles. Similar to Figure 8, each panel represents one of the four deposition models. The three curves in each panel correspond to different : 0.5 nm (blue), 5 nm (orange), and 50 nm (green). In panel (a), the standard/mobile case, the shortest results in the most densely packed deposit, only about 100 nm thick. The nm simulation shows the characteristic close-packed and well-ordered first deposition layers followed by linear decrease in deposit density. The large 50 nm simulation shows the most interesting result, where a high-density first layer is present, followed by region of near-zero density that extends to nm from the electrode surface. A small density peak is present after this excluded region, followed by a low-density colloid suspension.
All three density profiles in panel (b) look identical because the decharge/mobile case removes interparticle electrostatics, thus removing the differences introduced in this parameter study. Deposited particles in this case effectively behave as . This explains the similarity between the nm curve in panel (a) and the curves in (b) since the range of electrostatic repulsion in the simulations is significantly smaller than the particles’ radii.
The shorter immobile cases in (c) and (d) look similar aside from the slightly more dense deposit in the standard/immobile case due to additional ordering of the descending particles by particle-particle repulsion. Conversely, the deposits resulting from the nm cases look very different. In the decharge case, the extended electrostatics in the suspension results in more ordering during the deposition and a more dense deposit than the and 5 nm cases, a trend that suggests a design strategy for higher-density EPD deposits within this physical regime. In panel (d), the standard/immobile case, the nm deposit resembles the nm density profile in (a), where the first layer of deposit repels the suspended bulk colloid. In the immobile case, this results in a suspended colloid regime separated from the electrode at that same distance as in the analogous mobile simulation.
4 Conclusions
The particle-based modeling approaches presented here represent extensions beyond standard DLVO-based implementations for EPD simulation. As such, they pave the way for exploring the interplay between electrode and colloidal suspension properties and EPD operating conditions that may result in non-DLVO phenomena. Specifically, we model four types of deposition in which particles (1) keep or (2) lose their charge upon deposition and/or (3) remain mobile or (4) lose mobility upon deposition. We simulate parameter sweeps of these scenarios and compare resulting particle density profiles throughout the deposit and ordering at the electrode. Compared to the standard/mobile case, decharge/mobile deposits pack more densely in the absence of electrostatic repulsion between deposited and (re)suspended particles. This reveals the impact of Debye length on the structure and density of EPD deposits: If is too large, multilayer deposits may not form due to repulsion from deposited particles. Deposit density increases with electric field but is, in all cases, less dense than deposits formed in ‘mobile’ particle scenarios.
This extensible and versatile EPD modeling framework is an initial step toward expanding particle-based EPD simulation to capture many more physical systems. Modifications to any of the four EPD model types shown here are straightforward to implement. For instance, as with previous particle-based models, the functional form of the interaction potentials among particles and electric field are tunable and, with this work, dynamic. Furthermore, the cutoff distances used to specify whether particles are deposited or suspended can be modified accordingly to match or approximate the behaviour of any physical system of interest. Simulations can be configured to account for multiple deposition scenarios, e.g. DLVO particles in which a fraction irreversibly adsorb to the surface. Since this framework allows for conditional changes to any property, it is possible to simulate colloids that partially decharge or exhibit reduced mobility near the electrode or deposit.
Though our proof-of-concept simulation set focuses on the extremes of EPD physical phenomena, it is possible to interpolate insights pertaining to more complicated, non-ideal systems commonly encountered in the EPD research community. In cases where multiple deposition effects may be at play and/or for EPD conditions not represented here, the model readily can be tailored to simulate a wide set of experimental systems. Thus, it offers new ways of guiding the experimental design of particle deposition beyond what was possible with previous modeling capabilities. Overall, the model provides an unprecedented quantitative glimpse into the EPD process for both measurable and (presently) empirically inaccessible EPD phenomena, e.g. particle migration within deposits. Considering the various falsifiable aspects of the model, e.g. bulk particle trajectories, surface characterization, etc., model validation and complementary model improvement strategies can be achieved through a tight coupling between experiment and theory-based research.
This work was performed in part under the auspices of the U.S. Department of Energy by Lawrence Livermore National Laboratory under contract DE-AC52-07-NA27344, release number LLNL-JRNL-849162. We gratefully acknowledge the German Research Foundation (DFG) for their financial support under the project number BA 3580/24-1 and B.G. thanks DFG for the Mercator Fellowship.
Additional details regarding Yukawa potential cutoff distances, source code for the adaptive physics models, and a representative animation showing the four EPD simulation scenarios studied are included in addition to the main text.
References
- Ramesh et al. 2021 Ramesh, V.; Rehbock, C.; Giera, B.; Karnes, J. J.; Forien, J.-B.; Angelov, S. D.; Schwabe, K.; Krauss, J. K.; Barcikowski, S. Comparing Direct and Pulsed-Direct Current Electrophoretic Deposition on Neural Electrodes: Deposition Mechanism and Functional Influence. Langmuir 2021, 37, 9724–9734
- Ramesh et al. 2022 Ramesh, V.; Giera, B.; Karnes, J. J.; Stratmann, N.; Schaufler, V.; Li, Y.; Rehbock, C.; Barcikowski, S. Electrophoretic Deposition of Platinum Nanoparticles using Ethanol-Water Mixtures Significantly Reduces Neural Electrode Impedance. Journal of the Electrochemical Society 2022, 169
- Boccaccini et al. 2010 Boccaccini, A. R.; Keim, S.; Ma, R.; Li, Y.; Zhitomirsky, I. Electrophoretic deposition of biomaterials. Journal of The Royal Society Interface 2010, 7
- Avcu et al. 2019 Avcu, E.; Baştan, F. E.; Abdullah, H. Z.; Rehman, M. A. U.; Avcu, Y. Y.; Boccaccini, A. R. Electrophoretic deposition of chitosan-based composite coatings for biomedical applications: A review. Progress in Materials Science 2019, 103, 69–108
- Sikkema et al. 2020 Sikkema, R.; Baker, K.; Zhitomirsky, I. Electrophoretic deposition of polymers and proteins for biomedical applications. Advances in Colloid and Interface Science 2020, 284, 102272
- Bukosky et al. 2020 Bukosky, S. C.; Hammons, J. A.; Giera, B.; Lee, E.; Han, J.; Freyman, M. C.; Ivanovskaya, A.; Krauter, K. G.; Kuntz, J. D.; Worsley, M. A.; Han, T. Y.-J.; Ristenpart, W. D.; Pascall, A. J. Correlating dynamic microstructure to observed color in electrophoretic displays via in situ small-angle x-ray scattering. Physical Review Materials 2020, 4, 075802
- Giera et al. 2018 Giera, B.; Bukosky, S.; Lee, E.; Freyman, M.; Han, J.; Han, T. Y.-J.; Worsley, M. A.; Kuntz, J. D.; Pascall, A. J. Quantitative Analysis of Color Differences within High Contrast, Low Power Reversible Electrophoretic Displays. ECS Transactions 2018, 82, 59
- Zhao et al. 2021 Zhao, J. et al. Large-area patterning of full-color quantum dot arrays beyond 1000 pixels per inch by selective electrophoretic deposition. Nature Communications 2021, 12
- Lalau and Low 2019 Lalau, C. C.; Low, C. T. J. Electrophoretic Deposition for Lithium-Ion Battery Electrode Manufacture. Batteries & Supercaps 2019, 2, 551–559
- Nguyen et al. 2019 Nguyen, D.; Schepisi, I.; Amir, F. Extraordinary cycling stability of Ni3(HITP)2 supercapacitors fabricated by electrophoretic deposition: Cycling at 100,000 cycles. Chemical Engineering Journal 2019, 378, 122150
- Ghosh et al. 2020 Ghosh, R.; Sahu, R. P.; Ganguly, R.; Zhitomirsky, I.; Puri, I. K. Photocatalytic activity of electrophoretically deposited TiO2 and ZnO nanoparticles on fog harvesting meshes. Ceramics International 2020, 46, 3777–3785
- Saji 2021 Saji, V. S. Electrophoretic-deposited Superhydrophobic Coatings. Chemistry – An Asian Journal 2021, 16, 474–491
- Sullivan et al. 2012 Sullivan, K. T.; Zhu, C.; Tanaka, D. J.; Kuntz, J. D.; Duoss, E. B.; Gash, A. E. Electrophoretic Deposition of Thermites onto Micro-Engineered Electrodes Prepared by Direct-Ink Writing. The Journal of Physical Chemistry B 2012, 117, 1686–1693
- Hamaker 1940 Hamaker, H. Formation of a deposit by electrophoresis. Transactions of the Faraday Society 1940, 35, 279–287
- Ferrari and Moreno 2010 Ferrari, B.; Moreno, R. EPD kinetics: A review. Journal of the European Ceramic Society 2010, 30, 1069–1078, 3rd International Conference on Electrophoretic Deposition: Fundamentals and Applications
- Biesheuvel and Verweij 1999 Biesheuvel, P. M.; Verweij, H. Theory of cast formation in electrophoretic deposition. Journal of the American Ceramic Society 1999, 82, 1451–1455
- Sarkar and Nicholson 1996 Sarkar, P.; Nicholson, P. S. Electrophoretic deposition (EPD): mechanisms, kinetics, and application to ceramics. Journal of the American Ceramic Society 1996, 79, 1987–2002
- Biesheuvel and Verweij 1999 Biesheuvel, P. M.; Verweij, H. Theory of Cast Formation in Electrophoretic Deposition. Journal of the American Ceramic Society 1999, 82, 1451–1455
- Anne et al. 2005 Anne, G.; Vanmeensel, K.; Vleugels, J.; Van der Biest, O. A Mathematical Description of the Kinetics of the Electrophoretic Deposition Process for Al2O3-Based Suspensions. Journal of the American Ceramic Society 2005, 88, 2036–2039
- Ferrari et al. 2006 Ferrari, B.; Moreno, R.; Cuesta, J. A. A resistivity model for electrophoretic deposition. Key Engineering Materials. 2006; pp 175–180
- Verma et al. 2020 Verma, K.; Cao, H.; Mandapalli, P.; Wille, R. Modeling and simulation of electrophoretic deposition coatings. Journal of Computational Science 2020, 41, 101075
- Pascall et al. 2012 Pascall, A. J.; Sullivan, K. T.; Kuntz, J. D. Morphology of Electrophoretically Deposited Films on Electrode Strips. The Journal of Physical Chemistry B 2012, 117, 1702–1707
- Salazar de Troya et al. 2021 Salazar de Troya, M. A.; Morales, J. R.; Giera, B.; Pascall, A. J.; Worsley, M. A.; Landingham, R.; Du Frane, W. L.; Kuntz, J. D. Modeling flow-based electrophoretic deposition for functionally graded materials. Materials & Design 2021, 209, 110000
- Giera et al. 2015 Giera, B.; Zepeda-Ruiz, L. A.; Pascall, A. J.; Kuntz, J. D.; Spadaccini, C. M.; Weisgraber, T. H. Mesoscale Particle-Based Model of Electrophoresis. Journal of The Electrochemical Society 2015, 162, D3030–D3035
- Giera et al. 2017 Giera, B.; Zepeda-Ruiz, L. A.; Pascall, A. J.; Weisgraber, T. H. Mesoscale Particle-Based Model of Electrophoretic Deposition. Langmuir 2017, 33, 652–661, Publisher: American Chemical Society
- McBride 1997 McBride, M. B. A critique of diffuse double layer models applied to colloid and surface chemistry. Clays and Clay Minerals 1997, 45, 598–608
- Ball and Melrose 1997 Ball, R. C.; Melrose, J. R. A simulation technique for many spheres in quasi-static motion under frame-invariant pair drag and Brownian forces. Physica A: Statistical Mechanics and its Applications 1997, 247, 444–472
- Kumar and Higdon 2010 Kumar, A.; Higdon, J. J. L. Origins of the anomalous stress behavior in charged colloidal suspensions under shear. Physical Review E 2010, 82, 051401
- Ermak and McCammon 1978 Ermak, D. L.; McCammon, J. A. Brownian dynamics with hydrodynamic interactions. The Journal of Chemical Physics 1978, 69, 1352–1360
- Kumar 2010 Kumar, A. Microscale dynamics in suspensions of non-spherical particles. Ph.D. thesis, 2010
- Bybee 2009 Bybee, M. D. Hydrodynamic simulations of colloidal gels: Microstructure, dynamics, and rheology. Ph.D. thesis, 2009
- Safran 2019 Safran, S. Statistical Thermodynamics Of Surfaces, Interfaces, And Membranes; CRC Press: Boca Raton, 2019
- Everaers and Ejtehadi 2003 Everaers, R.; Ejtehadi, M. R. Interaction potentials for soft and hard ellipsoids. Physical Review E 2003, 67, 041710
- Prieve and Russel 1988 Prieve, D. C.; Russel, W. B. Simplified predictions of Hamaker constants from Lifshitz theory. Journal of Colloid and Interface Science 1988, 125, 1–13
- Schunk et al. 2012 Schunk, P. R.; Pierce, F.; Lechman, J. B.; Grillet, A. M.; in’t Veld, P. J.; Weiss, H.; Stoltz, C.; Heine, D. R. Performance of mesoscale modeling methods for predicting rheological properties of charged polystyrene/water suspensions. Journal of Rheology 2012, 56, 353–384
- Probstein 2013 Probstein, R. F. Physicochemical Hydrodynamics: An Introduction; Butterworth-Heinemann, 2013
- Plimpton 1995 Plimpton, S. Fast Parallel Algorithms for Short-Range Molecular Dynamics. Journal of Computational Physics 1995, 117, 1–19
- Thompson et al. 2021 Thompson, A. P.; Aktulga, H. M.; Berger, R.; Bolintineanu, D. S.; Michael Brown, W.; Crozier, P. S.; in ’t Veld, P. J.; Kohlmeyer, A.; Moore, S. G.; Nguyen, T. D.; Shan, R.; Stevens, M.; Tranchida, J.; Trott, C.; Plimpton, S. J. LAMMPS - A flexible simulation tool for particle-based materials modeling at the atomic, meso, and continuum scales. Computer Physics Communications 2021, 108171
- Ramesh et al. 2022 Ramesh, V.; Giera, B.; Karnes, J. J.; Stratmann, N.; Schaufler, V.; Li, Y.; Rehbock, C.; Barcikowski, S. Electrophoretic Deposition of Platinum Nanoparticles using Ethanol-Water Mixtures Significantly Reduces Neural Electrode Impedance. Journal of The Electrochemical Society 2022, 169, 022504
- Chen et al. 2021 Chen, Z.; Lu, Y.; Nazemi Ashani, M.; Manica, R.; Feng, L.; Liu, Q. Modulation of Surface Charge by Mediating Surface Chemical Structures in Nonpolar Solvents with Nonionic Surfactant Used as Charge Additives. The Journal of Physical Chemistry C 2021, 125, 19525–19536
- Zhang et al. 2017 Zhang, D.; Gökce, B.; Barcikowski, S. Laser Synthesis and Processing of Colloids: Fundamentals and Applications. Chemical Reviews 2017, 117, 3990–4103, PMID: 28191931
- Marzun et al. 2014 Marzun, G.; Streich, C.; Jendrzej, S.; Barcikowski, S.; Wagener, P. Adsorption of Colloidal Platinum Nanoparticles to Supports: Charge Transfer and Effects of Electrostatic and Steric Interactions. Langmuir 2014, 30, 11928–11936
- Geng et al. 2023 Geng, X.; Liu, D.; Hewa-Rahinduwage, C. C.; Brock, S. L.; Luo, L. Electrochemical Gelation of Metal Chalcogenide Quantum Dots: Applications in Gas Sensing and Photocatalysis. Accounts of Chemical Research 2023, 56, 1087–1096
- Dickerson 2012 Dickerson, J. H. In Electrophoretic Deposition of Nanomaterials; Dickerson, J. H., Boccaccini, A. R., Eds.; Nanostructure Science and Technology; Springer: New York, NY, 2012; pp 131–155
- Dice et al. 2019 Dice, B. D.; Ramasubramani, V.; Harper, E. S.; Spellings, M. P.; Anderson, J. A.; Glotzer, S. C. Analyzing Particle Systems for Machine Learning and Data Visualization with freud. Proceedings of the 18th Python in Science Conference. 2019; pp 27–33
- Ramasubramani et al. 2020 Ramasubramani, V.; Dice, B. D.; Harper, E. S.; Spellings, M. P.; Anderson, J. A.; Glotzer, S. C. freud: A Software Suite for High Throughput Analysis of Particle Simulation Data. Computer Physics Communications 2020, 254, 107275
- Krejci et al. 2013 Krejci, A. J.; Thomas, C. G. W.; Mandal, J.; Gonzalo-Juan, I.; He, W.; Stillwell, R. L.; Park, J.-H.; Prasai, D.; Volkov, V.; Bolotin, K. I.; Dickerson, J. H. Using Voronoi Tessellations to Assess Nanoparticle–Nanoparticle Interactions and Ordering in Monolayer Films Formed through Electrophoretic Deposition. The Journal of Physical Chemistry B 2013, 117, 1664–1669
- Fejes 1942 Fejes, L. Über die dichteste Kugellagerung. Math Z 1942, 48, 676–684
- Černohorský et al. 2016 Černohorský, O.; Grym, J.; Yatskiv, R.; Pham, V. H.; Dickerson, J. H. Insight into Nanoparticle Charging Mechanism in Nonpolar Solvents To Control the Formation of Pt Nanoparticle Monolayers by Electrophoretic Deposition. ACS Applied Materials & Interfaces 2016, 8, 19680–19690