A Positive-Unlabeled Metric Learning Framework for
Document-Level Relation Extraction with Incomplete Labeling
Abstract
The goal of document-level relation extraction (RE) is to identify relations between entities that span multiple sentences. Recently, incomplete labeling in document-level RE has received increasing attention, and some studies have used methods such as positive-unlabeled learning to tackle this issue, but there is still a lot of room for improvement. Motivated by this, we propose a positive-augmentation and positive-mixup positive-unlabeled metric learning framework (P3M). Specifically, we formulate document-level RE as a metric learning problem. We aim to pull the distance closer between entity pair embedding and their corresponding relation embedding, while pushing it farther away from the none-class relation embedding. Additionally, we adapt the positive-unlabeled learning to this loss objective. In order to improve the generalizability of the model, we use dropout to augment positive samples and propose a positive-none-class mixup method. Extensive experiments show that P3M improves the F1 score by approximately 4-10 points in document-level RE with incomplete labeling, and achieves state-of-the-art results in fully labeled scenarios. Furthermore, P3M has also demonstrated robustness to prior estimation bias in incomplete labeled scenarios.
Introduction
Relation extraction (RE) involves identifying the relations between two entities in a given text, which is a fundamental task in information extraction. In the past, most RE research focused on extracting relations within a single sentence (Miwa and Bansal 2016; Zhang, Qi, and Manning 2018). However, more recent work has begun to examine document-level RE, which involves identifying relations between entities across multiple sentences in a document (Yao et al. 2019; Zhou et al. 2021; Xu et al. 2022; Yu, Yang, and Tian 2022; Zhou and Lee 2022).
Previously, document-level RE focused on fully supervised scenarios. However, due to the fact that the number of entity pairs is related to the number of entities in a quadratic way, it is very difficult to fully annotate all the relations in a document. This has made the problem of incomplete labeling a common problem in document-level RE and has attracted increasing attention from researchers. (Huang et al. 2022) noticed that the popular document-level RE dataset DocRED (Yao et al. 2019) annotated using the recommend-revise scheme contains a large number of unlabeled positive relations, i.e. false negatives. (Tan et al. 2022b) obtained a high-quality Re-DocRED dataset by supplementing the large number of missing relations in DocRED. (Wang et al. 2022) was the first to use positive-unlabeled (PU) learning, a method of learning risk estimators from positive and unlabeled data, to solve the document-level RE task with incomplete labeling and provided a powerful baseline. Despite this, they still suffer greatly from distribution bias caused by incomplete annotation of positive samples, and lack of generalization in the model.
Inspired by these studies, we propose a positive-augmentation and positive-mixup positive-unlabeled metric learning framework (P3M). Firstly, for metric learning in document-level RE, we initialize an embedding for each relation and an embedding for the none-class relation. During training, we pull the entity pair embedding closer to the corresponding relation embedding and push it away from the none-class relation embedding. We adapt this goal to the positive-unlabeled learning paradigm. Then, due to the fact that the labeled positive samples are a subset of the overall positive samples, the distribution of the labeled positive samples cannot approximate the true positive sample distribution, especially in extreme cases of incomplete labeling. To alleviate this problem, inspired by (Gao, Yao, and Chen 2021), we use the dropout noise (Srivastava et al. 2014) inherent in the model to augment the positive samples and experimentally verify the effectiveness of this augmentation.
Finally, to further enhance the model’s generalization, we use mixup to interpolate between the embeddings of positive and negative samples. Under the positive-unlabeled setting, it is not possible to obtain true negative samples, i.e. unlabeled entity pairs may still have some relations. Directly interpolating between the two would introduce noise. Thanks to the metric learning framework, which puts the embeddings of none-class relation and none-class entity pairs in the same feature space, we can use the embedding of none-class relation as pseudo-negative entity pair embedding.
We conduct experiments on the DocRED (Yao et al. 2019) dataset under incomplete labeling and extreme incomplete labeling settings, as well as the ChemDisGene (Zhang et al. 2022) dataset in the biomedical domain. We improve the F1 score by about 4-10 points compared to the baseline, demonstrating the effectiveness of our proposed P3M method. We also conduct experiments in the fully labeled scenario and achieved the best results. Finally, experiments under different estimated priors demonstrate the robustness of our method to prior estimation bias, which is greatly beneficial for the application of P3M in real-world scenarios. The contributions of this paper can be summarized as follows:111Code is available at https://github.com/www-Ye/P3M
-
•
We propose a positive-unlabeled metric learning framework that adapts the metric learning objective to the positive-unlabeled learning paradigm in document-level RE.
-
•
We use the dropout noise inherent in the model to augment the positive samples, expanding the distribution of the positive samples.
-
•
We use mixup to interpolate between the embeddings of positive entity pairs and none-class relation, further enhancing the model’s generalization.
-
•
Experiments show that our method achieves the state-of-the-art results in various incomplete labeling settings and in fully labeled scenario, as well as robustness to prior estimation bias.
Methodology
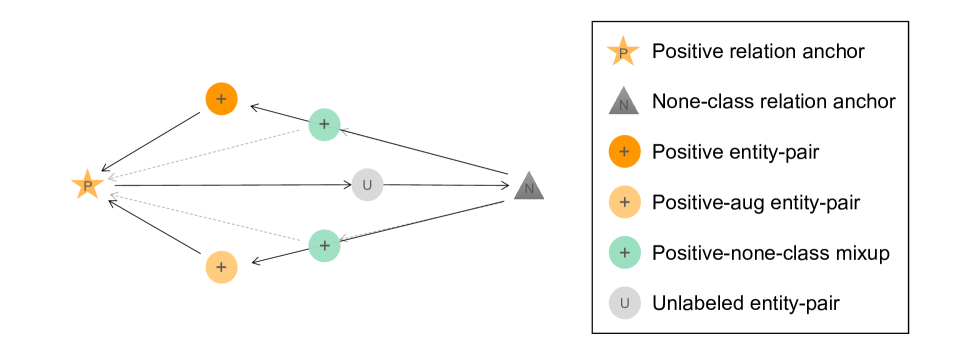
In this section, we introduce the details of P3M. Firstly, we propose positive-unlabeled metric learning for document-level RE. Then, we introduce an augmentation method for positive samples based on dropout. Finally, we propose positive-none-class mixup to further enhance the model’s generalization. The overall architecture of P3M is shown in Figure 1.
Positive-Unlabeled Metric Learning for Document-Level RE
Document-level RE can be viewed as a multi-label classification task, and there are a large number of entity pairs with no relation. Previous work (Zhou and Lee 2022; Wang et al. 2022) has shown that setting an additional none-class relation can be very helpful for performance. Therefore, in our method, we transform document-level RE with none-class relation into a proxy-based metric learning task, setting an anchor for each positive relation and none-class relation, respectively.
Let be an instance space and be a label space, where is the number of pre-defined classes. An instance is associated with a subset of labels, identified by a binary vector , where if the -th label is positive for , and otherwise. We define each relation embedding as , where is the none-class relation embedding, and the rest are predefined relation embeddings. The goal is to learn an embedding that brings it closer to its corresponding relation embedding and push it further away from the none-class relation embedding .
For simplicity, we use the SoftMaxnorm proposed by (Qian et al. 2019) as the metric learning loss function, which can be seen as a smoothed version of triplet loss. For a given entity pair and a given relation, the loss function can be expressed as:
| (1) | ||||
where , , need to be normalized, and is a scaling factor.
In the inference stage, for any entity pair, the relation exists if and vice versa. In the following part we use instead of as an abbreviation.
For -th class, assume that the data follow an unknown probability distribution with density , as the positive marginal, as the negative marginal, and as the marginal. In positive-negative metric learning (PNM), the ideal loss to optimize would be:
| (2) | ||||
where and is the positive and negative prior of the -th class. , .
In positive-unlabeled metric learning (PUM), due to the absence of negative samples, we cannot estimate from the data. Following (du Plessis, Niu, and Sugiyama 2014), PU learning assumes that unlabeled data can reflect the true overall distribution, that is, . The expected loss formulation can be defined as:
| (3) | ||||
here and can alternatively represent because .
Since there are already some labeled relations in the document-level RE dataset, this leads to prior shift in the unlabeled data. We also use the method of prior shift in the training data to obtain the final positive-unlabeled metric learning (PM) expected loss:
| (4) | ||||
where , and . or mean that the -th class is labeled or unlabeled, respectively. For details on prior shift in document-level RE, please refer to (Wang et al. 2022).
As a result, by rewriting Eq.4 in the form of data approximation and applying non-negative risk estimation (Kiryo et al. 2017) to the PM framework to address the overfitting problem caused by the complexity of the model, we can obtain:
| (5) | ||||
where and denote cases that the -th sample of class is positive or unlabeled. and are the number of positive and unlabeled samples of class , respectively. In addition, in order to address the severe class imbalance problem, we multiply the first term in Eq.LABEL:eq7 by as the class weight.
Positive Augmentation Based on Dropout Noise
It is important to note that since the labeled sample is only a portion of the true positive sample, meaning the distribution is biased, is not equal to . This means that the first term in Eq.LABEL:eq7 is a biased approximation of the first term in Eq.4. To alleviate this issue, we can use data augmentation to expand the distribution of positive samples. Here, inspired by (Gao, Yao, and Chen 2021), we use the model’s own dropout perturbation to augment the positive samples to get , and the perturbed entity pair embedding is . However, since we have only augmented the positive samples, the prior in the unlabeled data does not change, and we can obtain the positive-augmentation positive-unlabeled metric learning (P2M) objective loss:
| (6) | ||||
here . It can be written in the non-negative form of data approximation as:
| (7) | ||||
We will compare the difference between augmenting positive samples and augmenting all samples in the main results subsection of the experiments.
Positive-None-Class Mixup
In order to further enhance the generalization of the model, our goal is to obtain more diverse entity pair embeddings. To achieve this, we can interpolate between positive and negative samples of each class to obtain mixed entity pair representations:
| (8) |
here and are the positive and negative samples of class , respectively. is sampled from a distribution ( and ). However, in PU learning, we cannot obtain true negative samples, which means that there are some positive entity pairs in the unlabeled samples, resulting in bias when interpolating with unlabeled entity pairs. Thanks to the metric learning framework, which places the relation embedding and the entity pair embedding in the same feature space, we can use the none-class relation embedding to stand in for pseudo-negative entity pairs. Therefore, Eq.8 can be rewritten as:
| (9) |
We will compare the difference between using mixup with none-class relation embedding and the original method in the main results subsection of the experiments. According to this formulation, the mixup loss function can be reformulated as:
| (10) | ||||
here we perform mixup on both the original positive samples and the augmented positive samples. Finally, we rewrite this equation in the form of data approximation:
| (11) | ||||
Therefore, the final loss of our positive-augmentation and positive-mixup positive-unlabeled metric learning (P3M) framework is:
| (12) |
where is a hyperparameter that controls the strength of positive-mixup.
| Dataset | DocRED | DocRED_ext | Re-DocRED | ChemDisGene | ||
|---|---|---|---|---|---|---|
| train | train | train | test | train | test | |
| # docs | 3,053 | 3,053 | 3,053 | 500 | 76,942 | 523 |
| # rels | 96 | 96 | 96 | 14 | ||
| Avg # ents | ||||||
| Avg # rels | ||||||
| Model | DocRED | DocRED_ext | ||||||
|---|---|---|---|---|---|---|---|---|
| Ign F1 | F1 | P | R | Ign F1 | F1 | P | R | |
| BiLSTM† | ||||||||
| GAIN+BERT | ||||||||
| DocuNET+RoBERTa | ||||||||
| ATLOP+BERT | ||||||||
| SSR-PU+ATLOP+BERT | ||||||||
| PM+ATLOP+BERTBase | ||||||||
| P2M(all)+ATLOP+BERTBase | ||||||||
| P2M+ATLOP+BERTBase | ||||||||
| P3M(ori)+ATLOP+BERTBase | ||||||||
| P3M+ATLOP+BERTBase | ||||||||
| ATLOP+RoBERTa | ||||||||
| SSR-PU+ATLOP+RoBERTa | ||||||||
| PM+ATLOP+RoBERTaLarge | ||||||||
| P2M(all)+ATLOP+RoBERTaLarge | ||||||||
| P2M+ATLOP+RoBERTaLarge | ||||||||
| P3M(ori)+ATLOP+RoBERTaLarge | ||||||||
| P3M+ATLOP+RoBERTaLarge | ||||||||
Experiments
In this section, we evaluate the performance of P3M in various incompletely labeled document-level RE datasets and settings as well as in the fully labeled scenario. We also analyze the effectiveness of different components of the method.
Experimental Setups
Datasets.
DocRED (Yao et al. 2019) is a large-scale document-level RE dataset constructed from Wikipedia, containing 96 predefined relations. However, the original dataset contains a large amount of incomplete labeling phenomena, (Tan et al. 2022b) proposed a high-quality revised version Re-DocRED. In our experiments, we use the incompletely labeled DocRED original training set and the fully labeled Re-DocRED test set. In order to further analyze the performance of the method in incompletely labeled scenarios, we also use the extreme incompletely labeled training set DocRED_ext constructed by (Wang et al. 2022) for experiments. ChemDisGene (Zhang et al. 2022) is a multi-label document-level RE dataset in the biomedical field. We use the incompletely labeled training set constructed by distantly supervised of CTD database (Davis et al. 2021) and the fully labeled All relationships test set constructed by additional annotation by domain experts for experiments. The datasets are in English and used for their intended purpose. The detailed statistics of the datasets are shown in Table 1. The average number of relations in the incompletely labeled training sets, especially the extremely incompletely labeled sets, is far less than that in the test sets, indicating the large number of false negatives in the training sets.
Implementation Details.
In our experiments, we use ATLOP (Zhou et al. 2021) as the encoding model for relation representation learning. Further, we apply cased (Devlin et al. 2019) and (Liu et al. 2019) for DocRED and (Gu et al. 2022) for ChemDisGene. We use Huggingface’s Transformers (Wolf et al. 2020) to implement all the models and AdamW (Loshchilov and Hutter 2019) as the optimizer, and apply a linear warmup (Goyal et al. 2017) at the first 6% steps followed by a linear decay to 0. For DocRED, we set the learning rates to 3e-5. For ChemDisGene, the learning rate is set to 2e-5. The batch size (number of documents per batch) is set to 4 and 8 for two datasets, respectively. In our experiments, we fixed , , , and the dropout rate to 0.2. In order to make a fair comparison, we use the same prior estimation as in (Wang et al. 2022), setting and for extreme incomplete labeling, setting . The training stopping criteria are set as follows: 10 epochs for both two dataset. We do not use any fully labeled validation or test sets in any stage of the training process and report the results of the final model by running five times with different random seeds (62, 63, 64, 65, 66). All experiments are conducted with 1 Tesla A100 or 1 Tesla V100 GPU.
Baseline.
For DocRED, we use fully supervised models BiLSTM (Yao et al. 2019), GAIN (Zeng et al. 2020), DocuNET (Zhang et al. 2021), and ATLOP (Zhou et al. 2021), as well as the positive-unlabeled learning method SSR-PU (Wang et al. 2022) as the baseline models. For ChemDisGene, we use BRAN (Verga, Strubell, and McCallum 2018), PubmedBert (Gu et al. 2022), PubmedBert+BRAN (Zhang et al. 2022), ATLOP, and SSR-PU as the baselines.
Evaluation Metric.
We use micro F1 (F1), micro ignore F1 (Ign F1), precision (P), and recall (R) to evaluate the overall performance of models on DocRED. Ign F1 denotes the F1 score excluding the relations shared by the training and test set. We use micro F1 (F1), precision (P), and recall (R) to evaluate the models on ChemDisGene.
| Model | F1 | P | R |
|---|---|---|---|
| BRAN‡ | |||
| PubmedBert‡ | |||
| BRAN+PubmedBert‡ | |||
| ATLOP+PubmedBert† | |||
| SSR-PU+PubmedBert† | |||
| PM+PubmedBert | |||
| P2M(all)+PubmedBert | |||
| P2M+PubmedBert | |||
| P3M(ori)+PubmedBert | |||
| P3M+PubmedBert |
| Model | Ign F1 | F1 |
|---|---|---|
| ATLOP+BERT | ||
| SSR-PU+BERT | ||
| P3M+BERTBase | ||
| ATLOP+RoBERTa | ||
| DocuNET+RoBERTa | ||
| KD-DocRE+RoBERTa | ||
| SSR-PU+RoBERTa | ||
| P3M+RoBERTaLarge |
Main Results
In this subsection, we compare the results between PM, P2M(all), P2M, P3M(ori), and P3M. P2M(all) refers to augmenting all samples, while P3M(ori) refers to the original mixup method that uses unlabeled samples for mixing.
Results on DocRED.
As shown in Table 2, traditional supervised learning methods such as BiLSTM, GAIN, DocuNET, and ATLOP have a dramatic decline in performance, especially in recall, in the incompletely labeled scenario. The SSR-PU method, which uses PU learning, effectively alleviates this problem and achieves a huge improvement on the basis of the ATLOP encoder model. Our framework P3M, on the other hand, improves the F1 score by 4.89 and 4.84, respectively, for the and settings, compared to SSR-PU in the incompletely labeled scenario. And when using extremely incompletely labeled training sets, the two settings respectively improve the F1 score by 9.78 and 10.12. The outstanding improvement shows the effectiveness of our proposed framework.
In the DocRED experiment, P3M shows a slight precision drop compared to SSR-PU, possibly due to expanded positive sample distribution causing errors in ambiguous case classification. However, recall increases of 11.20 and 11.85 under the and settings justify this trade-off. This classification error, likely stemming from the base model’s limitations, can be mitigated by enhancing the base model. In DocRED_ext, our method not only improves recall by 14.26 and 15.26 over SSR-PU under the same settings but also raises precision by 1.60 and 1.47, respectively, highlighting its value in label-scarce scenarios.
We compare different variations of our method. P2M(all) and P2M use dropout to augment samples. P2M(all) augments all samples, and there is a slight improvement when using the DocRED training set compared to the basic PM framework. However, in extreme scenarios of incomplete labeling, performance deteriorates. We believe this is caused by the fact that since the data itself is positive and unlabeled, augmenting all samples instead introduces some additional noise. P2M, which only augments positive samples, does not have this problem. The increase in the distribution of positive samples further improves the performance of the model and to some extent relieves the distribution bias caused by incompletely labeled positive samples. The regular P3M(ori) method has a considerable improvement over P2M because in document-level RE, the number of negative samples is far greater than that of positive samples. Therefore, direct sampling of unlabeled samples will only introduce a small number of false negatives, but there will still be bias. P3M has more performance improvement compared to P3M(ori), which shows that using none-class relation embedding as pseudo-negative samples effectively mitigates the bias of directly using unlabeled samples for mixup.
Results on ChemDisGene.
As shown in Table 3, similar to the results on DocRED, the performance of supervised learning methods has a large decline, while SSR-PU has a large improvement compared to them. Our proposed P3M improved by 5.06 F1 score compared to SSR-PU and achieved a new best result. Notably, the All relationships test set of ChemDisGene is sourced from another corpus DrugProt (Miranda et al. 2021) and is additionally annotated by human experts, making the test set have a larger deviation from the training set. However, our proposed framework has better robustness under this deviation.
For different variations of the method, P2M(all) has an obvious performance decrease compared to PM, which may be caused by the larger deviation between the training set and the test set, and this deviation is further amplified by the augmentation of all samples. P2M shows further improvement compared to PM, indicating the help of dropout augmentation in improving the diversity of positive sample distribution. P3M(ori) and P3M, which added positive-mixup method, both have larger improvements, verifying the help of mixup in improving the generalization of positive-unlabeled metric learning framework. Due to the scarcity of positive samples, sampling as negative samples from the unlabeled samples only causes a small bias, making P3M(ori) still able to achieve a good result and the performance gap between P3M and P3M(ori) is smaller.
| Model | Ign F1 | F1 | P | R |
|---|---|---|---|---|
| P3M | ||||
| P3M | ||||
| P3M | ||||
| P3M | ||||
| P3M |
Additional Analysis
Fully Supervised Setting.
We conduct experiments on Re-DocRED (Tan et al. 2022b) under a fully supervised setting. In the experiments, we set , , with a dropout rate of 0.1, and other hyperparameters remained unchanged. As shown in Table 4, we compared our framework with the existing state-of-the-art methods ATLOP (Zhou et al. 2021), DocuNET (Zhang et al. 2021), KD-DocRE (Tan et al. 2022a), and SSR-PU (Wang et al. 2022). Our framework achieves the best results as well.
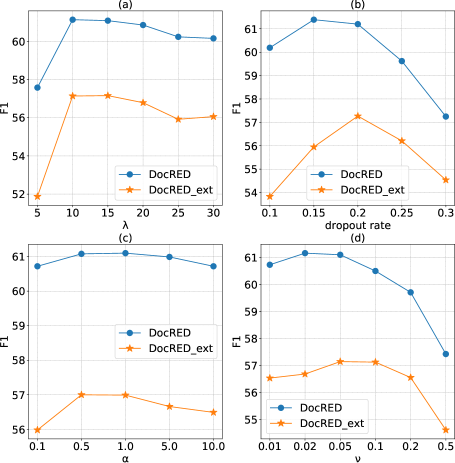
Effect of Hyperparameters.
Figure 2 shows the effect of hyperparameters on the model under the DocRED and DocRED_ext incomplete labeling settings. (a) shows the effect of the scaling factor , with similar trends under both settings, and being the best choice. (b) shows the effect of the dropout rate, indicating that the greater the degree of incompleteness in labeling, the greater the dropout rate needed to enhance diversity, but too large a dropout rate will also introduce more noise. (c) shows the effect of , indicating that the model is not sensitive to the choice of , and can be seen as a uniform mixup interpolation between distributions. (d) shows the effect of , with similar trends under both settings, and more severe incomplete labeling requires slightly larger mixup strength.
Effect of Prior Estimation.
Table 5 shows the effect of different prior estimates on the model. It can be seen that our framework is not sensitive to errors in prior estimates, especially in cases where the prior estimate is too small. Even when , the model still performs well, demonstrating the robustness of our method under errors in prior estimates, which is very helpful for real-world applications.
Related Work
Document-Level Relation Extraction.
Previously, effective methods for document-level relation extraction (RE) have mainly been graph-based models and transformer-based models. Graph-based models (Nan et al. 2020; Li et al. 2020; Zeng et al. 2020; Zeng, Wu, and Chang 2021; Xu, Chen, and Zhao 2021) use graph neural networks to gather entity information for relational inference, while transformer-based methods (Zhou et al. 2021; Xu et al. 2021; Zhang et al. 2021; Tan et al. 2022a) capture long-range dependencies implicitly. Recently, it has been found that there are a large number of false negatives in document-level RE datasets, i.e. incomplete labels (Huang et al. 2022; Tan et al. 2022b). (Wang et al. 2022) proposed using positive-unlabeled learning to address this problem.
Positive-Unlabeled Learning.
Positive-unlabeled (PU) learning (Elkan and Noto 2008; du Plessis, Niu, and Sugiyama 2014, 2015; Kiryo et al. 2017; Garg et al. 2021), as a emerging weakly supervised learning paradigm, aims to learn classifiers from positive and unlabeled data, and has gained continuous attention from researchers. PU learning has been widely applied in various tasks, such as text classification (Li and Liu 2003), sentence embedding (Cao et al. 2021), named entity recognition (Peng et al. 2019; Zhou, Li, and Li 2022), knowledge graph completion (Tang et al. 2022), and sentence-level RE (He et al. 2020) in the NLP field. (Chuang et al. 2020) used PU learning to address the issue of negative samples potentially carrying the same label in contrastive learning.
Deep Metric Learning.
Our work is inspired by metric learning and mainly falls into two categories: pair-based losses and proxy-based losses. Pair-based methods (Hadsell, Chopra, and LeCun 2006; Schroff, Kalenichenko, and Philbin 2015; Sohn 2016; Wang et al. 2019) focus on the relationships between individual samples, and contrastive learning can be considered a subset of this approach. Proxy-based methods like Proxy-NCA (Movshovitz-Attias et al. 2017) and NormFace (Wang et al. 2017) consider the relationships between proxies and samples, and (Qian et al. 2019) unified the relationship between SoftMax loss and triplet loss, and proposed a new SoftTriplet loss. Proxy-based methods are a type of approach that focuses on improving generalization while keeping training complexity low, although they may not fully utilize the relationships between individual samples.
Data Augmentation.
Data augmentation is a key factor in deep learning performance and is widely used in many fields (Shorten and Khoshgoftaar 2019; Hedderich et al. 2021). (Wei and Zou 2019; Ma 2019) proposed to augment words by randomly inserting and replacing them, while (Lee et al. 2021) augmented the word embeddings directly. (Gao, Yao, and Chen 2021) used simple dropout to augment sentence embeddings for unsupervised contrastive learning. Mixup (Zhang et al. 2018; Verma et al. 2019) can be considered as another common data augmentation method, where interpolation is used to improve the generalization performance of the model between two samples. It is increasingly used and researched in the NLP (Chen, Yang, and Yang 2020; Yin et al. 2021; Wu et al. 2022) and the PU learning (Chen et al. 2020; Wei et al. 2020; Li et al. 2022; Zhao et al. 2022) fields. (Jeong et al. 2022) proposed a document augmentation dense retrieval framework that uses both methods.
Conclusion and Future Work
To address document-level RE with incomplete labeling, we propose a positive-unlabeled metric learning framework P3M. First, we combine positive-unlabeled learning with metric learning to learn better representations. Then, we use dropout augmentation to expand the distribution of labeled positive samples. Finally, we use none-class relation embedding as pseudo-negative samples and propose a positive-none-class mixup method to further improve the model’s generalization performance. Experiments demonstrate that our method achieve state-of-the-art results in both incomplete and complete labeling scenarios, as well as robustness to prior estimation bias. In the future, we will explore various metric learning losses and data augmentation methods.
Acknowledgments
This work is funded by National Natural Science Foundation of China (under project No. 62377013).The computation is supported by the ECNU Multifunctional Platform for Innovation (001).
References
- Cao et al. (2021) Cao, L.; Larsson, E.; von Ehrenheim, V.; Rocha, D. D. C.; Martin, A.; and Horn, S. 2021. PAUSE: Positive and Annealed Unlabeled Sentence Embedding. In EMNLP, 10096–10107.
- Chen et al. (2020) Chen, H.; Liu, F.; Wang, Y.; Zhao, L.; and Wu, H. 2020. A Variational Approach for Learning from Positive and Unlabeled Data. In NeurIPS.
- Chen, Yang, and Yang (2020) Chen, J.; Yang, Z.; and Yang, D. 2020. MixText: Linguistically-Informed Interpolation of Hidden Space for Semi-Supervised Text Classification. In ACL, 2147–2157.
- Chuang et al. (2020) Chuang, C.; Robinson, J.; Lin, Y.; Torralba, A.; and Jegelka, S. 2020. Debiased Contrastive Learning. In NeurIPS.
- Davis et al. (2021) Davis, A. P.; Grondin, C. J.; Johnson, R. J.; Sciaky, D.; Wiegers, J.; Wiegers, T. C.; and Mattingly, C. J. 2021. Comparative Toxicogenomics Database (CTD): update 2021. Nucleic Acids Res., D1138–D1143.
- Devlin et al. (2019) Devlin, J.; Chang, M.; Lee, K.; and Toutanova, K. 2019. BERT: Pre-training of Deep Bidirectional Transformers for Language Understanding. In NAACL-HLT, 4171–4186.
- du Plessis, Niu, and Sugiyama (2014) du Plessis, M. C.; Niu, G.; and Sugiyama, M. 2014. Analysis of Learning from Positive and Unlabeled Data. In NeurIPS, 703–711.
- du Plessis, Niu, and Sugiyama (2015) du Plessis, M. C.; Niu, G.; and Sugiyama, M. 2015. Convex Formulation for Learning from Positive and Unlabeled Data. In ICML, volume 37, 1386–1394.
- Elkan and Noto (2008) Elkan, C.; and Noto, K. 2008. Learning classifiers from only positive and unlabeled data. In SIGKDD, 213–220.
- Gao, Yao, and Chen (2021) Gao, T.; Yao, X.; and Chen, D. 2021. SimCSE: Simple Contrastive Learning of Sentence Embeddings. In EMNLP, 6894–6910.
- Garg et al. (2021) Garg, S.; Wu, Y.; Smola, A. J.; Balakrishnan, S.; and Lipton, Z. C. 2021. Mixture Proportion Estimation and PU Learning: A Modern Approach. In NeurIPS, 8532–8544.
- Goyal et al. (2017) Goyal, P.; Dollár, P.; Girshick, R. B.; Noordhuis, P.; Wesolowski, L.; Kyrola, A.; Tulloch, A.; Jia, Y.; and He, K. 2017. Accurate, Large Minibatch SGD: Training ImageNet in 1 Hour. CoRR, abs/1706.02677.
- Gu et al. (2022) Gu, Y.; Tinn, R.; Cheng, H.; Lucas, M.; Usuyama, N.; Liu, X.; Naumann, T.; Gao, J.; and Poon, H. 2022. Domain-Specific Language Model Pretraining for Biomedical Natural Language Processing. ACM Trans. Comput. Heal., 2:1–2:23.
- Hadsell, Chopra, and LeCun (2006) Hadsell, R.; Chopra, S.; and LeCun, Y. 2006. Dimensionality Reduction by Learning an Invariant Mapping. In (CVPR, 1735–1742.
- He et al. (2020) He, Z.; Chen, W.; Wang, Y.; Zhang, W.; Wang, G.; and Zhang, M. 2020. Improving Neural Relation Extraction with Positive and Unlabeled Learning. In AAAI, 7927–7934.
- Hedderich et al. (2021) Hedderich, M. A.; Lange, L.; Adel, H.; Strötgen, J.; and Klakow, D. 2021. A Survey on Recent Approaches for Natural Language Processing in Low-Resource Scenarios. In NAACL-HLT, 2545–2568.
- Huang et al. (2022) Huang, Q.; Hao, S.; Ye, Y.; Zhu, S.; Feng, Y.; and Zhao, D. 2022. Does Recommend-Revise Produce Reliable Annotations? An Analysis on Missing Instances in DocRED. In ACL, 6241–6252.
- Jeong et al. (2022) Jeong, S.; Baek, J.; Cho, S.; Hwang, S. J.; and Park, J. C. 2022. Augmenting Document Representations for Dense Retrieval with Interpolation and Perturbation. In ACL, 442–452.
- Kiryo et al. (2017) Kiryo, R.; Niu, G.; du Plessis, M. C.; and Sugiyama, M. 2017. Positive-Unlabeled Learning with Non-Negative Risk Estimator. In NeurIPS, 1675–1685.
- Lee et al. (2021) Lee, S.; Kang, M.; Lee, J.; and Hwang, S. J. 2021. Learning to Perturb Word Embeddings for Out-of-distribution QA. In ACL-IJCNLP, 5583–5595.
- Li et al. (2020) Li, B.; Ye, W.; Sheng, Z.; Xie, R.; Xi, X.; and Zhang, S. 2020. Graph Enhanced Dual Attention Network for Document-Level Relation Extraction. In COLING, 1551–1560.
- Li et al. (2022) Li, C.; Li, X.; Feng, L.; and Ouyang, J. 2022. Who Is Your Right Mixup Partner in Positive and Unlabeled Learning. In ICLR.
- Li and Liu (2003) Li, X.; and Liu, B. 2003. Learning to Classify Texts Using Positive and Unlabeled Data. In IJCAI, 587–594.
- Liu et al. (2019) Liu, Y.; Ott, M.; Goyal, N.; Du, J.; Joshi, M.; Chen, D.; Levy, O.; Lewis, M.; Zettlemoyer, L.; and Stoyanov, V. 2019. RoBERTa: A Robustly Optimized BERT Pretraining Approach. CoRR, abs/1907.11692.
- Loshchilov and Hutter (2019) Loshchilov, I.; and Hutter, F. 2019. Decoupled Weight Decay Regularization. In ICLR.
- Ma (2019) Ma, E. 2019. NLP Augmentation. https://github.com/makcedward/nlpaug. Accessed: 2023-12-27.
- Miranda et al. (2021) Miranda, A.; Mehryary, F.; Luoma, J.; Pyysalo, S.; Valencia, A.; and Krallinger, M. 2021. Overview of DrugProt BioCreative VII track: quality evaluation and large scale text mining of drug-gene/protein relations. In Proceedings of the seventh BioCreative challenge evaluation workshop.
- Miwa and Bansal (2016) Miwa, M.; and Bansal, M. 2016. End-to-End Relation Extraction using LSTMs on Sequences and Tree Structures. In ACL.
- Movshovitz-Attias et al. (2017) Movshovitz-Attias, Y.; Toshev, A.; Leung, T. K.; Ioffe, S.; and Singh, S. 2017. No Fuss Distance Metric Learning Using Proxies. In ICCV, 360–368.
- Nan et al. (2020) Nan, G.; Guo, Z.; Sekulic, I.; and Lu, W. 2020. Reasoning with Latent Structure Refinement for Document-Level Relation Extraction. In ACL, 1546–1557.
- Peng et al. (2019) Peng, M.; Xing, X.; Zhang, Q.; Fu, J.; and Huang, X. 2019. Distantly Supervised Named Entity Recognition using Positive-Unlabeled Learning. In ACL, 2409–2419.
- Qian et al. (2019) Qian, Q.; Shang, L.; Sun, B.; Hu, J.; Tacoma, T.; Li, H.; and Jin, R. 2019. SoftTriple Loss: Deep Metric Learning Without Triplet Sampling. In ICCV, 6449–6457.
- Schroff, Kalenichenko, and Philbin (2015) Schroff, F.; Kalenichenko, D.; and Philbin, J. 2015. FaceNet: A unified embedding for face recognition and clustering. In CVPR, 815–823.
- Shorten and Khoshgoftaar (2019) Shorten, C.; and Khoshgoftaar, T. M. 2019. A survey on Image Data Augmentation for Deep Learning. J. Big Data, 60.
- Sohn (2016) Sohn, K. 2016. Improved Deep Metric Learning with Multi-class N-pair Loss Objective. In NeurIPS, 1849–1857.
- Srivastava et al. (2014) Srivastava, N.; Hinton, G. E.; Krizhevsky, A.; Sutskever, I.; and Salakhutdinov, R. 2014. Dropout: a simple way to prevent neural networks from overfitting. J. Mach. Learn. Res., 1929–1958.
- Tan et al. (2022a) Tan, Q.; He, R.; Bing, L.; and Ng, H. T. 2022a. Document-Level Relation Extraction with Adaptive Focal Loss and Knowledge Distillation. In ACL (Findings), 1672–1681.
- Tan et al. (2022b) Tan, Q.; Xu, L.; Bing, L.; Ng, H. T.; and Aljunied, S. M. 2022b. Revisiting DocRED - Addressing the False Negative Problem in Relation Extraction. In EMNLP, 8472–8487.
- Tang et al. (2022) Tang, Z.; Pei, S.; Zhang, Z.; Zhu, Y.; Zhuang, F.; Hoehndorf, R.; and Zhang, X. 2022. Positive-Unlabeled Learning with Adversarial Data Augmentation for Knowledge Graph Completion. In IJCAI, 2248–2254.
- Verga, Strubell, and McCallum (2018) Verga, P.; Strubell, E.; and McCallum, A. 2018. Simultaneously Self-Attending to All Mentions for Full-Abstract Biological Relation Extraction. In NAACL-HLT, 872–884.
- Verma et al. (2019) Verma, V.; Lamb, A.; Beckham, C.; Najafi, A.; Mitliagkas, I.; Lopez-Paz, D.; and Bengio, Y. 2019. Manifold Mixup: Better Representations by Interpolating Hidden States. In ICML, 6438–6447.
- Wang et al. (2017) Wang, F.; Xiang, X.; Cheng, J.; and Yuille, A. L. 2017. NormFace: L Hypersphere Embedding for Face Verification. In ACM MM, 1041–1049.
- Wang et al. (2019) Wang, X.; Han, X.; Huang, W.; Dong, D.; and Scott, M. R. 2019. Multi-Similarity Loss With General Pair Weighting for Deep Metric Learning. In CVPR, 5022–5030.
- Wang et al. (2022) Wang, Y.; Liu, X.; Hu, W.; and Zhang, T. 2022. A Unified Positive-Unlabeled Learning Framework for Document-Level Relation Extraction with Different Levels of Labeling. In EMNLP, 4123–4135.
- Wei and Zou (2019) Wei, J. W.; and Zou, K. 2019. EDA: Easy Data Augmentation Techniques for Boosting Performance on Text Classification Tasks. In EMNLP-IJCNLP, 6381–6387.
- Wei et al. (2020) Wei, T.; Shi, F.; Wang, H.; Tu, W.; and Li, Y. 2020. MixPUL: Consistency-based Augmentation for Positive and Unlabeled Learning. CoRR, abs/2004.09388.
- Wolf et al. (2020) Wolf, T.; Debut, L.; Sanh, V.; Chaumond, J.; Delangue, C.; Moi, A.; Cistac, P.; Rault, T.; Louf, R.; Funtowicz, M.; Davison, J.; Shleifer, S.; von Platen, P.; Ma, C.; Jernite, Y.; Plu, J.; Xu, C.; Scao, T. L.; Gugger, S.; Drame, M.; Lhoest, Q.; and Rush, A. M. 2020. Transformers: State-of-the-Art Natural Language Processing. In EMNLP-Demos, 38–45.
- Wu et al. (2022) Wu, L.; Xie, P.; Zhou, J.; Zhang, M.; Ma, C.; Xu, G.; and Zhang, M. 2022. Robust Self-Augmentation for Named Entity Recognition with Meta Reweighting. In NAACL-HLT, 4049–4060.
- Xu et al. (2021) Xu, B.; Wang, Q.; Lyu, Y.; Zhu, Y.; and Mao, Z. 2021. Entity Structure Within and Throughout: Modeling Mention Dependencies for Document-Level Relation Extraction. In AAAI, 14149–14157.
- Xu et al. (2022) Xu, W.; Chen, K.; Mou, L.; and Zhao, T. 2022. Document-Level Relation Extraction with Sentences Importance Estimation and Focusing. In NAACL-HLT, 2920–2929.
- Xu, Chen, and Zhao (2021) Xu, W.; Chen, K.; and Zhao, T. 2021. Document-Level Relation Extraction with Reconstruction. In AAAI, 14167–14175.
- Yao et al. (2019) Yao, Y.; Ye, D.; Li, P.; Han, X.; Lin, Y.; Liu, Z.; Liu, Z.; Huang, L.; Zhou, J.; and Sun, M. 2019. DocRED: A Large-Scale Document-Level Relation Extraction Dataset. In ACL, 764–777.
- Yin et al. (2021) Yin, W.; Wang, H.; Qu, J.; and Xiong, C. 2021. BatchMixup: Improving Training by Interpolating Hidden States of the Entire Mini-batch. In ACL-IJCNLP (Findings), 4908–4912.
- Yu, Yang, and Tian (2022) Yu, J.; Yang, D.; and Tian, S. 2022. Relation-Specific Attentions over Entity Mentions for Enhanced Document-Level Relation Extraction. In NAACL-HLT, 1523–1529.
- Zeng, Wu, and Chang (2021) Zeng, S.; Wu, Y.; and Chang, B. 2021. SIRE: Separate Intra- and Inter-sentential Reasoning for Document-level Relation Extraction. In ACL-IJCNLP (Findings), 524–534.
- Zeng et al. (2020) Zeng, S.; Xu, R.; Chang, B.; and Li, L. 2020. Double Graph Based Reasoning for Document-level Relation Extraction. In EMNLP, 1630–1640.
- Zhang et al. (2022) Zhang, D.; Mohan, S.; Torkar, M.; and McCallum, A. 2022. A Distant Supervision Corpus for Extracting Biomedical Relationships Between Chemicals, Diseases and Genes. In LREC, 1073–1082.
- Zhang et al. (2018) Zhang, H.; Cissé, M.; Dauphin, Y. N.; and Lopez-Paz, D. 2018. mixup: Beyond Empirical Risk Minimization. In ICLR.
- Zhang et al. (2021) Zhang, N.; Chen, X.; Xie, X.; Deng, S.; Tan, C.; Chen, M.; Huang, F.; Si, L.; and Chen, H. 2021. Document-level Relation Extraction as Semantic Segmentation. In IJCAI, 3999–4006.
- Zhang, Qi, and Manning (2018) Zhang, Y.; Qi, P.; and Manning, C. D. 2018. Graph Convolution over Pruned Dependency Trees Improves Relation Extraction. In EMNLP, 2205–2215.
- Zhao et al. (2022) Zhao, Y.; Xu, Q.; Jiang, Y.; Wen, P.; and Huang, Q. 2022. Dist-PU: Positive-Unlabeled Learning from a Label Distribution Perspective. In CVPR, 14441–14450.
- Zhou, Li, and Li (2022) Zhou, K.; Li, Y.; and Li, Q. 2022. Distantly Supervised Named Entity Recognition via Confidence-Based Multi-Class Positive and Unlabeled Learning. In ACL, 7198–7211.
- Zhou et al. (2021) Zhou, W.; Huang, K.; Ma, T.; and Huang, J. 2021. Document-Level Relation Extraction with Adaptive Thresholding and Localized Context Pooling. In AAAI, 14612–14620.
- Zhou and Lee (2022) Zhou, Y.; and Lee, W. S. 2022. None Class Ranking Loss for Document-Level Relation Extraction. In IJCAI, 4538–4544.