Rejuvenating Star Formation Activity in an Early-type Dwarf Galaxy, LEDA 1915372, with Accreted HI Gas
Abstract
We report a rare astrophysical phenomenon, in which an early-type dwarf galaxy (dE), LEDA 1915372, is accreting gas from a nearby star-forming dwarf galaxy, MRK 0689, and is rejuvenating star-formation activity at the center. Both LEDA 1915372 and MRK 0689 have similar brightness of = 16.99 and 16.78 mag, respectively. They are located in a small group environment, separated by a sky-projected distance of 20.27 kpc (up to 70 kpc in three dimension), and have a relative line-of-sight radial velocity of 6 km s-1. The observation of 21 cm emission with the Giant Metrewave Radio Telescope provides strong evidence of interaction between the pair dwarf galaxies in terms of neutral hydrogen (Hi) morphology and kinematics. In particular, the Hi map reveals that the two galaxies are clearly connected by a gas bridge, and the gas components of both LEDA 1915372 and MRK 0689 share a common direction of rotation. We also find that the Hi emission peak deviates from LEDA 1915372 toward its optical blue plume, suggesting a tidal origin of ongoing central star formation. Our findings provide a new path to the formation of blue-cored dEs.
1 Introduction
The most common type of galaxy found in dense environments such as galaxy groups or clusters are early-type dwarf galaxies (dEs; Binggeli et al., 1987, 1990; Ferguson & Binggeli, 1994). These galaxies are typically red in color and have a smooth and regular appearance. However, recent studies have shown that a significant fraction of dEs display substructural features such as spiral arms, bars, and central nuclei (Lisker et al., 2006b, 2007). In addition to the structural diversity, variations in color suggest the presence of a range of stellar populations within dEs (Paudel et al., 2010, 2011).
A particularly intriguing subgroup of dEs is the one that contains young central stellar populations, known as blue-centered dEs (Lisker et al., 2006a; Urich et al., 2017; Hamraz et al., 2019). They have been observed in a variety of environments, from completely isolated regions to galaxy groups and clusters, and in some instances, they even constitute the majority of the dE population (Pak et al., 2014; Chung et al., 2019; Rey et al., 2023). However, they are nearly absent in the massive Coma cluster (den Brok et al., 2011).
While classical dEs are typically not believed to have ongoing star formation or significant gas or dust content, there are exceptions such as NGC 205 (Richter et al., 1987; Haas, 1998), NGC 185 (Marleau et al., 2010) and IC 225 (Gu et al., 2006) that have been observed to have such features. Additionally, Conselice et al. (2003) reported a 15% detection rate of neutral hydrogen (Hi) in dEs in the Virgo Cluster. The Arecibo Legacy Fast ALFA (ALFALFA) survey identified 12 dEs that possess Hi above the detection limit (Hallenbeck et al., 2012, 2017; Haynes et al., 2018). The presence of Hi in these low-mass early-type galaxies raises questions about their origin.
Several scenarios have been proposed to explain the presence of cold gas and the central star-forming nature of early-type galaxies (Chun et al., 2020). These galaxies could be in a late transitional stage, where their internal star-forming gas has been stripped, and only small amounts of Hi are being replenished internally (Koleva et al., 2013). Alternatively, the detected Hi could have recently been acquired from external sources, such as tidal interactions with nearby companions or the accretion of smaller dwarf galaxies. A mixture of these different processes is also likely possible (Oosterloo et al., 2007; Serra et al., 2008).
In this work, we report a blue-centered dE, LEDA 1915372, which appears to have acquired star-forming gas from its nearby companion galaxy, MRK 0689. To perform a detailed analysis of the gas properties in this interacting system, we conduct radio observations using the Giant Metrewave Radio Telescope (GMRT) to map the 21 cm Hi emission in the region.
2 Identification
Our primary objective is to create an extensive catalog of dE galaxies located in diverse environments. To achieve this goal, we conducted a thorough visual search of color images from the SDSS and Legacy surveys within the local volume ( 0.02), systematically identifying and inspecting relevant objects (Paudel et al., 2011). In this Letter, we present our findings on LEDA 1915372, a dE galaxy located in a less dense group environment. LEDA 1915372 is a blue-centered dE with ongoing central star-forming activity. It is similar to other central starburst dE galaxies that we have previously studied in Paudel & Yoon (2020), but it features a faint tidal tail and is located near another star-forming dwarf galaxy, MRK 0689.
| Properties | LEDA 1915372 | MRK 0689 |
|---|---|---|
| R.A. (h:m:s) | 15:36:18.90 | 15:36:19.441 |
| decl. (d:m:s) | 30:43:32.88 | 30:40:56.34 |
| 0.005839 | 0.005859 | |
| (Mpc) | 26.45 | 26.52 |
| (mag) | 16.990.01 | 16.780.01 |
| (mag) | 0.630.01\tablenoteafter masking the central region. Without masking the central region, the value of color is 0.45 mag. | 0.330.01 |
| SFR ( yr-1) | 0.0120.002 | 0.0870.002 |
| 12+Log(O/H) | 8.150.05 | 8.180.05 |
| Log() | 8.810.07 | 8.730.07 |
| Log() | 9.090.01 | 9.160.01 |
At the position R.A. = 15:36:18.90, decl. = +30:43:32.88, and with a redshift of = 0.0059, we discovered a rare dE, LEDA 1915372, in close proximity to another star-forming dwarf galaxy, MRK 0689. Both galaxies possess faint tidal tails, but MRK 0689 appears to be more disturbed. Based on the assumption that they lie within the same sky plane, the sky-projected separation between the two galaxies is 20.27 kpc (2.62). However, considering their individual distances from us, the actual three-dimensional separation could extend up to 70 kpc. A relative line-of-sight velocity between them is 6 km s-1. LEDA 1915372 and MRK 0689 have comparable brightness, with = 16.99 and 16.78 mag for LEDA 1915372 and MRK 0689, respectively. The physical properties of these galaxies are summarized in Table 1.
The pair is situated in a relatively sparsely populated region, with NGC 5961 being their nearest bright galaxy companion. Within a sky-projected radius of 700 kpc and a relative line-of-sight radial velocity of 700 km s-1 with respect to NGC 5961, we identified eight galaxies. The absolute -band magnitude of NGC 5961 is 18.24 mag, suggesting that it is not a particularly luminous galaxy. Based on the number of galaxies in its vicinity and their radial velocity distribution, NGC 5961 appears to form a small group of galaxies (Kourkchi & Tully, 2017). The projected physical separation between NGC 5961 and LEDA 1915372 is 117 kpc, with a relative line-of-sight redial velocity of 163 km s-1 between the two galaxies. For this work, the distances to the member galaxies are derived from the Numerical Action Methods model111http://edd.ifa.hawaii.edu/NAMcalculator/ (Shaya et al., 2017; Kourkchi et al., 2020). The distance to the LEDA 1915372, MRK 0689, and NGC 5961 are 26.45, 26.52, and 27.45 Mpc, respectively.
3 Data analysis
Our study greatly benefited from the abundance of multiwavelength data that was easily accessible through public archives. This allowed us to conduct a comprehensive analysis of the morphology and stellar population characteristics of our sources. Specifically, we conducted a multiwavelength investigation of the system, using archival images from the Legacy survey (Dey et al., 2019) and the Spitzer Space Telescope, covering a wide wavelength range from optical to infrared. In addition, we observed the system using the GMRT to capture the Hi 21 cm line.
3.1 Analysis of archival data
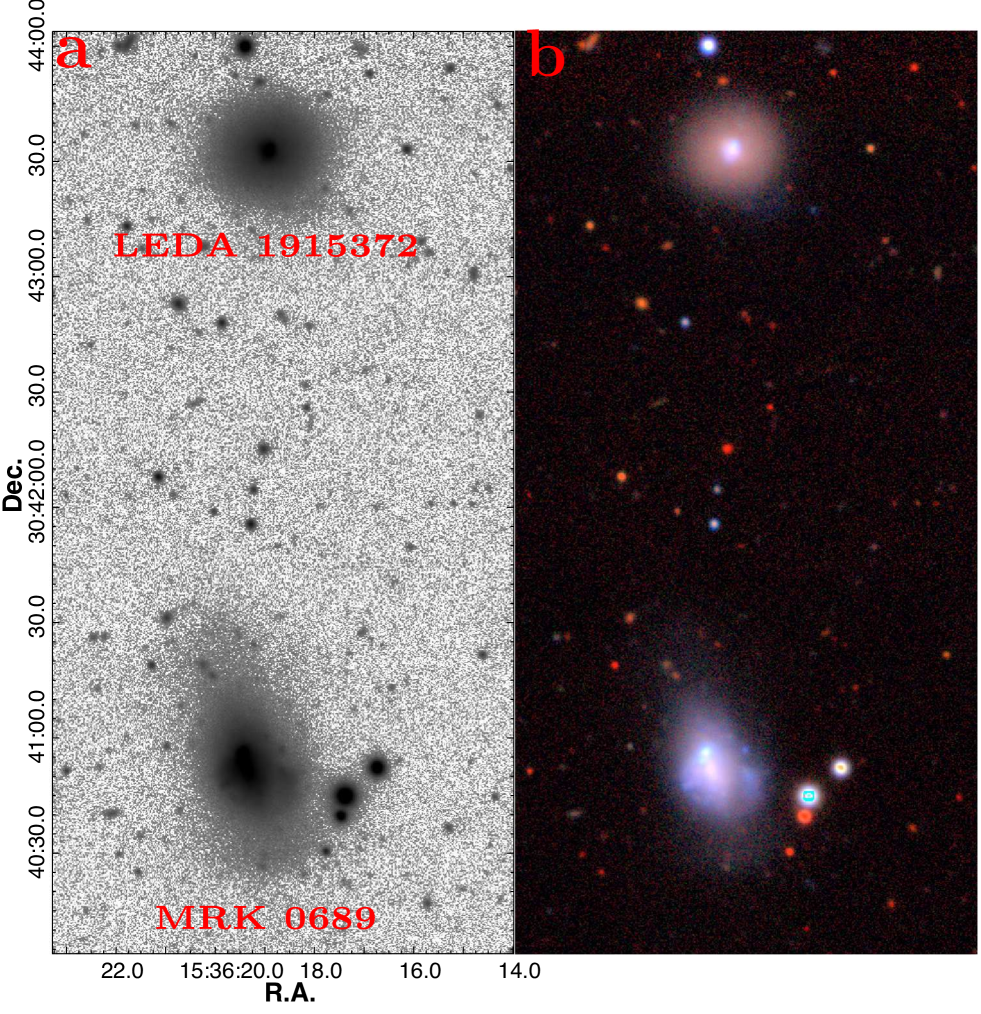
In Figure 1(a), we display the Legacy -band image of the region around LEDA 1915372 and its companion, with a field of view of 12. In Figure 1(b), we show a tricolor image obtained by combining , , and -band images. Despite both galaxies in the pair appearing disturbed, we observe no connection between them in the optical images. LEDA 1915372 exhibits a regular dE appearance, with a noticeable blue color at its center. Notably, we find a blue star-forming blob located off-center with a separation of 2 from the center. This feature is more easily seen in the color map presented in the following panels.
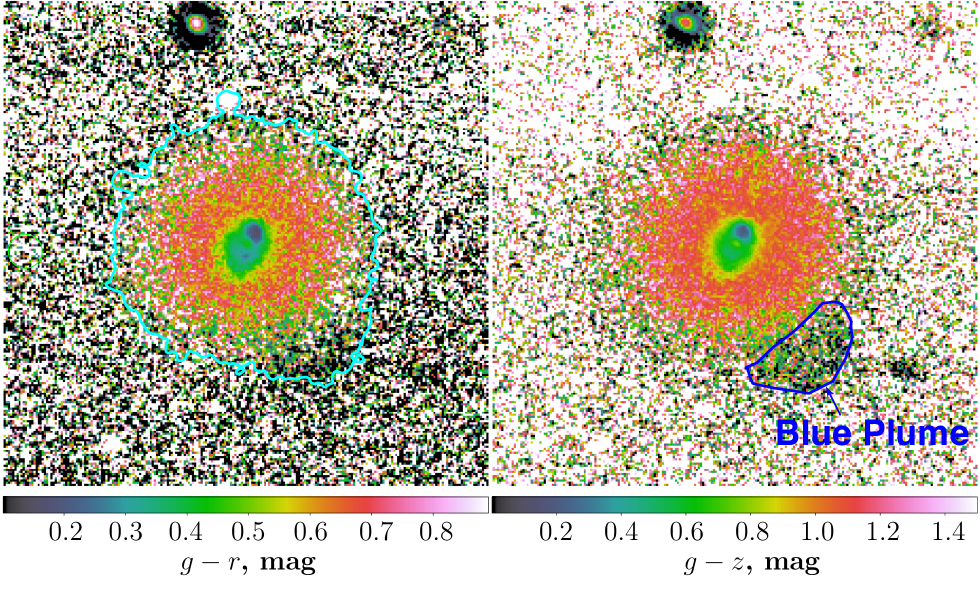
Upon a careful examination of both the grayscale and tricolor images of LEDA 1915372, we have detected the presence of an extended low-surface-brightness feature in the lower right region, which may be a tidal tail. In Figure 2, the extended low-surface-brightness region is bluer compared to the dE main body, which we refer to as the “Blue Plume.” LEDA 1915372 has an overall color of 0.46 mag, and after masking the central blue region, for the main body becomes 0.63 mag. The Blue Plume has a color of 0.35 mag, which is significantly bluer than the main body of the galaxy.
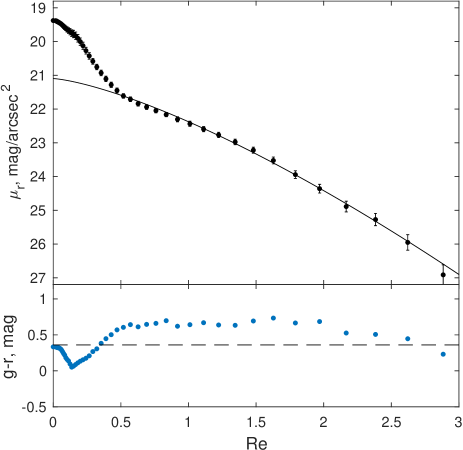
We also performed surface photometry on the optical images of LEDA 1915372. We utilized the legacy -band images and subtracted the sky backgrounds using the same method described in Paudel et al. (2023). To extract the galaxy’s major-axis light profile, we employed the IRAF ellipse task, following the manual masking of any non-related background and foreground objects. We held the center and position angle constant during the ellipse fit, allowing only the ellipticity to vary. The center of the galaxy was calculated using the IRAF task , and the position angle was determined via multiple iterative ellipse runs. In order to avoid complexity during the modeling process, we excluded the inner star-forming region. We utilized the minimization approach to fit the observed galaxy light profile to a Sérsic function.
In Figure 3, we present the result of surface photometry on the optical images of LEDA 1915372. In the upper panel, the Sérsic function effectively models the major axis light profile of this object, with an effective radius of 12 (1.2 kpc) and an index = 0.92. These characteristics are commonly found in dEs located within the Virgo cluster. In the lower panel, we also provide a color profile along the major-axis, which reveals a noticeable color gradient between the inner and outer regions of the dE. Notably, the bluest peak is not located at the center, indicating that the star-forming blob is off-center. The average color value (0.35 mag) of the Blue Plume (shown by the dashed line) is similar to that of LEDA 1915372’s center (0.33 mag).
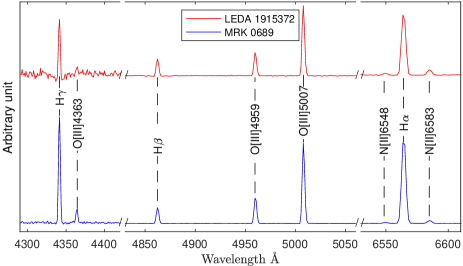
The SDSS has targeted both galaxies for spectroscopic observation, and we obtained their optical spectra from the SDSS archives. These galaxies display typical emission lines found in H ii regions. Among other emission lines, we also detected the [O iii]4363 auroral line in both galaxies, as shown in Figure 4. The [O iii]4363 emission line is highly sensitive to temperature and enables us to directly measure the gas phase metallicity by calculating the electron temperature. To obtain the value of 12 + log(O/H), we applied a method outlined by Pérez-Montero (2017). The resulting values for 12 + log(O/H) are 8.150.05 and 8.180.05 dex for LEDA 1915372 and MRK 0689, respectively. While using the empirical O3N2 method provided by Marino et al. (2013), which analyzes a combination of the line ratios Hα/[N ii] and [O iii]/Hβ, we obtained the values for 12 + log(O/H) are 8.170.05 and 8.120.05 dex for LEDA 1915372 and MRK 0689, respectively.
To measure the stellar mass and star formation rate (SFR) of the galaxies, our study utilized the Spitzer Space Telescope infrared imaging data. The Infrared Array Camera (IRAC) images at 3.6 and 4.5-microns and Multi-band Imaging Photometer (MIPS) at 24 m were retrieved from the IRSA222https://irsa.ipac.caltech.edu/Missions/spitzer.html archive database. Due to their shallow depth compared to the Legacy optical images, the IRAC images are utilized only for photometry. After carefully removing any unrelated foreground and background objects, and we performed aperture photometry. To derive the stellar mass, we used a calibration provided by Eskew et al. (2012), which allowed us to convert the IRAC 3.6 and 4.5 m fluxes to the stellar mass. We then calculated the SFR from MIPS 24 m flux using the empirical formula provided by Rieke et al. (2009). The SFRs of LEDA 1915372 and MRK 0689 derived from the MIPS 24 m fluxs are 0.0120.002 and 0.0870.002 yr-1, respectively.
3.2 Radio 21-cm observation
To obtain a detailed understanding of the Hi distribution in LEDA 1915372 and its companion galaxy MRK 0689, we conducted Hi interferometric observations using the GMRT on 2018 August 03. The total on-source time of the observation was 6.46 hr. The observations were carried out with a baseband bandwidth of 16.67 MHz, split into 512 channels, providing a velocity resolution of approximately 7 km s-1. The GMRT primary beam at the band is 24, and the images presented in this study are synthesized at two different resolutions of beam sizes of 1613 and 5551 for high and low resolutions, respectively.
The data were processed using the modular CASA v6.5.2 (McMullin et al., 2007; CASA Team et al., 2022). The raw visibilities underwent several loops of initial flagging and calibration (amplitude, phase, and bandpass). Subsequently, the continuum was estimated in the line-free channels and subtracted using the CASA task “uvcontsub”. The continuum-free data were then imaged using “tclean” with a velocity resolution of 14 km s-1 at two different spatial resolutions of 5551 and 1613. We used a robust of 0.5, and a CLEAN threshold of 2 with a single CLEAN mask extending up to a primary-beam gain level of 0.2 (pbmask=0.2). The moment-0 and moment-1 maps were then constructed using the “immoments” task in CASA333The entire processing pipeline will be described in detail in Bait et al. (2023) in prep, and available online., by manually selecting the channels showing emission and a simple threshold blanking at 2.
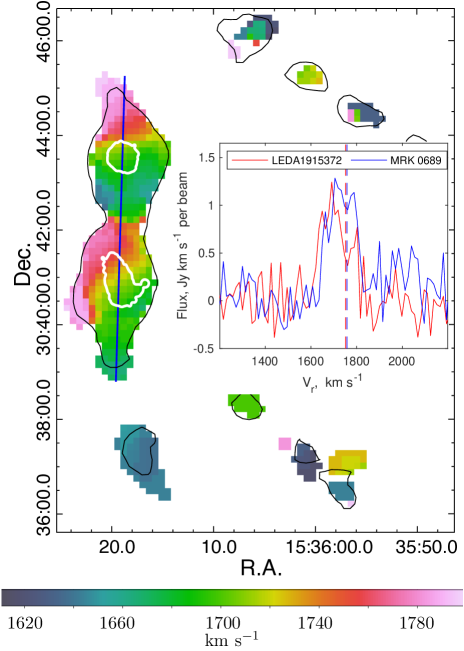

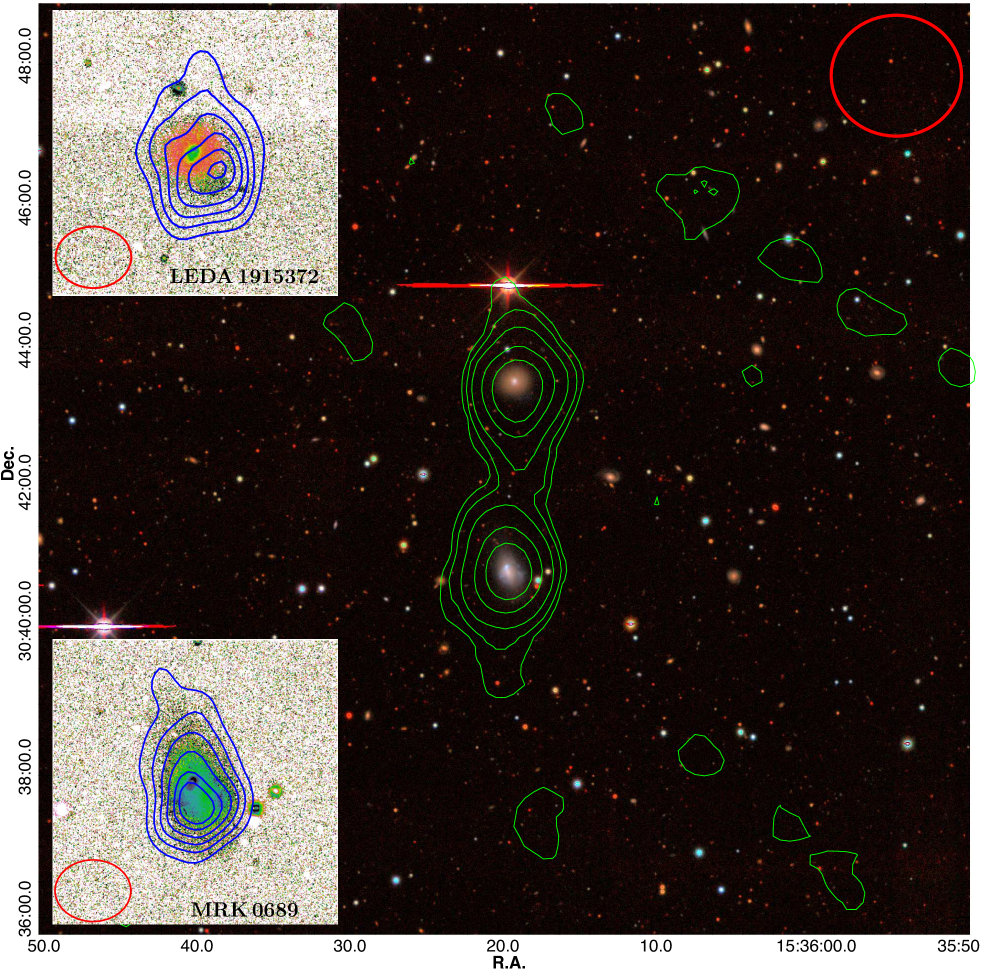
Figure 5 shows the contours obtained from the integrated Hi map overlaid on the Legacy , and -band combined tricolor image. The green contour represents the low-resolution Hi cube. The field view of the image is 1212. The Hi bridge is clearly visible, validating an interaction between LEDA 1915372 and MRK 0689. We show the beam size in the upper right corner, which is significantly larger than the galaxy extension. The lowest contour corresponds to 51019 cm-2 (5 assuming a 20 km s-1 line width). Looking at the detached contours around the galaxies, it appears that some areas of extended diffuse emission are separate from the main body of the galaxies. However, it is important to note that the identification of these detached diffuse regions is only marginally above the signal-to-noise ratio (SNR) threshold in the current dataset. Consequently, we have excluded these faint detections from any further analysis.
Further, our data cube is also processed using the powerful SoFiA-2 source-finding algorithm. By employing the default parameters of SoFiA-2, we utilized the S+C source-finding algorithm, incorporating a threshold of 4 for optimal sensitivity and reliability. The reliability parameter was set to “true” while maintaining the default parameters. This comprehensive analysis successfully verifies the existence of the HI bridge connecting LEDA 1915372 and MRK 0689.
The insets of Figure 5 illustrate the contour maps obtained from high-resolution synthesized beams, overlayed on the color maps. In LEDA 1915372, the Hi gas is noticeably displaced to the southwest with a tail that points northward. Furthermore, the Hi emission peak is co-located with Blue Plume, indicating its tidal origin. The high-resolution Hi map of MRK 0689 also shows the extension of diffuse emission toward LEDA 1915372.
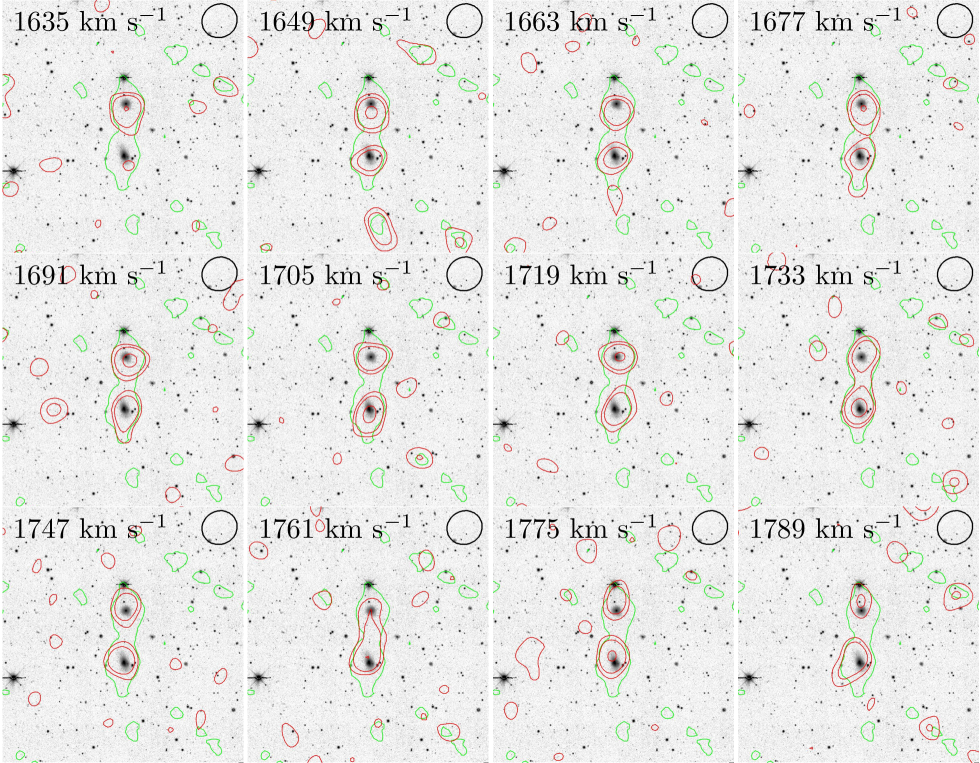
The Hi tidal tail structure and kinematics are further illustrated in the channel maps shown in Figure 6. To guide the position of the channel map, we also show a grayscale image of the system in the background where the green contours represent the lowest column density level shown in Figure 5. The connection in Hi between interacting galaxies becomes clearer in the channel maps of velocity range 16351789 km s-1.
Figure 7 shows the velocity field of the system. In both LEDA 1915372 and MRK 0689, we detect a pronounced velocity gradient. The overall gradient is primarily aligned with the major axis of the main stellar body of MRK 0689, implying a shared direction of angular momentum. Additionally, we provide an inset displaying the integrated spectrum of both galaxies. Notably, the middle dip of the Hi velocity profile accurately corresponds with their respective optical velocities.
Figure 8 shows a position-velocity (PV) diagram of the system. The PV diagram was produced using CARTA v3.0444https://cartavis.org/, by crossing a line region over the Hi bridge and the two galaxies. The S/N is poor in the PV diagram, particularly in the bridge area. However, it successfully shows the presence of gradient and connection between the two galaxies.
The integrated Hi emission-line flux of the system was measured using a large 9 diameter aperture centering at MRK 0689, yielding a total flux of 9.64 Jy km s-1. The value is slightly lower than the 21 cm emission-line flux reported in NED, which was measured by a 48 m single-dish Green Bank Telescope Telescope (GBT) with a 9 beam in the L band. The ALFALFA survey, conducted using the Arecibo Telescope with a 3.5 beam size, detected MRK 0689. The cataloged value of the 21 cm emission-line flux for MRK 0689 (AGC 251077) in the ALFALFA survey was 7.16 Jy km-1. To corroborate this finding, we measured the flux of MRK 0689 using a similar 3.5 diameter aperture and obtained a value of 6.31 Jy km-1. This small discrepancy could be attributed to factors such as loss of UV coverage due to flagging. Also, the GMRT synthesized beam could have resolved diffuse emission from the extended and low column density regions. However, by using a much larger aperture of 12 that covers the entire area of both interacting galaxies and detached diffused regions, we obtained a total emission flux of 13.05 Jy km s-1. The integrated Hi line flux density of the LEDA 1915372 and MRK 0689, estimated from high-resolution maps, are 5.01 and 5.94 Jy km s-1, respectively.
4 Discussion and Conclusion
This study investigates an interacting system of two dwarf galaxies exhibiting distinct morphologies. The optical and radio 21 cm emission-line observations provide clear evidence of an ongoing interaction between the two galaxies. In the subsequent sections, we discuss potential scenarios for the origin of Hi in dEs and the nature of the central star formation.
4.1 Origin of Hi in dEs
Observations have revealed the presence of Hi gas within giant and normal elliptical galaxies located in field environments. Early-type galaxies are believed to acquire gas via various forms of accretion, such as the absorption of gas-rich satellites, cooling of ionized gas, and cold-mode accretion from the intergalactic medium. The presence of recent or ongoing accretion onto galaxies, as highlighted by Oosterloo et al. (2010), usually results in a surge of star formation. Conversely, despite possessing a high gas content, inactive accretion tends to lead to a dearth of star formation. However, the origin of Hi in dEs remains poorly understood due to a lack of adequate studies in both theoretical and observational domains.
Using optical and 21 cm radio data, we have observed an ongoing interaction between LEDA 1915372 and MRK 0689. This interaction unquestionably plays a role in the revival of star formation activity in LEDA 1915372. However, the crucial question that remains is whether the Hi gas present in LEDA 1915372 is intrinsic to the galaxy or if it was acquired from MRK 0689. Our assessment of the Hi emission line indicates that both galaxies have a comparable amount of Hi mass. This raises the possibility that a significant transfer of gas mass may have occurred between the two galaxies in the past. This could imply that almost half of the gas mass was transferred from MRK 0689 to the neighboring companion, LEDA 1915372.
One intriguing aspect of LEDA 1915372 is that most of its gas mass is located outside the galaxy’s main stellar body and instead is displaced around the Blue Plume, a faint tidal feature. Notably, the Blue Plume harbors a relatively young stellar population, suggesting the tidal feature is built up through newly formed stars. Such a blue tidal feature is rare in observations, especially in dEs. In contrast, the Hi distribution in MRK 0689 is colocated with its main stellar body. The optical color map shows that the extended tidal feature of MRK 0689 is redder than its main body, providing an interesting contrast to the blue tidal feature observed in LEDA 1915372.
The Hi kinematics of both galaxies exhibit similar rotation directions, indicating that they share angular momentum. Moreover, both galaxies have nearly identical emission-line metallicities (12+log[O/H]), suggesting that they have undergone similar gas enrichment histories. This provides compelling evidence for the shared origin of Hi in both galaxies. If LEDA 1915372 were made up of recycled or leftover gas from aging galaxies, the emission-line metallicity in dEs would typically be higher than what we currently observe in LEDA 1915372, as suggested by Paudel & Yoon (2020).
Assuming that the Blue Plume was entirely created by a tidal interaction, its color of 0.34 mag suggests that the interaction age is at least 1 Giga year or more (Urich et al., 2017). It is likely that LEDA 1915372 accreted gas during an interaction with MRK 0689 long ago, which fueled star formation at the center of LEDA 1915372 and formed a blue tidal tail. Determining the exact age of the interacting system is beyond the scope of this work as it requires a detailed analysis of the stellar population properties using spatially resolved optical spectroscopic data.
4.2 Off-centered star formation in dEs
In our previous study (Paudel & Yoon, 2020), we reported the presence of the central starburst region in dE galaxies, which could potentially evolve into young nuclei. The central, compact, blue star-forming blob is often positioned slightly off-center from the dE center, as in the case of LEDA 1915372. This raises the question of whether the off-centered starburst activity is a sign of external accretion.
Off-centered nuclear starburst activity can be triggered by the gravitational force from an imperfectly aligned merger. High-resolution simulations have shown that interaction-driven compression is most likely to trigger starburst activity in the outer regions of galaxies (Renaud et al., 2022), which is consistent with the off-centered starbursts observed in many interacting systems (Jarrett et al., 2006). This is especially important when a galaxy accretes a lump of Hi gas with a mass significantly less than the galaxy itself. As the host and the gas lumps come closer, the gravitational force compresses the gas before it reaches the center. On the other hand, the high angular momentum in the gas prohibits radial inflow to the center, and a starburst episode can be ignited in the compressed gas mass before it falls to the galaxy’s center (Blumenthal & Barnes, 2018). In this context, understanding the dynamics of off-centered nuclear starbursts in interacting galaxies can help to explain how off-centered nuclei are formed in dwarf galaxies.
References
- Binggeli et al. (1987) Binggeli, B., Tammann, G. A., & Sandage, A. 1987, AJ, 94, 251, doi: 10.1086/114467
- Binggeli et al. (1990) Binggeli, B., Tarenghi, M., & Sandage, A. 1990, A&A, 228, 42
- Blumenthal & Barnes (2018) Blumenthal, K. A., & Barnes, J. E. 2018, MNRAS, 479, 3952, doi: 10.1093/mnras/sty1605
- CASA Team et al. (2022) CASA Team, Bean, B., Bhatnagar, S., et al. 2022, PASP, 134, 114501, doi: 10.1088/1538-3873/ac9642
- Chun et al. (2020) Chun, K., Smith, R., Shin, J., Kim, S. S., & Raouf, M. 2020, ApJ, 889, 173, doi: 10.3847/1538-4357/ab5afb
- Chung et al. (2019) Chung, J., Rey, S.-C., Sung, E.-C., et al. 2019, ApJ, 879, 97, doi: 10.3847/1538-4357/ab25e8
- Conselice et al. (2003) Conselice, C. J., O’Neil, K., Gallagher, J. S., & Wyse, R. F. G. 2003, ApJ, 591, 167, doi: 10.1086/375216
- den Brok et al. (2011) den Brok, M., Peletier, R. F., Valentijn, E. A., et al. 2011, MNRAS, 414, 3052, doi: 10.1111/j.1365-2966.2011.18606.x
- Dey et al. (2019) Dey, A., Schlegel, D. J., Lang, D., et al. 2019, AJ, 157, 168, doi: 10.3847/1538-3881/ab089d
- Eskew et al. (2012) Eskew, M., Zaritsky, D., & Meidt, S. 2012, AJ, 143, 139, doi: 10.1088/0004-6256/143/6/139
- Ferguson & Binggeli (1994) Ferguson, H. C., & Binggeli, B. 1994, A&A Rev., 6, 67, doi: 10.1007/BF01208252
- Gu et al. (2006) Gu, Q., Zhao, Y., Shi, L., Peng, Z., & Luo, X. 2006, AJ, 131, 806, doi: 10.1086/498891
- Haas (1998) Haas, M. 1998, A&A, 337, L1
- Hallenbeck et al. (2017) Hallenbeck, G., Koopmann, R., Giovanelli, R., et al. 2017, AJ, 154, 58, doi: 10.3847/1538-3881/aa7c1d
- Hallenbeck et al. (2012) Hallenbeck, G., Papastergis, E., Huang, S., et al. 2012, AJ, 144, 87, doi: 10.1088/0004-6256/144/3/87
- Hamraz et al. (2019) Hamraz, E., Peletier, R. F., Khosroshahi, H. G., et al. 2019, A&A, 625, A94, doi: 10.1051/0004-6361/201935076
- Haynes et al. (2018) Haynes, M. P., Giovanelli, R., Kent, B. R., et al. 2018, ApJ, 861, 49, doi: 10.3847/1538-4357/aac956
- Jarrett et al. (2006) Jarrett, T. H., Polletta, M., Fournon, I. P., et al. 2006, AJ, 131, 261, doi: 10.1086/498414
- Koleva et al. (2013) Koleva, M., Bouchard, A., Prugniel, P., De Rijcke, S., & Vauglin, I. 2013, MNRAS, 428, 2949, doi: 10.1093/mnras/sts238
- Kourkchi et al. (2020) Kourkchi, E., Courtois, H. M., Graziani, R., et al. 2020, AJ, 159, 67, doi: 10.3847/1538-3881/ab620e
- Kourkchi & Tully (2017) Kourkchi, E., & Tully, R. B. 2017, ApJ, 843, 16, doi: 10.3847/1538-4357/aa76db
- Lisker et al. (2006a) Lisker, T., Glatt, K., Westera, P., & Grebel, E. K. 2006a, AJ, 132, 2432, doi: 10.1086/508414
- Lisker et al. (2006b) Lisker, T., Grebel, E. K., & Binggeli, B. 2006b, AJ, 132, 497, doi: 10.1086/505045
- Lisker et al. (2007) Lisker, T., Grebel, E. K., Binggeli, B., & Glatt, K. 2007, ApJ, 660, 1186, doi: 10.1086/513090
- Marino et al. (2013) Marino, R. A., Rosales-Ortega, F. F., Sánchez, S. F., et al. 2013, A&A, 559, A114, doi: 10.1051/0004-6361/201321956
- Marleau et al. (2010) Marleau, F. R., Noriega-Crespo, A., & Misselt, K. A. 2010, ApJ, 713, 992, doi: 10.1088/0004-637X/713/2/992
- McMullin et al. (2007) McMullin, J. P., Waters, B., Schiebel, D., Young, W., & Golap, K. 2007, in Astronomical Society of the Pacific Conference Series, Vol. 376, Astronomical Data Analysis Software and Systems XVI, ed. R. A. Shaw, F. Hill, & D. J. Bell, 127
- Oosterloo et al. (2010) Oosterloo, T., Morganti, R., Crocker, A., et al. 2010, MNRAS, 409, 500, doi: 10.1111/j.1365-2966.2010.17351.x
- Oosterloo et al. (2007) Oosterloo, T. A., Morganti, R., Sadler, E. M., van der Hulst, T., & Serra, P. 2007, A&A, 465, 787, doi: 10.1051/0004-6361:20066384
- Pak et al. (2014) Pak, M., Rey, S.-C., Lisker, T., et al. 2014, MNRAS, 445, 630, doi: 10.1093/mnras/stu1722
- Paudel et al. (2011) Paudel, S., Lisker, T., & Kuntschner, H. 2011, MNRAS, 413, 1764, doi: 10.1111/j.1365-2966.2011.18256.x
- Paudel et al. (2010) Paudel, S., Lisker, T., Kuntschner, H., Grebel, E. K., & Glatt, K. 2010, MNRAS, 405, 800, doi: 10.1111/j.1365-2966.2010.16507.x
- Paudel & Yoon (2020) Paudel, S., & Yoon, S.-J. 2020, ApJ, 898, L47, doi: 10.3847/2041-8213/aba6ed
- Paudel et al. (2023) Paudel, S., Yoon, S.-J., Yoo, J., et al. 2023, ApJS, 265, 57, doi: 10.3847/1538-4365/acbfa7
- Pérez-Montero (2017) Pérez-Montero, E. 2017, PASP, 129, 043001, doi: 10.1088/1538-3873/aa5abb
- Renaud et al. (2022) Renaud, F., Segovia Otero, Á., & Agertz, O. 2022, MNRAS, 516, 4922, doi: 10.1093/mnras/stac2557
- Rey et al. (2023) Rey, S.-C., Kim, S., Chung, J., & Lee, Y. 2023, arXiv e-prints, arXiv:2302.07808, doi: 10.48550/arXiv.2302.07808
- Richter et al. (1987) Richter, O. G., Tammann, G. A., & Huchtmeier, W. K. 1987, A&A, 171, 33
- Rieke et al. (2009) Rieke, G. H., Alonso-Herrero, A., Weiner, B. J., et al. 2009, ApJ, 692, 556, doi: 10.1088/0004-637X/692/1/556
- Serra et al. (2008) Serra, P., Trager, S. C., Oosterloo, T. A., & Morganti, R. 2008, A&A, 483, 57, doi: 10.1051/0004-6361:20078954
- Shaya et al. (2017) Shaya, E. J., Tully, R. B., Hoffman, Y., & Pomarède, D. 2017, ApJ, 850, 207, doi: 10.3847/1538-4357/aa9525
- Urich et al. (2017) Urich, L., Lisker, T., Janz, J., et al. 2017, A&A, 606, A135, doi: 10.1051/0004-6361/201730897