Observable precursor of topological phase transition: temperature-dependent electronic specific heat in two-dimensional Dirac fermions
Abstract
Dirac points in two-dimensional massless Dirac fermions are topologically protected. Although single Dirac point cannot disappear solely, a pair of two Dirac points annihilates after merging at a time-reversal invariant momentum (TRIM). This process triggers a topological phase transition. In this paper, we numerically calculate the electronic specific heat () of the systems with a honeycomb lattice and -(BEDT-TTF)2I3 in the case that two Dirac points are moving and merging by changing the ratio of the magnitude between the transfer integrals, which can be controlled by uniaxial pressure for example. When two Dirac points are close to but not at TRIM, the temperature dependence exhibits a crossover from (expected for separated Dirac points) at low temperatures () to (expected in the case of the merged Dirac points) at high temperatures (). Here, denotes the crossover temperature, which is determined by the potential barrier magnitude between two Dirac points. Our findings demonstrate that the precursor of the topological phase transition is observed through the temperature-dependence of the electronic specific heat.
I Introduction
Graphene is a well-known two-dimensional system consisting of massless Dirac fermionsnovo2005 , where the Dirac points originating from Dirac equation in relativistic quantum mechanics exist. The energy dispersion at the Dirac points is linear. These Dirac points are topologically protected, ensuring their stability even under the application of uniaxial pressure, except for pair annihilation.
In the realm of quasi-two-dimensional organic conductorsreview ; review2 , the presence of a two dimensional Dirac fermion system has been unveiled in -(BEDT-TTF)2I3 through tight-binding model analysisKatayama2006 and the first-principles band calculationsKino ; Alemany2012 , and the existence of the Dirac point at the Fermi energy () has been also experimentally confirmed through the analysis of transport quantitiesKajita2014 ; Hirata2011 ; Osada2008 and thermodynamic quantities such as electronic specific heatKonoike2012 . Similarly, for -(BETS)2I3 it has been recently revealed via first-principle calculationsOhki2020 ; Tsumu2021 ; kitou2021 and through magnetoresistance measurementsTajima2021 .
From recent theoretical proposalsmorinari2020 and the experimenttajima2023 under a magnetic field, it has been suggested that -(BEDT-TTF)2I3 is a three-dimensional Dirac fermion. However, for the study of electronic specific heat (), we expect that its system can still be approximated as a two-dimensional system at temperatures () above several Kelvin due to the relatively small interlayer coupling ( 1 meV)tajima2023 . In this study, we neglect the quasi-two-dimensionality in -(BEDT-TTF)2I3 when studying electronic specific heat. In fact, a power law behavior, , has been observed, particularly below 4 KKonoike2012 . This temperature dependence of the electronic specific heat is close to that in two-dimensional Dirac systems, .
Theoretical studies have demonstrated the movement and merging of two Dirac points at time-reversal invariant momentum (TRIM) in two-dimensional systems with honeycomb latticeDietl2008 ; Hasegawa2006 , VO2/TiO2 nanostructuresBane , and quasi-two-dimensional systems like -(BEDT-TTF)2I3Suzumura2013 . Merging Dirac points are referred to as semi-Dirac pointsBane . After merging, a pair of Dirac points annihilates, leading to a topological phase transition to a normal insulator. The existence of semi-Dirac points and the occurrence of topological phase transitions have been observed in artificial systems such as ultracold atoms on optical latticesTarruell2012 , lattices of photonic resonatorsBellec , and polaritons in lattices of semiconductor micropillarsMil ; real .
The energy dispersion at the semi-Dirac point is linear in two directions (e.g., -directions) and quadratic in other two directions (-directions) Dietl2008 ; Hasegawa2006 . In such cases, is proportional to Dietl2008 ; Hasegawa2006 . When the semi-Dirac point exists at (referred to as semi-Dirac fermions), is proportional to . On the other hand, when two Dirac points are close to each other, a crossover is expected changing from at high temperatures to at low temperatures. This is due to the distinct behavior of which is proportional to far from and to near . In this paper, we present numerical calculations demonstrating the occurrence of this crossover in when two Dirac points approach each other. We emphasize that this crossover serves as a signature of the topological phase transition.
II Calculation of electronic specific heat
The internal energy per site () at temperature, , can be calculated using the following equation:
| (1) |
where is an eigenvalue with band index , is the Fermi distribution function, [ for the honeycomb lattice and for -(BEDT-TTF)2I3], is the number of points taken in the first Brillouin zone, and is the Boltzmann constant. For simplicity, we neglect the effect of electron spin.
The electronic specific heat, , at the constant volume is obtained by differentiating the internal energy:
| (2) |
We numerically calculate by performing numerical differentiation.
Using the density of states, , Eq. (1) can be expressed as
| (3) |
where is the chemical potential. When the -dependence of is very small, it is known that for free electronskittel . In Section IV, for two-dimensional systems we will show analytically and numerically demonstrate that Dirac fermions exhibit behavior, while semi-Dirac fermions show behavior. It is important to note that we are focusing solely on the electronic specific heat in this study, disregarding contribution from lattice vibrations () that typically affect the specific heat in bulk metalskittel .
For the purposes of this study, we do not consider electron-electron interactions. Although Coulomb interactions in grapheneVaf ; She ; Kot have been proposed to introduce logarithmic corrections to thermodynamic propertiesVaf , these effects are expected to be small compared to the effects of the precursor of merging two Dirac points, which is the main focus of our investigation.
(a)
(b)
(c)
III Energy band in the honeycomb lattice
We consider the honeycomb lattice with only nearest neighbor transfer integrals (, , and ) and half-filling. The energy dispersion relations are given bywallace
| (4) | |||||
where signs in correspond to upper and lower bands, respectively, and represents the lattice constant. We assume and in Eq. (4), where . The Fermi energy, , is equal to the energy at the Dirac point () because of the half filling. Due to the particle-hole symmetry exists in Eq. (4), remain constant as a function of (i.e., ).
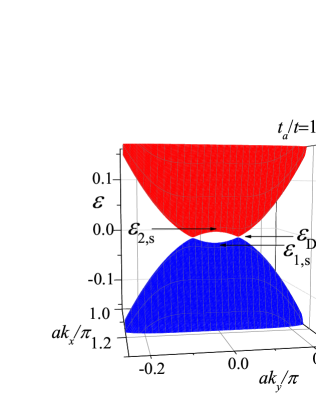
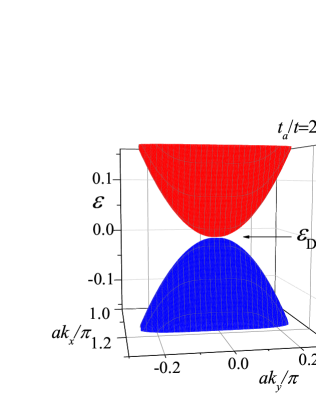
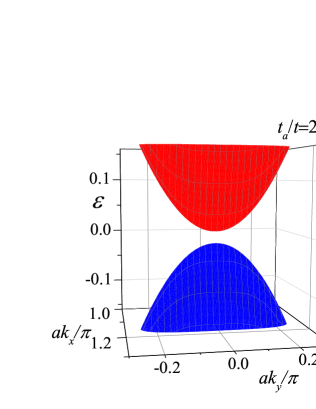
The position of two Dirac points is close each other at , as shown in Fig. 1 (a). They merge at , and an energy gap opens at , as depicted in Figs. 1 (b) and (c), respectively. The spacing between two Dirac points () decreases as increases. Fig. 1 (a) also shows a saddle point in the upper and lower bands at the midpoint between two Dirac points. The energies ( and ) at the saddle point for the upper and lower bands, respectively, are given by
| (5) |
For Dirac fermions (), the energies near can be described aswallace
| (6) |
where , is the Planck constant, and . The density of states, , for Eq. (6) is given bywallace
| (7) |
For semi-Dirac fermions (), the energies near can be written asDietl2008 ; Hasegawa2006
| (8) |
where . The dispersion is linear in -directions and quadratic in -directions. The density of states is given byHasegawa2006
| (9) |
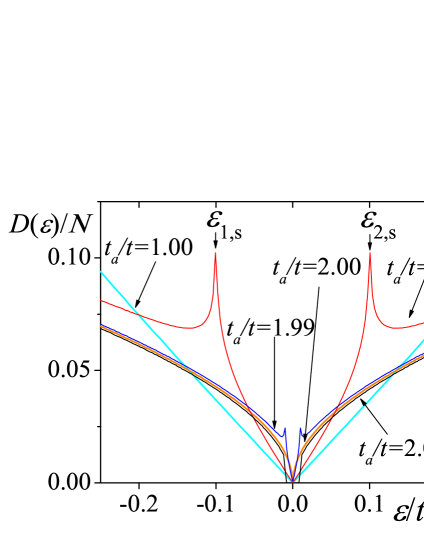
We numerically calculate using Eq. (4), as shown in Fig. 2. At and , the density of states, , is proportional to when is near , and it approaches above and below . The two peaks in are due to the energies at the saddle points.
(a)
(b)
IV Electronic specific heat in the honeycomb lattice
In the honeycomb lattice, the electronic specific heat, , can be calculated for both Dirac fermions and semi-Dirac fermions. For Dirac fermions, using the density of states given in Eq. (7), we can analytically derive the electronic specific heat as follows:
| (10) |
where is the dimensionless temperature. For example, in the case of graphene, can be estimated to be around 2.97 eV from first-principles calculationsReich . Thus, corresponds to approximately 3.45 K.
For semi-Dirac fermions, using given in Eq. (9), we obtain the following expression for the electronic specific heat, , as
| (11) |
We compare these analytical expressions for with numerically calculated , as shown in Fig. 3. It can be seen that the numerical results are well-fitted by Eq. (10) for Dirac fermions and Eq. (11) for semi-Dirac fermions, respectively. In the case where , is suppressed at low temperatures due to the system becoming insulating.
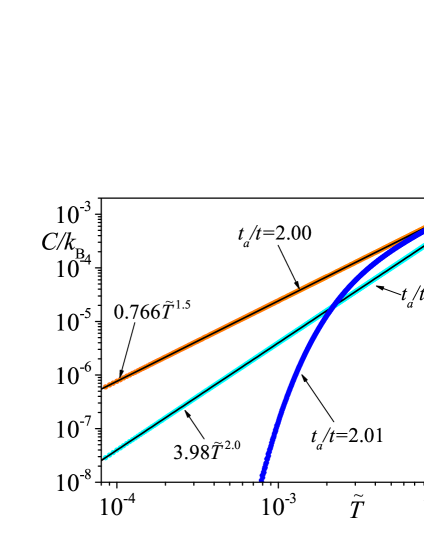
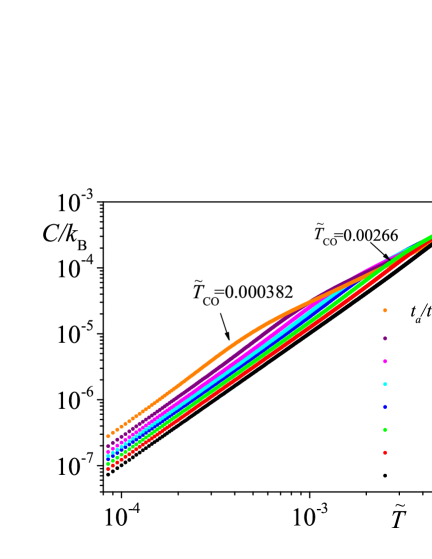
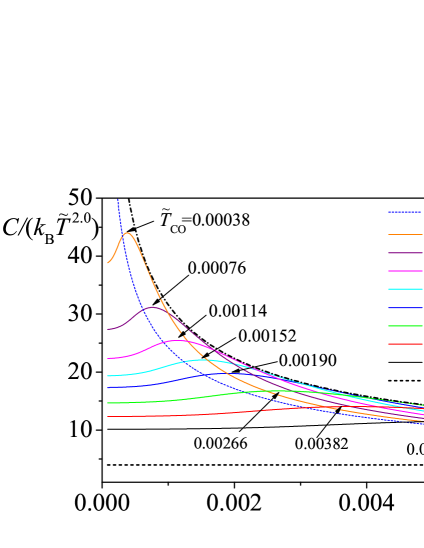
Next, we consider the cases when two Dirac points exist close each other. We perform numerical calculations of at , as shown in Fig. 4 (a). The results exhibit changes in the power-law dependence on temperature. To clarify the deviations from Dirac fermions, we plot in Figs. 4 (b). It can be observed that remains almost constant at low temperatures and becomes proportional to at high temperatures. Thus, is nearly proportional to at low temperatures and to at high temperatures, respectively. There is a crossover in the -dependence of , which occurs due to the -dependence of . The contribution to at low temperatures arises from near , while at high temperatures, it comes from the energy range above and below . The temperature at which this crossover occurs decreases as increases, approaching . It is not possible to determine an exact crossover temperature, because varies continuously from to as a function of . We observe the existence of maxima in , except for the cases of and 2.000, as shown in Fig. 4(b). These maxima arise from the logarithmic divergence of due to the energy at the saddle point, and the crossover occurs near these maxima. Therefore, in this paper, we employ the temperature at which is maximized as a rough estimation of the crossover temperature ().
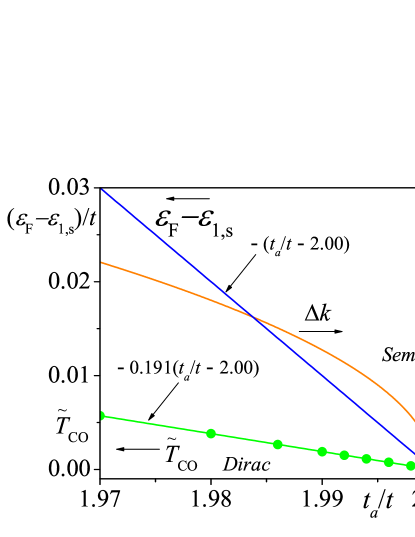
The crossover temperature, , the difference in wave vectors , and the energy difference are shown as functions of in Fig. 5. We find that can be fitted by the expression:
| (12) |
which is depicted by the green line. As increases, , , and decrease. The magnitude of is on the order of the potential barrier between the two Dirac points. When the barrier is zero (i.e., in the case of semi-Dirac fermions), becomes zero.
V Energy band of -(BEDT-TTF)2I3 under the uniaxial pressure
In the study of the energy band of -(BEDT-TTF)2I3 under uniaxial pressure, we consider a tight-binding model with a rectangular lattice for the highest occupied molecular orbits of the BEDT-TTF molecule. The electron filling () of this material is 3/4. We neglect the interlayer hopping, , because of its small magnitude. In two-dimensional conductive plane, we incorporate the transfer integrals between neighboring sites (, , , , , , and ). The Hamiltonian matrix has been explained in Appendix C in ref KH2017, . The effect of the uniaxial pressure () along the -axis is taken into account by modifying the values of the transfer integrals using interpolationKatayama2004 ; Katayama2006 ; Suzumura2013 based on the extended Hückel methodMori1984 ; Kondo2005 , with the units of transfer integrals and pressure being in eV and kbar, respectively.
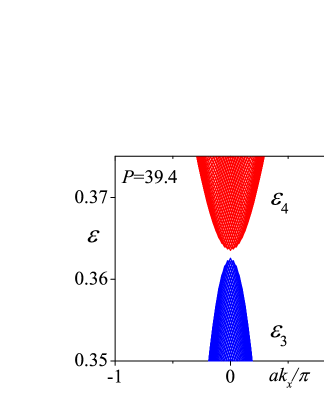
In this model, two Dirac cones are overtilted (type-II Dirac or Weyl semimetal) at KH2017 . At the Dirac cones are tilted but not overtilted (type-I Dirac or Weyl semimetal), and the energy at the Y point in the third band from the bottom is higher than the energies at the Dirac points, resulting in an overlap between the third and the fourth bands. This overlapping occurs within . At , these bands no longer overlap, and the system supports the tilted Dirac cones of type IKatayama2006 . Fig. 6 (a) illustrates this behavior for a specific value, . The Fermi energy, , is located at . Furthermore, as increases, the spacing between two Dirac points, , becomes smaller. This can be observed in Fig. 6 (b) for . Upon reaching a critical pressure , two Dirac points merge, resulting in a quadratic dispersion along the -directions, as shown in Fig. 6 (c). At , a finite gap emerges in the energy band, as shown in Fig. 6 (d) for .
(a)
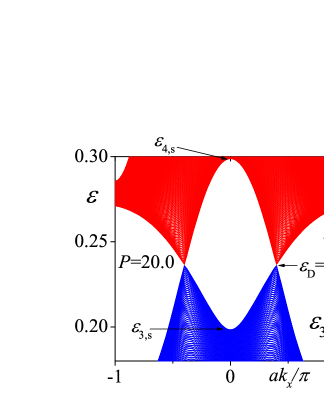
(b)
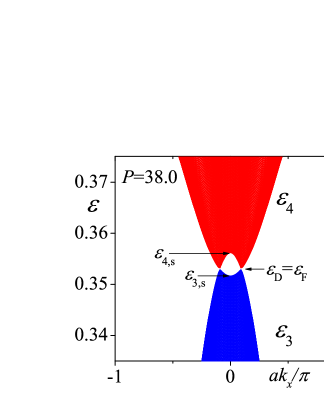
(c)
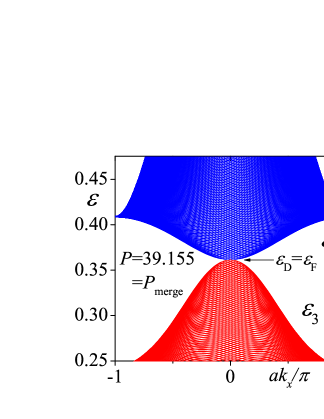
(d)
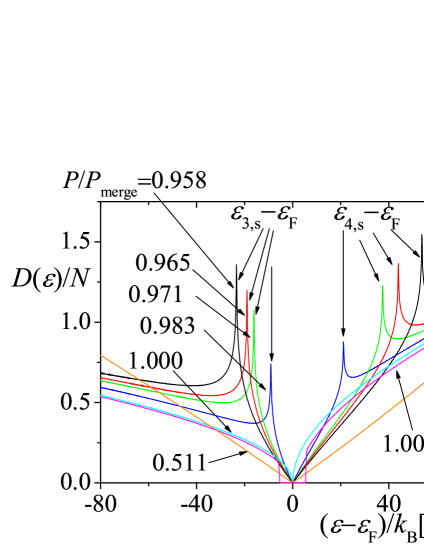
For semi-Dirac fermions () and Dirac fermions (20.0, i.e., ), the densities of states follows and , respectively, as shown in Fig. 7. When two Dirac points are close each other (, and 38.5, i.e., , and 0.983), the density of states is proportional to when is close to and it approaches when exceeds the peaks at or at these pressures, as shown in Fig. 7. For insulating state (, i.e., ), near is zero, as shown in Fig. 7.
VI Electronic specific heat of -(BEDT-TTF)2I3 under the uniaxial pressure
(a)
(b)
By utilizing , we can determine through
| (13) |
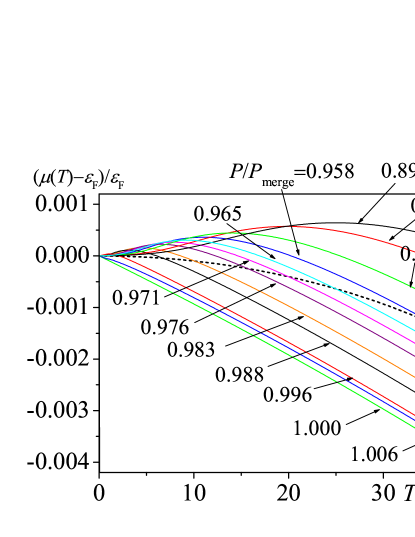
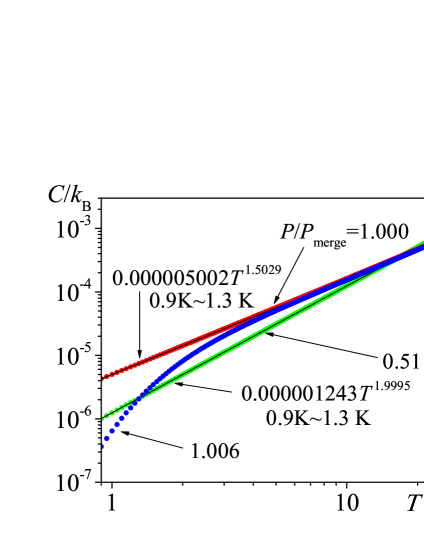
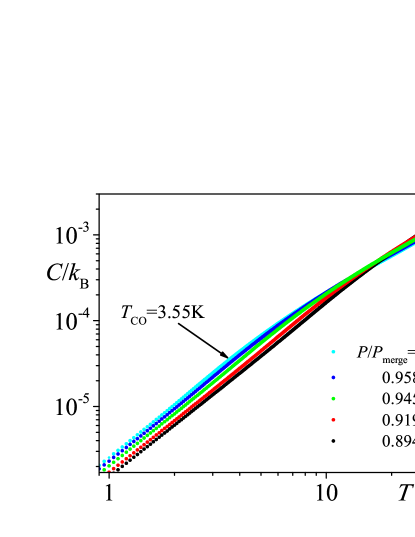
Fig. 8 shows the weak -dependence of , which arises from the slight band asymmetry. In Fig. 9, we present the electronic specific heat, , obtained from numerical calculations at and 1.000. These results can be effectively fitted by and , respectively, within the low temperatures range ( K 1.3 K). At , as depicted in Fig. 9, diminishes significantly for K due to the presence of an energy gap.
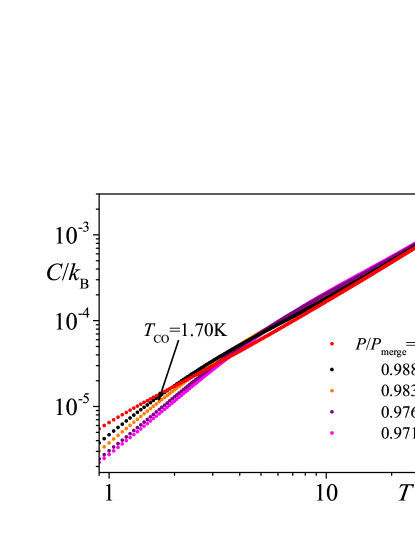
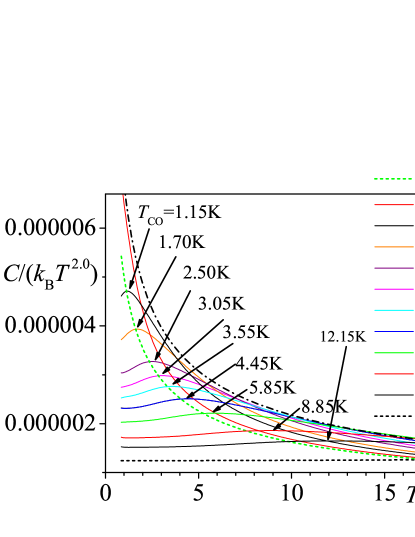
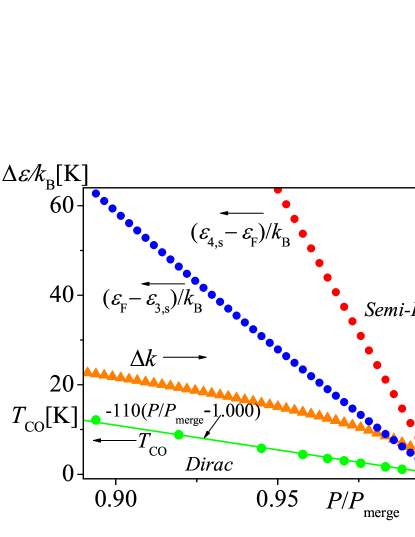
In the regime where the merging of two Dirac points is imminent (), the -dependence of exhibits a crossover: at low temperatures and at high temperatures [Figs. 10 (a) and (b)]. This crossover is confirmed by the nearly constant behavior observed at low temperatures in the -dependencies of and the nearly dependence at high temperatures, as shown in Figs. 11. Similar to Section IV, we define the crossover temperature, , using a maximum in . The -dependences of , , , and in Fig. 12 are shown in Fig. 5, resembling the -dependences in the honeycomb lattice. The -dependence of can be approximately described by
| (14) |
represented by the green line in Fig. 12.
We ignore the interlayer hopping, , of -(BEDT-TTF)2I3. By introducing , the quasi-two-dimensionality of the system becomes a crucial factor for the electronic specific heats at very low temperatures, because the density of states near the Fermi energy is changed. Consequently, the determination of the crossover becomes ambiguous at extremely low temperatures. Moreover, recent proposals have suggested the existence of a three-dimensional Dirac fermion at very low temperaturesmorinari2020 ; tajima2023 . If this is the case, the power law behavior for would follow , which starkly contrasts with the behavior, , observed in two-dimensional Dirac fermion systems. Hence, further investigation is required to elucidate the electronic specific heats in quasi-two-dimensional Dirac fermion systems, particularly at very low temperatures.
VII Conclusions
In this study, we performed comprehensive numerical calculations to explore the intriguing behavior of the electronic specific heat, , in two-dimensional systems employing simplified models for the honeycomb lattice and -(BEDT-TTF)2I3. Our findings shed light on the behavior of when two Dirac points approach each other. Specifically, we observed a transition from at low temperatures to above the crossover temperature, , which we defined based on the maximum in . Notably, we demonstrated that decreases as the spacing between the two Dirac points decreases, eventually reaching zero when the points merge. This merging process is associated with a topological phase transition. Thus, measuring provides a promising method to investigate the motion and merging of two Dirac points in two-dimensional Dirac fermion systems. The occurrence of the crossover serves as a significant indicator of the topological phase transition. Additionally, in the plot, we anticipate observing a maximum attributed to the presence of the saddle point.
For the honeycomb lattice with only the nearest neighbor transfer integrals (, , and ), the semi-Dirac point emerges at Dietl2008 ; Hasegawa2006 . Therefore, if can be achieved and the Coulomb interaction can be neglected, will be observed in graphene and artificial systems with the honeycomb lattice.
Regarding -(BEDT-TTF)2I3, the crossover is expected to occur near the uniaxial strain of kbar when the interpolation formulaKatayama2004 ; Katayama2006 ; Suzumura2013 is used. The experiment for electronic specific heatKonoike2012 has been performed under the hydrostatic pressure of 15 kbar, where the crossover has not been observed yet. The crossover may be observed by the experiments at higher hydrostatic pressures. In another quasi-two-dimensional massless Dirac fermion, -(BETS)2I3, the crossover is also expected to occur if the situation where two Dirac points are nearly merged can be realized, for example, through the application of uniaxial pressure.
References
- (1) K. S. Novoselov, A. K. Geim, S. V. Morozov, D. Jiang, M. I. Katsnelson, I. V. Grigorieva, S. V. Dubonos, and A. A. Firsov, Two-dimensional gas of massless Dirac fermions in graphene, Nature 438, 197 (2005).
- (2) T. Ishiguro, K. Yamaji, and G. Saito, Organic Superconductors, 2nd ed., (Springer-Verlag, Berlin, 1998).
- (3) A. G. Lebed, editor, The Physics of Organic Superconductors and Conductors (Springer, Berlin, 2008).
- (4) S. Katayama, A. Kobayashi and Y. Suzumura, Pressure-Induced Zero-Gap Semiconducting State in Organic Conductor -(BEDT-TTF)2I3 Salt, J. Phys. Soc. Jpn. 75, 054705 (2006).
- (5) H. Kino and T. Miyazaki, First-Principles Study of Electronic Structure in -(BEDT-TTF)2I3 at Ambient Pressure and with Uniaxial Strain, J. Phys. Soc. Jpn. 75, 034704 (2006).
- (6) P. Alemany, J.P. Pouget and E. Canadell, Essential role of anions in the charge ordering transition of -(BEDT-TTF)2I3, Phys. Rev. B 85, 195118 (2012).
- (7) K. Kajita, Y. Nishio, N. Tajima, Y. Suzumura and A. Kobayashi, Molecular Dirac Fermion Systems -Theoretical and Experimental Approaches-, J. Phys. Soc. Jpn. 83, 072002 (2014).
- (8) T. Osada, Negative Interlayer Magnetoresistance and Zero-Mode Landau Level in Multilayer Dirac Electron System, J. Phys. Soc. Jpn. 77, 084711 (2008).
- (9) M. Hirata, K. Ishikawa, K. Miyagawa, K. Kanoda and M. Tamura, 13C NMR study on the charge-disproportionated conducting state in the quasi-two-dimensional organic conductor -(BEDT-TTF)2I3, Phys. Rev. B 84, 125133 (2011).
- (10) T. Konoike. K. Uchida and T. Osada, Specific Heat of the Multilayered Massless Dirac Fermion System, J. Phys. Soc. Jpn. 81, 043601 (2012).
- (11) D. Ohki, K. Yoshimi, and A. Kobayashi, Transport properties of the organic Dirac electron system -(BEDT-TTF)2I3, Phys. Rev. B 102, 235116 (2020).
- (12) T. Tsumuraya and Y. Suzumura, First-principles study of the effective Hamiltonian for Dirac fermions with spin-orbit coupling in two-dimensional molecular conductor -(BETS)2I3, Eur. Phys. J. B 94, 17 (2021).
- (13) S. Kitou, T. Tsumuraya, H. Sawahata, F. Ishii, K. I. Hiraki, T. Nakamura, N. Katayama, and H. Sawa, Ambient-pressure Dirac electron system in the quasi-two-dimensional molecular conductor -(BEDT-TTF)2I3, Phys. Rev. B 103, 035135 (2021).
- (14) Y. Kawasugi, H. Masuda, M. Uebe, H. M. Yamamoto, R. Kato, Y. Nishio, and N. Tajima, Pressure-induced phase switching of Shubnikov-de Haas oscillations in the molecular Dirac fermion system -(BETS)2I3, Phys. Rev. B 103, 205140 (2021).
- (15) T. Morinari, Dynamical Time-Reversal and Inversion Symmetry Breaking, Dimensional Crossover, and Chiral Anomaly in -(BEDT-TTF)2I3, J. Phys. Soc. Jpn. 89, 073705 (2020).
- (16) N. Tajima, Y. Kawasugi, T. Morinari, R. Oka, T. Naito, and R. Kato, Coherent Interlayer Coupling in Quasi-Two-Dimensional Dirac Fermions in -(BEDT-TTF)2I3, J. Phys. Soc. Jpn. 92, 013702 (2023).
- (17) Y. Hasegawa, R. Konno, H. Nakano, and M. Kohmoto, Zero modes of tight-binding electrons on the honeycomb lattice, Phys. Rev. B 74, (2006) 033413.
- (18) P. Dietl, F. Piechon, and G. Montambaux, New Magnetic Field Dependence of Landau Levels in a Graphenelike Structure, Phys. Rev. Lett. 100, 236405 (2008).
- (19) S. Banerjee, R. R. P. Singh, V. Pardo, and W. E. Pickett, Tight-Binding Modeling and Low-Energy Behavior of the Semi-Dirac Point, Phys. Rev. Lett. 103, 016402 (2009).
- (20) Y. Suzumura, T. Morinari and F. Piechon, Mechanism of Dirac Point in Type Organic Conductor under Pressure, J. Phys. Soc. Jpn. 82 023708 (2013).
- (21) L. Tarruell, Daniel Greif, Thomas Uehlinger, Gregor Jotzu, and Tilman Esslinger, Creating, moving and merging Dirac points with a Fermi gas in a tunable honeycomb lattice, Nature 483, 302 (2012).
- (22) M. Bellec, U. Kuhl, G. Montambaux, and F. Mortessagne, Topological Transition of Dirac Points in a Microwave Experiment, Phys. Rev. Lett. 110, 033902 (2013).
- (23) M. Milićević, G. Montambaux, T. Ozawa, O. Jamadi, B. Real, I. Sagnes, A. Lemaître, L. Le Gratiet, A. Harouri, J. Bloch, and A. Amo, Type-III and Tilted Dirac Cones Emerging from Flat Bands in Photonic Orbital Graphene, Phys. Rev. X 9, 031010 (2019).
- (24) B. Real, O. Jamadi, M. Milićević, N. Pernet, P. St-Jean, T. Ozawa, G. Montambaux, I. Sagnes, A. Lemaître, L. Le Gratiet, A. Harouri, S. Ravets, J. Bloch, and A. Amo, Semi-Dirac Transport and Anisotropic Localization in Polariton Honeycomb Lattices, Phys. Rev. Lett. 125, 186601 (2020).
- (25) Charles Kittel, Introduction to Solid State Physics, 8th ed., (John Wiley & Sons, Inc. 2005).
- (26) O. Vafek, Anomalous Thermodynamics of Coulomb-Interacting Massless Dirac Fermions in Two Spatial Dimensions, Phys. Rev. Lett. 98 (2007) 216401.
- (27) D. E. Sheehy and J. Schmalian, Quantum Critical Scaling in Graphene, Phys. Rev. Lett. 99 (2007) 226803.
- (28) V. N. Kotov, B. Uchoa, V. M. Pereira, F. Guinea, and A. H. Castro Neto, Electron-Electron Interactions in Graphene: Current Status and Perspectives, Rev. Mod. Phys. 84, 1067 (2012).
- (29) P. R. Wallace, The Band Theory of Graphite, Phys. Rev. 71, (1947) 622.
- (30) S. Reich, J. Maultzsch, C. Thomsen, and P. Ordejon, Tight-binding description of graphene, Phys. Rev. B 66, 035412 (2002).
- (31) K. Kishigi, and Y. Hasegawa, Three-quarter Dirac points, Landau levels, and magnetization in -(BEDT-TTF)2I3, Phys. Rev. B 96, 085430 (2017).
- (32) A. Kobayashi, S. Katayama, K.Noguchi and Y. Suzumura, Superconductivity in Charge Ordered Organic Conductor --(ET)2I3 Salt-, J. Phys. Soc. Jpn. 73, 3135 (2004).
- (33) T. Mori, A. Kobayashi, Y. Sasaki, H. Kobayashi, G. Saito, and H. Inokuchi, BAND STRUCTURES OF TWO TYPES OF (BEDT-TTF)2I3, Chem. Lett. 13, 957 (1984).
- (34) R. Kondo, S. Kagoshima, and J. Harada,Crystal structure analysis under uniaxial strain at low temperature using a unique design of four-axis x-ray diffractometer with a fixed sample, Rev. Sci. Instrum. 76, 093902 (2005).