SO and SiS Emission Tracing an Embedded Planet and Compact 12CO and 13CO Counterparts in the HD 169142 Disk
Abstract
Planets form in dusty, gas-rich disks around young stars, while at the same time, the planet formation process alters the physical and chemical structure of the disk itself. Embedded planets will locally heat the disk and sublimate volatile-rich ices, or in extreme cases, result in shocks that sputter heavy atoms such as Si from dust grains. This should cause chemical asymmetries detectable in molecular gas observations. Using high-angular-resolution ALMA archival data of the HD 169142 disk, we identify compact SO J=88–77 and SiS J=19–18 emission coincident with the position of a 2 MJup planet seen as a localized, Keplerian NIR feature within a gas-depleted, annular dust gap at 38 au. The SiS emission is located along an azimuthal arc and has a similar morphology as a known 12CO kinematic excess. This is the first tentative detection of SiS emission in a protoplanetary disk and suggests that the planet is driving sufficiently strong shocks to produce gas-phase SiS. We also report the discovery of compact 12CO and 13CO J=3–2 emission coincident with the planet location. Taken together, a planet-driven outflow provides the best explanation for the properties of the observed chemical asymmetries. We also resolve a bright, azimuthally-asymmetric SO ring at 24 au. While most of this SO emission originates from ice sublimation, its asymmetric distribution implies azimuthal temperature variations driven by a misaligned inner disk or planet-disk interactions. Overall, the HD 169142 disk shows several distinct chemical signatures related to giant planet formation and presents a powerful template for future searches of planet-related chemical asymmetries in protoplanetary disks.
1 Introduction
Planets form and inherit their compositions in dusty, gas-rich disks around young stars, while the planet formation process is expected to simultaneously alter the physical and chemical structure of the disk. Observations of protoplanetary disks using the Atacama Large Millimeter/submillimeter Array (ALMA) have revealed the presence of ubiquitous rings and gaps in the millimeter dust distribution (ALMA Partnership et al., 2015; Andrews et al., 2018; Huang et al., 2018; Cieza et al., 2021) and in molecular line emission (Bergner et al., 2019; van Terwisga et al., 2019; Facchini et al., 2021; Öberg et al., 2021; Law et al., 2021). In some cases, the millimeter continuum and molecular line emission appear azimuthally asymmetric (Tang et al., 2012; van der Marel et al., 2021a, b; Booth et al., 2021a, 2023). While such features broadly suggest the presence of embedded planets, it remains difficult to unambiguously connect individual substructures seen in dust and line emission with the location and properties of nascent planets.
Nonetheless, a variety of methods for identifying and characterizing embedded planets in disks have been developed. Planet formation is thought to occur within dust gaps and the properties of the observed dust distributions have been used to infer planet characteristics (e.g., Kanagawa et al., 2015; Zhang et al., 2018), while in a few systems, circumplanetary disks (CPDs) are detected via their excess millimeter continuum emission (Keppler et al., 2018; Benisty et al., 2021; Wu et al., 2022). However, such detections remain relatively scare (Isella et al., 2014; Pineda et al., 2019; Andrews et al., 2021), which may be due to mm dust depletion and high gas-to-dust ratios (1000) in CPDs (Karlin et al., 2023). Thus, the identification of planetary signals in molecular gas provides a promising complementary approach. While planetary signatures are now often indirectly seen via kinematic perturbations in the rotation velocity profiles of bright lines (e.g., Teague et al., 2018; Pinte et al., 2020), the first CPD candidate in molecular gas was discovered in 13CO gas in the AS 209 disk (Bae et al., 2021). A similar planetary counterpart was recently identified in 12CO gas in the Elias 2-24 disk (Pinte et al., 2023).
Embedded planets are also expected to directly alter the chemical structure of disks. In particular, forming-planets should locally heat the disk (e.g., Szulágyi, 2017; Szulágyi et al., 2018), which will sublimate volatile-rich ice, or in more extreme cases, drive shocks that sputter heavy atoms such as Si from dust grains. This will result in chemical asymmetries that can be detected in sensitive line emission observations (Cleeves et al., 2015; Rab et al., 2019). Sufficiently deep observations of molecular gas with ALMA have only recently become available to enable searches for such chemical signatures. For instance, asymmetric SO line emission was found to trace an embedded planet in the HD 100546 disk (Booth et al., 2023) and Alarcón et al. (2022) identified a signature in CI gas potentially attributable to either the inflow or outflow associated with a protoplanet in the HD 163296 disk.
In this Letter, we present high-angular-resolution ALMA archival observations of the HD 169142 disk. We identify several chemical signatures related to ongoing planet formation, including spatially-localized SO and SiS emission and the discovery of compact 12CO and 13CO emission counterparts, which are all approximately coincident with an embedded giant planet. In addition, spatially-resolved SO emission has only been detected in a handful of Class II disks to date (Pacheco-Vázquez et al., 2016; Booth et al., 2018, 2021a, 2023; Huang et al., 2023) and we report the first tentative detection of SiS in a protoplanetary disk. In Section 2, we describe the HD 169142 disk and present the ALMA observations in Section 3. We present our results in Section 4 and discuss the chemical origins of the observed emission and possible connections with nascent planets within the HD 169142 disk in Section 5. We summarize our conclusions in Section 6.
2 The HD 169142 Disk and Evidence for Embedded Planets
HD 169142 is a Herbig Ae star (Blondel & Djie, 2006) located at a distance of pc (Gaia Collaboration et al., 2021; Bailer-Jones et al., 2021) and has a dynamically-estimated stellar mass of (Yu et al., 2021), luminosity of (Fedele et al., 2017), and age of 10 Myr (Pohl et al., 2017). The disk surrounding HD 169142 has a nearly face-on orientation with an inclination of and position angle of PA (Raman et al., 2006; Panić et al., 2008).
The HD 169142 disk consists of several ring-like structures observed across many wavelengths, including in NIR/scattered light (e.g., Quanz et al., 2013; Reggiani et al., 2014; Pohl et al., 2017; Ligi et al., 2018; Bertrang et al., 2018; Gratton et al., 2019), thermal mid-infrared (Honda et al., 2012), (sub)-mm (e.g., Fedele et al., 2017; Macías et al., 2019; Pérez et al., 2019), and cm (Osorio et al., 2014). Many of these structures have been posited to originate from planet-disk interactions. While varying numbers and masses of planets have been suggested, most studies require at least one MJup planet to explain the observed disk substructures. For a detailed summary of the proposed locations and types of embedded planets, please see Yu et al. (2021) and Garg et al. (2022), and references therein. Here, we restrict our focus to the annular gap located at an approximate radius of 41 au (“D41”) in-between two major rings at 25 au (“B25”) and 60 au (“B60”). The D41 gap is observed in both mm continuum and NIR/scattered light.
| Transition | Freq. | Beam | JvM aaThe ratio of the CLEAN beam and dirty beam effective area used to scale image residuals to account for the effects of non-Gaussian beams. See Section 3.2 and Jorsater & van Moorsel (1995a); Czekala et al. (2021) for further details. | robust | Chan. v | RMS | Project | Eu | Aul | gu | Int. FluxbbUncertainties are derived via bootstrapping and do not include the systematic calibration flux uncertainty (10%). 3 upper limits are reported for nondetections. The continuum flux has units of mJy. |
|---|---|---|---|---|---|---|---|---|---|---|---|
| (GHz) | (, ) | (km s-1) | (mJy beam-1) | Used | (K) | ( s-1) | (mJy km s-1 ) | ||||
| 0.9 mm cont. | 331.000000 | 0.05 0.03, 79.6 | 0.42 | 0.5 | … | 0.1 | P2012P2015 | … | … | … | 420 10 |
| 12CO J=3–2 | 345.795990 | 0.11 0.09, 74.2 | 0.64 | 0.5 | 0.12 | 3.9 | P2012P2015 | 33 | 5.603 | 7 | 27958 228 |
| 13CO J=3–2 | 330.587965 | 0.14 0.11, 75.1 | 0.67 | 0.5 | 0.12 | 3.1 | P2012P2015 | 32 | 5.960 | 14 | 10664 205 |
| SO J=88–77 | 344.310612 | 0.19 0.14, 84.4 | … | 2.0 | 0.43 | 1.5 | P2012 | 88 | 3.285 | 17 | 120 16 |
| SO2 J=43,1–32,2 | 332.505242 | 0.20 0.15, 88.2 | … | 2.0 | 0.44 | 1.4 | P2012 | 31 | 3.483 | 9 | 32 |
| SO2 J=116,6–125,7 | 331.580244 | 0.20 0.15, 88.2 | … | 2.0 | 0.44 | 1.5 | P2012 | 149 | 4.362 | 23 | 43 |
| SiS J=19–18 | 344.779481 | 0.19 0.14, 84.3 | … | 2.0 | 0.43 | 1.6 | P2012 | 166 | 3.155 | 39 | 62 23 |
Multiple lines of evidence point to a planetary origin of the D41 gap, including hydrodynamic simulations (Bertrang et al., 2018; Toci et al., 2020); a decreased gas surface density (Fedele et al., 2017; Garg et al., 2022) and localized kinematic excess in 12CO within this gap (Garg et al., 2022). The most direct evidence of an embedded planet is in the form of NIR observations, which revealed a localized emission feature within this annular gap that is in Keplerian rotation around the central star as well as the presence of a spiral-like structure consistent with a planet-driven wake (Gratton et al., 2019; Hammond et al., 2023). This feature was suggested to correspond to a 2 MJup still-accreting planet at a radius of 38 au (Gratton et al., 2019). Taken together, this planet may be responsible for carving this gas-depleted, annular gap; exciting a spiral-wake in the NIR; and triggering the observed 12CO kinematic excess. Overall, this makes the HD 169142 disk an ideal source to search for chemical signatures associated with an embedded giant planet.
3 Observations
3.1 Archival Data and Observational Details
We made use of ALMA archival projects 2012.1.00799.S (PI: M. Honda) and 2015.1.00806.S (PI: J. Pineda), which we hereafter refer to as P2012 and P2015, respectively. P2012 comprises three execution blocks with baselines ranging from 15-1574 m, and P2015 has a single execution block with baselines of 19-7716 m. Table 3 provides detailed information about each project.
Both projects had two narrow spectral windows (244.1 kHz; 0.12 km s-1) centered on the 12CO J=3–2 and 13CO J=3–2 lines. In addition, P2012 had two spectral windows covering the frequency ranges of 331.055-332.93 GHz and 343.055-344.929 GHz but at a coarse velocity resolution (976.6 kHz; 0.45 km s-1). P2015 instead included one spectral window from 342.555-344.429 GHz but at an even coarser velocity resolution (1,128.9 kHz; 0.85 km s-1) and a dedicated continuum window. Within these spectral windows, we imaged the following lines: 12CO J=3–2, 13CO J=3–2, SO J=88–77, SO2 J=43,1–32,2, SO2 J=116,6–125,7, and SiS J=19–18. Table 1 lists details for each image cube.
The CO and SO lines are included in spectral set-ups in both P2012 and P2015. For the CO lines, we use both projects since each had dedicated spectral windows with high velocity resolution. For SO, we initially imaged the line using both the P2012-only and P2012+P2015 data and confirmed it is robustly detected in both combinations. However, due to the considerably coarser channel spacing of the P2015 data (0.85 km s-1), we performed all subsequent analysis of SO using only the P2012 data. The SiS and SO2 lines are only covered in P2012. We generated the 0.9 mm continuum image using data from both projects and used the full bandwidth of the observations after flagging the channels containing line emission. Table 1 lists which project was used to generate each image cube.
Transitions of additional S- and Si-bearing molecules of interest (e.g., SiO, CCS, OCS, NS) were not included in the spectral set-up of either project.
3.2 Self Calibration and Imaging
Each archival project was initially calibrated by ALMA staff using the ALMA calibration pipeline and the required version of CASA (McMullin et al., 2007), before switching to CASA v5.4.0 for self calibration. Self calibration was attempted on the shorter baseline data from P2012 alone but we were unable to derive solutions that improved image quality. Data from both projects were combined and one round of phase self-calibration was applied, following the same procedure described in Öberg et al. (2021). We subtracted the continuum using the uvcontsub task with a first-order polynomial.
We then switched to CASA v6.3.0 for all imaging. We used the tclean task to produce images of all transitions with Briggs weighting and Keplerian masks generated with the keplerian_mask (Teague, 2020) code. Each mask was based on the stellar and disk parameters of HD 169142 and was visually inspected to ensure that it contained all emission present in the channel maps. Due to the non-Keplerian nature of the SiS emission, no masking was used to generate the SiS images. Briggs robust parameters were chosen manually to prioritize high signal-to-noise ratio (SNR) line detections. Channel spacings ranged from 0.12-0.85 km s-1 depending on the line. All images were made using the ‘multi-scale’ deconvolver with pixel scales of [0,5,15,25] and were CLEANed down to a 4 level, where was the RMS measured in a line-free channel of the dirty image. Table 1 summarizes all image properties.
For the 12CO, 13CO, and continuum images, we applied the ‘JvM’ correction proposed in Jorsater & van Moorsel (1995b) and described in more detail in Czekala et al. (2021). This correction scales the image residuals by a factor , equal to the ratio of the effective areas of the CLEAN beam and dirty beam, to be in units consistent with the CLEAN model. Table 1 lists all values.
3.3 Moment Maps, Radial Profiles, and Integrated Fluxes
We generated velocity-integrated intensity, or “zeroth moment,” maps of line emission from the image cubes using bettermoments (Teague & Foreman-Mackey, 2018) and closely followed the procedures outlined in Law et al. (2021). No flux threshold for pixel inclusion, i.e., sigma flipping, was used to ensure accurate flux recovery. All maps were generated using the same Keplerian masks employed during CLEANing, except in the case of SiS, where we used hand-drawn masks to better capture the non-Keplerian emission (see Figure 10 in the Appendix). bettermoments also provides a map of the statistical uncertainty that takes into account the non-uniform RMS across the zeroth moment map, which is described in detail in Teague (2019a). We take the median RMS from these uncertainty maps as the zeroth moment map uncertainty. We also generated peak intensity maps using the ‘quadratic’ method of bettermoments.
We computed radial line intensity profiles using the radial_profile function in the GoFish python package (Teague, 2019b) to deproject the zeroth moment maps. All radial profiles assume a flat emitting surface. We computed the integrated fluxes for all lines with the same masks used to generate the zeroth moment maps. We estimated uncertainties as the standard deviation of the integrated fluxes within 500 randomly-generated masks at the same spatial position but spanning only line-free channels. We report upper limits for the two undetected SO2 lines. Table 1 lists all integrated fluxes.
4 Results
4.1 Spatial Distribution of Emission
4.1.1 CO Emission Morpohology
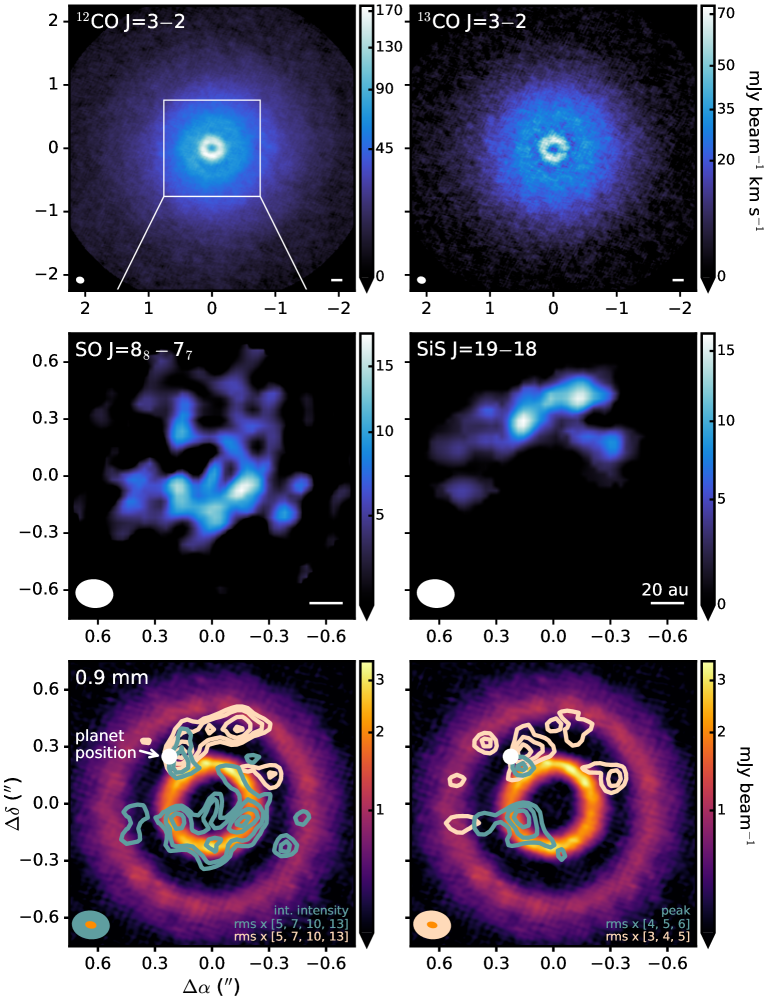
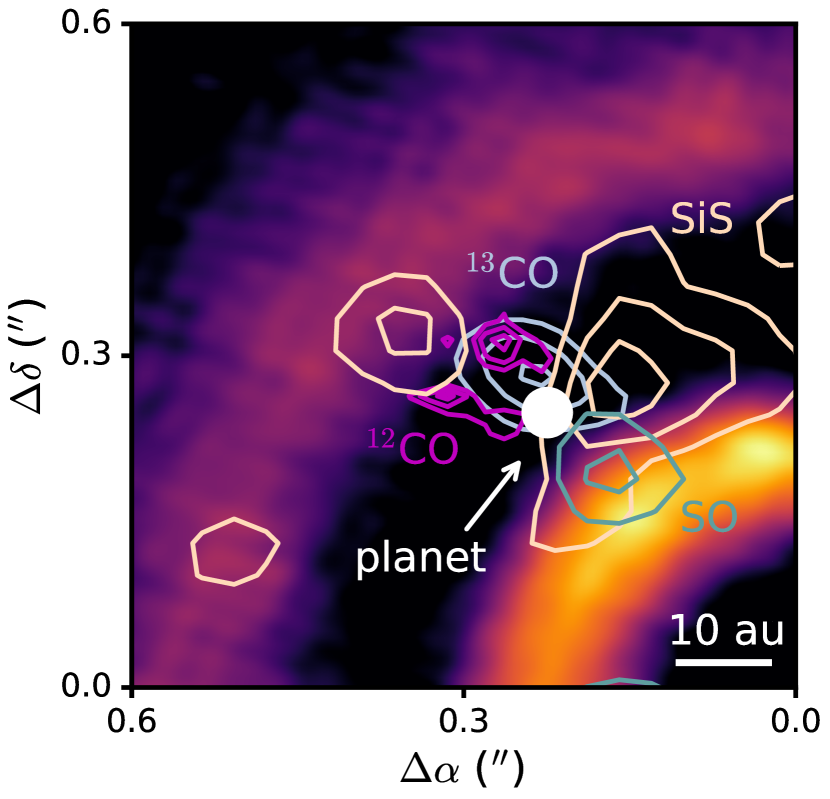
Figure 1 shows zeroth moment maps of the detected lines. The 12CO and 13CO J=3–2 lines are the most spatially extended and display two emission rings, closely resembling the J=2–1 transitions presented in Yu et al. (2021) and Garg et al. (2022) and the 13CO J=6–5 line from Leemker et al. (2022). In this Letter, we do not analyze the large-scale CO emission in detail and instead refer the interested reader to the above references.
4.1.2 SO Emission Morpohology
Figure 2 shows an azimuthally-averaged SO radial profile. The bulk of the SO emission is located in an azimuthally-asymmetric ring at a radius of 24 au, which closely traces the inner mm dust ring (Figure 1). This SO ring exhibits a clear asymmetry with the southern half of the disk showing bright SO emission, while the northern half has only faint emission. Given the current data quality, it is difficult to precisely determine the degree of azimuthal asymmetry but the peak brightness likely varies by at least a factor of several. A fainter outer ring at 50 au is also detected, which is clearly seen in the radial profile (Figure 2) and is visible as diffuse emission in the zeroth moment map (Figure 1). Due its low SNR, we cannot assess if this outer SO ring is also asymmetric. There also appears to be a central dip in SO intensity at 11 au, but the true depth of this feature is difficult to quantify.
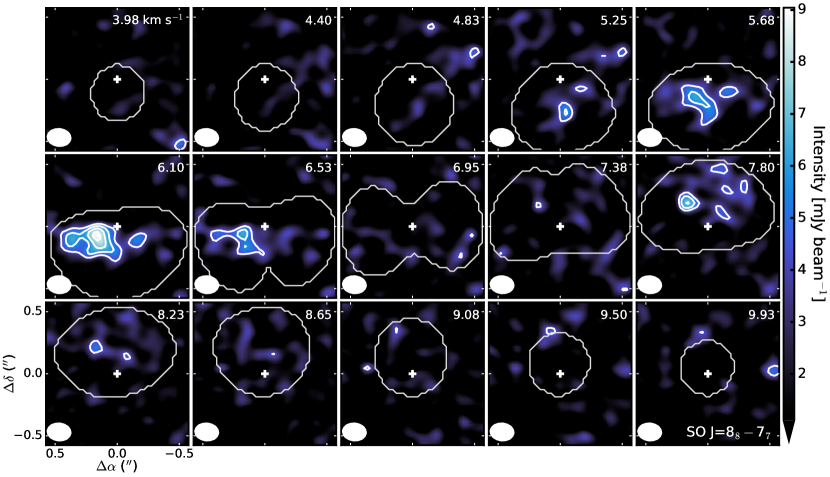
In addition to this ring-like morphology, SO shows a point-source-like emission feature at a radius of 32 au and PA35∘. This feature is not spatially-resolved and its compact nature is most clearly visible in the peak intensity map (Figure 1) and in the channel maps (Figure 9 in the Appendix). We also confirm that this feature is robustly detected in images with a range of Briggs robust parameters (see Appendix B). We often colloquially refer to such localized features as emission “blobs” and designate them by cardinal directions, i.e., “SO NE blob”. In Figure 2, we also extracted a radial profile along a narrow azimuthal wedge containing this feature. The SO NE blob is not part of either SO ring due its distinct radius, and the PA of this feature corresponds to the azimuthal region of the inner SO ring that shows little-to-no emission.
4.1.3 SiS Detection and Emission Morpohology
We report the first tentative detection of SiS in a protoplanetary disk. SiS emission is detected with a peak intensity of 7.9 mJy beam-1, which corresponds to a peak SNR of 5 (Figure 1). We also detected peak SiS emission of at least 4 in three velocity channels, two of which are consecutive (see Figure 10). Despite passing traditional thresholds for line detections (e.g., Bergner et al., 2019), we conservatively refer to this as a tentative detection since only one SiS line is covered in these archival data.
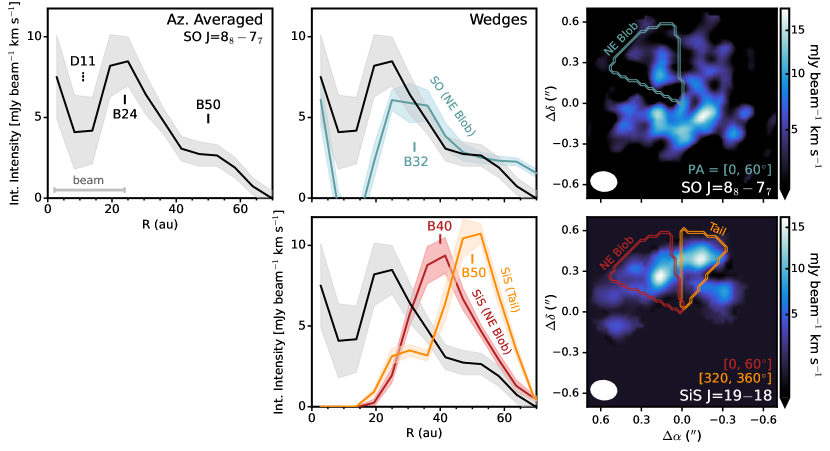
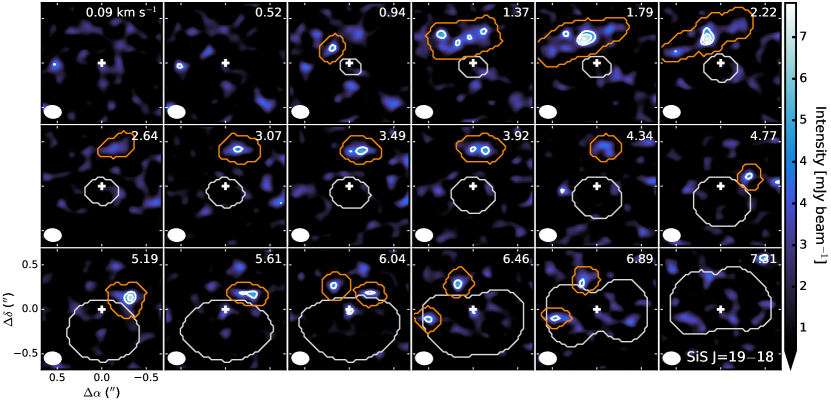
The SiS emission is spatially-compact, azimuthally-asymmetric, and non-Keplerian. As shown in Figure 2, the SiS emission can be broadly categorized into two distinct components: (1) a localized emission feature (“SiS NE blob”) at a similar, but not identical, position (r40 au; PA=30∘) as that of the compact SO feature; (2) an extended arc or “tail” connected which extends to r50 au. These features can also clearly be seen in the channel maps in Figure 10 in the Appendix. Similar to the SO feature, the SiS NE blob is spatially-unresolved but due to its extended nature, the SiS tail is marginally resolved.
4.2 Kinematics of SO and SiS
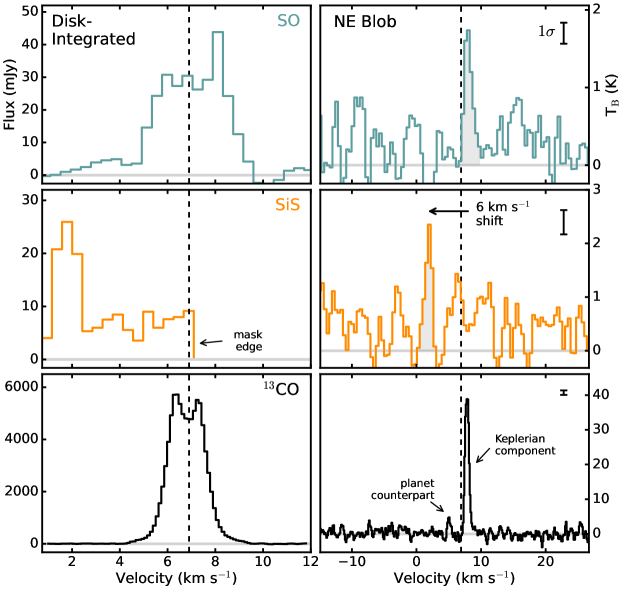
In Figure 3, we first extracted disk-integrated spectra for SO and SiS, as well as for 13CO to provide a reference for the Keplerian rotation of the disk. The SO emission is consistent with Keplerian rotation and has a similar double-peaked profile to that of 13CO. However, there is conspicuous excess flux at v8 km s-1, which represents the contribution of the bright NE blob. While the SO NE blob does not substantially deviate from Keplerian rotation, it has no bright localized counterpart on the other side of the disk, i.e., v. In contrast to SO, the SiS emission is entirely non-Keplerian with most emission coming from a narrow velocity range of v1–2.5 km s-1, while some fainter emission is present at v2.5 km s-1. This deviation from Keplerian rotation is clearly see in the channel maps (Figure 10). The hand-drawn SiS masks are intentionally restrictive and the mask edges at vLSR=7.1 km s-1 are shown in Figure 3. While the true SiS integrated flux may be larger than what is reported in Table 1, we opted for this conservative approach to ensure high confidence in the SiS emission we consider.
Next, we extracted individual spectra within one beam size at the location of the bright NE blob in SO and SiS. The extraction positions are not identical given the small spatial offset (a few au) between the SO and SiS features (Figure 1). As before, we also extracted a 13CO spectrum at the same position for reference. The SO emission associated with the SO NE blob is consistent with the Keplerian rotation of the disk, while the SiS emission shows a blueshift of 6 km s-1 from the expected Keplerian velocity as traced by 13CO. This SiS shift may point to a outflow around an embedded planet and we return to this in the Discussion. Intriguingly, we also note the presence of excess, non-Keplerian 13CO emission at a similar velocity (v5 km s-1) as the SiS emission.
More detailed analysis of the velocity structure of these lines is precluded by the relatively coarse channel spacing (0.4 km s-1) of the ALMA archival data.
4.3 Point-Source-Like Emission in 12CO and 13CO
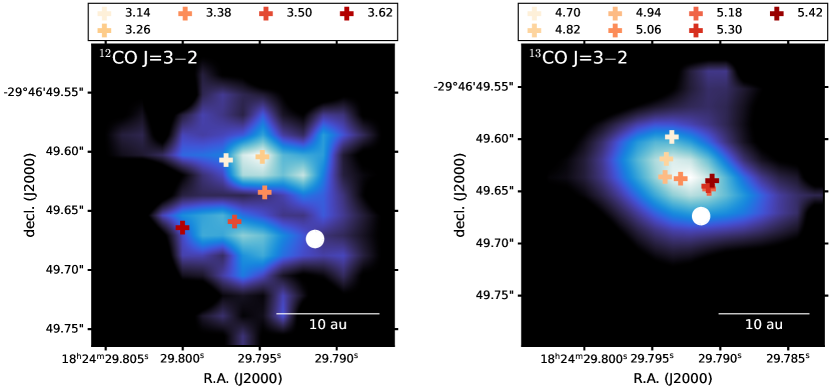
As shown in Figure 4, we also detected point-source-like emission in 12CO and 13CO at a projected distance of 340-400 mas (39-46 au) and PA38∘, which is near the location of the SO and SiS NE Blobs and the putative planet location. This emission is not related to the Keplerian component of the disk and no counterpart to either feature in 12CO or 13CO is seen on the other side of the disk (e.g., see full spectrum of 13CO in Figure 3). We detected 3 emission in at least two adjacent channels for both 12CO and 13CO (Figure 4). We confirmed that these features are robustly detected in both the JvM and non-JvM-corrected images, as well as in images generated from various combinations of robust parameters (see Appendix B for full details).
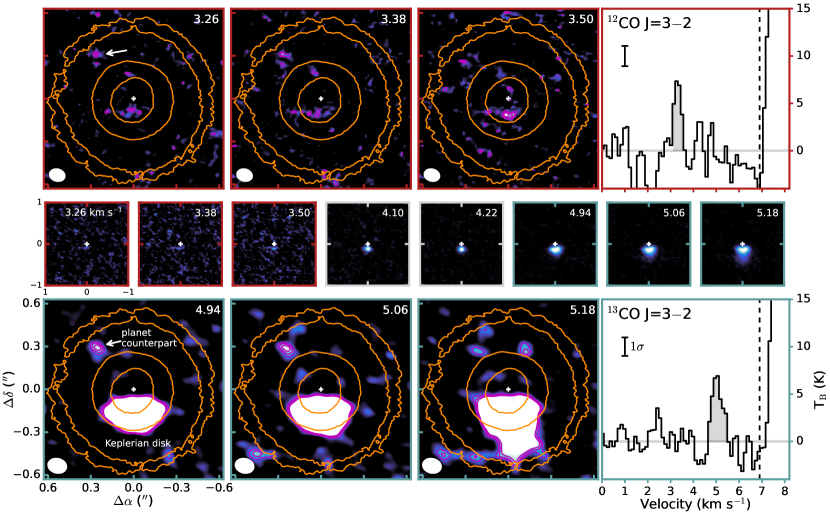
The 12CO and 13CO emission do not share the same velocity, with the 12CO emission being more blueshifted (v3 km s-1) than the 13CO component (v5 km s-1). While the 12CO and 13CO emission are approximately spatially coincident, the 12CO emission appears slightly offset from the peak of 13CO (see Figure 6). The compact 13CO is spatially-unresolved, while there is a slight hint that 12CO has a brighter northern component (see Figure 11) with the caveat that the entire extent of the 12CO emission is within one beam. To better quantify this offset, we measured the centroids of the 12CO and 13CO emission in each channel with a full listing of the centroid locations in Appendix D.
No counterpart in millimeter continuum emission is detected here or reported in previous high sensitivity continuum observations of this disk (e.g., Pérez et al., 2019). NIR colors of a point-source-like object suggests the presence of a significant amount of small dust at this location (Hammond et al., 2023). This is consistent with the presence of a Jupiter-mass planet, as the lack of mm dust can be explained by strong dust filtration (Rice et al., 2006), while the smaller dust grains remain coupled to the gas close to the protoplanet.
4.4 Column Densities
Next, we used the measured line intensities of SO, SiS, and SO2 to compute their column densities (for a detailed analysis of the CO gas density, see Garg et al. (2022); Leemker et al. (2022)). We followed a similar analysis as in Booth et al. (2023) and assumed that the lines are optically thin and in local thermodynamic equilibrium (LTE). For SO and SiS, we only have one transition (and thus one upper state energy) and were unable to drive a rotational temperature (Trot). Likewise, for SO2, both lines are undetected, which precludes a meaningful rotational diagram analysis. Instead, we adopted a constant rotational temperature of 100 K for all molecules. This is a reasonable assumption as all SO and SiS emission is confined to the inner disk (70 au) and is consistent with the warm gas temperatures reported in Leemker et al. (2022).
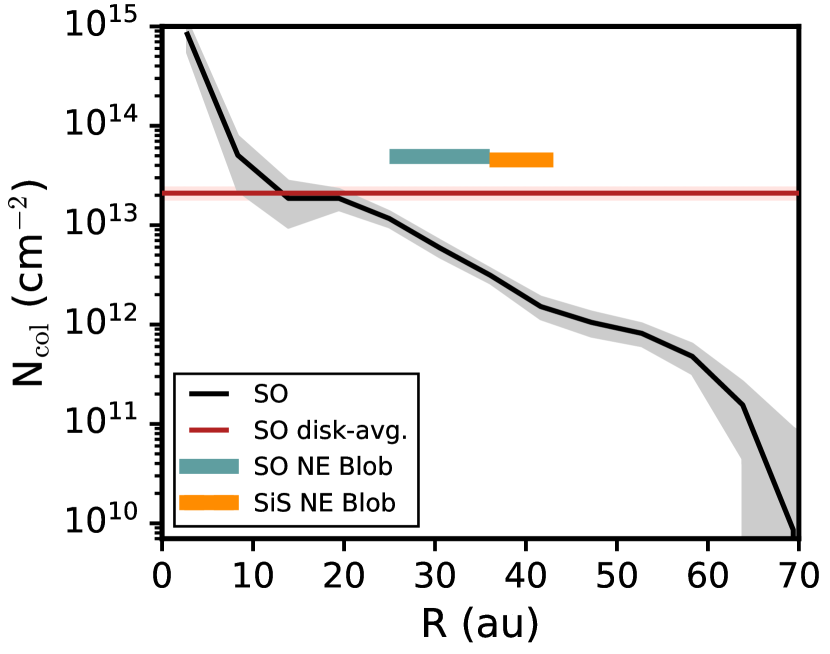
Figure 5 shows the SO radial column density profile computed using the azimuthally-averaged radial line intensity profile (Figure 2). Disk-averaged column densities for SO, SiS, and SO2 were estimated from the integrated fluxes and upper limits reported in Table 1 and an assumed elliptical emitting area with the same position angle and inclination as the disk and a semi-major axis of 06. Table 2 lists the derived values.
We also derived the column densities at the location of the NE Blob. We used the fluxes of SO and SiS (and 3 upper limit for SO2) from spectra extracted within a single beam centered on the NE Blob position (Figure 3). The SO column density is a factor of two larger than the disk-averaged values, while the SiS column density is nearly an order of magnitude larger, resulting in a nearly one-to-one SiS/SO ratio at this position.
It is possible that the gas temperatures at the NE Blob are considerably higher than 100 K, especially since SiS is observed in the gas phase, which suggests the presence of shocks and dust grain sputtering. We note that the column density calculations are only modestly sensitive to the assumed temperature, i.e., if the temperature were a factor of five larger, this results in a factor of two increase in SiS column density. Additional lines of SO and SiS with a sufficiently large range of upper state energies are required to better constrain the excitation conditions of both molecules.
| Molecule | Ncol (cm-2) | / SO (%) |
|---|---|---|
| Disk-Averaged | ||
| SO | 2.1 0.3 1013 | … |
| SiS | 6.5 2.4 1012 | 31 |
| SO2 | 4.2 1013 | 199 |
| NE Blob | ||
| SO | 4.9 0.7 1013 | … |
| SiS | 4.5 0.7 1013 | 92 |
| SO2 | 4.3 1013 | 87 |
Note. — All column densities are computed assuming a constant Tex=100 K. For the two non-detected SO2 lines, we computed the upper limit as for both lines and report the smaller of the two.
5 Discussion
In Section 5.1, we discuss the nature and origins of the compact emission observed in multiple molecular tracers in the context of ongoing giant planet formation in the HD 169142 disk. In Section 5.2, we then explore the chemical origins of the broader ring-like SO emission, including the prominent asymmetry of the inner SO ring and compare our observations to other Class II disks.
5.1 Chemical Signatures of Ongoing Giant Planet Formation
5.1.1 Compact 12CO and 13CO Emission Counterparts
The compact 12CO and 13CO emission is located at the center of a gas-depleted, mm and NIR annular gap (e.g., Fedele et al., 2017; Ligi et al., 2018; Pérez et al., 2019; Garg et al., 2022); is coincident with the position of a high-intensity, Keplerian-rotating NIR point source (Gratton et al., 2019; Hammond et al., 2023); and lies along the same azimuthal arc as a known 12CO kinematic excess (Garg et al., 2022). Figure 6 shows the close proximity of this compact emission with the location of the proposed planet from Gratton et al. (2019); Hammond et al. (2023). These different lines of evidence suggest that we are observing molecular line emission associated with a giant planet embedded within the HD 169142 disk. This represents the third such feature seen in molecular gas after those identified in the AS 209 (Bae et al., 2021) and Elias 2-24 disks (Pinte et al., 2023) and the first seen in more than one molecular line.
With the current data, we cannot definitively determine the origin of this compact 12CO and 13CO emission. However, the significant blueshifts of both lines with respect to the systemic velocity suggest that this emission is not directly associated with a CPD or nearby circumplanetary material (Perez et al., 2015). Instead, the observed velocities are more consistent with an outflow origin, where we are observing gas accelerating along our line of sight, while the velocity difference between the more blueshifted 12CO emission versus that of 13CO is likely an optical depth effect. The tentative spatial offset of 12CO from the more point-source-like emission of 13CO is also consistent with such a scenario.
Further detailed analysis is limited by the current SNR. Higher angular and spectral resolution data are required to better constrain the origin and properties of this compact 12CO and 13CO emission.
5.1.2 Localized SO and Arc-like SiS Emission
We first discuss the potential chemical origins of SO and SiS, which are generally considered tracers of shocked gas, and then interpret the observed chemical signatures in the HD 169142 disk in the context of giant planet formation. Here, we only consider the compact SO that is co-spatial with the planet location. Please see Section 5.2 for a discussion of the bulk SO emission.
SO. SO is often observed in regions of warm and shocked gas, including accretion shocks (Sakai et al., 2014, 2017; Oya et al., 2019), protostellar outflows (Codella et al., 2014; Taquet et al., 2020), MHD-driven disk winds (Tabone et al., 2017; Lee et al., 2018), and the warm inner envelopes of Class I protostars (Harsono et al., 2021). In shocks, the gas temperature rapidly increases to 100 K (Draine et al., 1983), which enables efficient gas-phase formation of SO (e.g., Prasad & Huntress, 1980; Hartquist et al., 1980; van Gelder et al., 2021) as well as the thermal desorption of any S-rich ices that are present (e.g., Cleeves et al., 2015; Kama et al., 2019). SO has been detected in a only handful of Class II disks to date with evidence of gas-phase SO tracing the location of an embedded giant planet in at least one disk (Booth et al., 2023).
SiS. SiS has been detected in a variety of settings in the ISM, including in the circumstellar envelopes of AGB stars (Velilla-Prieto et al., 2019; Danilovich et al., 2019), massive star-forming regions (Tercero et al., 2011), shocks around low-mass protostars (Podio et al., 2017), and the innermost disks of massive protostars (Tanaka et al., 2020; Ginsburg et al., 2023). Unlike the more commonly-observed SiO molecule, which is a well-established tracer of silicates released from dust grain in shocks (e.g., Gusdorf et al., 2008), the formation and destruction pathways of SiS remain less clear. While it is possible to produce gas-phase SiS through a direct release from dust cores, this requires strong shocks that fully destroy the grains and is inconsistent with existing observations of the low-mass protostellar shock L1157-B1, where SiS is not seen at the jet impact site, the location of the strongest shocks in this system (Podio et al., 2017). Instead, SiS is thought to be a product of neutral-neutral gas-phase reactions between species released from dust grains in the shock (e.g., Rosi et al., 2018; Paiva et al., 2020). Recent theoretical work has shown a formation route of SiSH that is efficient at warm temperatures (200 K) (Mota et al., 2021), which are consistent with gas temperatures associated with an embedded giant plant. Zanchet et al. (2018) have also suggested a formation route of SiSO, which may be relevant in HD 169142 given the detection of SO.
The observed chemical signatures of SO and SiS in the HD 169142 disk could thus originate from a variety of mechanisms, including a planet-driven outflow, circumstellar disk winds, planet-disk interactions driving an infall streamer, or emission directly from a circumplanetary disk/envelope.
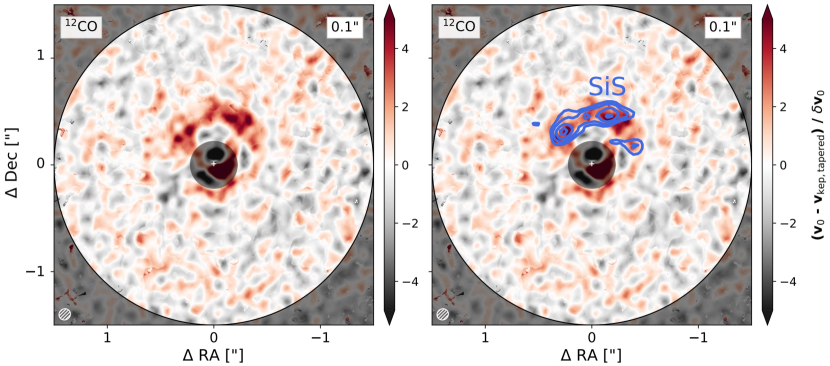
A planet-driven outflow is the most consistent with the spatial and kinematic properties of both SiS and SO. The SiS has a substantially blueshifted velocity offset (Figure 3) and extends from the planet location along an arc (Figure 1), which taken together, suggest an origin in a localized outflow from an accreting protoplanet. This extended tail is co-spatial with the 12CO kinematic excess reported in Garg et al. (2022) (see Figure 12) and is located ahead in azimuth of the (clockwise) planet rotation. This is perhaps somewhat surprising, but we note that the geometry of the emission is not well-constrained and its apparent morphology may be influenced by projection effects. Given the observed blueshift of SiS and near-face on orientation of the HD 169142 disk, at least a substantial component of this outflow must be directed along the observer line of sight. Such a geometry is also consistent with an outflow origin of the 12CO and 13CO emission as discussed in Section 5.1.1.
The SO emission is considerably more compact than that of SiS, but it is difficult to tell if this is due to a lack of SO gas or excitation effects. The J=19–18 line of SiS has an upper state energy (Eu=166 K) approximately twice that of SO J=88–77 (Eu=88 K). However, with the current coarse velocity resolution and lack of information about SO excitation, we cannot rule out the presence of hot SO gas at or or near the location of the extended SiS emission. The SO emission also does not show the same blueshifted velocity offset as SiS. While this may suggest a non-outflow-based origin such as accretion shocks onto a CPD or a nearby warm gas envelope, it is possible that SO is tracing a different, lower-velocity component of the same outflow.
While there are several alternate explanations for these chemical signatures, they are generally insufficient to simultaneously explain the emission morphology and kinematics of both SiS and SO. Disk winds appear inconsistent with the localized nature of the SO and SiS emission and relatively small velocity deviations observed (disk winds typically show velocity offsets of tens of km s-1 from Keplerian rotation, e.g., Booth et al., 2021b). Alternatively, simulations have shown that gap edges become mildly Rayleigh unstable and intermittently shed streams of material into the gap in the presence of high planet masses (Fung & Chiang, 2016). However, it is not clear if such wakes result in sufficiently strong shocks to produce detectable amounts of gas-phase SiS. Moreover, detailed analysis of CO kinematics in the HD 169142 disk find no evidence for such planetary wakes (Garg et al., 2022). While NIR spirals arms are observed in HD 169142, neither SiS or SO traces the locations of these spirals, which are located behind the planet orbit in azimuth (Hammond et al., 2023). It is also unlikely that we are seeing emission from the circumplanetary material itself. The extended morphology of SO, and especially of SiS, along with mutual offsets of a few au from the planet location and CO counterparts (Figure 6), are inconsistent with SO and SiS directly originating from close-in circumplanetary material.
Overall, this suggests that the most plausible scenario is one in which an embedded, giant planet identified in both NIR and via compact 12CO and 13CO emission is driving an outflow, which locally heats gas and produces an extended shock traced in SO and SiS.
5.2 Morphology and Origins of SO Emission
5.2.1 Chemical Origins and Asymmetry
The SO emission distribution in the HD 169142 disk is confined to the innermost 70 au and closely follows that of the millimeter dust (Figure 1). The bright asymmetric inner ring is located at the edge of the inner dust cavity, while the faint outer ring appears to peak at the edge of the outer dust ring. This emission distribution is broadly consistent with SO originating from the thermal desorption of S-rich ices (e.g., Cleeves et al., 2011; Kama et al., 2019). This may be due to the direct sublimation of SO ice or gas-phase chemistry following the UV photo-dissociation of evaporated H2S and H2O ices. In the later case, SO can form via the efficient barrierless gas-phase neutral-neutral reactions, S OH or O SH (e.g., Charnley, 1997). Since both OH and H2O were not detected with Herschel/PACS (The Photodetector Array Camera and Spectrometer) (Fedele et al., 2013) in this disk, this suggests that the ices in HD 169142 are H2S-rich, although other forms of S-bearing ices cannot be ruled out (e.g., OCS, SO2).
If the ice reservoir is constrained to the larger mm- and cm-sized dust grains, then the observed asymmetry in SO is difficult to explain with ice sublimation alone since the dust is largely axisymmetric (Fedele et al., 2017; Macías et al., 2019; Pérez et al., 2019). However, SO asymmetries can be caused by changing physical conditions in the disk, namely azimuthal temperature variations due to a warped disk or dynamical interactions with an embedded planet. We explore each of these scenarios in turn.
Misaligned Inner Disk. Asymmetries in molecular line emission can arise in warped disks from azimuthal variations in disk illumination by the central star, which in turn manifests in chemical variations. Warped disks do not necessarily show clear azimuthal asymmetries in their outer disks, but instead possess misaligned inner disks due to an embedded companion (Young et al., 2021). Models have identified SO as a potential chemical tracer of warped disks and demonstrated that changing X-ray illumination drives variations in SO abundance (Young et al., 2021). The HD 169142 disk shows several signatures of a misaligned inner disk, including shadowing in NIR polarized intensity images (Quanz et al., 2013; Pohl et al., 2017; Bertrang et al., 2018; Rich et al., 2022). On sub-au scales, observations with the GRAVITY instrument at the Very Large Telescope revealed a considerable misalignment in both inclination (iin=35∘) and position angle (PAin=32∘) versus the outer disk (i=13∘, PA=5∘) as traced by CO (Bohn et al., 2022). Garg et al. (2022) suggested that the kinematic excess observed in 12CO may also originate from a misaligned inner disk, as spurious kinematic residuals can be generated from the subtraction of Keplerian models that incorrectly assume a constant PA and inclination (Young et al., 2022). The HD 169142 disk also shows evidence for a giant planet (1-10 MJup) in its inner dust cavity in observations in the NIR (Bertrang et al., 2020) and of CO isotopologues (Leemker et al., 2022). The models of SO chemical asymmetries in warped disks from Young et al. (2021) were based on a hydrodynamical simulation of a 6.5 MJup planet embedded in a disk at a radius of 5 au around a solar-mass star orbiting at a 12∘ inclination with respect to the disk (Nealon et al., 2019). Thus, to first order, this is similar to the HD 169142 system and implies that the presence of a warped disk, due to an embedded giant planet and misaligned inner disk, offers a plausible explanation for the observed SO brightness asymmetry.
Planet-disk Interactions. It is also possible for dynamical interactions between forming planets and the circumstellar disk to produce chemical asymmetries (e.g., Cleeves et al., 2015). We see evidence of local gas heating at the proposed planet location in the form of compact SO emission (see Section 5.1.2). This additional heating may also contribute, at least in part, to the broader SO asymmetry. The asymmetric, ring-like SO emission likely does not trace accretion shocks but rather the impact of this additional heating on the surrounding disk. It has been shown, for instance, that an embedded giant planet can excite the orbits of planetesimals within in the circumstellar gas disk and cause bow-shock heating that evaporates ices (Nagasawa et al., 2019). While the peak of the SO emission brightness is offset in PA from the planet location (Figure 1), we cannot currently discern if this offset has a dynamical origin or is an excitation effect, i.e., we are not observing the hottest SO gas near to the planet location.
5.2.2 Comparison to Other Disks
While SO is commonly observed in protostellar systems (e.g., Bachiller & Pérez Gutiérrez, 1997; Codella et al., 2014; Taquet et al., 2020; Garufi et al., 2022), detections are relatively rare in evolved (1 Myr) Class II protoplanetary disks. HD 169142 is only the fifth such disk where SO has been spatially resolved, after AB Aur (Pacheco-Vázquez et al., 2016; Rivière-Marichalar et al., 2020), Oph-IRS 48 (Booth et al., 2021a), HD 100546 (Booth et al., 2023), and DR Tau (Huang et al., 2023). All of these sources are transition disks around Herbig stars, with the exception of DR Tau, which shows substantial interaction with its environment. There is also a marginal detection of SO in single dish observations of the transition disk around the T Tauri star GM Aur (Guilloteau et al., 2016), but this disk also shows evidence of late infall from a remnant envelope or cloud material (Huang et al., 2021). Hence, it is not known where the SO is originating from, i.e., disk vs. shocks from cloud material. Taken together, this points to ice sublimation as a common origin for the bulk of SO emission in isolated or non-interacting Class II disks.
The HD 169142 disk appears typical in its SO content relative to other Herbig disks. Its disk-integrated column density is consistent within a factor of a few compared to the HD 100546 (4.0–6.4 cm-2) (Booth et al., 2023) and AB Aur disks (2.1–3.4 cm-2) (Rivière-Marichalar et al., 2020). The Oph-IRS 48 disk has a considerably larger SO column density (4.7–9.9 cm-2) (Booth et al., 2021a), but this disk displays several unique properties, including a high degree of chemical complexity not seen in other Class II disks (van der Marel et al., 2021a; Brunken et al., 2022), which includes the only detection of SO2 in disks to date (Booth et al., 2021a).
Asymmetries are a common feature of SO emission in protoplanetary disks with all spatially-resolved SO observations showing some degree of azimuthal asymmetry. Of those disks with spatially-resolved SO, three sources have confirmed (AB Aur b, Currie et al., 2022) or proposed embedded planets (Currie et al., 2015; Brittain et al., 2019, HD 100546,; Gratton et al., 2019, HD 169142,). The AB Aur disk hosts a particularly complex and dynamic environment, with spiral arms, high levels of accretion and outflow activity and is possibly gravitationally unstable (Tang et al., 2012; Salyk et al., 2013; Rivière-Marichalar et al., 2020; Cadman et al., 2021). Thus, disentangling the origin of the SO asymmetry in such a setting is challenging. The HD 100546 disk, however, is a much closer analogue to the HD 169412 system, as both are warm, Herbig disks with compelling evidence of embedded planets. In both cases, there is a component of SO emission that traces the location of proposed giant planets. In the HD 100546 disk, Booth et al. (2023) also detected temporal variability in the SO emission, which was speculated to be in response to the orbit of an embedded planet. It may be possible to observe similar variability in SO (and possibly SiS) in future observations of the HD 169142 system, although this will require a larger observation baseline due to the longer rotation period (174 yr) associated with a planet at 38 au compared to a 10 au planet in the HD 100546 disk. We do, however, note that these disks are not perfect analogues, as SiS is not detected in HD 100546 and has a SiS/SO column density ratio of 5.0% (Booth et al., 2023), while this ratio is nearly one-to-one in HD 169412 (Table 2).
6 Conclusions
The HD 169142 disk shows several distinct chemical signatures that demonstrate a compelling link to ongoing giant planet formation. Using ALMA archival data, we identify compact SO J=88–77 and SiS J=19–18 emission coincident with the position of a proposed 2 MJup planet seen as a localized, Keplerian NIR feature within a gas-depleted, annular dust gap at 38 au. The SiS emission is non-Keplerian and is located along the same extended azimuthal arc as a known 12CO kinematic excess. This is the first tentative detection of SiS emission in a protoplanetary disk and suggests that the planet is driving sufficiently strong shocks to produce gas-phase SiS. We also report the discovery of compact 12CO J=3–2 and 13CO J=3–2 emission counterparts coincident with the planet location. Taken together, a planet-driven outflow provides the most consistent explanation for the spatial and kinematic properties of these chemical signatures and their close proximity to the planet position.
In addition to the localized SO emission, we resolve a bright, azimuthally-asymmetric SO ring at 24 au located at the inner edge of the central dust cavity. This makes HD 169142 only the fifth such Class II system with a spatially-resolved SO detection. The bulk of the SO emission likely has an origin in ice sublimation, while its asymmetric distribution suggests the presence of azimuthal temperature variations driven by a misaligned inner disk or planet-disk interactions, possibly due to the giant planet at 38 au.
The HD 169142 system presents a powerful template for future searches of planet-related chemical asymmetries in protoplanetary disks and an ideal test-bed for observational follow-up. The sudden increase in temperature and density in the shocked gas around the embedded planet likely results in a hot gas-phase chemistry, in which the abundance of several molecular species, in addition to Si- or S-bearing molecules, dramatically increases by several orders of magnitude. Deep spectral surveys of the location around the embedded planet may reveal new chemistry not yet detected in planet-forming disks and allow for new insights into planet-feeding gas. In parallel to this, a survey of SO and SiS emission in disks with known or suspected giant planets would provide a vital confirmation of these molecules as novel tracers of embedded planets.
The authors thank the anonymous referee for valuable comments that improved both the content and presentation of this work. We thank Sean Andrews and Richard Teague for useful discussions. This paper makes use of the following ALMA data: ADS/JAO.ALMA#2012.1.00799.S and 2015.1.00806.S. ALMA is a partnership of ESO (representing its member states), NSF (USA) and NINS (Japan), together with NRC (Canada), MOST and ASIAA (Taiwan), and KASI (Republic of Korea), in cooperation with the Republic of Chile. The Joint ALMA Observatory is operated by ESO, AUI/NRAO and NAOJ. The National Radio Astronomy Observatory is a facility of the National Science Foundation operated under cooperative agreement by Associated Universities, Inc. K.I.Ö. acknowledges support from the Simons Foundation (SCOL #686302) and the National Science Foundation under Grant No. AST-1907832.
Appendix A Observational Details
Table 3 lists all ALMA execution blocks used in this work and includes the ALMA project codes, PIs, UT observing dates, number of antennas, on-source integration times, baseline ranges, observatory-estimated spatial resolutions, maximum recoverable scales (M.R.S.), mean precipitable water vapor (PWV), and flux, phase, and bandpass calibrators.
| Project | PI | UT Date | No. Ants. | Int. | Baselines | Res. | M.R.S. | PWV | Calibrators | ||
|---|---|---|---|---|---|---|---|---|---|---|---|
| Code | (min) | (m) | (′′) | (′′) | (mm) | Flux | Phase | Bandpass | |||
| 2012.1.00799.S | M. Honda | 2015-07-26 | 41 | 41.4 | 15–1574 | 0.13 | 1.3 | 0.4 | J1924-2914 | J1826-2924 | J1924-2914 |
| 2015-07-27 | 41 | 21.2 | 15–1574 | 0.13 | 1.4 | 0.3 | J1924-2914 | J1826-2924 | J1924-2914 | ||
| 2015-08-08 | 43 | 41.4 | 35–1574 | 0.13 | 1.3 | 1.3 | Pallas | J1826-2924 | J1924-2914 | ||
| 2015.1.00806.S | J. Pineda | 2015-12-06 | 32 | 25.3 | 19–7716 | 0.031 | J1733-1304 | J1826-2924 | J1924-2914 | ||
Appendix B Properties of Compact Emission in SO, 12CO, and 13CO with Various Imaging Parameters
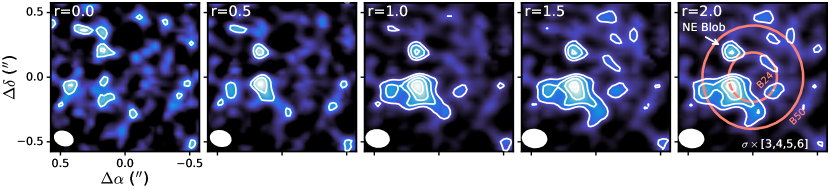
Figure 7 shows SO peak intensity maps for a range of Briggs robust values (0.0 to 2.0). The compact SO emission (NE Blob) is clearly detected in all images. Images with lower robust values lack sufficient sensitivity to detect either the NE Blob or the overall ring-like SO structure. Table 4 shows a summary of the properties of the compact SO emission measured from each of these images. We computed the RMS, central velocity, FWHM, peak intensity, and integrated intensity within a synthesized beam around the NE Blob. We find that the NE Blob is well-detected with peak intensities with SNRs of 5-8. As shown in the last panel of Figure 7, it is also clear that the NE Blob is at a radius distinct from either broad SO ring at 24 au or 50 au and is located near the position of the HD 169142 b planet.
| robust | Beam | PA | RMSaaThe RMS noise was computed within the synthesized beam around the compact SO emission over the first 20 line-free channels of the cube. | Central Velocity | FWHM | Peak Int. | Integrated Int. | |
|---|---|---|---|---|---|---|---|---|
| (mas mas) | (deg) | (mJy beam-1) | (km s-1) | (km s-1) | (mJy beam-1) | (mJy beam-1 km s-1 ) | ||
| 0.0 | 150 111 | 69.4 | 1.41 | 8.2 0.1 | 1.9 0.1 | 7.2 0.7 | 11.7 1.2 | |
| 0.5 | 164 123 | 76.0 | 1.06 | 7.9 0.1 | 1.4 0.1 | 6.7 0.7 | 9.6 1.0 | |
| 1.0 | 183 137 | 82.2 | 0.87 | 7.9 0.1 | 1.5 0.1 | 7.0 0.7 | 9.4 0.9 | |
| 1.5 | 192 143 | 84.1 | 0.88 | 8.0 0.1 | 1.5 0.1 | 6.5 0.6 | 9.3 0.9 | |
| 2.0 | 193 144 | 84.4 | 0.89 | 8.0 0.1 | 1.6 0.1 | 6.7 0.7 | 9.8 1.0 |
Note. — We adopt a 10% systematic flux uncertainty and quarter-channel velocity uncertainties.
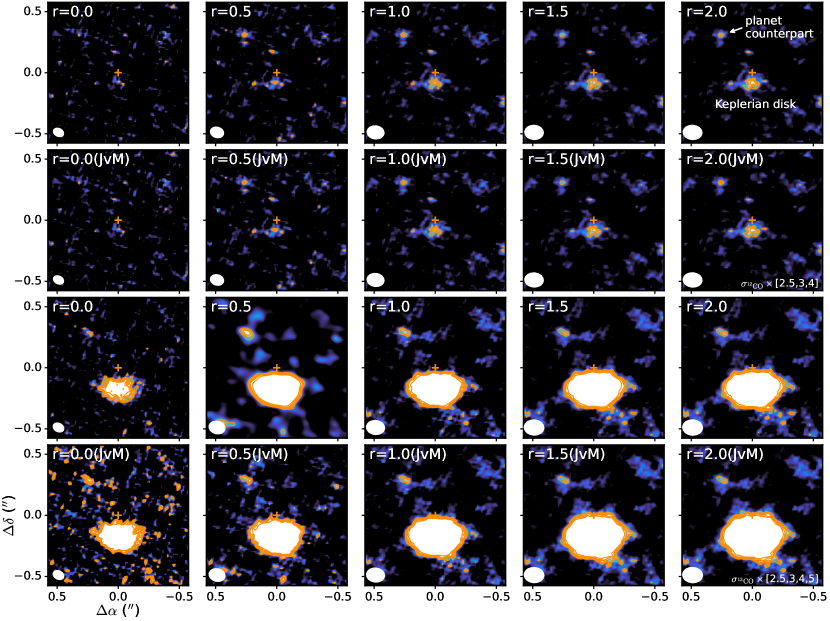
Figure 8 and Table 5 show a similar analysis of the properties of the point-source-like emission in 12CO and 13CO in a range of images with different Briggs robust values from 0.0 to 2.0. Images with lower robust values lacked sufficient sensitivity to detect the compact 12CO and 13CO emission. For each robust value, we also generated images both with and without the JvM-correction. Localized emission in the vicinity of HD 169142 b is detected in all image combinations with the exception of the 12CO image at a robust of 0.0. However, this image has a considerably higher RMS and the smallest beam size so this non-detection is likely due to insufficient sensitivity at these small beam sizes. Depending on the image, the point-source-like 12CO emission was detected with peak SNRs ranging from 3-4, while the 13CO emission has peak SNRs of 3-7. Thus, the detection of 12CO and 13CO emission near HD 169142 b is statistically significant regardless of which image we use.
| robust | Beam | PA | RMSaaThe RMS noise was computed within the synthesized beam around the compact 12CO and 13CO emission over the first 20 line-free channels of the cube. | Central Velocity | FWHM | Peak Int. | Integrated Int. | |
|---|---|---|---|---|---|---|---|---|
| (mas mas) | (deg) | (mJy beam-1) | (km s-1) | (km s-1) | (mJy beam-1) | (mJy beam-1 km s-1 ) | ||
| 12CO J=32 | ||||||||
| no JvM | ||||||||
| 0.0 | 90 66 | 63.5 | 3.03 | 3.33 0.03 | 0.30 0.03 | 7.6 0.8 | 2.0 0.2 | |
| 0.5 | 112 88 | 74.1 | 2.34 | 3.31 0.03 | 0.36 0.03 | 7.1 0.7 | 2.5 0.2 | |
| 1.0 | 142 109 | 83.4 | 1.51 | 3.34 0.03 | 0.43 0.03 | 5.6 0.6 | 1.7 0.2 | |
| 1.5 | 155 118 | 86.1 | 1.21 | 3.36 0.03 | 0.48 0.03 | 4.5 0.4 | 1.4 0.1 | |
| 2.0 | 157 119 | 85.6 | 1.18 | 3.36 0.03 | 0.48 0.03 | 4.4 0.4 | 1.4 0.1 | |
| 12CO J=32 | ||||||||
| with JvM | ||||||||
| 0.0 | 90 66 | 63.5 | 1.71 | 3.33 0.03 | 0.30 0.03 | 4.3 0.4 | 1.1 0.1 | |
| 0.5 | 112 87 | 74.1 | 1.49 | 3.31 0.03 | 0.36 0.03 | 4.5 0.5 | 1.6 0.2 | |
| 1.0 | 142 109 | 83.4 | 0.87 | 3.34 0.03 | 0.43 0.03 | 3.3 0.3 | 1.0 0.1 | |
| 1.5 | 154 118 | 86.1 | 0.62 | 3.36 0.03 | 0.48 0.03 | 2.3 0.2 | 0.7 0.1 | |
| 2.0 | 157 119 | 85.6 | 0.60 | 3.36 0.03 | 0.48 0.03 | 2.2 0.2 | 0.7 0.1 | |
| 13CO J=32 | ||||||||
| no JvM | ||||||||
| 0.0 | 94 71 | 63.4 | 1.89 | 5.04 0.03 | 0.54 0.03 | 11.6 1.2 | 5.8 0.6 | |
| 0.5 | 135 105 | 76.3 | 1.45 | 5.01 0.03 | 0.51 0.03 | 8.7 0.9 | 3.9 0.4 | |
| 1.0 | 151 117 | 83.5 | 1.46 | 5.01 0.03 | 0.44 0.03 | 6.1 0.6 | 2.6 0.3 | |
| 1.5 | 163 127 | 86.0 | 1.59 | 5.00 0.03 | 0.41 0.03 | 5.4 0.5 | 2.2 0.2 | |
| 2.0 | 165 128 | 86.5 | 1.62 | 5.00 0.03 | 0.42 0.03 | 5.4 0.5 | 2.2 0.2 | |
| 13CO J=32 | ||||||||
| with JvM | ||||||||
| 0.0 | 94 71 | 63.4 | 1.08 | 5.04 0.03 | 0.54 0.03 | 6.6 0.7 | 3.3 0.3 | |
| 0.5 | 135 105 | 76.3 | 0.88 | 5.01 0.03 | 0.51 0.03 | 6.0 0.6 | 2.7 0.3 | |
| 1.0 | 151 117 | 83.5 | 0.85 | 5.01 0.03 | 0.44 0.03 | 3.6 0.4 | 1.5 0.2 | |
| 1.5 | 163 127 | 86.0 | 0.85 | 5.00 0.03 | 0.41 0.03 | 2.9 0.3 | 1.2 0.1 | |
| 2.0 | 165 128 | 86.5 | 0.85 | 5.00 0.03 | 0.42 0.03 | 2.8 0.3 | 1.2 0.1 |
Note. — We adopt a 10% systematic flux uncertainty and quarter-channel velocity uncertainties.
Appendix C Channel Maps
Appendix D Centroid Measurements of Compact 12CO and 13CO Emission
We computed the centroid of the point-source-like emission in 12CO and 13CO J=3–2 on a per-channel basis. We used the centroid_2dg task in Photutils (Bradley et al., 2022) python package to fit a 2D Gaussian to the emission distribution. Table 6 reports the derived centroids.
| Velocity (km s-1) | R.A. (J2000) | decl. (J2000) | R.A. Offset (′′) | decl. Offset (′′) |
|---|---|---|---|---|
| 12CO J=3–2 | ||||
| 3.14 | 18h24m29.7972s | 29d46m49.6070s | 0.303 | 0.319 |
| 3.26 | 18h24m29.7948s | 29d46m49.6043s | 0.272 | 0.322 |
| 3.38 | 18h24m29.7947s | 29d46m49.6343s | 0.271 | 0.292 |
| 3.50 | 18h24m29.7966s | 29d46m49.6590s | 0.296 | 0.267 |
| 3.62 | 18h24m29.8000s | 29d46m49.6642s | 0.340 | 0.262 |
| 13CO J=3–2 | ||||
| 4.70 | 18h24m29.7936s | 29d46m49.5979s | 0.256 | 0.328 |
| 4.82 | 18h24m29.7940s | 29d46m49.6190s | 0.261 | 0.307 |
| 4.94 | 18h24m29.7941s | 29d46m49.6362s | 0.262 | 0.290 |
| 5.06 | 18h24m29.7929s | 29d46m49.6379s | 0.248 | 0.288 |
| 5.18 | 18h24m29.7908s | 29d46m49.6477s | 0.220 | 0.278 |
| 5.30 | 18h24m29.7909s | 29d46m49.6451s | 0.221 | 0.281 |
| 5.42 | 18h24m29.7906s | 29d46m49.6398s | 0.217 | 0.286 |
Note. — Offset positions are computed from the phase center of the observations (=18h24m29.774s, =29d46m49.926s).
Appendix E SiS Emission versus CO kinematic excess
Figure 12 shows the 12CO J=2–1 kinematic excess reported in Garg et al. (2022) with the integrated intensity of SiS J=19–18 overlaid. The SiS emission is co-spatial with the azimuthal arc of the 12CO kinematic excess.
References
- Alarcón et al. (2022) Alarcón, F., Bergin, E. A., & Teague, R. 2022, ApJ, 941, L24, doi: 10.3847/2041-8213/aca6e6
- ALMA Partnership et al. (2015) ALMA Partnership, Brogan, C. L., Pérez, L. M., et al. 2015, ApJ, 808, L3, doi: 10.1088/2041-8205/808/1/L3
- Andrews et al. (2018) Andrews, S. M., Huang, J., Pérez, L. M., et al. 2018, ApJ, 869, L41, doi: 10.3847/2041-8213/aaf741
- Andrews et al. (2021) Andrews, S. M., Elder, W., Zhang, S., et al. 2021, ApJ, 916, 51, doi: 10.3847/1538-4357/ac00b9
- Astropy Collaboration et al. (2013) Astropy Collaboration, Robitaille, T. P., Tollerud, E. J., et al. 2013, A&A, 558, A33, doi: 10.1051/0004-6361/201322068
- Bachiller & Pérez Gutiérrez (1997) Bachiller, R., & Pérez Gutiérrez, M. 1997, ApJ, 487, L93, doi: 10.1086/310877
- Bae et al. (2021) Bae, J., Teague, R., & Zhu, Z. 2021, ApJ, 912, 56, doi: 10.3847/1538-4357/abe45e
- Bailer-Jones et al. (2021) Bailer-Jones, C. A. L., Rybizki, J., Fouesneau, M., Demleitner, M., & Andrae, R. 2021, AJ, 161, 147, doi: 10.3847/1538-3881/abd806
- Benisty et al. (2021) Benisty, M., Bae, J., Facchini, S., et al. 2021, ApJ, 916, L2, doi: 10.3847/2041-8213/ac0f83
- Bergner et al. (2019) Bergner, J. B., Öberg, K. I., Bergin, E. A., et al. 2019, ApJ, 876, 25, doi: 10.3847/1538-4357/ab141e
- Bertrang et al. (2018) Bertrang, G. H. M., Avenhaus, H., Casassus, S., et al. 2018, MNRAS, 474, 5105, doi: 10.1093/mnras/stx3052
- Bertrang et al. (2020) Bertrang, G. H. M., Flock, M., Keppler, M., et al. 2020, arXiv e-prints, arXiv:2007.11565, doi: 10.48550/arXiv.2007.11565
- Blondel & Djie (2006) Blondel, P. F. C., & Djie, H. R. E. T. A. 2006, A&A, 456, 1045, doi: 10.1051/0004-6361:20040269
- Bohn et al. (2022) Bohn, A. J., Benisty, M., Perraut, K., et al. 2022, A&A, 658, A183, doi: 10.1051/0004-6361/202142070
- Booth et al. (2023) Booth, A. S., Ilee, J. D., Walsh, C., et al. 2023, A&A, 669, A53, doi: 10.1051/0004-6361/202244472
- Booth et al. (2021a) Booth, A. S., van der Marel, N., Leemker, M., van Dishoeck, E. F., & Ohashi, S. 2021a, A&A, 651, L6, doi: 10.1051/0004-6361/202141057
- Booth et al. (2018) Booth, A. S., Walsh, C., Kama, M., et al. 2018, A&A, 611, A16, doi: 10.1051/0004-6361/201731347
- Booth et al. (2021b) Booth, A. S., Tabone, B., Ilee, J. D., et al. 2021b, ApJS, 257, 16, doi: 10.3847/1538-4365/ac1ad4
- Bradley et al. (2022) Bradley, L., Sipőcz, B., Robitaille, T., et al. 2022, astropy/photutils: 1.5.0, 1.5.0, Zenodo, doi: 10.5281/zenodo.6825092
- Brittain et al. (2019) Brittain, S. D., Najita, J. R., & Carr, J. S. 2019, ApJ, 883, 37, doi: 10.3847/1538-4357/ab380b
- Brunken et al. (2022) Brunken, N. G. C., Booth, A. S., Leemker, M., et al. 2022, A&A, 659, A29, doi: 10.1051/0004-6361/202142981
- Cadman et al. (2021) Cadman, J., Rice, K., & Hall, C. 2021, MNRAS, 504, 2877, doi: 10.1093/mnras/stab905
- Charnley (1997) Charnley, S. B. 1997, ApJ, 481, 396, doi: 10.1086/304011
- Cieza et al. (2021) Cieza, L. A., González-Ruilova, C., Hales, A. S., et al. 2021, MNRAS, 501, 2934, doi: 10.1093/mnras/staa3787
- Cleeves et al. (2011) Cleeves, L. I., Bergin, E. A., Bethell, T. J., et al. 2011, ApJ, 743, L2, doi: 10.1088/2041-8205/743/1/L2
- Cleeves et al. (2015) Cleeves, L. I., Bergin, E. A., & Harries, T. J. 2015, ApJ, 807, 2, doi: 10.1088/0004-637X/807/1/2
- Codella et al. (2014) Codella, C., Maury, A. J., Gueth, F., et al. 2014, A&A, 563, L3, doi: 10.1051/0004-6361/201323024
- Currie et al. (2015) Currie, T., Cloutier, R., Brittain, S., et al. 2015, ApJ, 814, L27, doi: 10.1088/2041-8205/814/2/L27
- Currie et al. (2022) Currie, T., Lawson, K., Schneider, G., et al. 2022, Nature Astronomy, 6, 751, doi: 10.1038/s41550-022-01634-x
- Czekala et al. (2021) Czekala, I., Loomis, R. A., Teague, R., et al. 2021, ApJS, 257, 2, doi: 10.3847/1538-4365/ac1430
- Danilovich et al. (2019) Danilovich, T., Richards, A. M. S., Karakas, A. I., et al. 2019, MNRAS, 484, 494, doi: 10.1093/mnras/stz002
- Draine et al. (1983) Draine, B. T., Roberge, W. G., & Dalgarno, A. 1983, ApJ, 264, 485, doi: 10.1086/160617
- Endres et al. (2016) Endres, C. P., Schlemmer, S., Schilke, P., Stutzki, J., & Müller, H. S. P. 2016, Journal of Molecular Spectroscopy, 327, 95, doi: 10.1016/j.jms.2016.03.005
- Facchini et al. (2021) Facchini, S., Teague, R., Bae, J., et al. 2021, AJ, 162, 99, doi: 10.3847/1538-3881/abf0a4
- Fedele et al. (2013) Fedele, D., Bruderer, S., van Dishoeck, E. F., et al. 2013, A&A, 559, A77, doi: 10.1051/0004-6361/201321118
- Fedele et al. (2017) Fedele, D., Carney, M., Hogerheijde, M. R., et al. 2017, A&A, 600, A72, doi: 10.1051/0004-6361/201629860
- Fung & Chiang (2016) Fung, J., & Chiang, E. 2016, ApJ, 832, 105, doi: 10.3847/0004-637X/832/2/105
- Gaia Collaboration et al. (2021) Gaia Collaboration, Brown, A. G. A., Vallenari, A., et al. 2021, A&A, 649, A1, doi: 10.1051/0004-6361/202039657
- Garg et al. (2022) Garg, H., Pinte, C., Hammond, I., et al. 2022, MNRAS, 517, 5942, doi: 10.1093/mnras/stac3039
- Garufi et al. (2022) Garufi, A., Podio, L., Codella, C., et al. 2022, A&A, 658, A104, doi: 10.1051/0004-6361/202141264
- Ginsburg et al. (2023) Ginsburg, A., McGuire, B. A., Sanhueza, P., et al. 2023, ApJ, 942, 66, doi: 10.3847/1538-4357/ac9f4a
- Gratton et al. (2019) Gratton, R., Ligi, R., Sissa, E., et al. 2019, A&A, 623, A140, doi: 10.1051/0004-6361/201834760
- Guilloteau et al. (2016) Guilloteau, S., Reboussin, L., Dutrey, A., et al. 2016, A&A, 592, A124, doi: 10.1051/0004-6361/201527088
- Gusdorf et al. (2008) Gusdorf, A., Pineau Des Forêts, G., Cabrit, S., & Flower, D. R. 2008, A&A, 490, 695, doi: 10.1051/0004-6361:200810443
- Hammond et al. (2023) Hammond, I., Christiaens, V., Price, D. J., et al. 2023, MNRAS, 522, L51, doi: 10.1093/mnrasl/slad027
- Harsono et al. (2021) Harsono, D., van der Wiel, M. H. D., Bjerkeli, P., et al. 2021, A&A, 646, A72, doi: 10.1051/0004-6361/202038697
- Hartquist et al. (1980) Hartquist, T. W., Dalgarno, A., & Oppenheimer, M. 1980, ApJ, 236, 182, doi: 10.1086/157731
- Honda et al. (2012) Honda, M., Maaskant, K., Okamoto, Y. K., et al. 2012, ApJ, 752, 143, doi: 10.1088/0004-637X/752/2/143
- Huang et al. (2023) Huang, J., Bergin, E. A., Bae, J., Benisty, M., & Andrews, S. M. 2023, ApJ, 943, 107, doi: 10.3847/1538-4357/aca89c
- Huang et al. (2018) Huang, J., Andrews, S. M., Dullemond, C. P., et al. 2018, ApJ, 869, L42, doi: 10.3847/2041-8213/aaf740
- Huang et al. (2021) Huang, J., Bergin, E. A., Öberg, K. I., et al. 2021, ApJS, 257, 19, doi: 10.3847/1538-4365/ac143e
- Hunter (2007) Hunter, J. D. 2007, Computing in Science and Engineering, 9, 90, doi: 10.1109/MCSE.2007.55
- Isella et al. (2014) Isella, A., Chandler, C. J., Carpenter, J. M., Pérez, L. M., & Ricci, L. 2014, ApJ, 788, 129, doi: 10.1088/0004-637X/788/2/129
- Jorsater & van Moorsel (1995a) Jorsater, S., & van Moorsel, G. A. 1995a, AJ, 110, 2037, doi: 10.1086/117668
- Jorsater & van Moorsel (1995b) —. 1995b, AJ, 110, 2037, doi: 10.1086/117668
- Kama et al. (2019) Kama, M., Shorttle, O., Jermyn, A. S., et al. 2019, ApJ, 885, 114, doi: 10.3847/1538-4357/ab45f8
- Kanagawa et al. (2015) Kanagawa, K. D., Muto, T., Tanaka, H., et al. 2015, ApJ, 806, L15, doi: 10.1088/2041-8205/806/1/L15
- Karlin et al. (2023) Karlin, S. M., Panić, O., & van Loo, S. 2023, MNRAS, 520, 1258, doi: 10.1093/mnras/stad157
- Keppler et al. (2018) Keppler, M., Benisty, M., Müller, A., et al. 2018, A&A, 617, A44, doi: 10.1051/0004-6361/201832957
- Law et al. (2021) Law, C. J., Loomis, R. A., Teague, R., et al. 2021, ApJS, 257, 3, doi: 10.3847/1538-4365/ac1434
- Lee et al. (2018) Lee, C.-F., Li, Z.-Y., Codella, C., et al. 2018, ApJ, 856, 14, doi: 10.3847/1538-4357/aaae6d
- Leemker et al. (2022) Leemker, M., Booth, A. S., van Dishoeck, E. F., et al. 2022, A&A, 663, A23, doi: 10.1051/0004-6361/202243229
- Ligi et al. (2018) Ligi, R., Vigan, A., Gratton, R., et al. 2018, MNRAS, 473, 1774, doi: 10.1093/mnras/stx2318
- Macías et al. (2019) Macías, E., Espaillat, C. C., Osorio, M., et al. 2019, ApJ, 881, 159, doi: 10.3847/1538-4357/ab31a2
- McMullin et al. (2007) McMullin, J. P., Waters, B., Schiebel, D., Young, W., & Golap, K. 2007, in Astronomical Society of the Pacific Conference Series, Vol. 376, Astronomical Data Analysis Software and Systems XVI, ed. R. A. Shaw, F. Hill, & D. J. Bell, 127
- Mota et al. (2021) Mota, V. C., Varandas, A. J. C., Mendoza, E., Wakelam, V., & Galvão, B. R. L. 2021, ApJ, 920, 37, doi: 10.3847/1538-4357/ac18c5
- Müller et al. (2005) Müller, H. S. P., Schlöder, F., Stutzki, J., & Winnewisser, G. 2005, Journal of Molecular Structure, 742, 215, doi: 10.1016/j.molstruc.2005.01.027
- Müller et al. (2001) Müller, H. S. P., Thorwirth, S., Roth, D. A., & Winnewisser, G. 2001, A&A, 370, L49, doi: 10.1051/0004-6361:20010367
- Nagasawa et al. (2019) Nagasawa, M., Tanaka, K. K., Tanaka, H., et al. 2019, ApJ, 871, 110, doi: 10.3847/1538-4357/aaf795
- Nealon et al. (2019) Nealon, R., Pinte, C., Alexander, R., Mentiplay, D., & Dipierro, G. 2019, MNRAS, 484, 4951, doi: 10.1093/mnras/stz346
- Öberg et al. (2021) Öberg, K. I., Guzmán, V. V., Walsh, C., et al. 2021, ApJS, 257, 1, doi: 10.3847/1538-4365/ac1432
- Osorio et al. (2014) Osorio, M., Anglada, G., Carrasco-González, C., et al. 2014, ApJ, 791, L36, doi: 10.1088/2041-8205/791/2/L36
- Oya et al. (2019) Oya, Y., López-Sepulcre, A., Sakai, N., et al. 2019, ApJ, 881, 112, doi: 10.3847/1538-4357/ab2b97
- Pacheco-Vázquez et al. (2016) Pacheco-Vázquez, S., Fuente, A., Baruteau, C., et al. 2016, A&A, 589, A60, doi: 10.1051/0004-6361/201527089
- Paiva et al. (2020) Paiva, M. A. M., Lefloch, B., & Galvão, B. R. L. 2020, MNRAS, 493, 299, doi: 10.1093/mnras/staa269
- Panić et al. (2008) Panić, O., Hogerheijde, M. R., Wilner, D., & Qi, C. 2008, A&A, 491, 219, doi: 10.1051/0004-6361:20079261
- Pérez et al. (2019) Pérez, S., Casassus, S., Baruteau, C., et al. 2019, AJ, 158, 15, doi: 10.3847/1538-3881/ab1f88
- Perez et al. (2015) Perez, S., Dunhill, A., Casassus, S., et al. 2015, ApJ, 811, L5, doi: 10.1088/2041-8205/811/1/L5
- Pineda et al. (2019) Pineda, J. E., Szulágyi, J., Quanz, S. P., et al. 2019, ApJ, 871, 48, doi: 10.3847/1538-4357/aaf389
- Pinte et al. (2020) Pinte, C., Price, D. J., Ménard, F., et al. 2020, ApJ, 890, L9, doi: 10.3847/2041-8213/ab6dda
- Pinte et al. (2023) Pinte, C., Hammond, I., Price, D. J., et al. 2023, MNRAS, doi: 10.1093/mnrasl/slad010
- Podio et al. (2017) Podio, L., Codella, C., Lefloch, B., et al. 2017, MNRAS, 470, L16, doi: 10.1093/mnrasl/slx068
- Pohl et al. (2017) Pohl, A., Benisty, M., Pinilla, P., et al. 2017, ApJ, 850, 52, doi: 10.3847/1538-4357/aa94c2
- Prasad & Huntress (1980) Prasad, S. S., & Huntress, W. T., J. 1980, ApJS, 43, 1, doi: 10.1086/190665
- Price-Whelan et al. (2018) Price-Whelan, A. M., Sipőcz, B. M., Günther, H. M., et al. 2018, AJ, 156, 123, doi: 10.3847/1538-3881/aabc4f
- Quanz et al. (2013) Quanz, S. P., Avenhaus, H., Buenzli, E., et al. 2013, ApJ, 766, L2, doi: 10.1088/2041-8205/766/1/L2
- Rab et al. (2019) Rab, C., Kamp, I., Ginski, C., et al. 2019, A&A, 624, A16, doi: 10.1051/0004-6361/201834899
- Raman et al. (2006) Raman, A., Lisanti, M., Wilner, D. J., Qi, C., & Hogerheijde, M. 2006, AJ, 131, 2290, doi: 10.1086/500587
- Reggiani et al. (2014) Reggiani, M., Quanz, S. P., Meyer, M. R., et al. 2014, ApJ, 792, L23, doi: 10.1088/2041-8205/792/1/L23
- Rice et al. (2006) Rice, W. K. M., Armitage, P. J., Wood, K., & Lodato, G. 2006, MNRAS, 373, 1619, doi: 10.1111/j.1365-2966.2006.11113.x
- Rich et al. (2022) Rich, E. A., Monnier, J. D., Aarnio, A., et al. 2022, AJ, 164, 109, doi: 10.3847/1538-3881/ac7be4
- Rivière-Marichalar et al. (2020) Rivière-Marichalar, P., Fuente, A., Le Gal, R., et al. 2020, A&A, 642, A32, doi: 10.1051/0004-6361/202038549
- Rosi et al. (2018) Rosi, M., Mancini, L., Skouteris, D., et al. 2018, Chemical Physics Letters, 695, 87, doi: https://doi.org/10.1016/j.cplett.2018.01.053
- Sakai et al. (2014) Sakai, N., Sakai, T., Hirota, T., et al. 2014, Nature, 507, 78, doi: 10.1038/nature13000
- Sakai et al. (2017) Sakai, N., Oya, Y., Higuchi, A. E., et al. 2017, MNRAS, 467, L76, doi: 10.1093/mnrasl/slx002
- Salyk et al. (2013) Salyk, C., Herczeg, G. J., Brown, J. M., et al. 2013, ApJ, 769, 21, doi: 10.1088/0004-637X/769/1/21
- Szulágyi (2017) Szulágyi, J. 2017, ApJ, 842, 103, doi: 10.3847/1538-4357/aa7515
- Szulágyi et al. (2018) Szulágyi, J., Plas, G. v. d., Meyer, M. R., et al. 2018, MNRAS, 473, 3573, doi: 10.1093/mnras/stx2602
- Tabone et al. (2017) Tabone, B., Cabrit, S., Bianchi, E., et al. 2017, A&A, 607, L6, doi: 10.1051/0004-6361/201731691
- Tanaka et al. (2020) Tanaka, K. E. I., Zhang, Y., Hirota, T., et al. 2020, ApJ, 900, L2, doi: 10.3847/2041-8213/abadfc
- Tang et al. (2012) Tang, Y. W., Guilloteau, S., Piétu, V., et al. 2012, A&A, 547, A84, doi: 10.1051/0004-6361/201219414
- Taquet et al. (2020) Taquet, V., Codella, C., De Simone, M., et al. 2020, A&A, 637, A63, doi: 10.1051/0004-6361/201937072
- Teague (2019a) Teague, R. 2019a, Research Notes of the American Astronomical Society, 3, 74, doi: 10.3847/2515-5172/ab2125
- Teague (2019b) —. 2019b, The Journal of Open Source Software, 4, 1632, doi: 10.21105/joss.01632
- Teague (2020) Teague, R. 2020, richteague/keplerian_mask: Initial Release, 1.0, Zenodo, doi: 10.5281/zenodo.4321137
- Teague et al. (2018) Teague, R., Bae, J., Bergin, E. A., Birnstiel, T., & Foreman-Mackey, D. 2018, ApJ, 860, L12, doi: 10.3847/2041-8213/aac6d7
- Teague & Foreman-Mackey (2018) Teague, R., & Foreman-Mackey, D. 2018, Bettermoments: A Robust Method To Measure Line Centroids, v1.0, Zenodo, doi: 10.5281/zenodo.1419754
- Tercero et al. (2011) Tercero, B., Vincent, L., Cernicharo, J., Viti, S., & Marcelino, N. 2011, A&A, 528, A26, doi: 10.1051/0004-6361/201015837
- Toci et al. (2020) Toci, C., Lodato, G., Fedele, D., Testi, L., & Pinte, C. 2020, ApJ, 888, L4, doi: 10.3847/2041-8213/ab5c87
- van der Marel et al. (2021a) van der Marel, N., Booth, A. S., Leemker, M., van Dishoeck, E. F., & Ohashi, S. 2021a, A&A, 651, L5, doi: 10.1051/0004-6361/202141051
- van der Marel et al. (2021b) van der Marel, N., Birnstiel, T., Garufi, A., et al. 2021b, AJ, 161, 33, doi: 10.3847/1538-3881/abc3ba
- van der Velden (2020) van der Velden, E. 2020, The Journal of Open Source Software, 5, 2004, doi: 10.21105/joss.02004
- van der Walt et al. (2011) van der Walt, S., Colbert, S. C., & Varoquaux, G. 2011, Computing in Science and Engineering, 13, 22, doi: 10.1109/MCSE.2011.37
- van Gelder et al. (2021) van Gelder, M. L., Tabone, B., van Dishoeck, E. F., & Godard, B. 2021, A&A, 653, A159, doi: 10.1051/0004-6361/202141591
- van Terwisga et al. (2019) van Terwisga, S. E., van Dishoeck, E. F., Cazzoletti, P., et al. 2019, A&A, 623, A150, doi: 10.1051/0004-6361/201834257
- Velilla-Prieto et al. (2019) Velilla-Prieto, L., Cernicharo, J., Agúndez, M., et al. 2019, A&A, 629, A146, doi: 10.1051/0004-6361/201834717
- Wu et al. (2022) Wu, Y.-L., Bowler, B. P., Sheehan, P. D., et al. 2022, ApJ, 930, L3, doi: 10.3847/2041-8213/ac6420
- Young et al. (2022) Young, A. K., Alexander, R., Rosotti, G., & Pinte, C. 2022, MNRAS, 513, 487, doi: 10.1093/mnras/stac840
- Young et al. (2021) Young, A. K., Alexander, R., Walsh, C., et al. 2021, MNRAS, 505, 4821, doi: 10.1093/mnras/stab1675
- Yu et al. (2021) Yu, H., Teague, R., Bae, J., & Öberg, K. 2021, ApJ, 920, L33, doi: 10.3847/2041-8213/ac283e
- Zanchet et al. (2018) Zanchet, A., Roncero, O., Agúndez, M., & Cernicharo, J. 2018, ApJ, 862, 38, doi: 10.3847/1538-4357/aaccff
- Zhang et al. (2018) Zhang, S., Zhu, Z., Huang, J., et al. 2018, ApJ, 869, L47, doi: 10.3847/2041-8213/aaf744