Improving City Life via Legitimate and Participatory Policy-making: A Data-driven Approach in Switzerland
Abstract.
This paper introduces a novel data-driven approach to address challenges faced by city policymakers concerning the distribution of public funds. Providing budgeting processes for improving quality of life based on objective (data-driven) evidence has been so far a missing element in policy-making. This paper focuses on a case study of 1,204 citizens in the city of Aarau, Switzerland, and analyzes survey data containing insightful indicators that can impact the legitimacy of decision-making. Our approach is twofold. On the one hand, we aim to optimize the legitimacy of policymakers’ decisions by identifying the level of investment in neighborhoods and projects that offer the greatest return in legitimacy. To do so, we introduce a new context-independent legitimacy metric for policymakers. This metric allows us to distinguish decisive vs. indecisive collective preferences for neighborhoods or projects on which to invest, enabling policymakers to prioritize impactful bottom-up consultations and participatory initiatives (e.g., participatory budgeting). The metric also allows policymakers to identify the optimal number of investments in various project sectors and neighborhoods (in terms of legitimacy gain). On the other hand, we aim to offer guidance to policymakers concerning which satisfaction and participation factors influence citizens’ quality of life through an accurate classification model and an evaluation of relocations. By doing so, policymakers may be able to further refine their strategy, making targeted investments with significant benefits to citizens’ quality of life. These findings are expected to provide transformative insights for practicing direct democracy in Switzerland and a blueprint for policy-making to adopt worldwide.
1. Introduction
In liberal democracies, political authority relies on public support. However, Saar (Alon-Barkat and Gilad, 2016) argues that policymakers often suffer from a legitimacy deficit and may seek to mitigate such a deficit through an increased focus on the wishes of the citizenry. To gauge the wishes of the citizenry, in relation to the distribution of a local budget, participatory budgeting has become a popular method. Participatory budgeting may be beneficial for policymakers as it can increase input legitimacy (the exercise of collective self-governance) (Schmidt, 2020; Hänggli et al., 2021).
Many countries, including Poland, Spain, Brazil, Germany, and Switzerland, to name a few, conduct participatory budgeting to ask people to participate in a decision-making process, in which people propose project ideas and vote for the ones that they prefer to be implemented in a city or neighbourhood (Sintomer et al., 2008; Mærøe et al., 2021). However, participatory budgeting is not always feasible or straightforward to apply. It is often a costly and time-consuming process, which has several challenges, such as lack of systematic applicability, limited support and expertise from city staff, and increased participation costs (Pinnington et al., 2009). In addition, without an optimised process, participatory budgeting can lead to citizen’s disappointment and gradual abandonment - as has been observed in Brazil (Bezerra and Junqueira, 2022). Therefore, steps should be undertaken to determine the feasibility of undertaking participatory budgeting within a given locality and to maximize the expected legitimacy returns.
Traditionally, city authorities distribute funds in a top-down manner, determined on the basis of policy priorities (Ljungman, 2009) or popularity/demand of the project(s). Top-down decision making comes with its own challenges. For example, when policy priorities differ to popular demands, policymakers may face a challenge to their output legitimacy (top-down authority may oppose what benefits common good (Schmidt, 2020)).
In this paper, we argue that policymakers can maximize their legitimacy through an informed, data-driven and evidence-based decision-making process, which may offer guidance of when to prioritize participatory interventions and how to optimize investment. To do so, we propose a novel context-independent measure of legitimacy. Policy-makers can utilize our approach to determine the optimal number of project sectors and neighborhoods that guarantees legitimacy improvement. Should funding of the optimal number of project sectors not be available, then a participatory intervention may be beneficial to prioritize.
In addition, policymakers often face the issue of being unable to fulfill the funding demands of citizenry. In such circumstances, spending prioritization can be a challenge for policymakers. We address such an issue by providing policymakers guidance regarding the type of project sectors that have the greatest impact on citizens’ quality of life. To do so, we present a classification model to identify and explain which participation and satisfaction (independent variables) lead to an improvement in citizens’ overall quality of life (dependent variable), and conduct an analysis of which public services citizens place importance on when relocating. Our approach should provide the local authorities guidance regarding the allocation of public spending, offering a blueprint for legitimate targeted investments.
To summarize, the new findings from this paper are invaluable for city authorities to prioritize participatory approaches (e.g. participatory budgeting) with the highest positive impact on legitimacy. These findings are extracted by analysing a high-quality survey from the city of Aarau in Switzerland with 1,204 participants using advanced machine learning methods.
As a summary, this paper addresses the following research questions:
-
•
RQ1: How to prioritize bottom-up participatory interventions to improve legitimacy of policy-making?
-
•
RQ2: Which indicators of satisfaction and participation explain citizens’ overall quality of life?
-
•
RQ3: Are citizens’ relocation to different neighbourhoods associated with quality of life improvements?
The contributions of this paper are summarized as follows:
-
•
A context-independent metric to measure the legitimacy of allocating funds to different projects/sectors and neighborhoods.
-
•
An optimization heuristic to select a sufficient number of popular project sectors to fund so that legitimacy improves before saturation.
-
•
A classification model, linked to legitimacy, that explains which satisfaction and participation factors improve the overall citizens’ quality of life.
-
•
Metrics for the improvement of quality of life as a result of citizens’ neighbourhood relocations within a city.
-
•
A case study for the city of Aarau in Switzerland, whose findings provide a blueprint for designing and running a novel participatory budgeting campaign.
-
•
An open dataset (Wellings et al., 2023) based on the survey data collected and the analysis performed.
2. Related Literature Review
In this section, we offer an overview of related literature, with a focus on quality of life and public budgeting. In doing so, we also consider the role of political legitimacy. Political legitimacy is a relatively ambiguous term (Buchanan, 2002), which falls into what Gaille outlined as an essentially contested concept (Gaille, 1955). In general, legitimacy can be understood as an assumption that the actions and decisions made are desirable, acceptable, or proper within a system which is socially connected by beliefs, norms, and values (Suddaby et al., 2017). The scope of the empirical measurements of this paper focus on normative measurements of legitimacy (Peter, 2017; Andersen, 2012; Hänggli et al., 2021).
Quality of life has a demonstrated link with legitimacy for policymakers (Bay, 1968; Hanberger, 2003). However, Leanard (Leonard, 2009) highlights how quality of life alone is not enough to lead to positive assessments of the local authority. Namely, even when citizens are satisfied with public services (that may be used as an indicator for quality of life), there is still the possibility to hold a negative attitude towards policymakers, bringing into question policymakers’ legitimacy. It has been demonstrated that participatory interventions may aid in increasing the legitimacy of the local authority, the quality of life for citizens and satisfaction with the political processes (Swaner, 2017). In addition, participatory budgeting has a demonstrated link with a decrease in hostility from the public (Magliacani, 2020). In this sense, both quality of life metrics and the decision-making process require attention by policymakers. To determine quality of life, we use satisfaction and participation data, which allows for informed investment within particular sectors. Here, we offer a basis for our approach, considering previous literature.
Deniz et al. (Sahin et al., 2019) examined the relationship between quality of life, satisfaction with life and multidimensional perceived social support in people aged 65 years and older. Importantly, Deniz et al. demonstrate a moderate correlation between quality of life and satisfaction, which may offer support for our decision to explore the satisfaction of public services and quality of life within our paper. In addition, research has pointed to social factors, that we have also incorporated into our measurement (through participation data). For example, Medvedev et al. (Medvedev and Landhuis, 2018) studied the relationship between happiness, subjective well-being, and quality of life, and found that social relationships and environmental factors impact quality of life. In addition, Macke et al. (Macke et al., 2018) conducted interviews of 400 residents of Curitiba, a city in Southern Brazil, to investigate the major elements behind people’s satisfaction with their city. Notably, they find that socio-structural relations, environmental well-being, material well-being and community integration can have an impact on quality of life.
Our decision to explore relocation as a factor that may impact quality of life is supported by the findings of Morris et al. (Morris, 2019) and Wong (Wong, 2001). Specifically, Morris et al. (Morris, 2019) conducted a study on the emotional satisfaction by comparing the residence in principal city and suburbs, finding that geographical location may impact a citizen’s quality of life. Moreover, Wong (Wong, 2001) compared traditional quality of life measurements against location in relation to citizens perceptions of local economic development, finding that location was considered to be a significant factor. In our paper, we have explored intra-city relocation (the movement of citizens from one neighborhood of Aarau to another). In doing so, we are able to explore the improvement or deterioration of satisfaction with the sectors identified as an indicator of a citizen’s quality of life.
3. Methodology
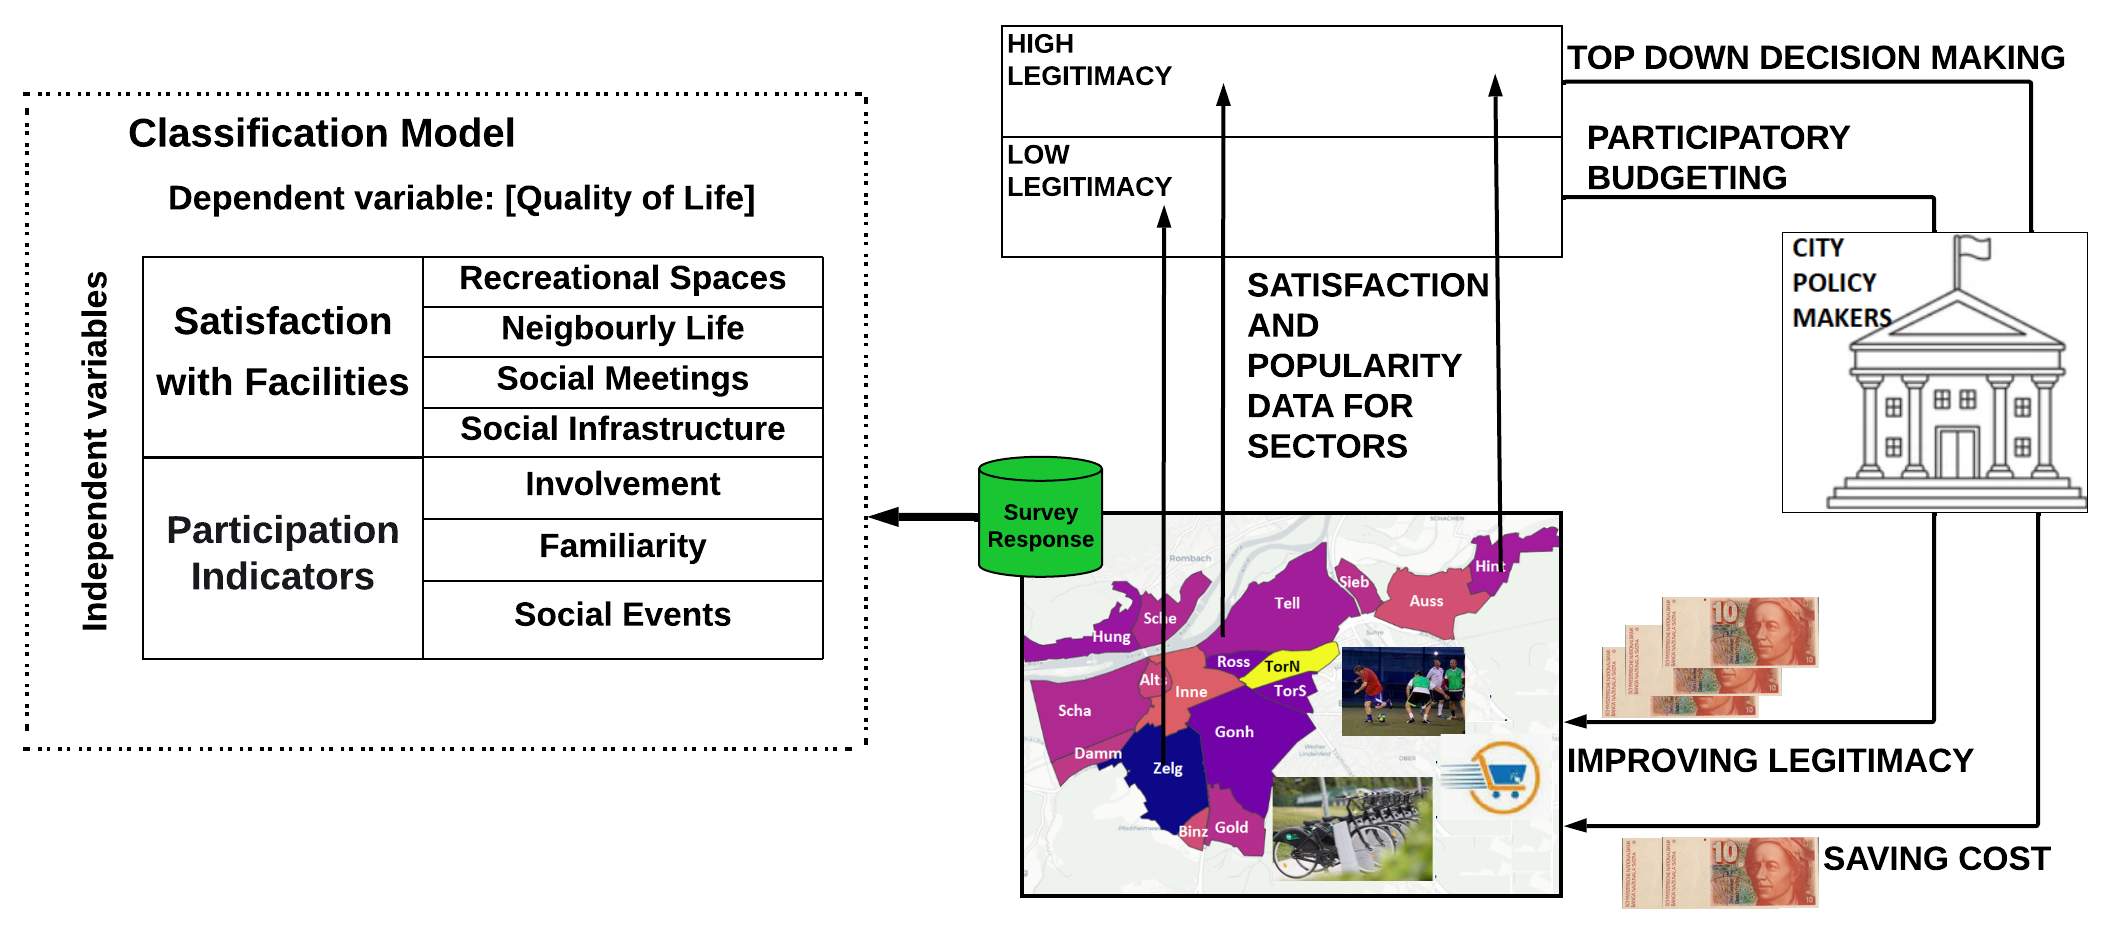
In this section, we first introduce the dataset, which has been made publicly available (Wellings et al., 2023). Later on we present an approach to answer the research questions formulated in Section 1. The proposed data-driven policy-making model for legitimacy is outlined in Fig. 1.
3.1. Dataset
The dataset is derived from an online survey conducted in Aarau, Switzerland, on behalf of the local authority between 18 March and 24 April 2020, see (Wellings et al., 2023). The survey was open to the 22,032 citizens of Aarau, and 1,204 usable responses were collected. The questionnaire featured a combination of open-ended and closed-ended (multiple-choice and Likert scale) questions. The survey included questions related to demographics, quality of life, neighborhoods, socializing/networking, and mobility. Additionally, participants were asked to propose project ideas they would like to see implemented in their neighborhoods (detailed information on the questions is provided in Table 1). Representing 17 different neighborhoods in Aarau, the respondents comprised 548 males, 534 females, 8 individuals with unspecified gender, and 114 who chose not to disclose their gender.
3.2. Factors measuring legitimacy
There is a need for policymakers to empirically assess the legitimacy of their decision making within different contexts. This is particularly true for the practice of participatory budgeting, as achieving legitimacy is one of the main goals of this type of process. Therefore, in this section, we present legitimacy as a factor to distinguish between neighbourhoods and projects that have decisive and indecisive preferences, which can aid in optimising the participatory budgeting process.
Inspired by a metric of dispersion in power systems (load factor) that measures power peak load, which can yield blackouts (Nambi et al., 2016; Mashlakov et al., 2021), we introduce an extended and inverse version of this metric in Eq. 1 to calculate the legitimacy of selecting the top-k project sector(s) or neighborhoods to fund:
| (1) |
In the equation, represents the total number of preferred project proposals or neighborhoods related to chosen project sector(s) or neighborhoods to do investment in. The project sectors are derived from Question 26 in Table 1. The is the mean value of the number of the project sectors or neighborhoods respectively.
Intuitively, the legitimacy metric calculates how well the top-k project sectors or neighborhoods represent a strong majority, i.e. how steep the peak of the top-k projects sectors are. For instance, when the population is indecisive, the top-k project sectors do not distinguish well from the rest of the project sectors; as a result, investing in them comes with a legitimacy risk by leaving a large portion of the population unsatisfied.
Note that Equation 1 serves two legitimacy use cases: (i) investment prioritization to specific projects for a certain neighborhood and (ii) investment prioritization to specific neighborhoods for a certain project. For instance, in the context of participatory budgeting, the first use case supports the legitimacy of the voting outcomes, while the second one can resolve proportionality challenges (Peters et al., 2021) by determining legitimate neighborhoods where a project should be implemented or voting campaigns can be performed.
3.3. Factors for quality of life and participation to predict satisfaction
| QID | QUESTIONS |
| Dependent Variable | |
| Encoding: 4 (Very Good)—— 3 (Good)—— 2 (Enough)—— 1 (Insufficient) | |
| 1 | Quality of Life in Aarau |
| Independent Variables | |
| Satisfaction Sectors Quality of Life Indicators | |
| Encoding: 5 (Very Satisfied)—— 4 (Satisfied)—— 3 (Neutral)—— 2 (Not Satisfied)—— 1 (Not at All Satisfied) —— 0 (I don’t know) | |
| 2 | Social meetings facilities satisfaction |
| 3 | Neighbourly life satisfaction |
| 4 | Shopping facilities satisfaction |
| 5 | Social infrastructure satisfaction |
| 6 | Housing environment satisfaction |
| 7 | Footpath network satisfaction |
| 8 | Bike path network satisfaction |
| 9 | Public transport satisfaction |
| 10 | Recreational areas satisfaction |
| 11 | Playing facilities satisfaction |
| 12 | Security satisfaction |
| Independent Variables | |
| Participation of citizens in social activities Participation Indicators | |
| Encoding: 4 (Daily)—— 3 (Weekly)—— 2 (Monthly)—— 1 (Less often) —— 0 (I don’t know my neighbours) | |
| 13 | How often did you get involved in your neighbourhood in the last month? |
| 14 | How often do you get in contact with your neighbours? |
| Encoding: 2 (Yes)—— 1 (Maybe) —— 0 (No) | |
| 15 | Would you like to get more involved in your neighbourhood? |
| 16 | Do you wish there was more neighbourly contact? |
| 17 | Would you like increased sharing offers in your neighbourhood? |
| Encoding: 2 (High)—— 1 (Medium) —— 0 (Low) | |
| 18 | How many people do you approximately know in your neighbourhood? |
| Miscellaneous, Demographic | |
| Free Text | |
| 19 | In which neighbourhood do you live? |
| 20 | Did you live in another neighbourhood before? |
| 21 | In which neighbourhood did you live? |
| Encoding: 1 (Alone)—— 2 (Household with Children)—— 3 (Household for two)—— 4 (Shared) | |
| 23 | How do you live? (Household type) |
| Encoding: 1 (Basic Vocational)—— 2 (Compulsory School)—— 3 (higher technical college)—— 4 (University degree) | |
| 24 | What is your highest educational attainment? |
| Encoding: 0 (Not Working)—— 1 (Retired) —— 2 (Part Time)—— 3 (Full Time) | |
| 25 | What is your current employment status? |
| 26 | Project ideas |
The survey in Aarau was designed with questions to extract the satisfaction of people regarding the various project sectors (Question 2-12, Table 1), their social connections and participation within their neighbourhood (Question 13-18, Table 1) along with demographic information such as place of stay, the form of commute, housing conditions, etc. (Question 19 -26, Table 1). Finally, the participants also provide an overall quality of life score.
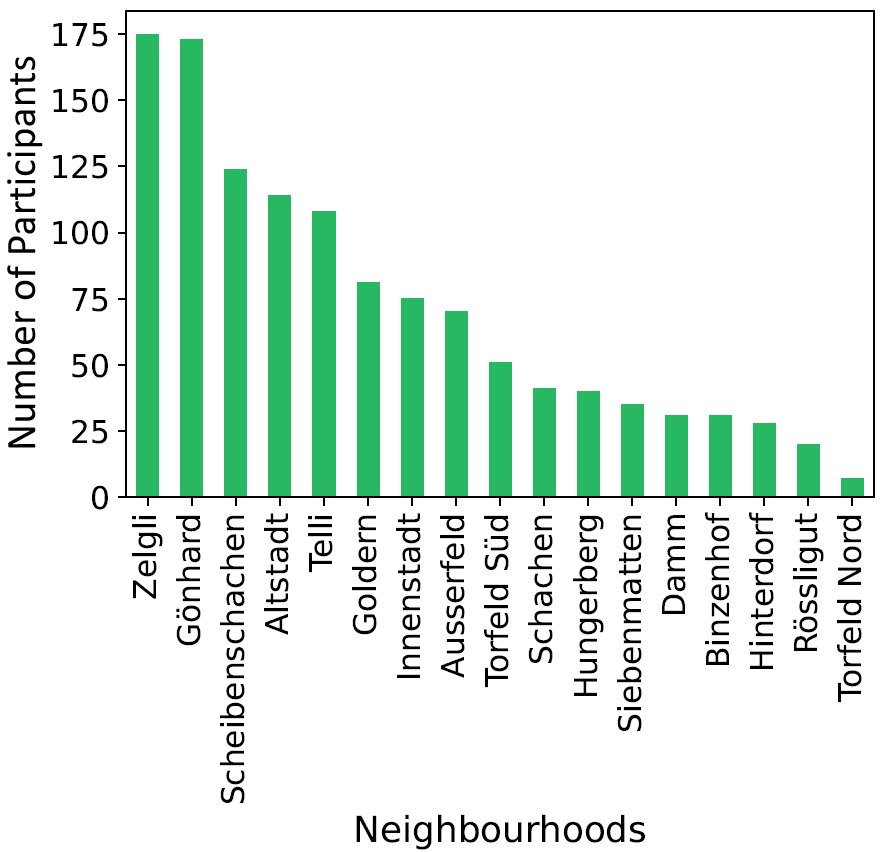
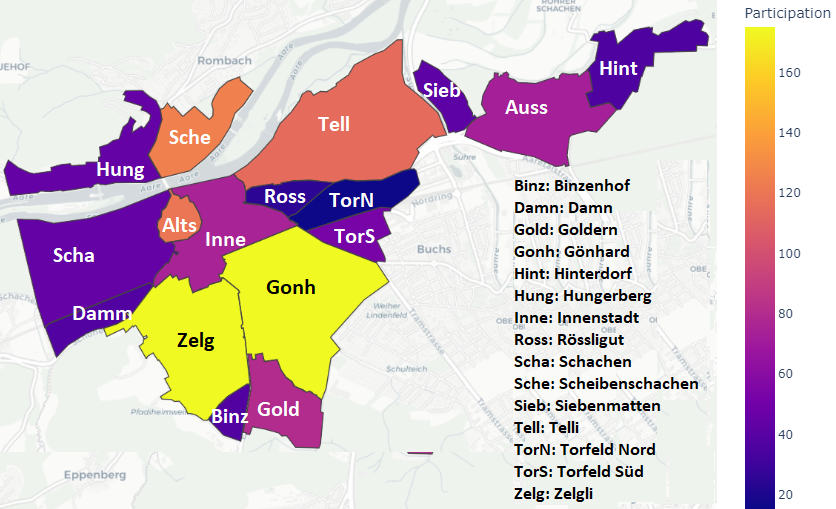
Fig 2 shows that the participation in the survey varied across neighbourhoods. For instance, Zelgi has the highest number of respondents (175 participants) followed by Gönhard (173 participants). In contrast, the neighbourhood Torfeld Nord has the lowest number of participants (7 participants) followed by Rössligut (20 participants) (refer to the map in Fig. 3). Overall, 520 participants marked quality of life in Aarau as ‘Very Good’ and 592 participants marked quality of life as ‘Good’. Only 8 participants marked the quality of life in Aarau as ‘Bad’ whereas 6 participants marked ‘I dont́ know’ as an answer to the question about the quality of life in Aarau.
3.4. Classification model
Dependent and independent variables: We introduce a classification model to explain the people’s perception of the overall quality of life (dependent variable) using the responses in the questions related to their satisfaction in individual project sectors such as shopping facilities, sports infrastructure, recreational spaces, bike path, transport, etc (independent variables). As demonstrated in literature, satisfaction with public facilities is related to perceptions of quality of life (Leonard, 2009; Sirgy et al., 2009). Furthermore, we also use independent variables related to participation such as the people’s participation in community events, neighbourly contacts, etc. Table 1 enumerates the various satisfaction and participation factors we use in the classification model to interpret the overall citizens’ quality of life.
The responses were ordered categorical variables and we encoded them for numerical representation (details of encoding in Table 1). The data was highly imbalanced among the various classes of quality of life and hence we combine responses related to ‘bad’, ‘I dont́ know’ and ‘Insufficient’ as a single class representing perceived quality of life as ‘Insufficient’.
While dealing with ordered categorical variables, an ordinary least squared regression model may yield inaccurate and misleading results. Employing a classification model in a supervised setup (as ground truth is known), we identify the significant independent variables, which may play an important role to predict the overall citizens’ quality of life in Aarau. We are dealing with a total of 17 factors (satisfaction and participation factors), 4 classes and 1,204 data points with highly uneven data distribution among classes. Hence, empirically, we experimented with the logit regression model (Hosmer Jr et al., 2013) and decision tree model (Song and Ying, 2015), however, the results are overfitted and inconclusive. This is because the non-linear relationships between dependent and independent variables need to be projected into a higher dimensional space to extract a better decision boundary so that the dependent variable falls into each of the classes.
We use polynomial approximations for better prediction of probability in multiple classes, and employ support vector machines (Meyer and Wien, 2015) and a 2-layer neural network (Gurney, 2018) for determining the significant independent variables. Both of the models provide higher accuracy and as the data is highly imbalanced among classes, the neural network is superior.
The output probability of a class (i.e. ) is calculated as:
| (2) |
where denotes the input dimension (the factors), denotes total number of learning neurons, , are functions that decide which learning neurons get activated in every layer to analyse and approximate the input data to deduce the probability of being below or at class . The approximation process takes place in two layers. denotes the initial weight (preference) matrices for neurons in every layer.
3.5. Citizens’ relocations for improving quality of life
In this section, we propose a metric to calculate the quality improvement or deterioration (in terms of the satisfaction level of facilities and the services provided in the neighbourhoods) while moving from one neighbourhood to another. Considering a scenario of relocation from a neighbourhood to neighbourhood , the Relative Quality Improvement () is calculated using Equation 3:
| (3) |
In the above equation, represents the mean satisfaction of the project type in the neighbourhood , represents the mean satisfaction of the project type in the neighbourhood , and represents the total number of projects under consideration. Positive represents improvement by the relocation, while the negative represents a deterioration.
Furthermore, we also introduce a metric to measure for each individual and project sector the Perceived Quality Improvement (PQI) by a relocation from the neighbourhood to neighbourhood :
| (4) |
In the above equation, represents people’s mean satisfaction level about project sector in neighbourhood , represents the individual’s satisfaction level about the project type in neighbourhood , and represents people’s mean satisfaction level about the project type in the neighbourhood (neighbourhood from where the person relocated).
RQI measures whether a relocation of an individual improves quality of life based on the satisfaction level of all residents in neighbourhoods, while PQI measures in a more personalized way the perceived improvement in quality of life (relative to the collective one).
4. Evaluation and Results
In this section, we provide the results of the experiments we conducted to answer , and .
4.1. RQ1: How to prioritize bottom-up participatory interventions to improve legitimacy of policy-making?
Our legitimacy calculation offers a solution for policymakers when seeking to optimize decision-making processes. Specifically, it offers guidance regarding which neighborhoods might benefit from participatory interventions to bolster legitimacy. We present our results in Figure 4 to illustrate the legitimacy levels attainable if a specific number of project sectors are funded per neighborhood (). To calculate the optimal-k scores, we compare the potential legitimacy gains as the number of project sector investments increases, identifying the point where the increase in legitimacy begins to decay (using the elbow method to make this determination (Cui et al., 2020)). The optimal-k, represented in Figure 6 as the dotted vertical line within each plot of the neighborhood, can be thought of as the minimum investment for the highest returns. Within this framework, a lower optimal-k score signifies that a local authority can maximize the legitimacy levels with minimal investment. In contrast, a high optimal-k suggests that a local authority shall finance a greater number of project sectors to achieve the highest return in legitimacy (which may be challenging when the authority does not have the funding capacity for such investments). As such, a neighborhood with a higher optimal-k may be deemed suitable for a participatory intervention to compensate for the inability of the local authority to maximize legitimacy returns.
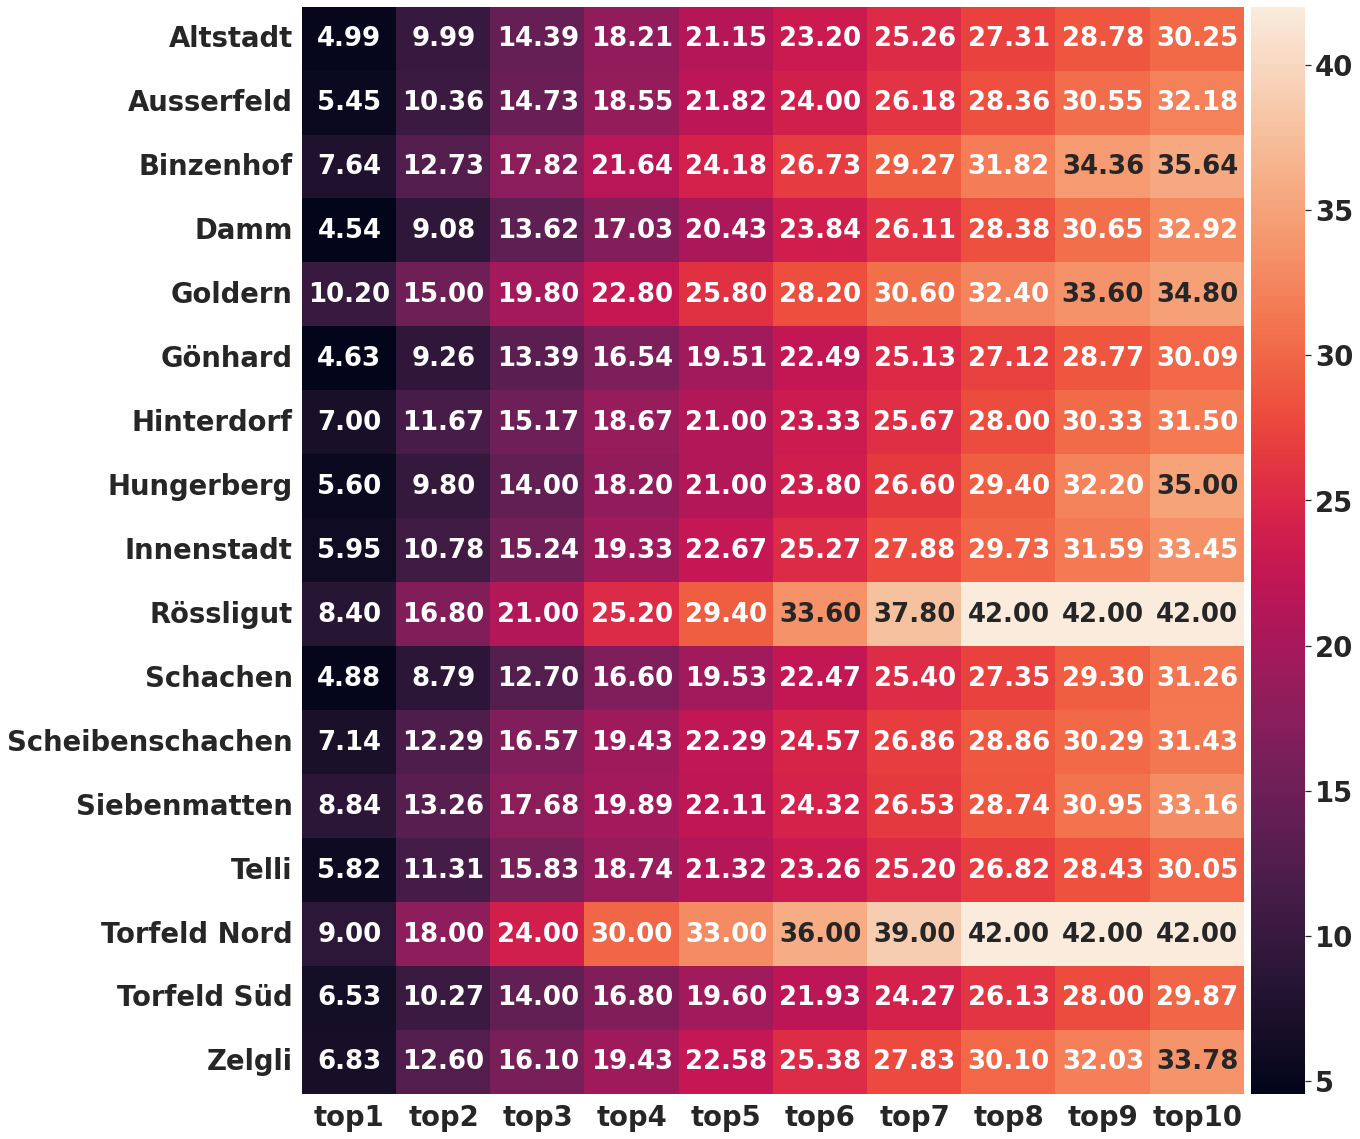
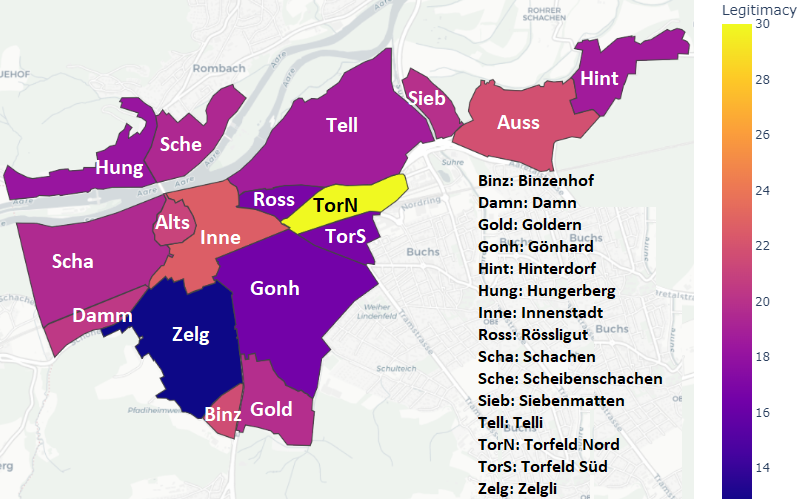
Fig. 6 demonstrates how Altstadt has the highest optimal k-value, suggesting that the minimum investment for the highest return is present when six project sectors are funded. In addition, Scheibenschachen, Goldern, Binzenhof and Ausserfeld have all been determined as optimal at five project sectors. As such, the aforementioned neighborhoods may be considered as the most likely candidates for participatory intervention due to the increased cost associated with the minimum level of investment. Torfeld Nord and Zelgli have the lowest optimal-k value, indicating that a minimum investment in two project sectors yields the highest return. As such, these areas may gain less from participatory interventions, as local authorities can more readily meet funding needs.
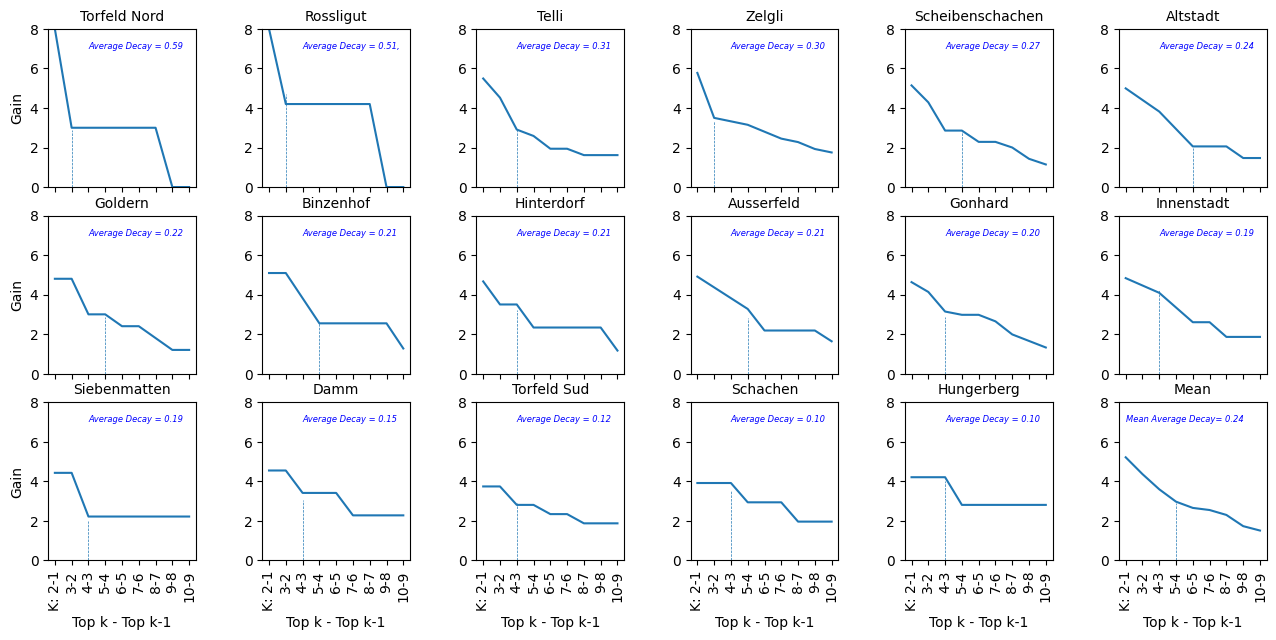
In Fig. 6, we also identify how the legitimacy gain decays as the number of project sectors selected increases. For example, the data suggest that in Rössligut, the legitimacy gain plateaus after funding two sectors, with zero increase beyond eight project sectors. In addition to offering guidance regarding participatory interventions, these findings can inform funding allocation decisions by policy makers, who may choose to redirect resources from areas such as Rössligut to neighbourhoods that see more of a significant increase in legitimacy should more project sectors be funded, such as Damm or Hungerberg. As such, this approach optimizes the allocation of resources to maximize legitimacy outcomes across neighbourhoods.
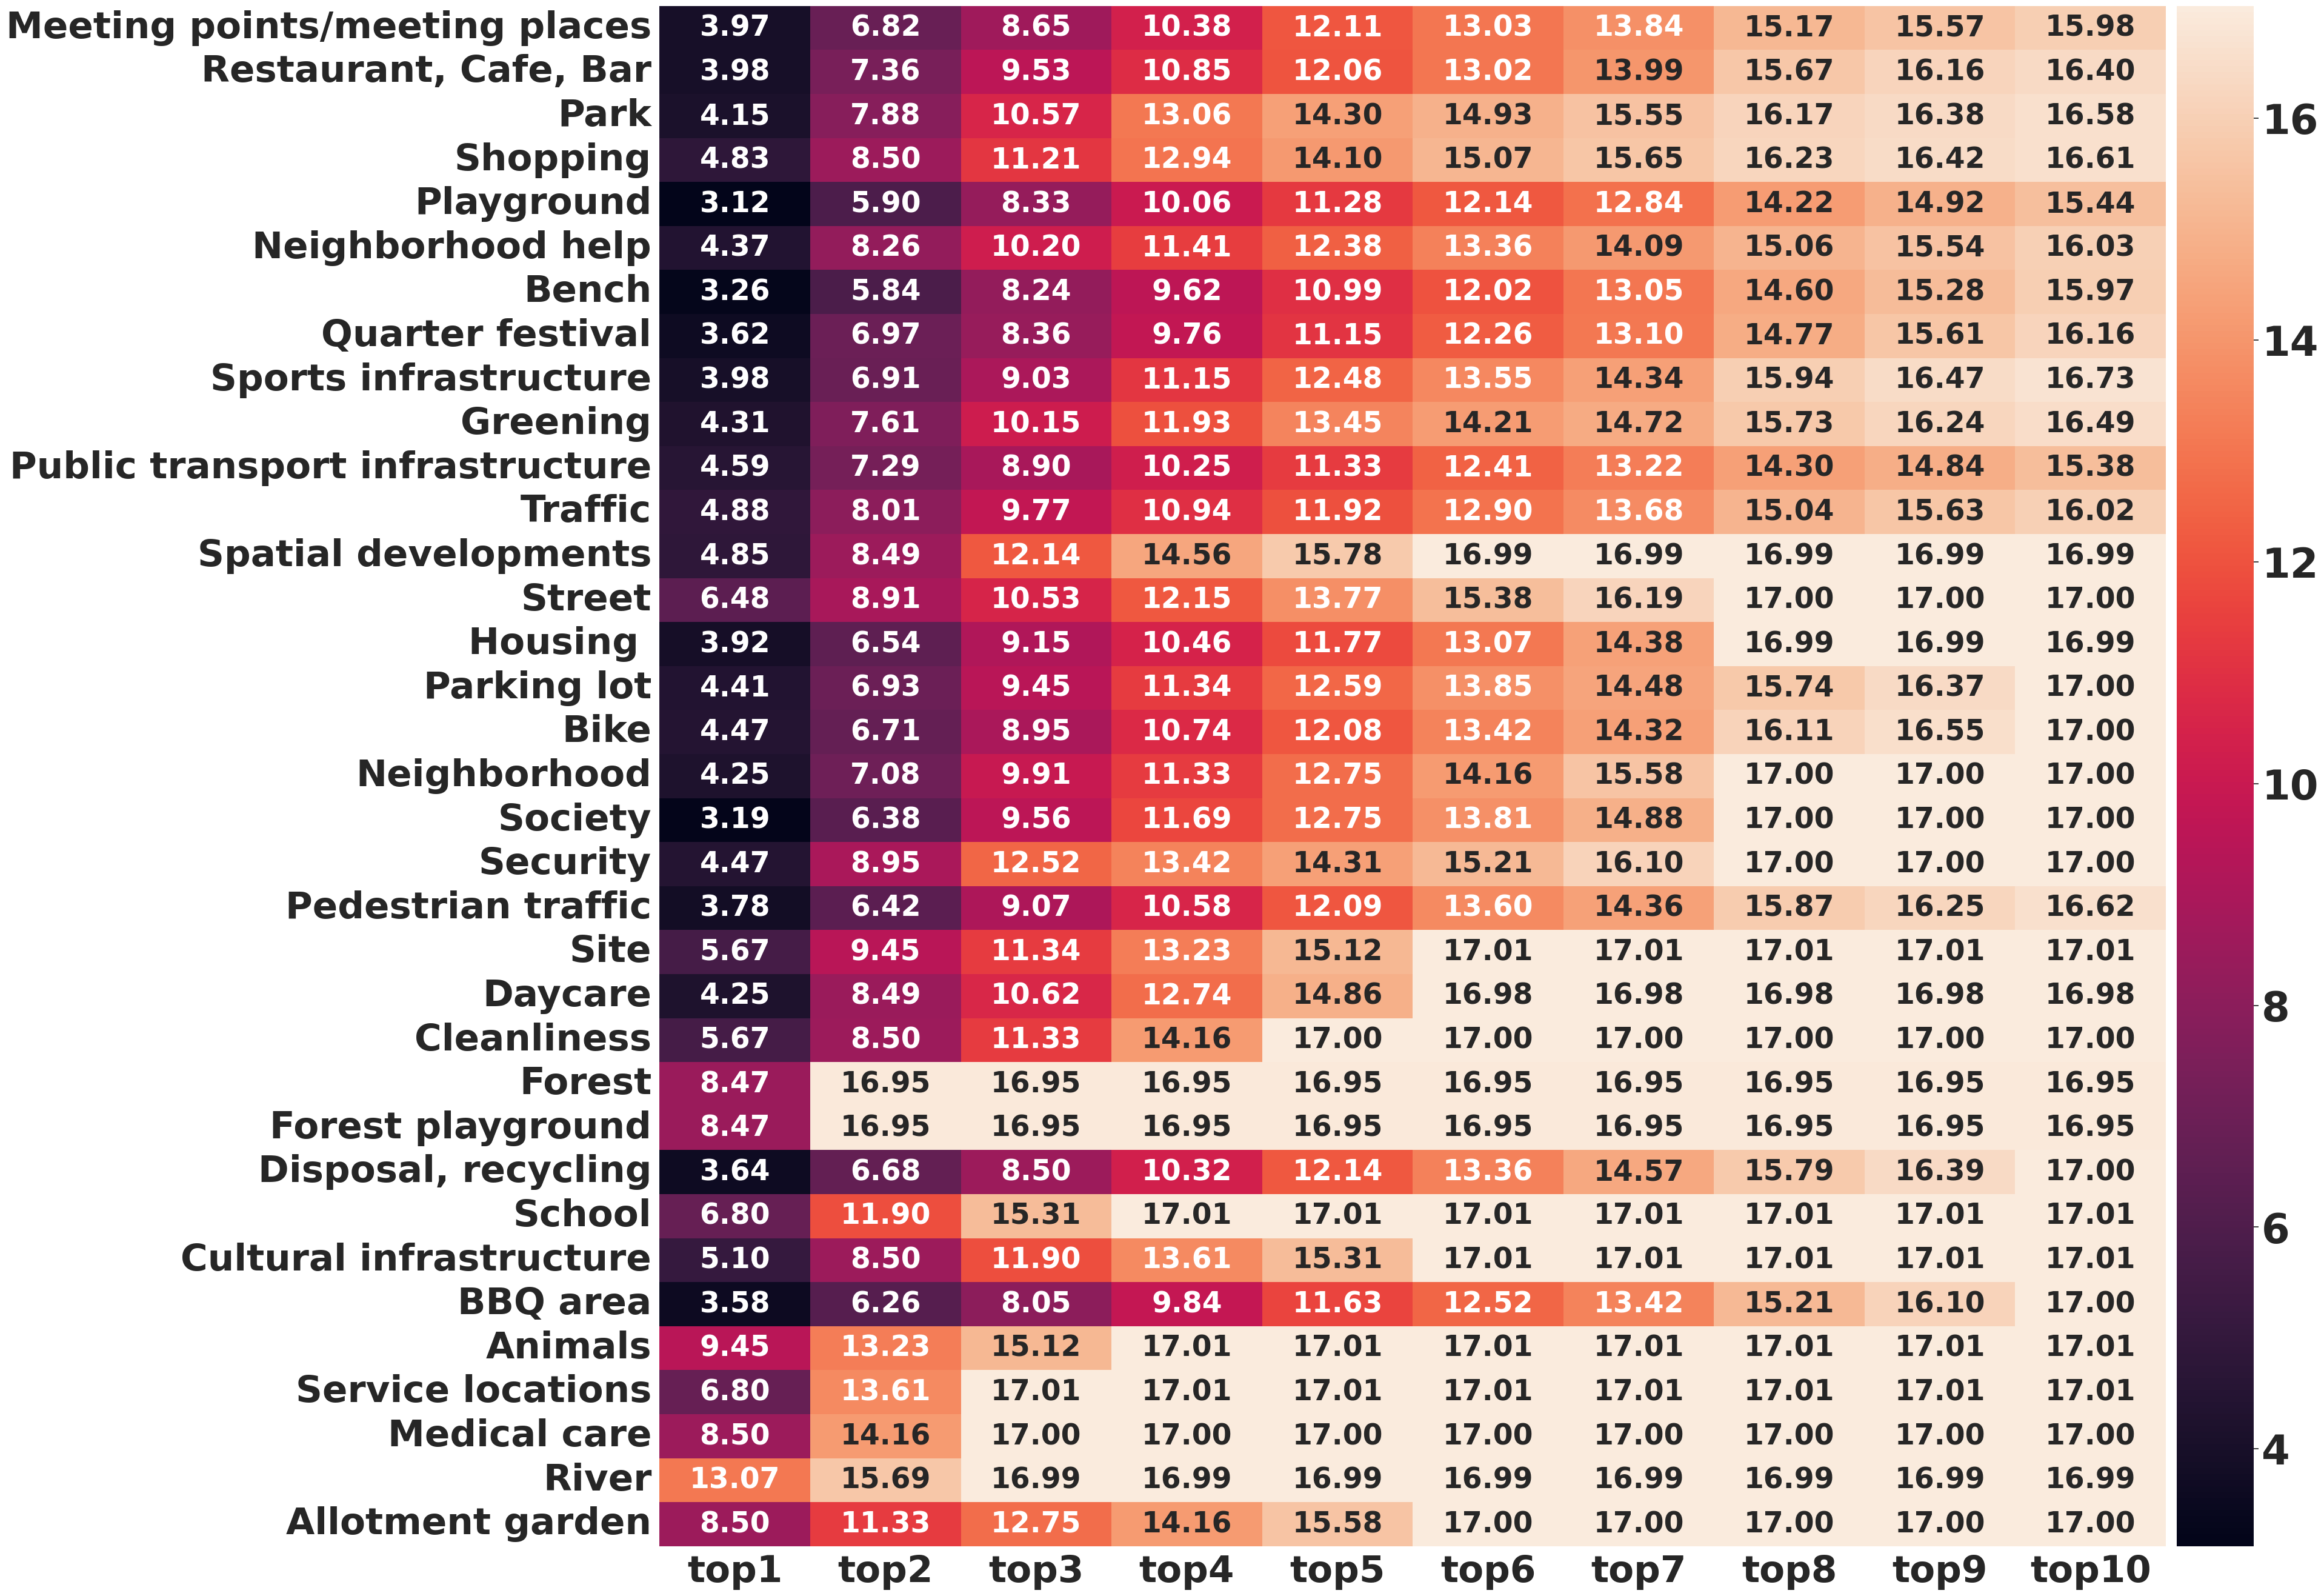
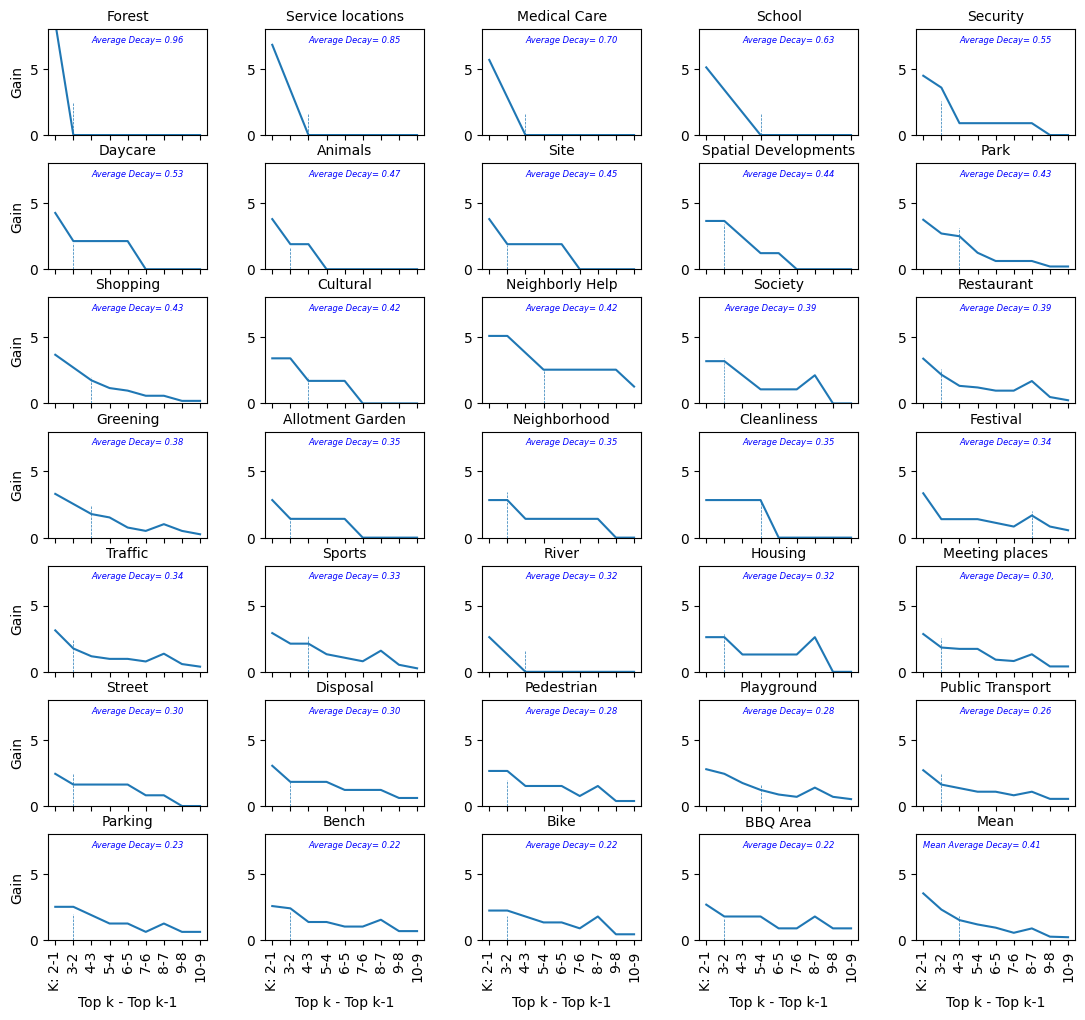
Figure 7 illustrates the legitimacy gain that policymakers could achieve by funding projects across various neighborhoods, providing insights into the optimal number of investments. For instance, investing in ‘Rivers’ within a single neighborhood yields a significant return in legitimacy, with a smaller increase should the authority invest in ‘Rivers’ in two or more neighborhoods. However, if the local authority aims to fund ‘Playgrounds’, our metric suggests that it should do so across a larger number of neighborhoods to maximize legitimacy returns.
Fig. 10 illustrates the specific optimal-k project types per neighborhood with legitimacy gain. It is observed that the optimal-k project sectors in Rössligut is three. Within Rössligut, Fig. 10 demonstrates how the greatest legitimacy gain comes from investments in ‘Parking’, ‘Greening’ and ‘Meeting Places’. Fig. 10 can be beneficial for the design of participatory budgeting, particularly filtering project proposals before the voting procedure. Filtering is a challenge for policymakers (particularly when conducted without bottom-up consultation), as it risks being viewed as a discretionary practice aimed at selecting projects that conform with the authorities preexisting policy direction (Aleksandrov et al., 2018; Allegretti and Antunes, 2014).
In Fig. 8, we move further by identifying the optimal-k investments per project type and the legitimacy decay as the number of neighbourhoods increases. For example, ‘Neighbourly Help’ is optimal to invest on within five neighbourhoods. Further investment in ‘Neighbourly Help’ surpasses the optimal legitimacy point, Fig. 8 demonstrates that the legitimacy return is relatively negligible. Fig. 10 presents the specific optimal-k neighborhoods per project type for legitimacy. For example, we previously determined that the optimal-k investment for ‘Parks’ stood at four neighborhoods. Specifically, in Fig. 10, we can see that the greatest legitimacy gain comes for ’Park’ investments in the locations of Zelgli, Gönhard, Altstadt and Innenstad. We can also distinguish projects, whose legitimacy gain is made by several different neighborhoods such as ‘Cleanness’ and ‘School’ and ‘Neighborhood Festival’.
4.2. RQ2: Which indicators of satisfaction and participation explain citizens’ overall quality of life?
We design a classification model that offers policymakers further guidance regarding the type of investment that benefits citizens quality of life. As the data is highly imbalanced within classes, we employ sampling to create synthetic data for minority classes. We use the method proposed in (Chawla et al., 2002) to join minority class data points with their nearest neighbours and use various distance functions to generate additional data points. We demonstrate the accuracy obtained for predicting the significant independent variables in Table 3. We achieve an overall accuracy of 74.3% with synthetic sampling data, considering all satisfaction and participation factors. This is significantly higher than the dataset without sampling. The satisfaction factors have a higher impact and are more significant in predicting quality of life than participation factors.
| Project sectors | Ranking | Optimal Legitimacy Gain [%] | Classification model p-values |
|---|---|---|---|
| Social Facilities / Meetings | 1 | 18.13 | 0.019 |
| Recreational Spaces | 2 | 13.8 | 0.001 |
| Playing Facilities | 3 | 10.8 | 0.001 |
| Social Infrastructure | 4 | 13.21 | 0.018 |
| Public Transport | 5 | .05 | 0.358 |
| Shopping Facilities | 6 | .03 | 0.528 |
| Neighbourly Life | 7 | .07 | 0.001 |
All independent variables, neighbourly life, housing environment, footpath network, recreational areas and security, apart from public transport and shopping facilities appear to be significant in terms of their relationship with citizens’ overall quality of life assessment and have p-values lower than 0.05. Using only participation factors does not better predict the quality of life and provides lower accuracy. Combining both factors gives the highest overall performance even though the p values of the participation factors are mostly not significant (i.e ). In Table 2 the ‘Ranking’ column highlights the number of times citizens proposed projects relating to such project sectors (e.g., the highest number of proposals is related to social facilities/meetings). In the ’Optimal Legitimacy Gain [%]’ column, the percentage of such projects is found within the mean optimal k for all neighborhoods, which also validates the ’Ranking’ column. This measurement is beneficial as it may offer guidance for policymakers in terms of the project types that may return the greatest level of legitimacy.
| Dataset | Quality of Life | Satisfaction (S) | Participation (P) | S + P | ||||||
|---|---|---|---|---|---|---|---|---|---|---|
| cross entropy loss, adam optimiser, drop out = 0.5 in last layer, 2 layer dense neural net, Leaky Relu | ||||||||||
| r | p | Acc | r | p | Acc | r | p | Acc | ||
| Without Sampling | 1 (Insufficient) | 0.001 | 0.002 | 0.001 | 0.125 | 0.200 | 0.124 | 1.000 | 0.200 | 1.000 |
| 2 (Enough) | 0.167 | 0.091 | 0.166 | 0.010 | 0.015 | 0.016 | 1.000 | 0.182 | 0.308 | |
| 3 (Good) | 0.520 | 0.731 | 0.512 | 0.507 | 0.694 | 0.506 | 0.576 | 0.769 | 0.659 | |
| 4 (Very Good) | 0.554 | 0.330 | 0.553 | 0.452 | 0.298 | 0.411 | 0.606 | 0.457 | 0.605 | |
| Overall metrics | 0.310 | 0.288 | 0.509 | 0.271 | 0.298 | 0.477 | 0.796 | 0.402 | 0.592 | |
| Synthetic Data - Over Sampling | 1 (Insufficient) | 0.897 | 0.953 | 0.891 | 0.937 | 0.922 | 0.999 | 1.000 | 0.953 | 0.999 |
| 2 (Enough) | 0.875 | 0.824 | 0.872 | 0.782 | 0.632 | 0.781 | 0.894 | 0.868 | 0.893 | |
| 3 (Good) | 0.674 | 0.496 | 0.671 | 0.529 | 0.584 | 0.523 | 0.626 | 0.776 | 0.624 | |
| 4 (Very Good) | 0.551 | 0.724 | 0.552 | 0.500 | 0.505 | 0.502 | 0.650 | 0.495 | 0.656 | |
| Overall Metric | 0.749 | 0.749 | 0.704 | 0.687 | 0.661 | 0.630 | 0.792 | 0.773 | 0.748 | |
| r: Recall (%); p: Precision(%); Acc: Accuracy (%) | ||||||||||
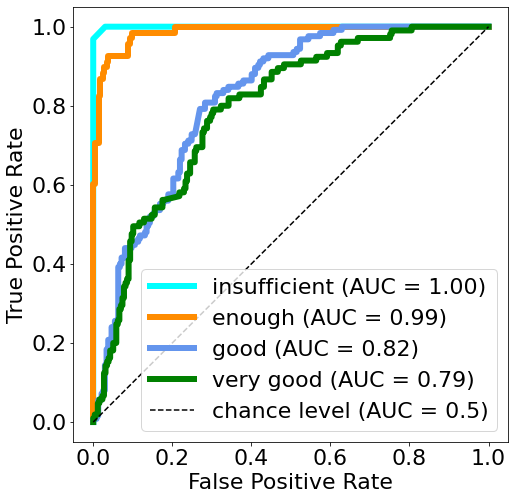
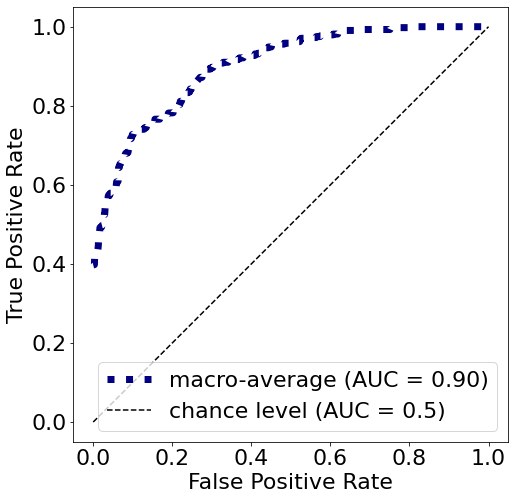
In Figures 11 and 12, we show the relation of the true and false positives ratios for the prediction model with which we obtain the highest accuracy. The Area Under the Curve (AUC) metric helps to understand the probability of correct prediction of a data point to its true class and we see that the AUC is higher for the classes ‘Insufficient’ and ‘Enough’ (see classwise AUC in Figure 11), however, the average AUC is 0.90 (Figure 12) and hence we can conclude that the satisfaction factors can significantly help in estimating the overall citizens’ quality of life.
4.3. RQ3: Are citizens’ relocation to different neighbourhoods associated with quality of life improvements?
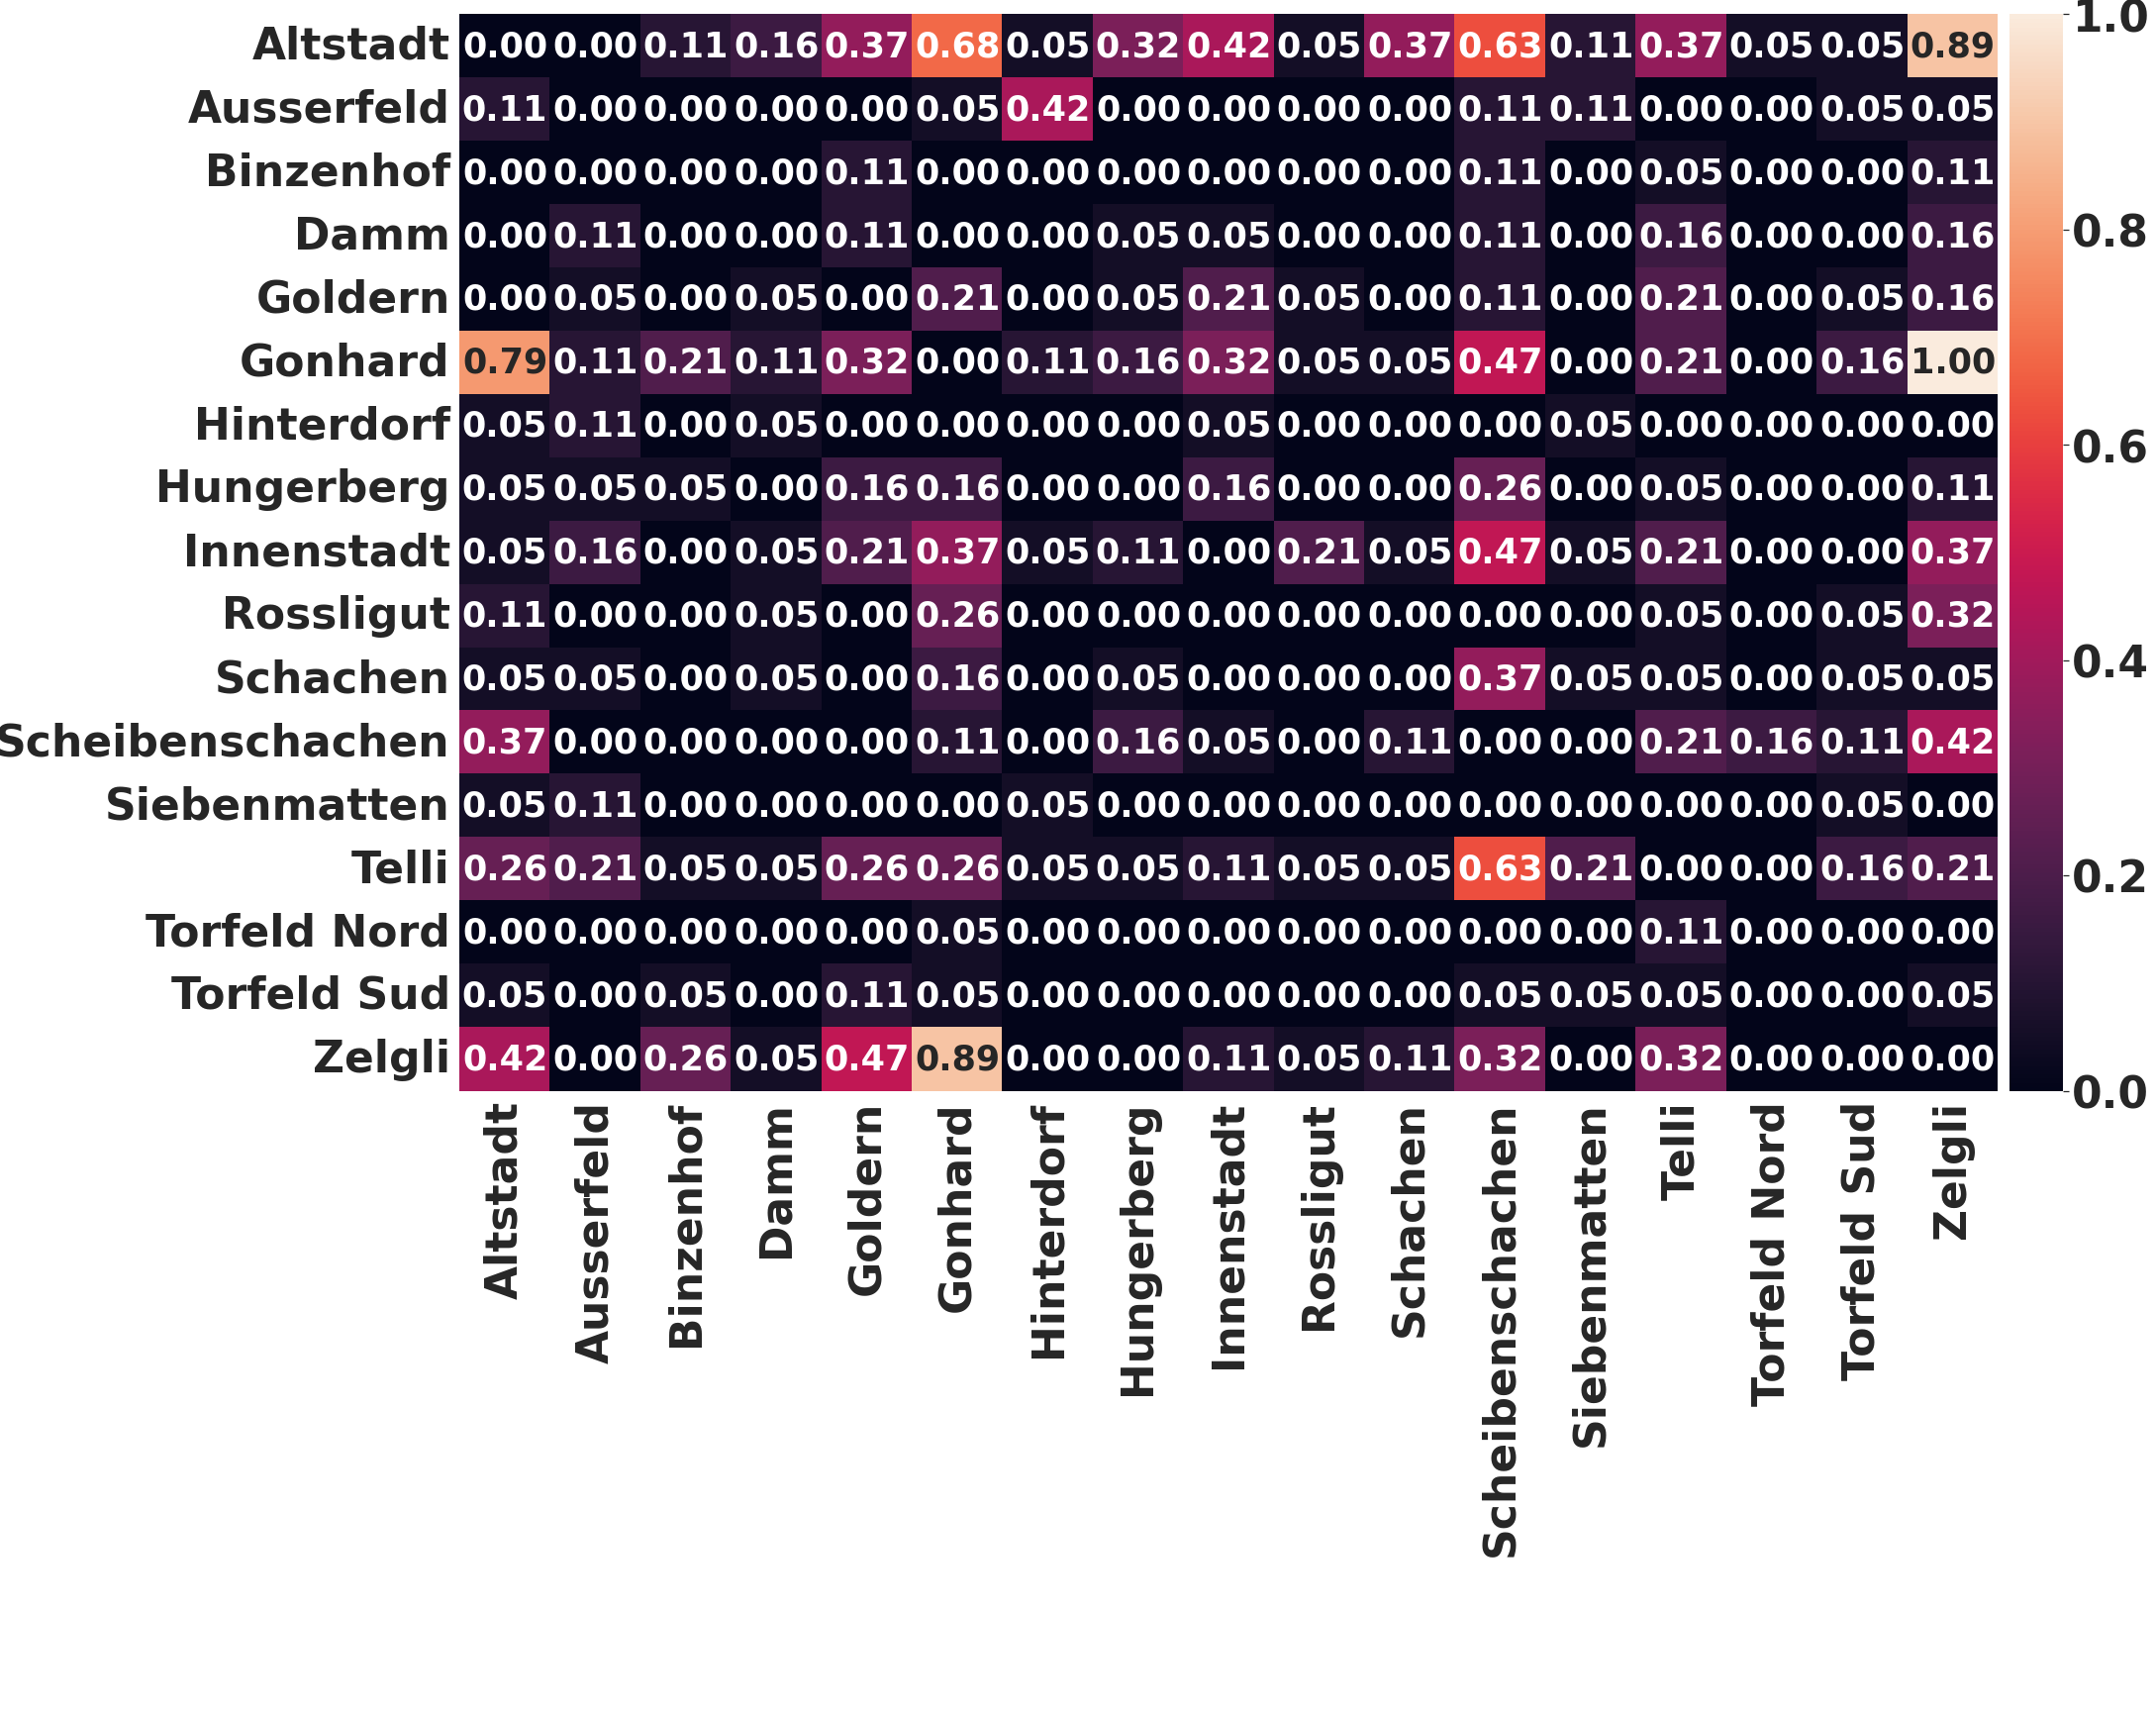
To answer RQ3 we calculate the relocation probability (max-min normalized values) from one neighbourhood to another in Fig. 13. There has been 19 migrations from Gonhard to Zelgli, which is the highest and also signifies the most likely migration people in Aarau can undertake. On the other hand migrations between some localities are very less, and often we find a singular instance.
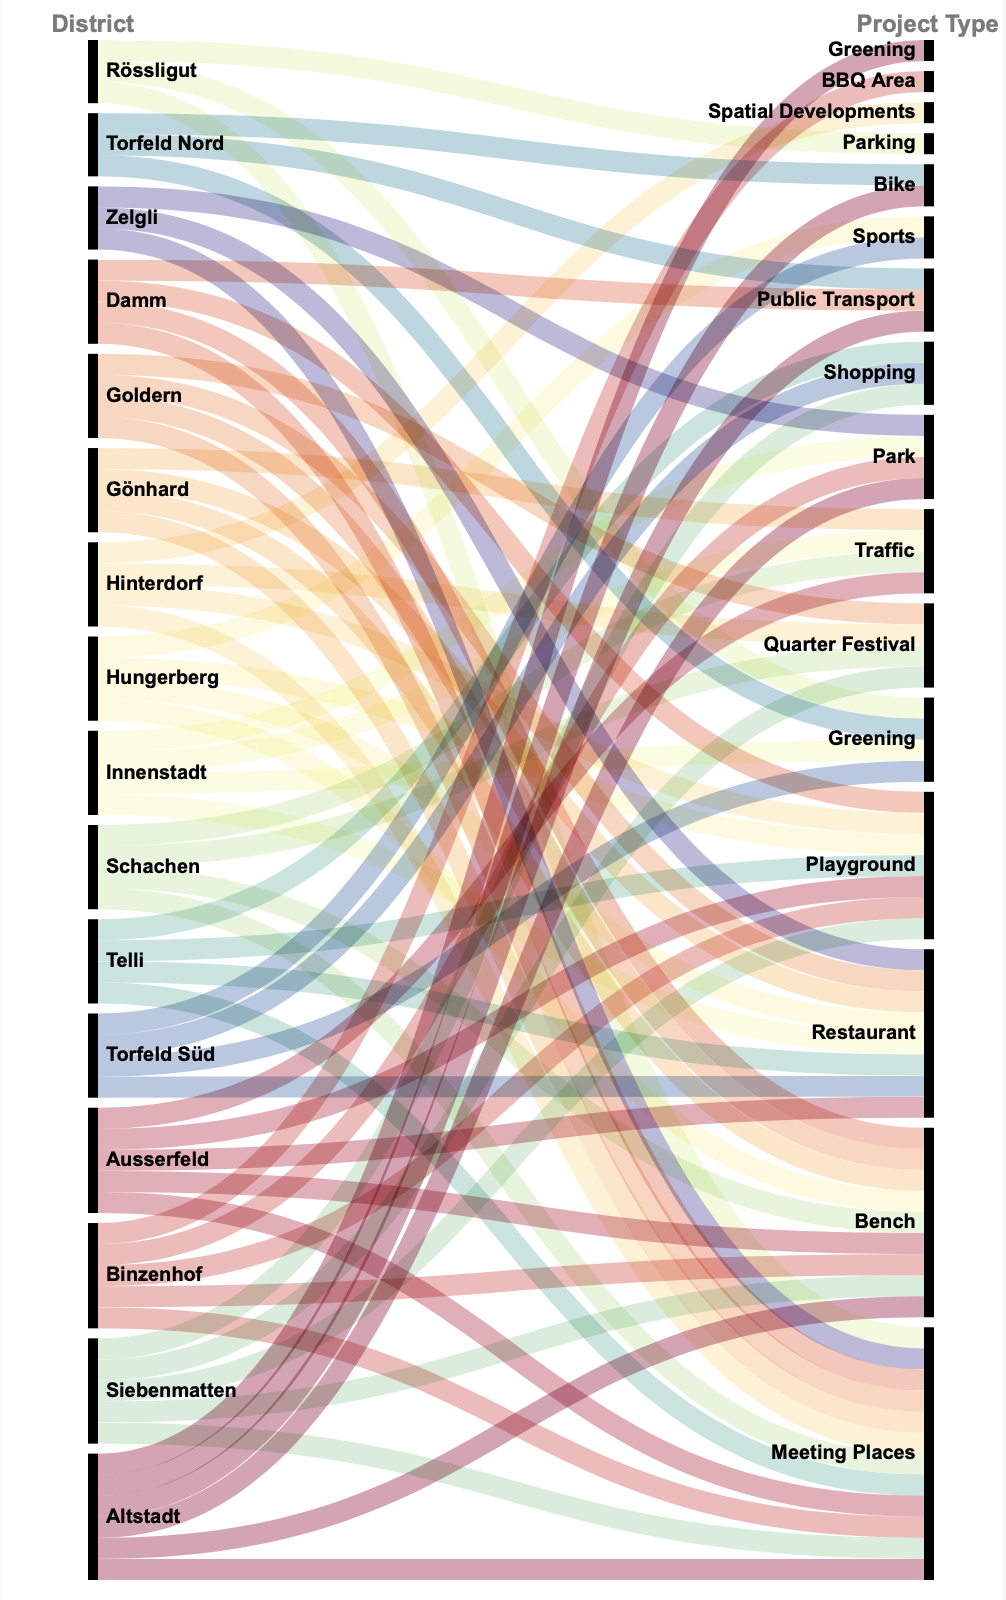
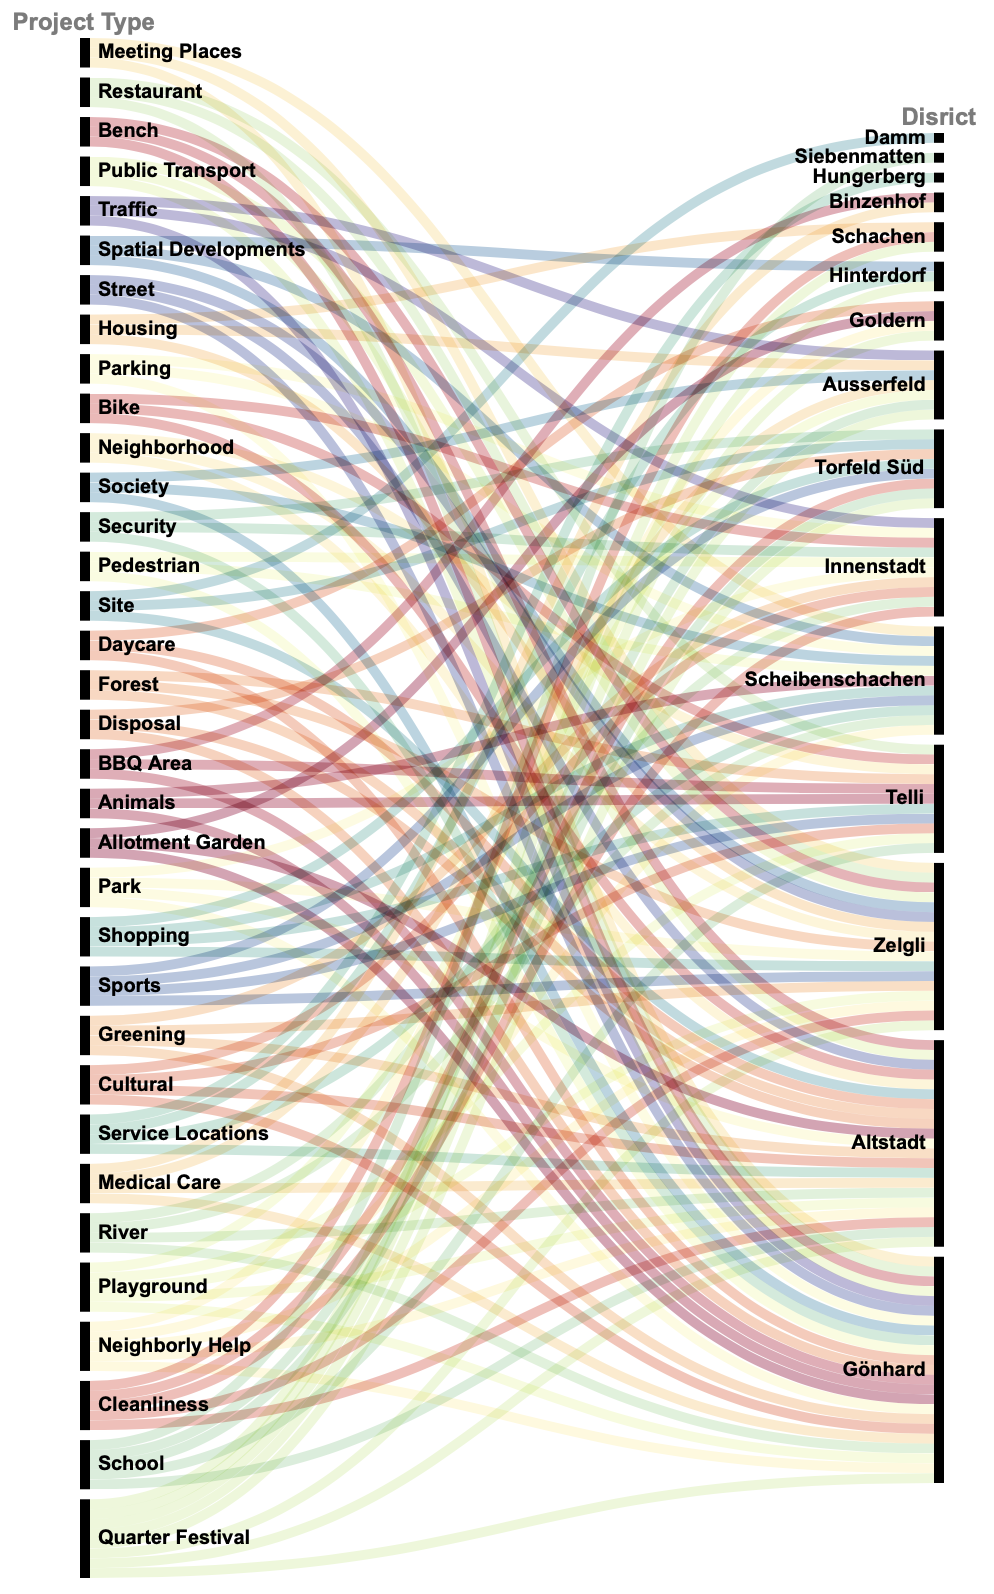
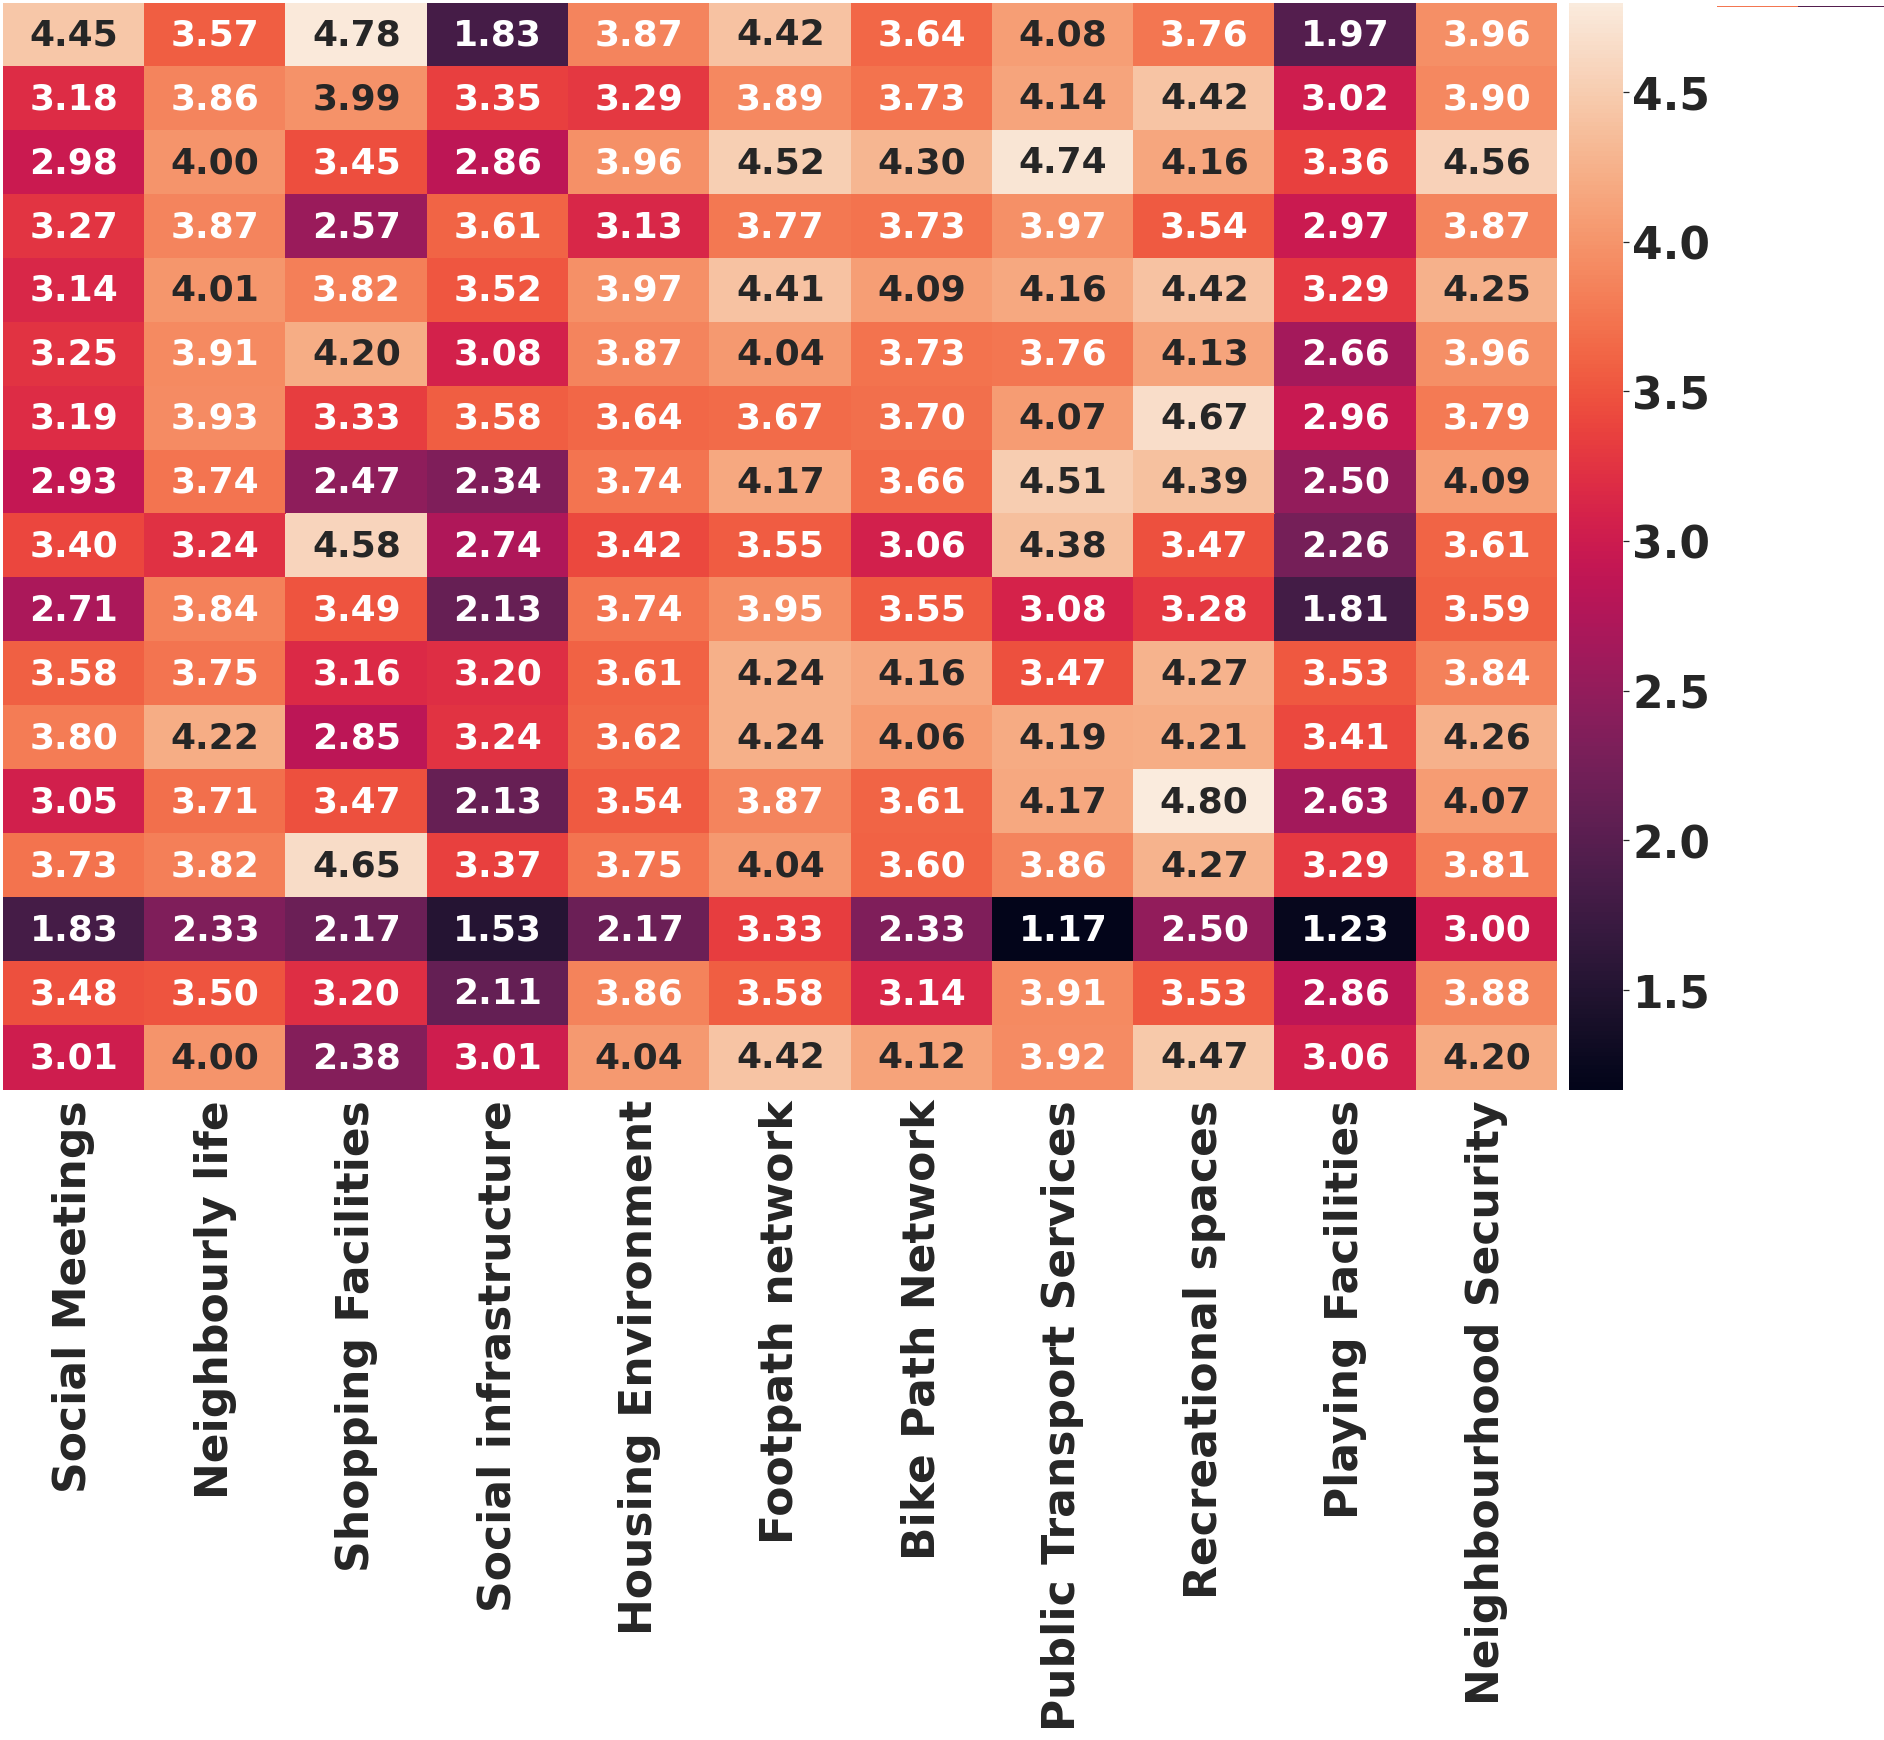
Specifically, we investigate which project sectors citizens compromise on and which ones improve by relocating to a new neighbourhood, which can aid policymakers in understanding the value placed on project sectors during relocations. To do so, for each observed relocation, we calculate the overall and the for each project sector using the mean satisfaction level about the project sectors (Fig. 14). A positive value indicates a quality of life improvement based upon relocation, while a negative value indicates a deterioration.
The order of relocations within Figure 15 is ranked by their likelihood of occurrence. For example, Fig. 13 outlines the most frequent relocation is from Gonhard to Zelgli, which has a normalized value of 1.00. We can see that the greatest improvement in overall comes with relocations from Innenstadt to Scheibenschachen. When we look, specifically, at the scores for each project sector, we can see there is a significant decrease in the score for shopping facilities (-0.6) and a small decrease in public transport services (-0.05), which corresponds with the type of facilities present within these neighborhoods (qua, 2020). However, there is an increase in in all other metrics, with the most significant increase coming in playing facilities (0.34), which seems to correspond with an increased number of playing facilities within the neighborhood of Scheibenschachen (qua, 2020). The most significant deterioration in is found in relocations from Scheibenschachen to Altstadt (which is the centre of Aarau). In some sense, this is relatively surprising, as Altstadt can be seen as having the most comprehensive level of public facilities (qua, 2020). There is an increase in shopping facilities (0.4), however, there is also a significant decrease in playing facilities (-0.73), which corresponds to the type of facilities in both Scheibenschachen and Altstadt (qua, 2020).
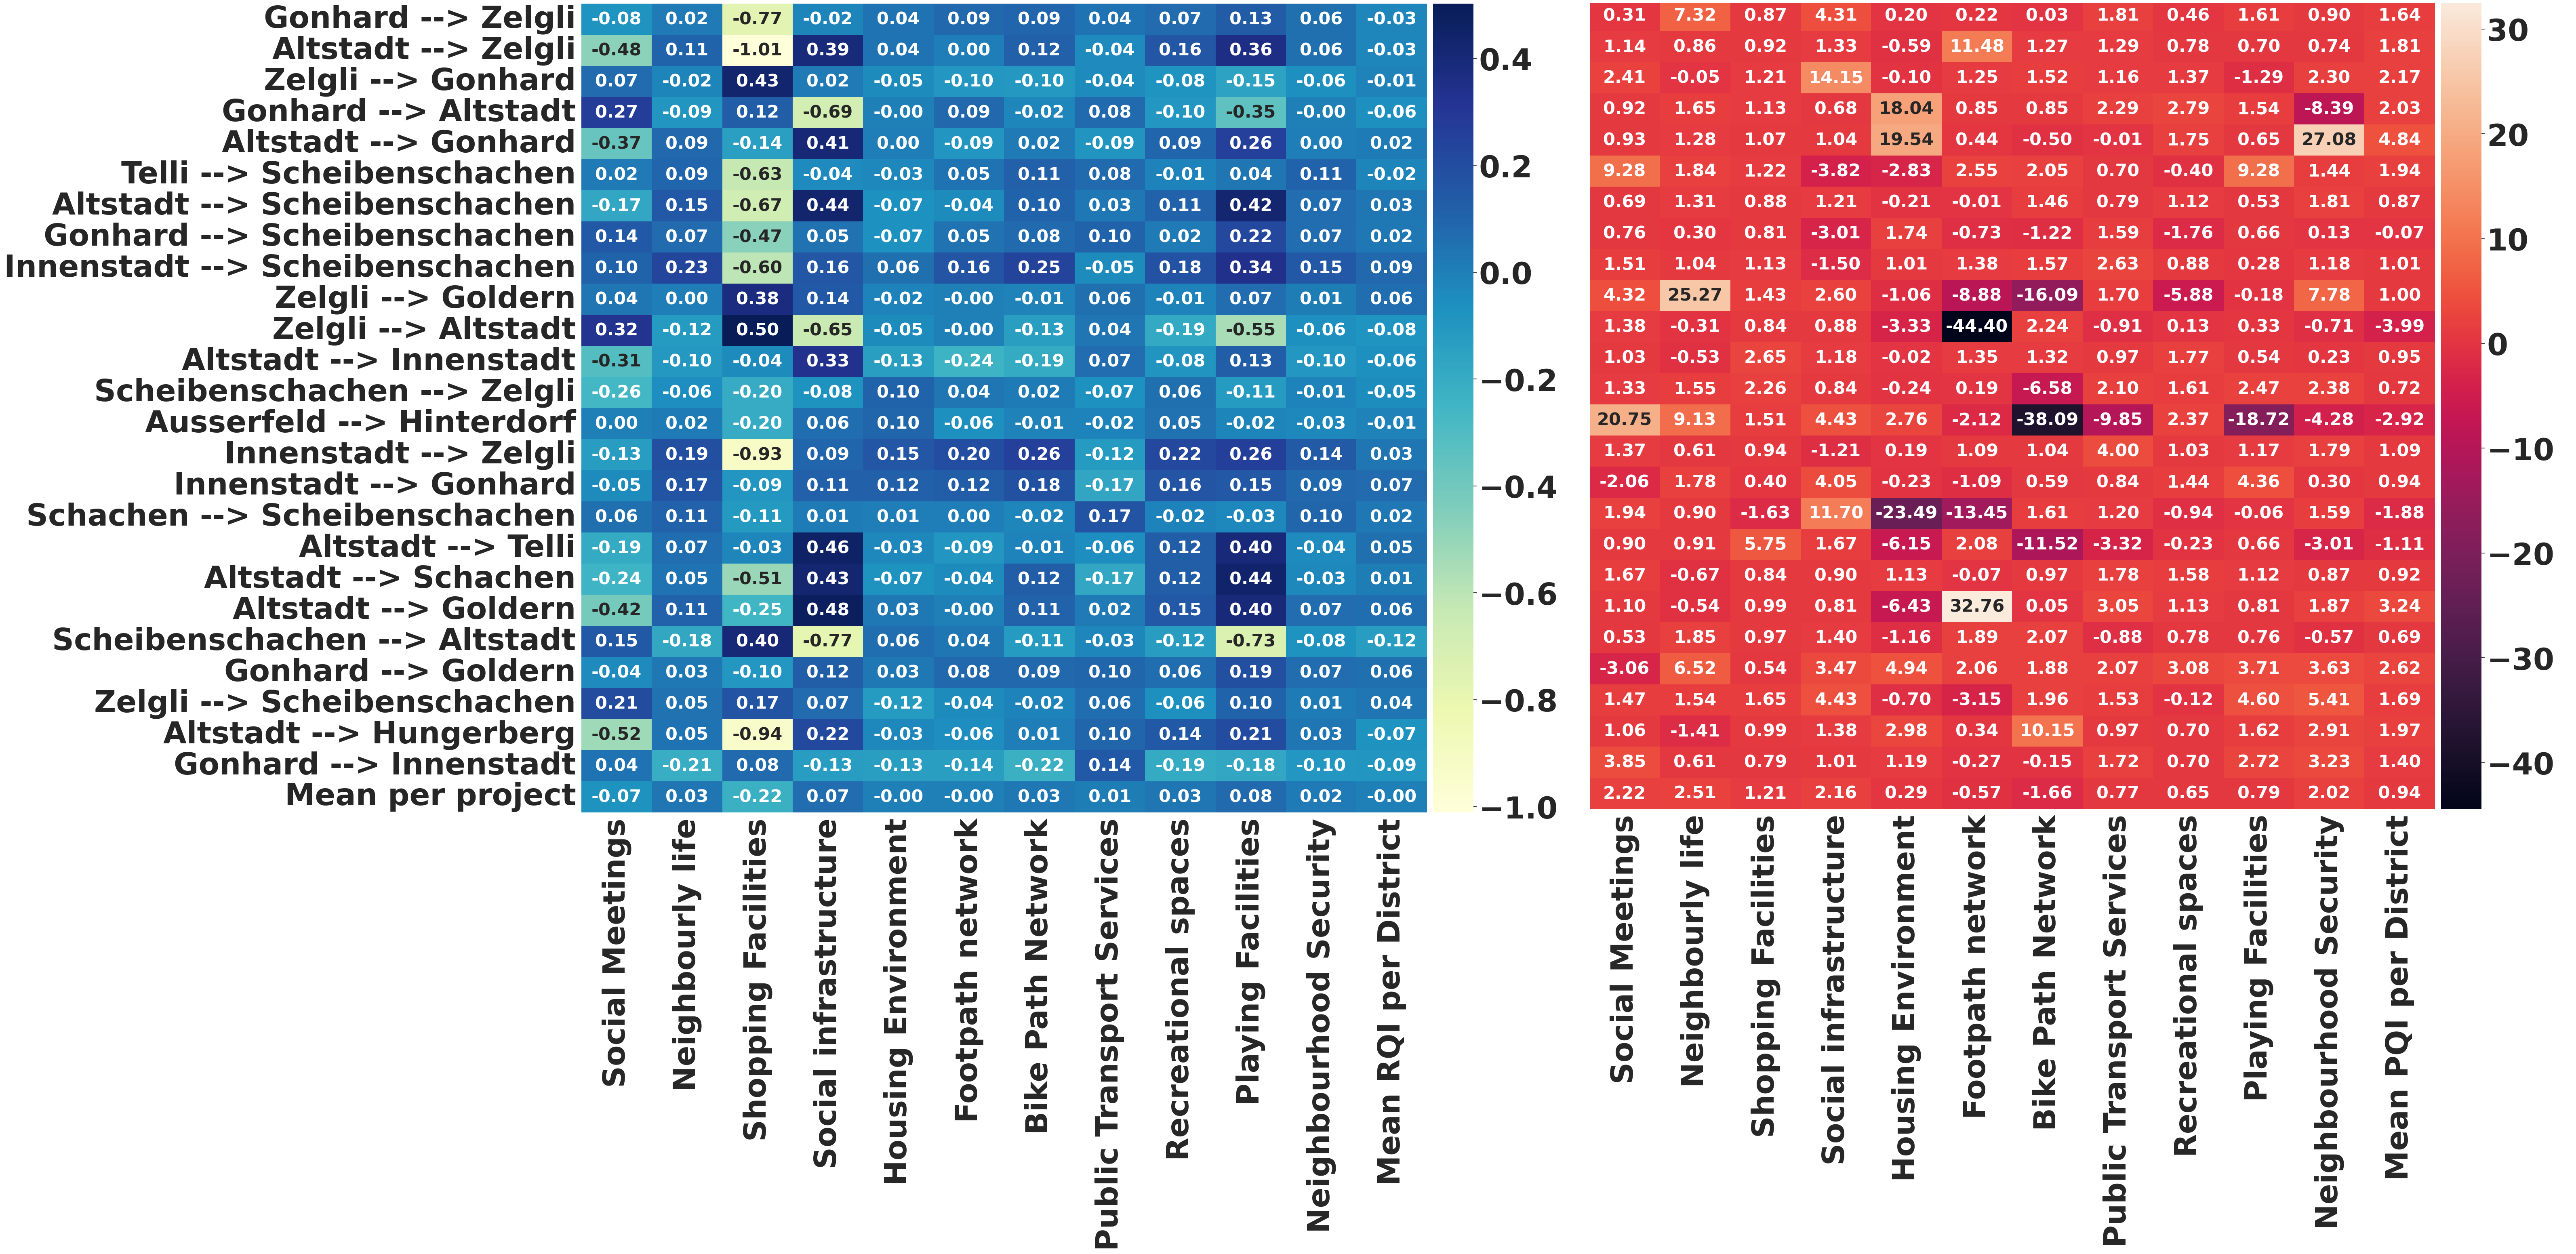
Moving further, we calculated the mean for each project sector and every relocation to rate how project sectors improve and deteriorate in all these relocations. Eq. 3 yields positive score for Playing Facilities, Social Infrastructure, Recreational Spaces, Niehgbourly Life and Public Transport Services. However, with the improvement in these facilities, people compromise on other facilities, which include Housing Environment, Social Meetings and Shopping Facilities. In some sense, this supports our finding that shopping facilities do not significantly impact citizens’ quality of life.
The measurement in Figure 15 assesses the perceived improvement or deterioration in the quality of life for each individual when relocating from one neighbourhood to another, which takes into account citizens’ satisfaction levels with various facilities and services. The scores is more positive than the scores. This suggests, that on average, citizens perceive a greater improvement in their quality of life when relocating from one neighborhood to another as compared to the actual improvement in the . Interestingly, relocation from Zelgli to Altstadt comes with a significant reduction in the perceived quality of footpath networks. When these findings are considered in relation to Fig. 10, it can be observed that the greatest legitimacy gain in Altstadt comes from project types that corresponds with footpath networks (such as public transport and parks).
5. Conclusion and Future Work
Policymakers’ capacity to be responsive to citizens requires an ability to maintain legitimacy, whilst also improving the quality of life and satisfaction for citizens. In order to provide guidance to city authorities, in this paper, we propose a legitimacy measure to determine the feasibility of participatory interventions. In doing so, we demonstrate the optimal number of project sectors to fund that maximize legitimacy. Specifically, this has allowed us to demonstrate how the neighborhoods of Altstadt, Scheibenschachen, Goldern, Binzenhof and Ausserfeld may be considered as suitable candidates for participatory intervention - on the basis that the local authority is less-likely to meet the minimum funding requirements for these neighborhoods. In addition, we are able to identify the degree of legitimacy should the local authority invest in project types across a number of neighborhoods. We then highlight the most important project sectors for satisfaction and participation in the neighbourhoods that explain the citizens’ overall quality of life. Using a data-driven approach, our research contributes to an understanding of the type of intervention that may benefit citizens’ quality of life. We find that shopping facilities and public transport are unlikely to impact citizens quality of life, which may offer guidance for policymakers when considering funding allocation. Finally, through the exploration of relocation data, we are able to identify the importance citizens place on particular project sectors and link satisfaction to the likelihood for citizens to relocate. We find that citizens are most likely to compromise on the quality of shopping facilities, which supports the findings of the classification model. We also find that, in general, citizens’ perception of improvement in facilities when relocating is positive.
The results outlined within this paper can open up new directions for future research. As previously outlined, our research informs the design of an upcoming novel participatory budgeting campaign in Aarau, Switzerland. Future research includes the study of additional factors that may impact satisfaction and legitimacy, such as local economic development, historical voting patterns, polling data etc. Intelligent pervasive data collection and decision-support systems for participation and collective decision-making can assist policy-makers to preserve legitimacy on a continuous basis, as we aspire to achieve with ongoing research on this area (Pournaras, 2020; Pournaras et al., 2021; Castells-Graells et al., 2020; Helbing et al., 2022). Finally, further joint data analysis is required to understand, in more depth, the motivation behind intra-city relocations and how they relate to satisfaction or gentrification policies.
Finally, it should be considered that citizens’ input may not always be the most reliable source of guidance for policymakers. For example, citizens may be impacted by media consumption (Hoewe and Peacock, 2020) and anecdotal information (Moore and Stilgoe, 2009). While policymakers need to reflect the wishes of the citizenry, they also need to rely on expert advice to ensure accurate decision making is undertaken (Christensen, 2021). Therefore, there is the potential for a limited degree of convergence between citizens’ wishes and policymakers’ decisions, even when policymakers are informed of citizens desires. With that in mind, policymakers may wish to utilize the approach of this paper, but may also take additional steps to enhance legitimacy, considering their approach to public relations, information sharing, and balancing public demand with expert advice.
Acknowledgements
We would like to thank Neus Llop Torrent and Faraz Awan for preliminary insights on this project. The authors would also like to thank Selina Frey, Lea Schneidegger and Jasmin Odermatt for providing access and insights on the data. This work is supported by a UKRI Future Leaders Fellowship (MR/W009560/1): ‘Digitally Assisted Collective Governance of Smart City Commons–ARTIO’ and the SNF NRP77 ‘Digital Transformation’ project ”Digital Democracy: Innovations in Decision-making Processes”, #407740_187249.
References
- (1)
- qua (2020) 2020. Euses Aarau Esuses Quartier. https://www.aarau.ch/leben/quartierentwicklung/quartierentwicklungskonzept.html/560
- Aleksandrov et al. (2018) Evgenii Aleksandrov, Anatoli Bourmistrov, and Giuseppe Grossi. 2018. Participatory budgeting as a form of dialogic accounting in Russia: Actors’ institutional work and reflexivity trap. Accounting, Auditing & Accountability Journal (2018).
- Allegretti and Antunes (2014) Giovanni Allegretti and Sofia Antunes. 2014. The Lisbon Participatory Budget: results and perspectives on an experience in slow but continuous transformation. Field Actions Science Reports. The journal of field actions Special Issue 11 (2014).
- Alon-Barkat and Gilad (2016) Saar Alon-Barkat and Sharon Gilad. 2016. Political control or legitimacy deficit? Bureaucracies’ symbolic responses to bottom-up public pressures. Policy & Politics 44, 1 (2016), 41 – 58. https://doi.org/10.1332/030557315X14443003393944
- Andersen (2012) Morten Skumsrud Andersen. 2012. Legitimacy in state-building: A review of the IR literature. International Political Sociology 6, 2 (2012), 205–219.
- Bay (1968) Christian Bay. 1968. Needs, wants, and political legitimacy. Canadian Journal of Political Science/Revue canadienne de science politique 1, 3 (1968), 241–260.
- Bezerra and Junqueira (2022) Carla de Paiva Bezerra and Murilo de Oliveira Junqueira. 2022. Why has Participatory Budgeting Declined in Brazil? Brazilian Political Science Review 16 (2022).
- Buchanan (2002) Allen Buchanan. 2002. Political legitimacy and democracy. Ethics 112, 4 (2002), 689–719.
- Castells-Graells et al. (2020) David Castells-Graells, Christopher Salahub, and Evangelos Pournaras. 2020. On cycling risk and discomfort: urban safety mapping and bike route recommendations. Computing 102 (2020), 1259–1274.
- Chawla et al. (2002) Nitesh V Chawla, Kevin W Bowyer, Lawrence O Hall, and W Philip Kegelmeyer. 2002. SMOTE: synthetic minority over-sampling technique. Journal of artificial intelligence research 16 (2002), 321–357.
- Christensen (2021) Johan Christensen. 2021. Expert knowledge and policymaking: a multi-disciplinary research agenda. Policy & Politics 49, 3 (2021), 455–471.
- Cui et al. (2020) Mengyao Cui et al. 2020. Introduction to the k-means clustering algorithm based on the elbow method. Accounting, Auditing and Finance 1, 1 (2020), 5–8.
- Gaille (1955) W. B. Gaille. 1955. Essentially Contested Concepts. Proceedings of the Aristotelian Society 56 (1955).
- Gurney (2018) Kevin Gurney. 2018. An introduction to neural networks. CRC press.
- Hanberger (2003) Anders Hanberger. 2003. Public policy and legitimacy: A historical policy analysis of the interplay of public policy and legitimacy. Policy Sciences 36, 3-4 (2003), 257–278.
- Hänggli et al. (2021) Regula Hänggli, Evangelos Pournaras, and Dirk Helbing. 2021. Human-centered democratic innovations with digital and participatory elements. In DG. O2021: The 22nd Annual International Conference on Digital Government Research. 227–233.
- Helbing et al. (2022) Dirk Helbing, Sachit Mahajan, Regula Hänggli, Andrea Musso, Carina Ines Hausladen, Cesare Carissimo, Dino Carpentras, Elisabeth Stockinger, Javier Argota Sánchez-Vaquerizo, Joshua Yang, et al. 2022. Democracy by Design: Perspectives for Digitally Assisted, Participatory Upgrades of Society. Participatory Upgrades of Society (November 2, 2022) (2022).
- Hoewe and Peacock (2020) Jennifer Hoewe and Cynthia Peacock. 2020. The power of media in shaping political attitudes. Current Opinion in Behavioral Sciences 34 (2020), 19–24.
- Hosmer Jr et al. (2013) David W Hosmer Jr, Stanley Lemeshow, and Rodney X Sturdivant. 2013. Applied logistic regression. Vol. 398. John Wiley & Sons.
- Leonard (2009) Charles W Leonard. 2009. Confronting the State Budget and Establishing Quality-of-Life Benchmarks in Illinois: Results and Analysis of the Paul Simon Public Policy Institute 2008 Statewide Poll. (2009).
- Ljungman (2009) Gösta Ljungman. 2009. Top-Down Budgeting—An Instrument to Strengthen Budget Management. International Monetary Fund.
- Macke et al. (2018) Janaina Macke, Rodrigo M Casagrande, João Alberto R Sarate, and Kelin A Silva. 2018. Smart city and quality of life: Citizens’ perception in a Brazilian case study. Journal of Cleaner Production 182 (2018), 717–726.
- Mærøe et al. (2021) Anders Røsten Mærøe, Alexander Norta, Valentyna Tsap, and Ingrid Pappel. 2021. Increasing citizen participation in e-participatory budgeting processes. Journal of Information Technology & Politics 18, 2 (2021), 125–147.
- Magliacani (2020) Michela Magliacani. 2020. The Public Value Sphere Within the Participatory Budgeting: Evidences From an Italian Smart City. Journal of US-China Public Administration 17, 3 (2020), 87–98.
- Mashlakov et al. (2021) Aleksei Mashlakov, Evangelos Pournaras, Pedro HJ Nardelli, and Samuli Honkapuro. 2021. Decentralized cooperative scheduling of prosumer flexibility under forecast uncertainties. Applied Energy 290 (2021), 116706.
- Medvedev and Landhuis (2018) Oleg N Medvedev and C Erik Landhuis. 2018. Exploring constructs of well-being, happiness and quality of life. PeerJ 6 (2018), e4903.
- Meyer and Wien (2015) David Meyer and FT Wien. 2015. Support vector machines. The Interface to libsvm in package 28 (2015), 20.
- Moore and Stilgoe (2009) Alfred Moore and Jack Stilgoe. 2009. Experts and anecdotes: The role of “anecdotal evidence”in public scientific controversies. Science, Technology, & Human Values 34, 5 (2009), 654–677.
- Morris (2019) Eric A Morris. 2019. Do cities or suburbs offer higher quality of life? Intrametropolitan location, activity patterns, access, and subjective well-being. Cities 89 (2019), 228–242.
- Nambi et al. (2016) Akshay Nambi, Evangelos Pournaras, and R Venkatesha Prasad. 2016. Temporal self-regulation of energy demand. IEEE Transactions on Industrial Informatics 12, 3 (2016), 1196–1205.
- Peter (2017) Fabienne Peter. 2017. Political Legitimacy (Summer 2017 ed.). Metaphysics Research Lab, Stanford University.
- Peters et al. (2021) Dominik Peters, Grzegorz Pierczyński, and Piotr Skowron. 2021. Proportional participatory budgeting with additive utilities. Advances in Neural Information Processing Systems 34 (2021), 12726–12737.
- Pinnington et al. (2009) Elizabeth Pinnington, Josh Lerner, and Daniel Schugurensky. 2009. Participatory budgeting in North America: the case of Guelph, Canada. Journal of public budgeting, accounting & financial management (2009).
- Pournaras (2020) Evangelos Pournaras. 2020. Proof of witness presence: Blockchain consensus for augmented democracy in smart cities. J. Parallel and Distrib. Comput. 145 (2020), 160–175.
- Pournaras et al. (2021) Evangelos Pournaras, Atif Nabi Ghulam, Renato Kunz, and Regula Hänggli. 2021. Crowd sensing and living lab outdoor experimentation made easy. IEEE Pervasive Computing 21, 1 (2021), 18–27.
- Sahin et al. (2019) Deniz Say Sahin, Ozlem Ozer, and Melek Zubaroglu Yanardag. 2019. Perceived social support, quality of life and satisfaction with life in elderly people. Educational Gerontology 45, 1 (2019), 69–77. https://doi.org/10.1080/03601277.2019.1585065
- Schmidt (2020) Vivien A. Schmidt. 2020. Conceptualizing Legitimacy: Input, Output, and Throughput. In Europe’s Crisis of Legitimacy: Governing by Rules and Ruling by Numbers in the Eurozone, Vivien A. Schmidt (Ed.). Oxford University Press. https://doi.org/10.1093/oso/9780198797050.003.0002
- Sintomer et al. (2008) Yves Sintomer, Carsten Herzberg, and Anja Röcke. 2008. Participatory budgeting in Europe: Potentials and challenges. International journal of urban and regional research 32, 1 (2008), 164–178.
- Sirgy et al. (2009) M Joseph Sirgy, Rhonda Phillips, and Don R Rahtz. 2009. Community quality-of-life indicators: Best cases II. Springer.
- Song and Ying (2015) Yan-Yan Song and LU Ying. 2015. Decision tree methods: applications for classification and prediction. Shanghai archives of psychiatry 27, 2 (2015), 130.
- Suddaby et al. (2017) Roy Suddaby, Alex Bitektine, and Patrick Haack. 2017. Legitimacy. Academy of Management Annals 11, 1 (2017), 451–478.
- Swaner (2017) Rachel Swaner. 2017. Trust matters: Enhancing government legitimacy through participatory budgeting. New Political Science 39, 1 (2017), 95–108.
- Wellings et al. (2023) Thomas Wellings, Srijoni Majumdar, Regula Hänggli, and Evangelos Pournaras. 2023. Aarau Study: Quality of Life, satisfaction and Legitimacy. (4 2023). https://doi.org/10.6084/m9.figshare.22677385
- Wong (2001) Cecilia Wong. 2001. The relationship between quality of life and local economic development: an empirical study of local authority areas in England. Cities 18, 1 (2001), 25–32.