1]organization=Argonne National Laboratory, addressline=9700 S. Cass Avenue, city=Lemont, postcode=60439, state=IL, country=U.S.A.
2]organization=National Renewable Energy Laboratory, addressline=15013 Denver West Parkway, city=Golden, postcode=80401, state=CO, country=U.S.A.
[orcid=0000-0001-5868-0748] \cormark[1]
[1]Corresponding author
Feasibility of renewable energy for power generation at the South Pole
Abstract
Transitioning from fossil-fuel power generation to renewable energy generation and energy storage in remote locations has the potential to reduce both carbon emissions and cost. We present a techno-economic analysis for implementation of a hybrid renewable energy system at the South Pole in Antarctica, which currently hosts several high-energy physics experiments with nontrivial power needs. A tailored model for the use of solar photovoltaics, wind turbine generators, lithium-ion energy storage, and long-duration energy storage at this site is explored in different combinations with and without traditional diesel energy generation. We find that the least-cost system includes all three energy generation sources and lithium-ion energy storage. For an example steady-state load of 170 kW, this hybrid system reduces diesel consumption by 95% compared to an all-diesel configuration. Over the course of a 15-year analysis period the reduced diesel usage leads to a net savings of $57M, with a time to payback of approximately two years. All the scenarios modeled show that the transition to renewables is highly cost effective under the unique economics and constraints of this extremely remote site.
keywords:
South Pole\sepAntarctica \sepsolar photovoltaics \sepwind turbine generators \sepenergy storage1 Introduction
Renewable energy sources coupled with energy storage are enabling a global transition away from fossil fuel generators, reducing the associated greenhouse gas emissions. As renewable technologies have matured over the past decade, the energy generated has become increasingly reliable and affordable. Adoption of renewable energy has accelerated with decarbonization initiatives in many countries, for example over 90% Clean electricity by 2035 in the US, or even ‘Carbon Net Zero’ and ‘Net Zero World Initiative’ at the global level [1, 2, 3]. Using locally-available renewable energy sources in remote regions can be particularly impactful as transportation of fuel to these locations can be both complex and costly, and a transition to renewables can reduce these costs along with the greenhouse gas emissions.
Antarctic research stations are some of the most remote facilities on the planet, relying primarily on fossil fuel to generate power with high reliability. In the case of the South Pole, the supply of fossil fuel is particularly expensive due to the complicated transportation logistics required for its delivery. A transition to energy technology that uses the local solar and wind resources has the potential to reduce both the negative economic and environmental impacts. The Protocol on Environmental Protection in the Antarctic Treaty specifically notes that “The protection of the Antarctic environment…shall be fundamental considerations in the planning and conduct of all activities in the Antarctic Treaty area” [4]. However, the extreme environment and logistical constraints of Antarctica pose singular challenges in the implementation and operation of renewable technology. Two unique obstacles for solar installations are the resource availability and snow accumulation. For wind turbines, challenges center around the extreme range of weather conditions and the associated mechanical stresses. Some progress towards decarbonization of the Antarctic has been made with multiple stations incorporating renewable sources to supply a fraction of their energy [5, 6]. If the technical challenges can be resolved, then significant opportunities exist for further adoption of renewable sources.
Renewable energy hybrid systems in Antarctica are tailored to the specific characteristics of each site because key factors such as terrain and weather vary widely across the continent. For example, Belgium’s Princess Elisabeth Station employs both wind turbines and solar panels to generate a 100% renewable energy supply (132 kW). Customizations include specially designed rotors and blades to withstand the site’s wide range of wind speeds [5, 7]. New Zealand’s Scott Base and the United States’ McMurdo Station share the Ross Island Wind Farm, a 990 kW installation of three wind turbines supplying tens of percent of the total energy used by the two stations, while the Black Island Communications Station has used wind, solar and diesel engines to provide energy [8]. The Australian Casey Station has installed 30 kW of solar panels that supply 10% of the annual energy consumption [9]. Several groups have also performed renewable energy feasibility studies for other stations across the continent [10, 11, 12, 13].
The Amundsen Scott South Pole Station is a United States research station that operates year-round to support on-going scientific experiments covering a wide range of disciplines from astrophysics and geophysics to atmospheric and climate sciences. Located at the geographic South Pole, this station experiences extreme temperatures with a lowest recorded temperature of -82∘ C. Electrical power for both the station and experiments is currently supplied entirely by diesel generators.
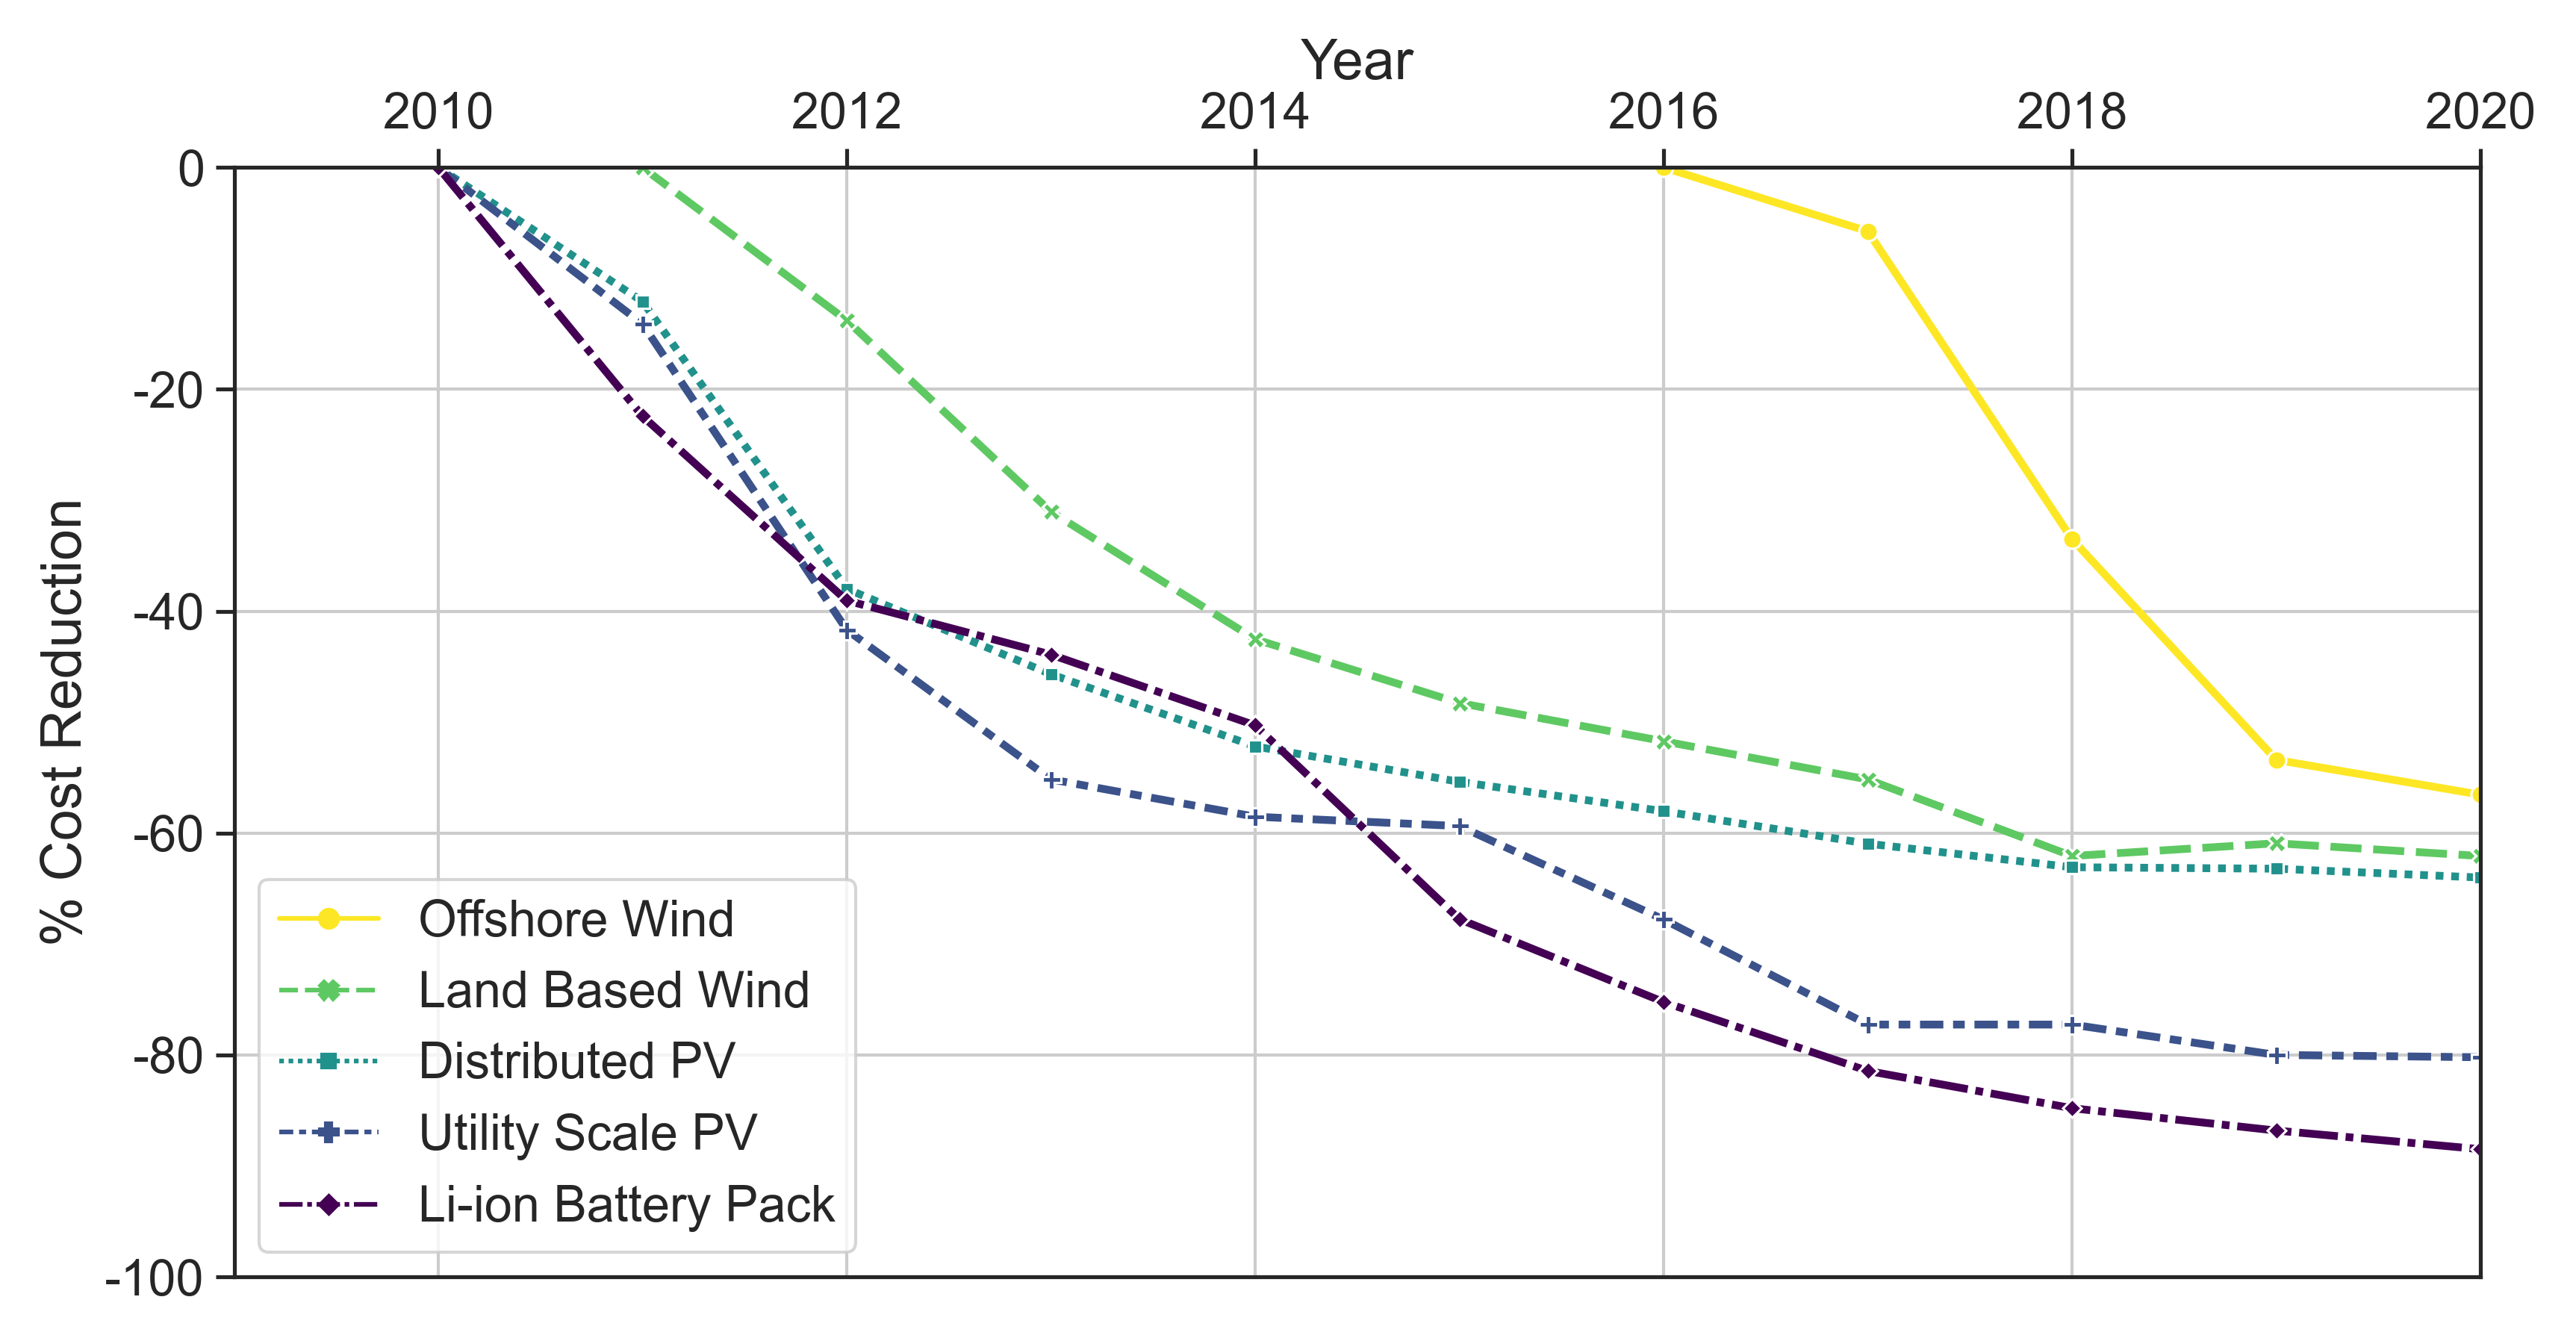
Evaluations of the technical and economic feasibility of both photovoltaic (PV) panels [14] and wind turbines [15] have been previously conducted for the South Pole. PV panels were mounted on a building for over 400 days (including both austral summer and winter) and the output power monitored. No structural degradation was observed at the end of this period and the output power depended on both the angle of the sun and the overall visibility due to cloud cover or blowing snow. For wind generation, a previous economic analysis indicated the possibility of significant savings compared to diesel fuel despite the relatively low wind speeds at the South Pole [15]. Both of these studies support the potential of renewable energy generation at this extremely remote site. The cost of renewable energy generation and storage have dramatically decreased while reliability has improved since these studies were performed [16]. Figure 1 shows the reduction in cost for different renewable technologies over the past decade [17, 18, 19, 20]. The economic case for using renewables and storage at the South Pole is therefore even stronger now.
In this work, we present an updated feasibility analysis for a South Pole hybrid renewable energy system using solar and wind electricity generation in combination with energy storage. A cost optimization of power generation technology, including existing fossil fuel generators, is performed. Section 2 introduces the renewable technology and details how weather data measured at the South Pole supports modeling of both solar- and wind-generated electricity. Energy storage is also introduced, including both mature lithium-ion batteries as well as emerging technologies for longer durations not economically addressed with lithium-ion. A detailed cost analysis of all technologies is presented in Section 3, including South Pole specific costs such as shipping and labor. The resource and cost information are used to calculate optimal system configurations under several different scenarios. Discussion of the optimization results is presented in Section 4, including analysis of the sensitivity to input assumptions. Section 5 summarizes the findings and discusses a path for technical development of the renewable-based hybrid system.
2 Modeling Renewable Resources for the South Pole
The implementation of renewable energy technology at the South Pole site must account for the unique environmental conditions as well as constraints imposed by the suite of scientific experiments. The most fundamental requirement is the ability of the equipment to survive the extreme South Pole winter, regardless of whether it is in an operational or standby state. The average annual temperature is approximately -50∘ C with a record low temperature is -82∘ C, well below the recommended temperature ranges of most commercial off-the-shelf renewable generation equipment. Additional environmental conditions include nearly zero relative humidity, an annual snow accumulation of roughly 20 cm [21], and the thick Antarctic ice sheet that results in a lack of solid ground. These environmental constraints are important aspects of the solar and wind technology identification and resource modeling discussed in the following section.
2.1 Solar Resource Modeling
Solar radiation is available for energy generation at the South Pole for six contiguous months of the year. During that period the sun reaches a maximum elevation of 23.5 degrees above the horizon. The remaining six months of the year the sun is below the horizon. Solar and other weather data are collected by the on-site National Oceanic and Atmospheric Administration (NOAA) South Pole Observatory [22] as well as by National Aeronautics and Space Administration (NASA) satellites. The NASA data is made available through the POWER project111https://power.larc.nasa.gov/ with a time resolution of one hour that is sufficient for this analysis. Available measurements used to model the solar resource include direct normal irradiance, diffuse horizontal irradiance, global horizontal irradiance (GHI), relative humidity, windspeed, and upwelling irradiance. The ground solar radiation reflectivity, also know as albedo, can be estimated using the upwelling irradiance with the GHI. The year-round permafrost contributes to high reflectivity with albedo ranging from 0.83 to 0.97 depending on cloudiness and sun angle [23]. The high albedo makes the South Pole an ideal location for bifacial photovoltaic (PV) technology, which capture irradiance from both sides of the panel.
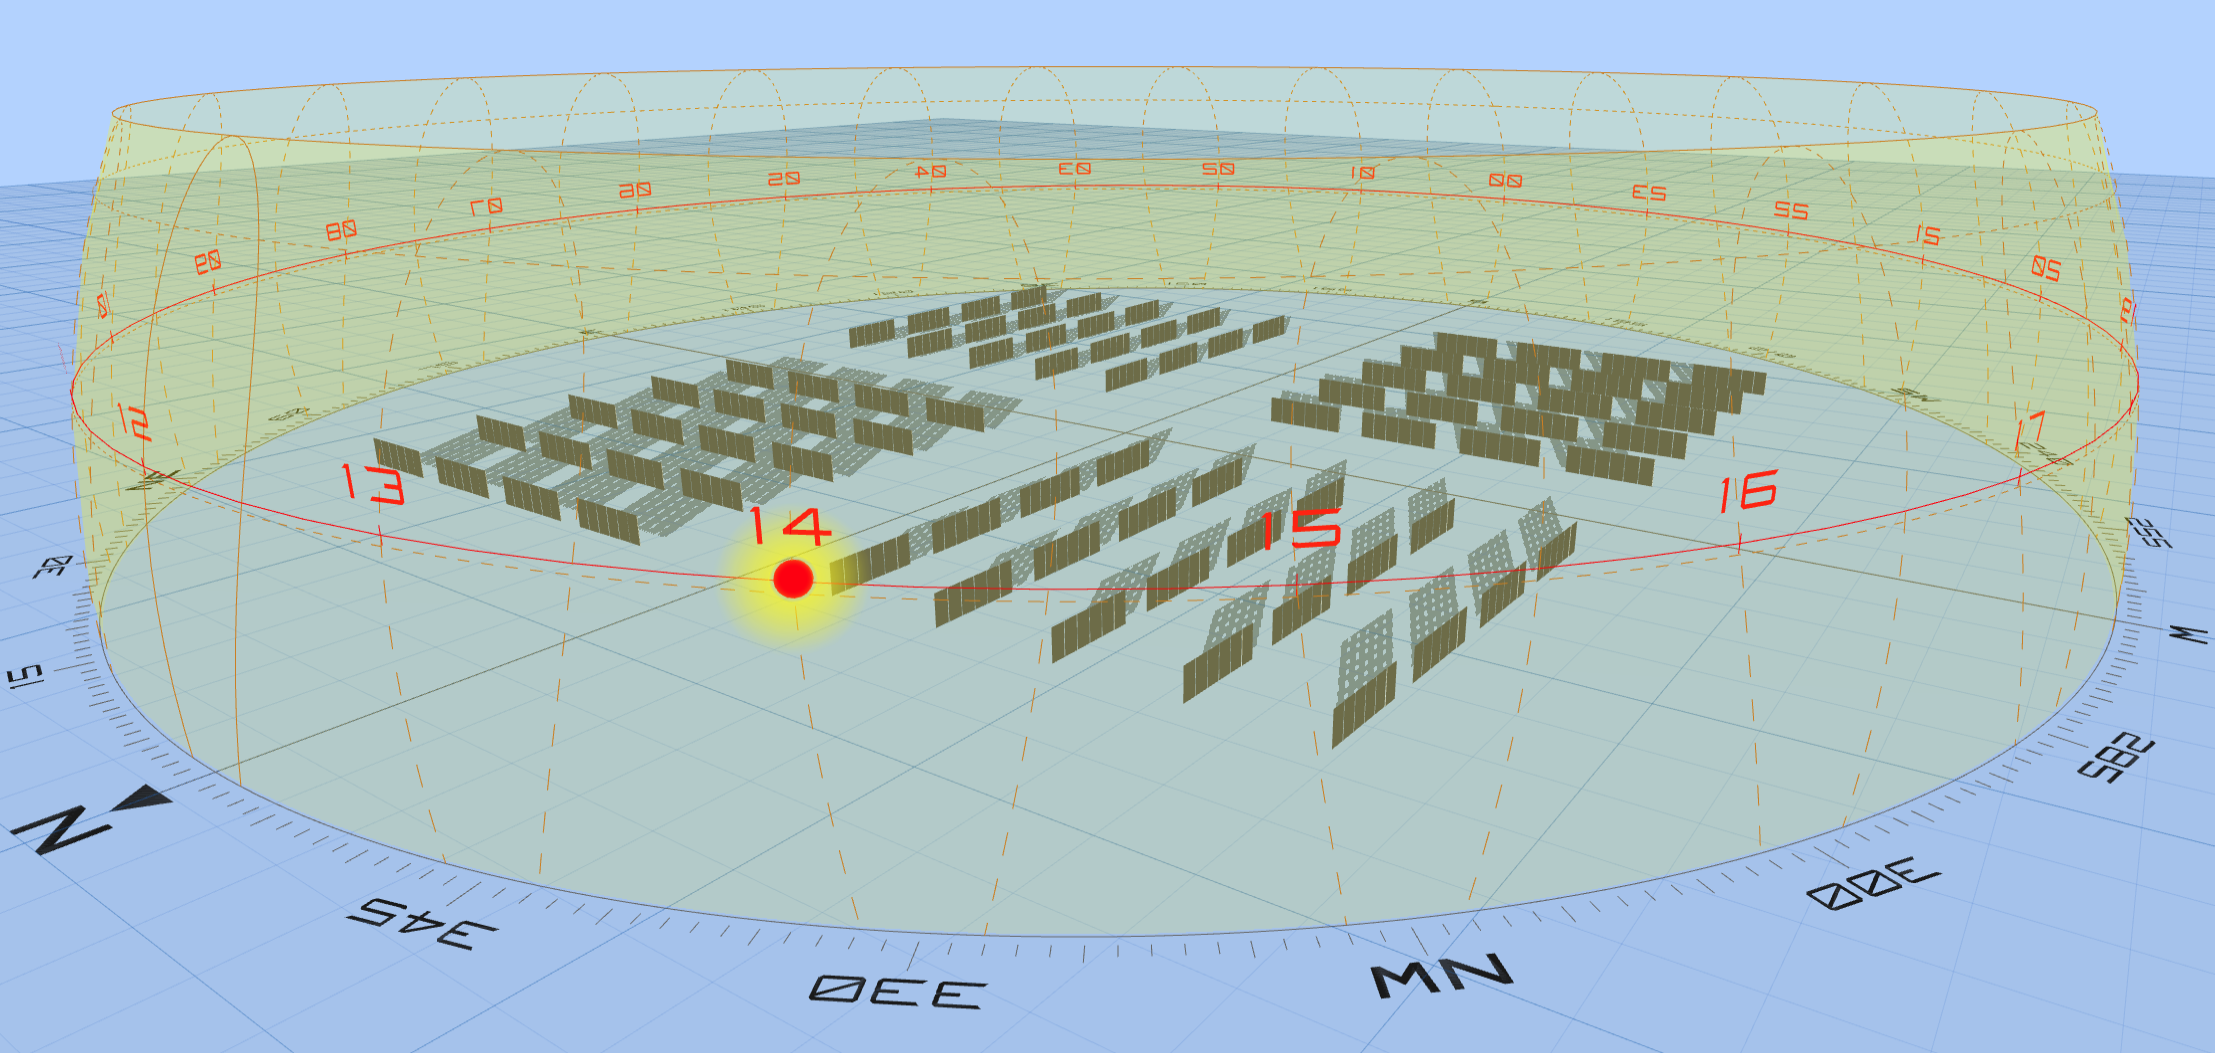
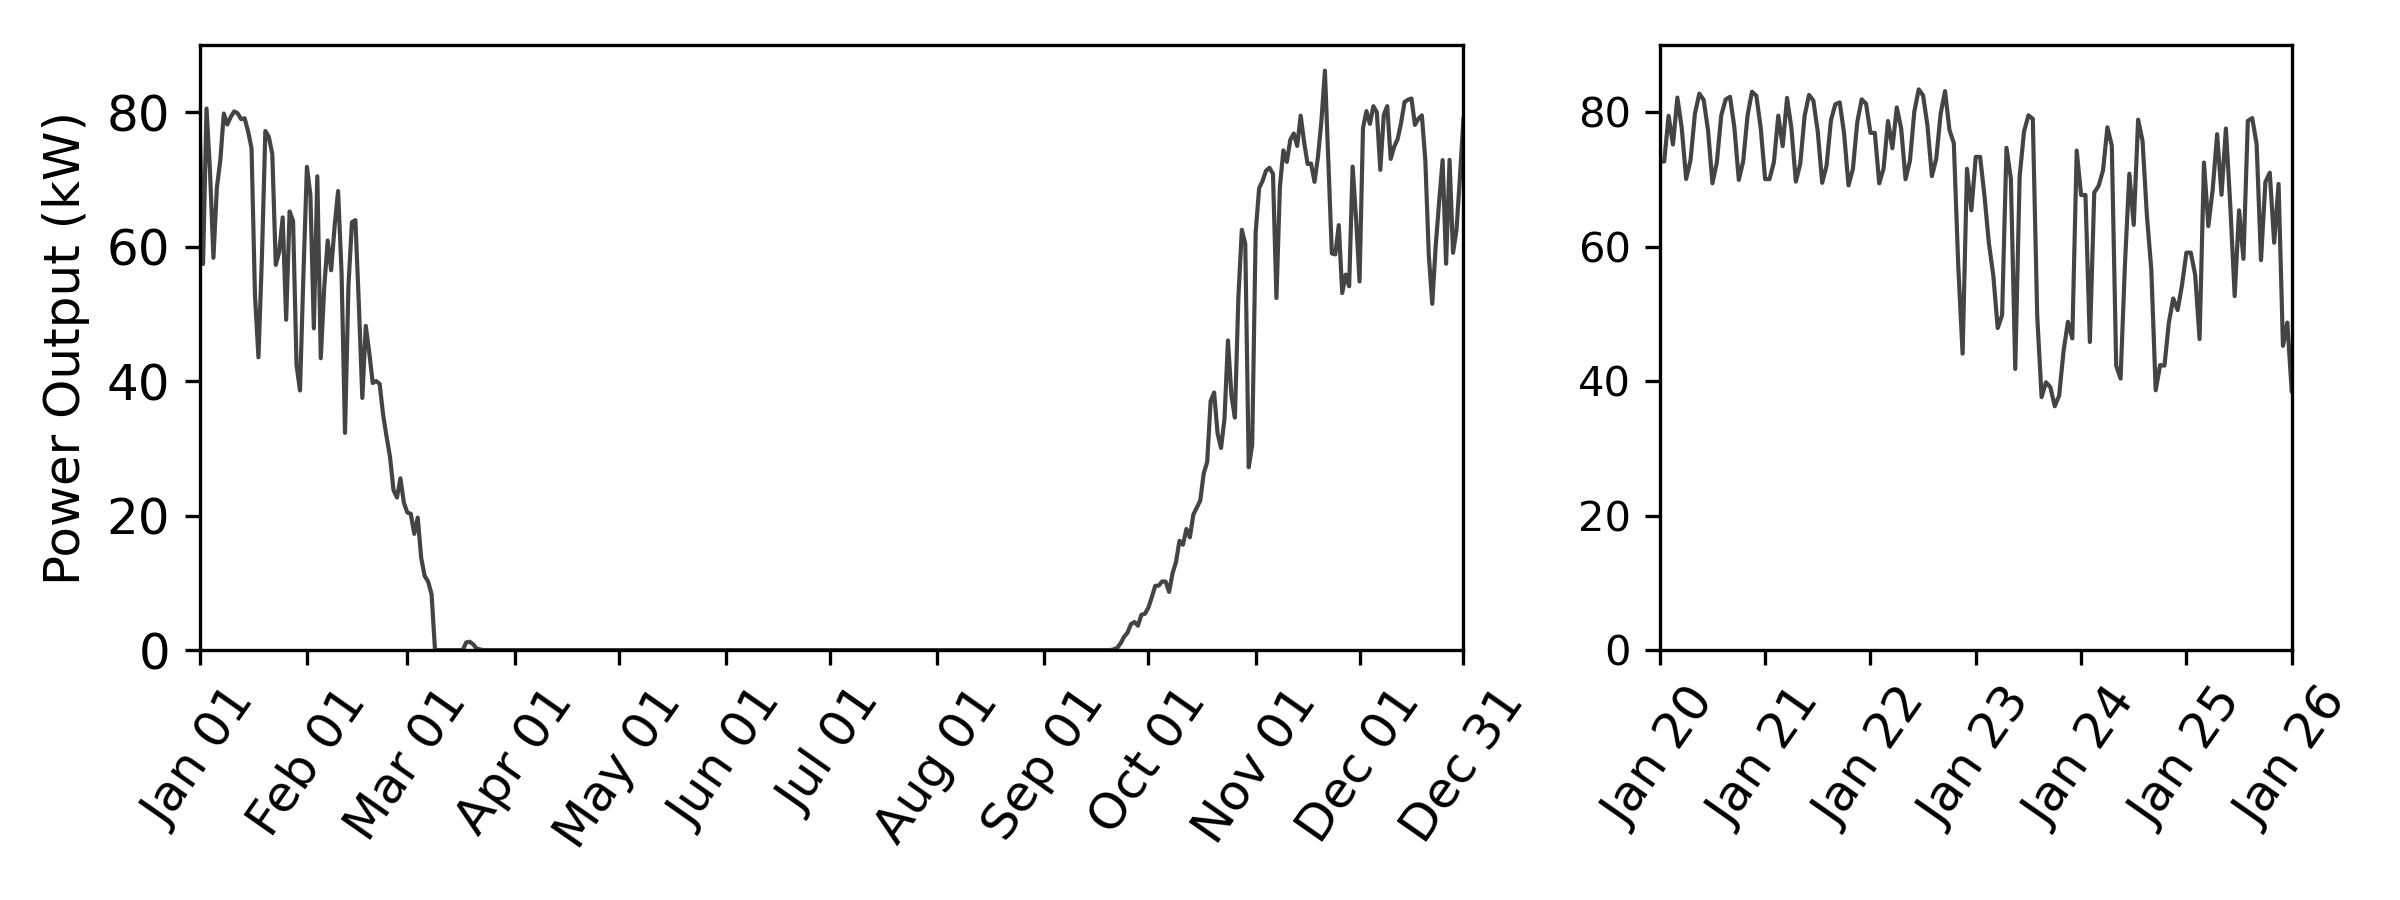
Solar irradiance for an array of vertical, bifacial PV panels is modeled using the NREL open-source bifacial_radiance ray tracing tool. This ray tracing tool can analyze complex scenarios, including tracker-element shading [24]. A unique solar array is designed to adapt to the unconventional solar availability at the South Pole. To capture the solar radiation throughout each 24-hour revolution of the sun around the horizon the panels are arranged into four subarrays oriented in a North-South-East-West configuration as shown in Figure 2. Modules are grouped into bays within each row at a height of 0.6m above grade and a vertical orientation to minimize snow accumulation. NOAA data from 2016, an average year in terms of weather, is used to calculate the irradiance on an hourly cadence. The simulated irradiance is then combined with PV panel electrical parameters and the energy generation performance of the array is determined using the PVlib implementation of the single-diode model [25]. A Longi 72HBD-380M monocrystalline bifacial module with 0.7 bifaciality was selected as an example module owing to its good reliability under NREL studies [26] and placement as a top performer on the PV Evolution Labs PV Module Reliability Scorecard222https://modulescorecard.pvel.com/. Figure 3 shows the total output of an example 100 kW-DC solar array as a function of time.
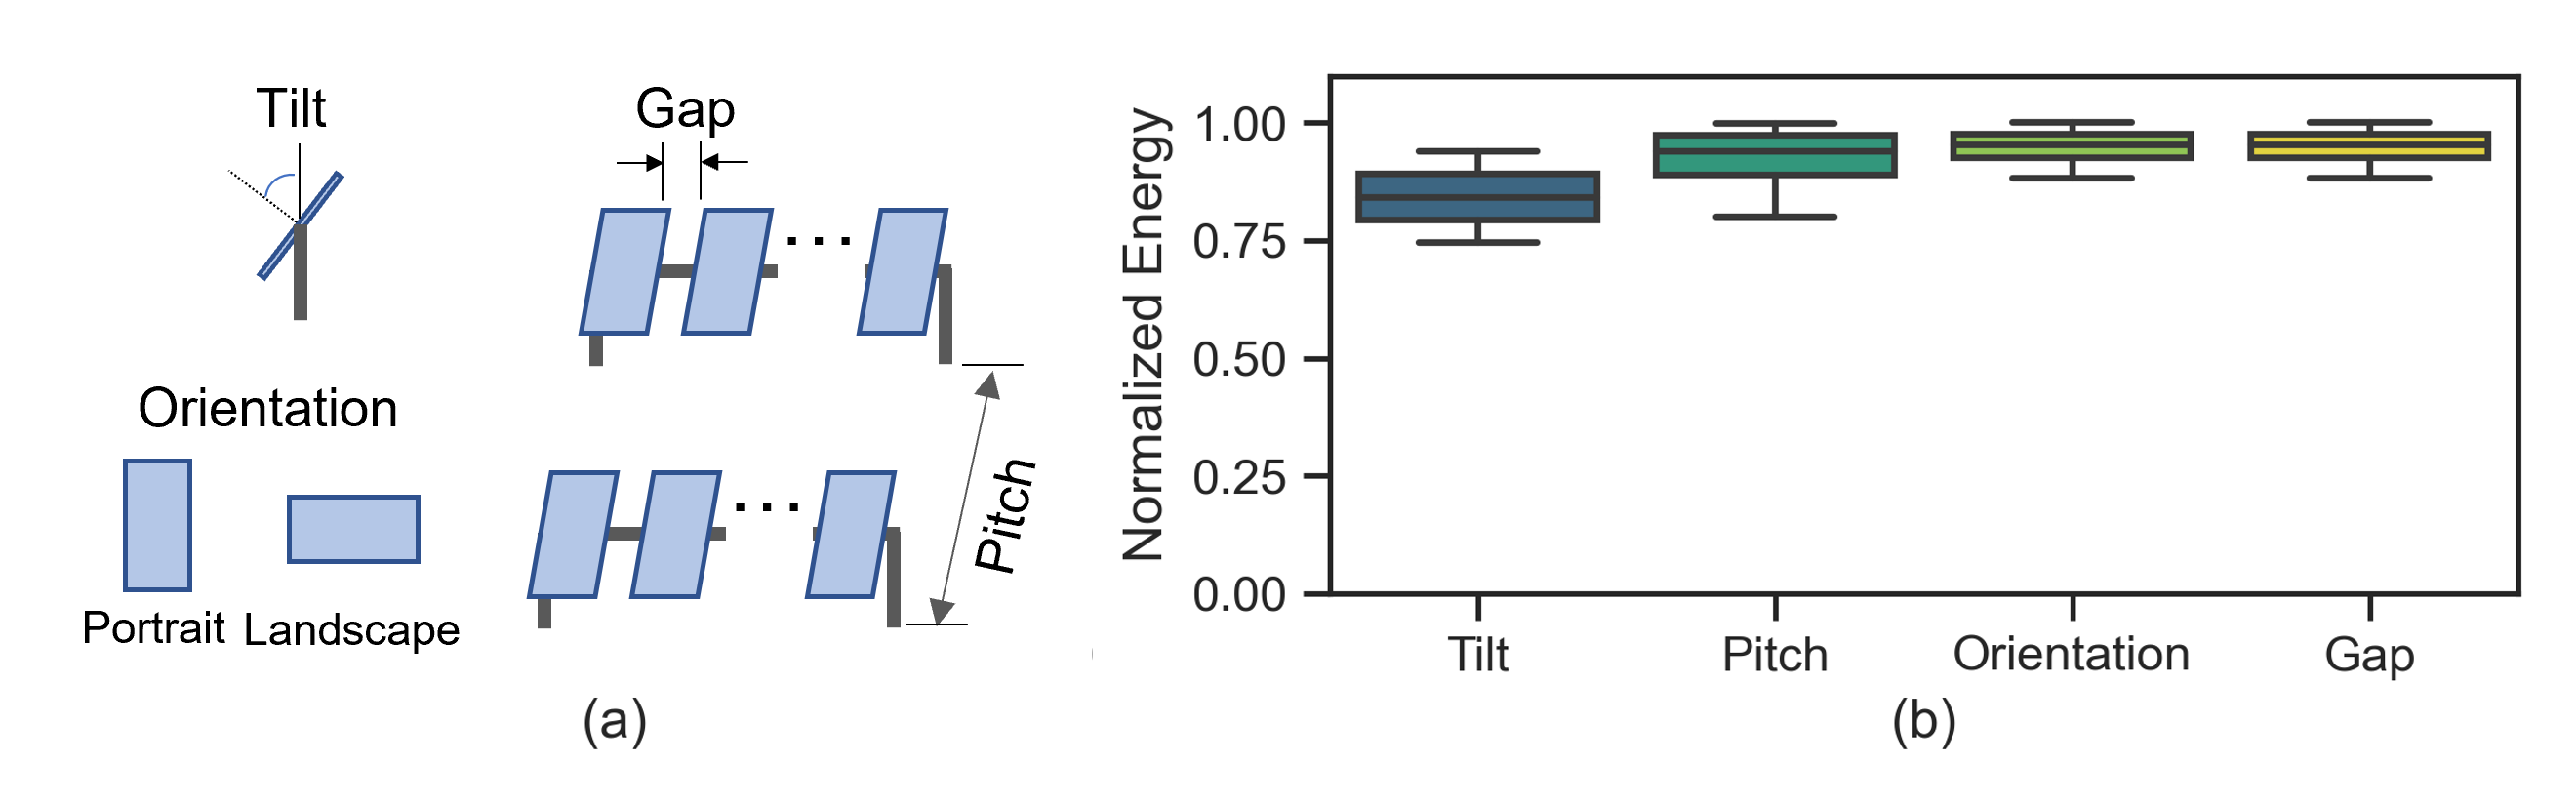
Several variations on the array configuration are modeled to explore the sensitivity to the specific design. Initially, an array of horizontally oriented panels (i.e., parallel to the ground) was considered. Solar output is more constant in this case than the vertical orthogonal array. However, the low solar angle relative to the panel face normal resulted in significantly lower output per unit area. Coupled with the fact that a horizontal orientation would be more prone to snow accumulation, this configuration was quickly eliminated from consideration. For the vertical array configuration, variations on module orientation, spacing between bays of modules, and spacing between rows in the array are explored. An array tilted by 30 degrees from vertical is also simulated for comparison. Figure 4 shows the resulting total annual irradiance for each variation. As expected, increasing the separation between rows reduces self-shading and slightly increases cumulative irradiance. The difference in energy production between these different configurations is marginal, with the exception of the tilted panels, which has significantly reduced cumulative irradiance. The configuration with vertical, portrait-oriented panels is selected as the baseline for the remainder of this study. Each bay groups together six modules with rows that are separated with eight meter pitch. The energy production as a function of time for this configuration serves as an input to the co-optimization described in Section 3.
2.2 Wind Resource Modeling
Wind energy has been used extensively in isolated arctic environments, typically operating in conjunction with diesel driven generators [27, 28, 29, 30]. Wind turbines are increasingly used in these locations due to the high energy density as compared to solar energy and the ability to provide year-round power generation. As previously stated, wind turbines have been used extensively in Antarctica, but only small turbines have been installed at the South Pole, primarily to power smaller research projects or as part of short-term demonstration projects. For power systems at the scale of 100 kW or more, larger turbines are required. In this analysis, we use a 100 kW turbine which balances turbine size, for transportation and logistics reasons, and reasonable power output.
Wind speed data is collected by the NOAA South Pole Observatory; however, this data has a measurement height of 10 meters above ground level and extrapolation must be performed to determine the potential for wind energy. For this analysis, wind speed at the 10-meter height along with the temperature and pressure measurements from 2003 are used at a measurement interval of one minute [15, 31]. Separately, average monthly reporting of wind speed data from February 2008 to June of 2009 from the NOAA meteorology tower at a height of 30 meters is used to assess wind shear, which describes how the wind speed changes with distance away from the earth’s surface. Using the Windographer333https://www.ul.com/software/windographer-wind-data-analytics-and-visualization-solution software program, the one-minute data is converted into an estimated hourly average wind turbine power output for a Northern Power System NPS 100C-24444https://www.nps100.com/wp/nps-100c/. This 95 kW Arctic wind turbine has a 24.4-meter rotor diameter and a 30-meter hub height. This particular turbine was initially designed for extreme cold weather applications such as the South Pole555https://www.nps100.com/wp/technology/#heritage, but other similar turbines should also be assessed in future analysis [32, 33].
In addition to the availability of the wind resource, an important consideration for wind energy at the South Pole is the operational temperature limit. The turbine considered in this analysis operates to -40∘ C, below which the turbine shuts down. However, initial assessments indicate turbine operation down to -70∘ C is technically possible. For the wind resource estimation, the wind turbine is assumed to be offline when the temperature is below -70∘ C, resulting in no power production during these time periods. The resulting expectation of power produced by a single turbine for the conditions of the analysis year is shown in Figure 5. While this resource profile is representative, additional atmospheric measurements at a height of at least 30 meters above ground level would enable additional refinement and confidence.
There are several challenges for operating turbines at the South Pole: transportation and construction logistics, extreme cold climate operation, and creating a suitable turbine foundation. Turbines of the 100 kW size are typically designed to ship within a C130 transport aircraft and to be installed with minimum additional equipment, potentially including the use of tilt-up towers. This is the case for the NPS 100C-24 turbine considered in this analysis. Turbine operation in very cold climates has been researched extensively [34] and requires consideration of materials, including metallurgy and lubricants, component heating, and unique operating conditions in these environments. The latter includes both specialized safety requirements and potential operational limits during extreme weather events.
Turbine deployment at the South Pole requires special development for the foundation as solid ground for traditional tower footings is not available due to the thick Antarctic ice sheet. Development of an ice-based foundation would be required. Although not documented in the literature, ice foundations have been used for smaller turbines installed at the Summit Station in Greenland and at least twice at the South Pole. In all three cases a modified guyed tower foundation is used, similar in concept to the tall meteorological towers installed at the South Pole. Ice-based foundations are also used for the elevated station building [35] as well as other buildings on-site, including the South Pole Telescope [36]. In these designs the weight of the turbine and tower is dispersed to not exceed the load bearing weight of the ice and deadman anchors for the guy wires address the overturning moment of the tower. Towers of the height and weight proposed in this study have yet to be demonstrated, however, the engineering principles are well-understood.
2.3 Energy Storage
Energy storage (ES) is key to enabling deep decarbonization via electrified transportation and renewable power generation. The evolution of contemporary energy storage is largely driven through its role in electric vehicles (EV), which now have cost and performance that are sufficient for mass adoption — after decades of battery research and development. Today, lithium-ion (Li-ion) is the single dominant ES technology with manufacturing that is scaling globally to meet this rapidly growing demand [37]. ES is the primary strategy to address variability in solar and wind renewable resources due to its ease of implementation.
Stationary storage today is served with readily available Li-ion batteries based on designs that were initially focused on EVs. These serve as a natural starting point for the evolving stationary markets but are not optimal in several aspects. One example is the flammability risk. While always critical, it is of paramount importance for stationary applications where deployment sizes are typically several orders of magnitude larger than an EV pack and therefore can result in significant negative outcomes. Stationary safety today is insured with multiple system elements to prevent such events. Solutions to the long-term goal of nonflammable/reduced flammability versions of Li-ion are now emerging; one option was identified in the course of this analysis and should remain under consideration in the future.
As the percentage of renewable generation increases in large grids, both the amount (kWh) and type of ES needed to balance the resource variability changes. When the hours of available energy (duration) to ensure system reliability surpasses 10 hours, the storage requirements enter a regime called long-duration energy storage (LDES) [38]. The affordable cost of energy storage also decreases significantly with increasing duration. Presently, most technologies are unable to meet LDES cost requirements. Li-ion is not projected to be cost effective for LDES even as its cost continues to drop due to economies of scale for EV mass adoption. The LDES cost requirements create a significant technology gap that is a great challenge for near-total renewable generation scenarios, which attracts global attention. For example, the United States Department of Energy (DOE) has an earthshot initiative to develop LDES technologies for a targeted cost reduction of 90% relative to Li-ion. In the context of the analysis presented here, Li-ion can be considered as ‘short duration’ energy storage. It is the dominant technology today but is not the singular long-term solution. A summary of the generalized tradeoffs between Li-ion and LDES is presented in Table 1.
| Feature | Li-ion (short duration ES) | LDES (long duration ES) | Comment |
| Development stage | Mature | Rapidly developing, heavily researched | LDES is a U.S. DOE earthshot initiative |
| Capital cost | High | High today | LDES costs are rapidly decreasing |
| Cycle life | Degrades with use | Generally stable | |
| Round trip efficiency (RTE) | Very high: 85-90% | Generally low: 45-60% | |
| Energy density | High | Unknown: generally much less than Li-ion | LDES at maturity may match Li-ion |
| System weight | Low | Variable, often high | |
| Flammability | High | Are typically aqueous-based and so nonflammable | Nonflammable Li-ion is emerging |
| Low temperature stability | Good to -20∘C | Generally good to 0∘C | Many LDES are aqueous-based and will freeze |
The usual value proposition and design criteria derived from the energy storage cost and performance framework do not directly translate to the South Pole analysis presented here, but the technology maturity and market focus directly impacts the availability of options. Li-ion cost and performance projections are readily available, for example from the DOE annual report used in this analysis [39]. LDES emerging technologies are not presently characterized with a dependable similar annual compendium. As such, the LDES information considered here is gathered using two approaches. First, cost and performance values are obtained from detailed discussions with specific LDES companies that are in early large-scale deployments and thus can offer projections for the next 5-10 years. Second, DOE earthshot cost targets are used as a guide to general aspirational values [40]. Projected values from the companies were compared to the DOE target and in some cases found to be approximately consistent. The data from these companies are therefore used for two cases of the system-wide optimization described in the following section.
Total ES cost is a combination of up-front capital cost and the shipping cost to the South Pole site. The latter depends on the energy density (in Wh/kg) of the ES technology. There is a large disparity today in energy density for Li-ion and LDES technologies. Li-ion was initially developed for consumer electronics and transportation where high energy density is critically important whereas LDES is optimized for lower cost but not for energy density. Li-ion generally has higher energy density compared to LDES and therefore significantly lower total weight and subsequent shipping cost. Additional discussion of these cost impacts can be found in Section 3.2. As a result of these considerations, we evaluate both short- and long-duration approaches to energy storage in this analysis.
3 Optimization of the Hybrid System using REopt
The REopt™ techno-economic decision support platform is used to analyze options for a South Pole hybrid energy system [41]. REopt’s development has occurred over 15 years, evolving from its inception as spreadsheet model to a complex, open-source, mixed-integer linear program accessible as an API or through a web-based user interface. REopt identifies the optimal mix of renewable energy, conventional generation, and energy storage technologies to meet objectives of cost savings, resilience, emissions reductions, and energy performance. REopt generates least-cost options for serving an identified load based on costs and performance of generation estimations for the South Pole. The technologies considered in this analysis include diesel power, solar photovoltaics (PV), wind turbine generators (WTG), and both short- and long-duration electricity battery energy storage systems (BESS).
The South Pole model has one-hour time steps for a single year of load, wind, and solar resources. PV, WTG, and BESS technology sizes and the hourly system dispatch are optimized to minimize total lifecycle costs. In this analysis, a 15-year economic analysis period is used. Costs and savings occurring in the analysis period are discounted using standard economic principles to determine life-cycle cost and net present value, defined as the lifetime savings compared to an all-diesel case, for each scenario. A simple payback period is also calculated. Finally, key outputs on avoided diesel fuel consumption and emissions are generated.
3.1 Overview of Scenarios
A cost-benefit analysis for multiple configurations of renewable technology is performed. To create a baseline for comparison, REopt is first run assuming all power is provided by an existing central diesel plant. Several different combinations of both generation and storage technologies are explored including configurations with and without the use of diesel fuel. Table 2 defines the mix of technologies for each of the scenarios modeled. All scenarios are compared to the business-as-usual (BAU) case where power is only supplied by an existing diesel power plant.
| Scenario Label | ||||||
| Technology | BAU | A | B | C | D | E |
| Diesel | ||||||
| PV | ||||||
| WTG | ||||||
| Li-ion BESS | ||||||
| LDES BESS | ||||||
Renewable energy and BESS scenarios that include diesel generation are also modeled with and without constraints on total diesel consumption to inform cost-benefit considerations of achieving higher shares of renewable energy contribution above the least-cost solution. Additionally, sensitivity to diesel fuel cost, diesel plant fuel economy, and LDES performance and cost assumptions are evaluated. These sensitivities are further discussed in Section 4.1.
3.2 System-wide Assumptions
A steady-state power demand of 170 kW is modeled across a full year. This level is a representative example that is selected based on the predicted load from a future large scientific experiment planned for the South Pole station666private communication. The renewable energy generation profiles for solar and wind described in Section 2 are input into the techno-economic optimization. The technical performance and costs of all generation options are also entered into REopt. Key costs and economic parameters for this analysis are included in Table 3. Costs include the total installed cost estimates and on-going maintenance cost estimates to assure the systems will operate reliably after commissioning. PV and Li-ion BESS costs are based on cost models that inform NREL’s Annual Technology Baseline [42]. These are bottoms-up models that contain all major system and installation components for a given architecture. Parameters include (but are not limited to) equipment cost, installation time and labor rate estimates, overhead, contingency, profit, and sales tax. Each parameter was reviewed for the South Pole specific context with key adjustments made to labor rates and durations, development costs, profit, and added transportation cost. WTG capital cost is separately estimated based on a NPS 100C-24 model.
| Parameter | Value | Annual Maintenance Cost | Additional Factors |
| Power demand | 170 kW | Constant | |
| Diesel fuel cost | $40/gallon delivered | 2.7% annual escalation rate | |
|
Diesel plant fuel
economy |
12 kWh/gallon | Marginal fuel economy | |
| PV cost | $5,330/kW-DC installed | $42.50/kW-DC | 0.5% annual degradation |
| Wind turbine cost | $9,670/kW installed | $230/kW | |
| BESS, Li-ion cost |
$1,910/kW
+ $840/kWh installed |
97.5% RTE,
DC-DC
96% inverter & rectifier efficiences 20% minimum state-of-charge |
|
| BESS, LDES cost |
$1,810/kW
+ $860/kWh installed |
55% RTE,
DC-DC
96% inverter & rectifier efficiences 10% minimum state-of-charge |
|
| Analysis period | 15 years | ||
| Discount rate | 3% | ||
|
Inflation rate
|
2.5% | non-fuel maintenance |
Costs for all renewable technologies include the estimated procurement and total installation costs based on assumed labor rates and hours. Labor hours for both PV and Li-ion BESS are doubled compared to a North American standard to adjust for South Pole conditions. Installation cost estimates for the WTG are based on initial turbine foundation concepts, modeled on what was used for the McMurdo Station wind turbines, including shipping for pre-cast turbine footings and extended installation timelines. As with PV and Li-ion BESS, a significant cost premium is added to account for deployment at the South Pole including shipping, additional installation costs, and increased labor rates and hours. An additional premium is also added to standard annual operations and maintenance costs, including expanded equipment monitoring which would be required at such a location. LDES total installed costs are developed by consulting with industry to estimate price at ’factory gate’ and then entering those procurements costs into the same bottoms-up model used for PV and Li-ion previously mentioned. Although the LDES energy storage procurement prices are estimated to be significantly lower than Li-ion battery packs, when balance of system costs, including power electronics, engineering, shipping to the South Pole, and installation labor are included, their total installed costs are similar. Finally, the cost of diesel power generation is limited to the cost of the fuel, which is roughly estimated based on a 2012 cost [8] and subsequent inflation rates to extrapolate to 2023. Fuel economy is based on evaluation of vendor catalogs for diesel engine-generators and review of remote power system performance in rural Alaskan communities777https://www.akenergyauthority.org/What-We-Do/Power-Cost-Equalization/PCE-Reports-Publications.
Total installed costs also include South Pole shipping costs based on estimated weights of the equipment. The contribution of shipping to the South Pole to the total installed cost is significant. Table 4 breaks out the shipping costs from procurement and installation assuming $19.8/kg for delivery to the South Pole site, which is roughly estimated using standard inflation factors and cost from previous economic analysis of cargo transportation [43]. The incremental shipping costs for BESS power electronics are assumed to be captured in the energy storage capacity (kWh) shipping costs.
| Technology | Procurement & installation cost, less shipping | Estimated shipped weight (kg per unit) | Shipping cost | Total modeled installed cost |
| PV ($/kW-DC) | $2,090 | 160 | $3,240 | $5,330 |
| Wind ($/kW-AC) | $3,900 | 290 | $5,770 | $9,670 |
| BESS Li-ion ($/kW) | $1,910 | 0 | $0 | $1,910 |
| BESS Li-ion ($/kWh) | $680 | 8 | $160 | $840 |
| BESS LDES ($/kW) | $1,810 | 0 | $0 | $1,810 |
| BESS LDES ($/kWh) | $370 | 25 | $490 | $860 |
For additional context of the economic environment, the levelized costs of energy (LCOE) for diesel generated electricity, PV, and wind power are shown in Table 5. LCOE is a common cost metric to allow comparison across technology options. Levelized cost calculations generally include the total installed costs, maintenance costs, annual production, and useful life of the asset. However, the LCOE for diesel generation shown in Table 5 is based on the fuel costs alone. It does not include any incremental investment that might be needed for additional diesel generation capacity nor non-fuel generator operations and maintenance costs.
| Technology | Levelized Cost of Energy |
| ($/kWh) | |
| Diesel generation, fuel only | $4.09 |
| PV | $0.23 |
| Wind | $0.33 |
The LCOEs for South Pole demonstrate how expensive electricity currently is there due to the high costs for diesel fuel and thus the economic impetus for integrating PV and wind power. The economic model shows the value of integrating BESS to facilitate greater shares of PV and wind to offset the more expensive diesel generation. Integrating BESS will also provide additional critical services in a power system that this model does not consider, including, among others, ramp rate management of variable renewable energy, operating reserve to cover resource uncertainty, short circuit contribution for system protection devices, and improved power quality.
4 Results of REopt Analysis
For each scenario enumerated in Section 3.1 REopt optimizes the technology sizes needed to meet the input load over the course of the year for the least cost. Figure 6 shows an example dispatch model that meets the required load as a function of time for scenario C. The impact of the polar longitude is clearly visible in the PV generated power present during the austral summer months that then diminishes as the sun sets below the horizon. WTG power is available throughout the year, but BESS or diesel generated power is required for periods of diminished wind. The bottom panel of Figure 6 shows the curtailed energy of the system. This is excess energy that could be generated in addition to that dispatched to the electrical load or used to recharge the BESS. For the purpose of this analysis no economic value is given to curtailed energy.
| Diesel | Diesel, PV, Li-ion | Diesel, Wind, Li-ion | Diesel, PV, Wind, Li-ion | PV, Wind, Li-ion | Diesel, PV, Wind, LDES | |
| BAU | A | B | C | D | E | |
| Life-cycle cost ($M, discounted) | $72.8 | $47.5 | $18.9 | $14.9 | $19.4 | $15.9 |
| Net present value ($M) | - | $25.3 | $53.9 | $57.8 | $53.3 | $56.8 |
| Capital expenditure ($M) | - | $3.8 | $10.7 | $9.7 | $17.4 | $8.9 |
| Simple payback (years) | - | 1.9 | 2.4 | 2.1 | 3.6 | 2.0 |
| PV system size (kW-DC) | - | 680 | - | 180 | 120 | 200 |
| Wind system size (kW) | - | - | 780 | 570 | 600 | 580 |
| BESS power (kW) | - | 50 | 200 | 180 | 180 | 200 |
| BESS energy (kWh) | - | 110 | 3,310 | 3,410 | 12,570 | 2,210 |
| Hours of storage | - | 2.3 | 16.9 | 18.9 | 70.1 | 10.9 |
| Annual fuel consumption (gallons) | 124,000 | 73,700 | 9,500 | 5,600 | 0 | 8,500 |
| Fuel reduction | 0 | 41% | 92 % | 96% | 100% | 93% |
| Annual avoided CO2 (metric tons) | 0 | 510 | 1,170 | 1,210 | 1,270 | 1,180 |
Results from modeling all technology configurations are presented in Table 6 and Figure 7. The baseline BAU configuration without integrating renewable energy and energy storage is estimated to require 124,000 gallons of fuel per year to meet the 170 kW electrical power requirement. Over a 15-year period, the BAU fuel costs are estimated to be $60 to $73M in present value terms. These are the benchmark parameters against which renewable energy and energy storage scenarios are compared and are shown in the first column of Table 6. Analysis results indicate that the all-diesel, BAU scenario, has the highest life-cycle cost. All architecture options with renewable energy reduce life-cycle costs below BAU and therefore result in positive net present values. The high cost of diesel fuel is driving high penetration of renewable energy in combination with BESS and results in estimated payback periods of two to four years.
Techno-economic models are a useful first step identifying technology options, indicating potential capacities, and for generating estimates of high-level costs and benefits. Techno-economic models are often revised iteratively to increase fidelity as projects move from concept, through detail design, and construction. South Pole conceptual results indicate that both PV and WTG are highly cost-effective, and inclusion of BESS should be considered to allow greater contributions of renewable energy.
The least-cost scenario shown in Table 6 is scenario C. Scenario C includes 180 kW-DC of PV, a total of six 100 kW wind turbines (rounding up the model result of 570 kW), and 180 kW / 3,400 kWh Li-ion BESS integrated with the existing diesel system. It has a net present value exceeding $57M. The $10M initial investment reduces diesel power consumption by 96% and has an approximately 2-year simple payback.
Scenario A only allows PV for renewable energy generation. Solar radiation is at a very low level of completely unavailable for a large fraction of the year, therefore, complete replacement of diesel generation with only PV is not possible. Excluding WTG reduces net present value by 56% below the best option, scenario C, but it is still a highly cost-effective option with a net present value of $25M. The scenario A PV system is almost four times larger than scenario C, at 683 kW-DC. The power generated by a system of a given size drops dramatically before sunset and after sunrise and a larger system is required to meet the same electrical load. The LCOE of PV is significantly lower than that of diesel and therefore when optimizing for lowest life-cycle cost REopt determines that is less expensive to build a larger PV system than supplying diesel during these periods. The BESS in this scenario is much smaller, around 50 kW for two hours, primarily serving to buffer fluctutions in solar generation due to cloud cover. Fuel savings in this scenario are about half as much as scenario C, 41% savings versus 96% respectively, but are still significant compare to BAU.
Similarly, scenario B only allows WTG for renewable energy generation. A total of eight turbines are required (rounding up the 780 kW) as well as a Li-ion BESS similar in size to that of scenario C. As seen in the PV-only scenario A, excluding an energy generation technology from the least-cost option reduces the net-present value. However, a WTG-BESS diesel hybrid system is significantly closer in total benefit to the least-cost scenario C with an NPV of $54M and fuel savings of 92% because wind-generated energy is available year round.
Scenario D shows an assessment of how the optimization results change if diesel-generated power is not allowed, i.e. the system is fully renewable with PV, WTG and Li-Ion BESS. To eliminate diesel fuel usage, the model slightly adjusts the PV and WTG sizing relative to the case where diesel is allowed. However, this scenario adds significantly larger BESS energy capacity of 12,600 kWh, more than 3.5 the capacity of a system with diesel power (scenario C). The initial capital investment of $17.4M is the highest of the investment scenarios, primarily due to the larger BESS. The system is still highly cost-effective with an NPV of $53M, approximately 8% less than that of the system with diesel. This can be considered the incremental cost to increasing the reduction in fuel consumption from 96% to 100%, and avoiding an additional 57 metric tons of CO2 emissions annually.
Finally, Scenario E captures the projected costs and benefits of using LDES instead of Li-ion BESS. The results across all scenarios, with the exception of A, trend towards longer duration energy storage motivating inclusion of LDES in this scenario. As shown in Table 4, LDES capital cost is approximately 55% the cost of Li-ion before shipping ($370 versus $680/kWh, respectively) but is assumed to weigh a factor of three more than Li-ion on a per kWh basis. Given the high costs of shipping to the South Pole, LDES total installed costs are slightly higher than Li-ion BESS. Combined with the lower assumed round-trip energy storage efficiency (shown in Table 2) LDES has reduced economic benefit relative to Li-ion. The cost optimal LDES solution is a smaller energy storage system than Li-ion (2,210 kWh versus 3,410 kWh) in scenario C and has a marginally lower NPV. Thus, the low RTE and energy density of LDES presently outweigh the significantly lower purchase price compared to Li-ion. As discussed in Section 2.3, LDES is an emerging technology and ongoing evaluation of the techno-economic performance is warranted as it matures.
4.1 Sensitivity to Assumptions
Several other scenarios have been explored with REopt to explore the sensitivity of the results to input assumptions and constraints on the renewable system. Of particular importance are the assumptions on cost of fuel at the South Pole as well as the fuel economy of diesel power generation. Two additional scenarios are explored, first with cost of delivered diesel fuel reduced to $30/gallon (scenario C1) and second with both reduced fuel cost and increased fuel economy of 14.6 kWh/gallon for displaced diesel generation (scenario C2) [44]. In both scenarios, the renewable technology system includes PV, WTG, and Li-ion BESS.
With lower cost fuel and more efficient diesel generation, there is still strong motivation for integrating renewable generation at the South Pole. Results for these alternative scenarios are given in Table 7 and a comparison shown in Figure 8. In scenario C1 and C2, the sizes of the PV and wind plants do not change significantly. Instead, the Li-ion BESS energy capacity is reduced by approximately a factor of two. Simple payback times remain less than three years and the annual fuel savings exceeds 90%. While the NPV does decrease with more conservative fuel assumptions as expected, the savings is still significant at $30M.
| Diesel, PV, Wind, Li-ion BESS | |||
| C | C1 | C2 | |
| Net present value ($M) | $57.8 | $40.7 | $31.8 |
| Capital expenditure ($M) | $9.7 | $7.9 | $7.5 |
| Simple payback (years) | 2.1 | 2.4 | 2.8 |
| PV system size (kW-DC) | 180 | 190 | 200 |
| Wind system size (kW) | 570 | 520 | 500 |
| BESS power (kW) | 180 | 160 | 140 |
| BESS energy (kWh) | 3,410 | 1,820 | 1,570 |
| Hours of storage | 18.9 | 11.8 | 11.4 |
| Annual fuel consumption (gallons) | 5,600 | 9,400 | 8,700 |
| Fuel reduction | 96% | 92% | 92% |
| Annual avoided CO2 (metric tons) | 1,210 | 1,170 | 1,180 |
Another sensitivity explored is the sizing of the PV system, which is nearly a factor of four larger in scenario A compared to scenario C driven by periods of low solar resource availability. To this end, an artificial constraint is imposed to only include the austral summer months between November 1 to Jan 31, when the sun is farther above the horizon. A hybrid system with PV and diesel energy generation and Li-ion BESS is modeled under this constraint, resulting in a PV system size of 350 kW and a 30 kWh BESS. A second model is then generated with the technology sizes fixed at these values but calculating the energy generated over the full year. This smaller system will reduce diesel consumption by 36% (compared to 41% in scenario A), with a capital cost of $1.9M and an NPV of $23.8M. This result indicates that a majority of the benefit from a hybrid system with PV only renewable generation can be reaped from a smaller system with a lower capital cost.
Finally, the sensitivity to the cost of LDES is considered by modeling a futuristic case where the LDES energy cost is reduced by 60% compared to scenario E. The energy density is also assumed to be a factor of nine times denser. As noted in Section 3.2, the total installed cost for LDES is dominated by balance of system and shipping costs. Under these assumptions, the optimized model is a system with PV and WTG sizes similar to scenario E. The size of the LDES system increases significantly, both in power and energy capacity, although somewhat surprisingly reducing the diesel consumption only by an additional 2.6% and slightly increasing NPV. This scenario is economically very similar to the more conservative LDES example suggesting that the system optimization is dominated overall by the energy generation components.
5 Conclusions
In this work we present a feasibility analysis for renewable power generation at the South Pole. Detailed solar and wind resource profiles for one year are generated using on-site meteorological data. A techno-economic optimization is performed using these profiles as well as highly tailored economic inputs, modeling the least-cost solution to generate 170 kW of electrical power for a period of 15 years. A hybrid renewable system consisting of PV solar panels, wind turbine generators, a Li-ion energy storage system integrated with an existing diesel system is able to reduce diesel fuel consumption by 95% resulting in a net present value of $57M. Such a system would require an initial capital investment of $9.7M dollars with a simple payback period of 2.1 years. Several additional scenarios are modeled, with results ranging from 40% -100% diesel fuel reduction and the associated decarbonization. In all scenarios, renewable energy generation is highly cost effective.
Realizing these benefits requires addressing several key technical challenges in the on-site implementation of renewable energy technology in the South Pole environment. Future work will focus on relevant engineering developments for each component. The PV system modeled here assumes the panels are installed as a standalone array as opposed to mounted on a building. Windblown snow creates drifts around buildings and other structures mounted on the snow at the South Pole [45]. A strategy for snow drift prevention and maintenance will be required to keep the panels fully operational and to reduce the general impact of drifts at the site. One of the main complications of Li-ion energy storage is its flammable nature. While not a unique concern for the South Pole, fire has amplified consequences at such a remote site. During the course of this study, emerging non-flammable Li-ion storage technology was identified and going forward should be preferentially evaluated to meet the storage needs. Additionally, continued tracking of already identified as well as nascent LDES technologies should occur.
Several elements of wind turbine implementation require development. As noted in Section 2.2 the predicted power generation profile for a wind turbine can be improved through collection of additional wind data at a height of 30 meters above the ground. A more complete wind resource assessment will also include combining this new data with an investigation of long-term trends in the existing meteorological data. Wind turbines also have the potential to produce electromagnetic interference (EMI) [46]. The South Pole Station includes the radio-quiet Dark Sector, which hosts scientific experiments that are EMI sensitive [47]. A detailed assessment of EMI from a turbine must be performed and a subsequent mitigation plan including location on site or turbine modifications will be necessary. Additionally, a fundamental assumption of the wind resource modeling is operation down to a lower temperature limit of -70∘ C. The turbine identified here was originally designed to meet that goal but is only currently guaranteed to a temperature of -40∘C. The turbine will need to be evaluated for modification and operation at the necessary lower temperatures demonstrated. Finally, the foundation design for the turbine will require development to determine the viability of a compacted snow foundation. A devoted campaign of engineering development has the potential to address the technical challenges noted here, which would pave the way for renewable energy resources and energy storage to become an integral part of decarbonized power generation at the South Pole.
Acknowledgements
Work at Argonne National Laboratory was supported under the U.S. Department of Energy contract DE-AC02-06CH11357. This work was authored in part by the National Renewable Energy Laboratory, operated by Alliance for Sustainable Energy, LLC, for the U.S. Department of Energy (DOE) under Contract No. DE-AC36-08GO28308. Data used in the solar modeling was obtained from the National Aeronautics and Space Administration (NASA) Langley Research Center (LaRC) Prediction of Worldwide Energy Resource (POWER) Project funded through the NASA Earth Science/Applied Science Program. The data was obtained from the POWER Project’s Hourly 2.3.2 version on 2022/11/04. We also acknowledge use of meteorological and radiation data collected by the NOAA Global Monitoring Laboratory (GML) at the South Pole observatory (SPO) covering the period from 2016-01-01 to 2016-12-31 and downloaded on 2022-12-02 from the World Radiation Monitoring Center - Baseline Surface Radiation Network (WRMC-BSRN) archive. We also acknowledge the use of wind data collected by the NOAA GML at the SPO covering the periods including 2003-01-01 to 2003-12-30 and 2008-02-01 to 2009-06-01. The views expressed in the article do not necessarily represent the views of the DOE or the U.S. Government. The U.S. Government retains and the publisher, by accepting the article for publication, acknowledges that the U.S. Government retains a nonexclusive, paid-up, irrevocable, worldwide license to publish or reproduce the published form of this work, or allow others to do so, for U.S. Government purposes.
References
- U.S. Department of Energy Solar Energy Technologies Office and National Renewable Energy Laboratory(2021) [DOE] U.S. Department of Energy (DOE) Solar Energy Technologies Office, National Renewable Energy Laboratory, Solar futures study, 2021. URL: https://www.energy.gov/sites/default/files/2021-09/Solar%20Futures%20Study.pdf.
- IEA [2021] IEA, Net zero by 2050: A roadmap for the global energy sector, 2021. URL: https://iea.blob.core.windows.net/assets/deebef5d-0c34-4539-9d0c-10b13d840027/NetZeroby2050-ARoadmapfortheGlobalEnergySector_CORR.pdf, license: [relevant CC license e.g. CC BY 4.0].
- Kintner-Meyer et al. [2010] M. Kintner-Meyer, G. Conzelmann, H. C. Kim, N. Zhou, P. DeStephano, S. Durga, A. Elgowainy, B. Hamilton, A. Kanudia, N. Khanna, Z. Khan, P. Kyle, V. Letschert, W. Feng, F. Feijoo, F. Flores, G. Giannakidis, F. Licandeo, H. McJeon, T. Reber, D. Rough, M. Westphal, E. Wright, Preliminary analysis of decarbonization pathways for five countries: the Net Zero World Initiative report series – 01, Technical Report PNNL-33619, Pacific Northwest National Laboratory, 2010.
- Secretariat of the Antarctic Treaty [1998] Secretariat of the Antarctic Treaty, Protocol on environmental protection to the Antarctic Treaty, 1998. URL: https://www.ats.aq/e/protocol.html, signed 1991, entered into force 1998.
- Lucci et al. [2022] J. J. Lucci, M. Alegre, L. Vigna, Renewables in Antarctica: an assessment of progress to decarbonize the energy matrix of research facilities, Antarctic Science 34 (2022) 374–388.
- Council of Managers of National Antarctic Programs [2017] Council of Managers of National Antarctic Programs, Antarctic station catalogue, 2017. URL: https://formaciondigital.tdf.gob.ar/wp-content/uploads/2021/02/COMNAP_Antarctic_Station_Catalogue.pdf.
- International Polar Foundation [2023] International Polar Foundation, Running on renewable energies, 2023. URL: http://www.antarcticstation.org/station/renewable_energies, accessed on May 26, 2023.
- U.S. Antarctic Program Blue Ribbon Panel [2012] U.S. Antarctic Program Blue Ribbon Panel, More and better science in Antarctica through increased logistical effectiveness, 2012. URL: https://www.nsf.gov/geo/opp/usap_special_review/usap_brp/rpt/antarctica_07232012.pdf.
- Australian Antarctic Program [2019] Australian Antarctic Program, First Australian solar farm in Antarctica opens at Casey research station, 2019. URL: https://www.antarctica.gov.au/news/2019/first-australian-solar-farm-in-antarctica-opens-at-casey-research-station/, accessed on May 26, 2023.
- de Christo et al. [2016] T. M. de Christo, J. F. Fardin, D. S. L. Simonetti, L. F. Encarnação, C. E. de Alvarez, Design and analysis of hybrid energy systems: The Brazilian Antarctic Station case, Renewable Energy 88 (2016) 236–246.
- Bockelmann et al. [2022] F. Bockelmann, A.-K. Dreier, J. Zimmermann, M. Peter, Renewable energy in Antarctica - photovoltaic for Neumayer Station III, Solar Energy Advances 2 (2022) 100026.
- Olivier et al. [2008] J. R. Olivier, T. M. Harms, D. J. Esterhuyse, Technical and economic evaluation of the utilization of solar energy at South Africa’s SANAE IV base in Antarctica, Renewable Energy 33 (2008) 1073–1084.
- Boccaletti et al. [2014] C. Boccaletti, P. Di Felice, E. Santini, Integration of renewable power systems in an Antarctic research station, Renewable Energy 62 (2014) 582–591.
- National Science Foundation et al.(2000)National Science Foundation (U.S.), Williams, and Rand [U.S.] National Science Foundation (U.S.), C. R. Williams, J. H. Rand, Evaluation of photovoltaic panels at the South Pole Station, Technical Report ERDC/CRREL TR-00-4, Cold Regions Research & Engineering Laboratory, 2000.
- Baring-Gould et al. [2005] I. Baring-Gould, R. Robichaud, K. McLain, Analysis of the use of wind energy to supplement the power needs at McMurdo Station and Amundsen-Scott South Pole Station, Antarctica, Technical Report NREL/TP-500-37504, National Renewable Energy Laboratory, 2005.
- Way et al. [2022] R. Way, M. C. Ives, P. Mealy, J. D. Farmer, Empirically grounded technology forecasts and the energy transition, Joule 6 (2022) 2057–2082.
- Stehly et al. [2020] T. Stehly, P. Beiter, P. Duffy, 2019 Cost of wind energy review, Technical Report NREL/TP-TP-5000-78471, National Renewable Energy Laboratory, 2020.
- Wiser and Bolinger [2021] R. Wiser, M. Bolinger, Land-based wind market report: 2021 edition, Lawrence Berkeley National Laboratory for the Wind Energy Technologies Office of the U.S. Department of Energy’s Office of Energy Efficiency and Renewable Energy, 2021.
- Feldman et al. [2021] D. Feldman, V. Ramasamy, R. Fu, A. Ramdas, J. Desai, R. Margolis, U.S. Solar photovoltaic system and energy storage cost benchmark:Q1 2020, Technical Report NREL/TP-6A20-77324, National Renewable Energy Laboratory, 2021.
- [20] B. N. E. F. (BNEF), Powering the EV revolution — battery packs now at $156/kwh, 13% lower than 2018, finds BNEF, 2019. URL: https://cleantechnica.com/2019/12/04/powering-the-ev-revolution-battery-packs-now-at-156-kwh-13-lower-than-2018-finds-bnef/, accessed May 26, 2023.
- Mosley-Thompson et al. [1995] E. Mosley-Thompson, L. G. Thompson, J. F. Paskievitch, M. Pourchet, A. J. Gow, M. Davis, J. Kleinman, Recent increase in South Pole snow accumulation, Annals of Glaciology 21 (1995) 131–138.
- Mefford et al. [1996] T. Mefford, M. Bieniulis, B. Halter, J. Peterson, Meteorological measurements, Technical Report in CDML Summary Report 1994-1995, 1996. URL: https://gml.noaa.gov/publications/summary_reports/summary_report_23.pdf.
- Carroll and Fitch [1981] J. J. Carroll, B. W. Fitch, Effects of solar elevation and cloudiness on snow albedo at the South Pole, Journal of Geophysical Research: Oceans 86 (1981) 5271–5276.
- Ayala Pelaez and Deline [2020] S. Ayala Pelaez, C. Deline, bifacial_radiance: a python package for modeling bifacial solar photovoltaic systems, Journal of Open Source Software 5 (2020) 1865.
- Holmgren et al. [2018] W. F. Holmgren, C. W. Hansen, M. A. Mikofski, pvlib python: a python package for modeling solar energy systems, Journal of Open Source Software 3 (2018) 884.
- Urrejola et al. [2020] E. Urrejola, F. Valencia, E. Fuentealba, C. Deline, S. Ayala Pelaez, J. Meydbray, T. Clifford, R. Kopecek, J. S. Stein, bifiPV2020 bifacial workshop: a technology overview, Technical Report NREL/TP-5K00-77817, National Renewable Energy Laboratory, 2020.
- Anderson et al. [2023] B. Anderson, R. Jordan, I. Baring-Gould, Distributed renewables for Arctic energy: a case study, Technical Report NREL/TP-5000-84391, National Renewable Energy Laboratory, 2023.
- Holdmann et al. [2022] G. Holdmann, D. Pride, G. Poelzer, B. Noble, C. Walker, Critical pathways to renewable energy transitions in remote Alaska communities: A comparative analysis, Energy Research & Social Science 91 (2022) 102712.
- de Witt et al. [2021] M. de Witt, H. Stefánsson, Ágúst Valfells, J. N. Larsen, Energy resources and electricity generation in Arctic areas, Renewable Energy 169 (2021) 144–156.
- Baring-Gould and Dabo [2009] I. Baring-Gould, M. Dabo, Technology, performance, and market report of wind-diesel applications for remote and island communities, NREL/CP-500-45810, 2009. Presented at WINDPOWER 2009 Conference and Exhibition.
- Riihimaki et al. [2023] L. Riihimaki, C. E. Long, E. G. Dutton, J. Michalsky, Basic and other measurements of radiation at station South Pole (1992-01 et seq), 2023. URL: https://doi.org/10.1594/PANGAEA.956847. doi:10.1594/PANGAEA.956847.
- Lynch et al. [2004] J. Lynch, G. Bywaters, D. Costin, S. Hoskins, P. Mattila, J. Stowell, Turbine research program cold weather turbine project, Technical Report NREL/SR-500-36289, 2004.
- S Johnson [2015] A. S Johnson, Inside (literally) wind turbines meant to work at the South Pole—and Mars, 2015. URL: https://arstechnica.com/science/2015/11/inside-literally-wind-turbines-meant-to-work-at-the-south-pole-and-mars/, accessed on May 26, 2023.
- IEA Wind TCP Task 19 [2017] IEA Wind TCP Task 19, Wind energy projects in cold climates, 2017. URL: https://iea-wind.org/wp-content/uploads/2021/09/2017-IEA-Wind-TCP-Recommended-Practice-13-2nd-Edition-Wind-Energy-in-Cold-Climates.pdf.
- Blaisdell and Weale [2006] G. L. Blaisdell, J. C. Weale, Settlement of a foundation on a permanent, deep snowpack, Technical Report ERDC/CRREL TR-06-3, Cold Regions Research & Engineering Laboratory, 2006.
- Carlstrom et al. [2011] J. E. Carlstrom, P. A. R. Ade, K. A. Aird, B. A. Benson, L. E. Bleem, S. Busetti, C. L. Chang, E. Chauvin, H.-M. Cho, T. M. Crawford, A. T. Crites, M. A. Dobbs, N. W. Halverson, S. Heimsath, W. L. Holzapfel, J. D. Hrubes, M. Joy, R. Keisler, T. M. Lanting, A. T. Lee, E. M. Leitch, J. Leong, W. Lu, M. Lueker, D. Luong-Van, J. J. McMahon, J. Mehl, S. S. Meyer, J. J. Mohr, T. E. Montroy, S. Padin, T. Plagge, C. Pryke, J. E. Ruhl, K. K. Schaffer, D. Schwan, E. Shirokoff, H. G. Spieler, Z. Staniszewski, A. A. Stark, C. Tucker, K. Vanderlinde, J. D. Vieira, R. Williamson, The 10 meter South Pole Telescope, Publications of the Astronomical Society of the Pacific 123 (2011) 568.
- U.S. Department of Energy et al. [2022] U.S. Department of Energy, M. Mann, V. Putsche, B. Shrager, Grid energy storage: Supply chain deep dive assessment, 2022. URL: https://www.energy.gov/sites/default/files/2022-02/Energy%20Storage%20Supply%20Chain%20Report%20-%20final.pdf.
- Albertus et al. [2020] P. Albertus, J. S. Manser, S. Litzelman, Long-duration electricity storage applications, economics, and technologies, Joule 4 (2020) 21–32.
- Viswanathan et al. [2022] V. Viswanathan, K. Mongird, R. Franks, X. Li, V. Sprenkle, R. Baxter, 2022 Grid energy storage technology cost and performance assessment, Technical Report PNNL-33283, Pacific Northwest National Laboratory, 2022.
- U.S. Department of Energy’s Research Technology Investment Committee, Energy Storage Submcommittee [2020] U.S. Department of Energy’s Research Technology Investment Committee, Energy Storage Submcommittee, Energy storage grand challenge roadmap, 2020. URL: https://www.energy.gov/sites/default/files/2020/12/f81/Energy%20Storage%20Grand%20Challenge%20Roadmap.pdf.
- Cutler et al. [2017] D. Cutler, D. Olis, E. Elgqvist, X. Li, N. Laws, N. DiOrio, A. Walker, K. Anderson, REopt: a platform for energy system integration and optimization, Technical Report NREL/TP-TP-7A40-70022, National Renewable Energy Laboratory, 2017.
- Ramasamy et al. [2022] V. Ramasamy, J. Zuboy, E. O’Shaughnessy, D. Feldman, J. Desai, M. Woodhouse, P. Basore, R. Margolis, U.S. solar photovoltaic system and energy storage cost benchmarks, with minimum sustainable price analysis: Q1 2022, Technical Report NREL/TP-7A40-83586, National Renewable Energy Laboratory, 2022.
- Lever and Thur [2014] J. H. Lever, P. Thur, Economic analysis of the South Pole traverse, Technical Report ERDC/CRREL TR-14-7, Cold Regions Research & Engineering Laboratory, 2014.
- Mason [2007] J. Mason, Photovoltaic energy at South Pole Station, Postgraduate Certificate in Antarctic Studies, University of Canterbury, 2007. URL: https://ir.canterbury.ac.nz/handle/10092/14220.
- Allen et al. [2022] L. Allen, R. Haehnel, Y. Wenren, South Pole Station snowdrift model, Technical Report ERDC/CRREL TR-22-7, Cold Regions Research & Engineering Laboratory, 2022.
- Winkel and Jessner [2019] B. Winkel, A. Jessner, Compatibility between wind turbines and the radio astronomy service, Journal of Astronomical Instrumentation 8 (2019) 1940002.
- Secretariat of the Antarctic Treaty [2017] Secretariat of the Antarctic Treaty, Management plan for Antarctic Specially Managed Area No.5 AMUNDSEN-SCOTT SOUTH POLE STATION, SOUTH POLE, 2017. URL: https://documents.ats.aq/recatt/att617_e.pdf, adopted 2007, updated 2017.