Topological learning for the classification of disorder: an application to the design of metasurfaces
Abstract
Structural disorder can improve the optical properties of metasurfaces, whether it is emerging from some large-scale fabrication methods, or explicitly designed and built lithographically. Correlated disorder, induced by a minimum inter-nanostructure distance or by hyperuniformity properties, is particularly beneficial in some applications such as light extraction. We introduce numerical descriptors inspired from topology to provide quantitative measures of disorder whose universal properties make them suitable for both uncorrelated and correlated disorder, where statistical descriptors are less accurate. We prove theoretically and experimentally the accuracy of these topological descriptors of disorder by using them to design plasmonic metasurfaces of controlled disorder, that we correlate to the strength of their surface lattice resonances. These tools can be used for the fast and accurate design of disordered metasurfaces, or to help tuning large-scale fabrication methods.
keywords:
Metasurface, Surface lattice resonance, topological data analysis, plasmonic, disorder, design, optimisationMath]Mathematical Sciences, University of Southampton, Southampton SO17 1BJ, United Kingdom QLM]Physics and Astronomy, University of Southampton, Southampton SO17 1BJ, United Kingdom ORC]Optoelectronics Research Centre and Centre for Photonic Metamaterials, University of Southampton, Southampton SO17 1BJ, UK Math]Mathematical Sciences, University of Southampton, Southampton SO17 1BJ, United Kingdom QLM]Physics and Astronomy, University of Southampton, Southampton SO17 1BJ, United Kingdom \abbreviationsSLR,TDA
Metasurfaces are two-dimensional metamaterials with subwavelength scattering elements designed to have electromagnetic properties unobtainable from bulk materials1. However, their designs usually require expensive and time consuming fabrication methods, such as lithography, limiting their large-scale and large surface area production. In order to circumvent these limitations, extensive work is being conducted to devise quicker and less expensive fabrication methods for large-scale metasurfaces, usually at the cost of emerging structural disorder. Some examples are gas-phase cluster beam deposition2, nanosphere photolithography3 or lithography free fabrication methods4, such as bottom up self assembled systems5, 6, 7, 8, 9, colloid deposition10 or polymer phase separation11, 12, 13.
While the emergence of structural disorder is usually thought as being an unavoidable downside of these fabrication methods, some photonic based applications actually benefit from it 14. Indeed positional disorder helps to tune 15, 16, 17 or reduce the diffraction18, scattering19, reflection 6, 8 or radiation 17, 20 of metasurfaces, with potential applications in the fabrication of better displays 21. Disorder can also suppress grating effects22 , make surface-enhanced Raman scattering broadband11, enhance localised photoluminescence 23,improve wavefront shaping 24, 25, improve light absorption26, 27,e.g. for solar cells12, or light extraction 28, 5. For example, coating the air-LED interface with disordered nanostructures provides a broadband coupling between what would have been internally trapped photons to the external radiation, making more energy efficient LEDs2. In some of these fields, correlated disorder seems to be particularly important. Indeed, a correlation length, either induced by a minimum distance between the nanostructures, or by some stealthy hyperuniformity properties helps to create metasurfaces with broader absorption bands26, broader diffusive properties 19 or prevent light trapping between nanostructures for more efficient light extraction28.
The different applications of disordered metasurfaces lead to more recent effort to tailor disorder for specific desired optical properties 29, 30, 31, 32, for example using inverse design methods 33, 34 based on machine learning 35, 36 or via topology optimisation 37, 38. Indeed, combining disorder engineering and topology optimisation one can build metasurfaces with selective light polarisation conversion while minimising the in-plane phase fluctuation 39. While these methods directly generate optimised disordered patterns, they can be time consuming and computationally expensive to implement. In some cases, knowing the link between disorder and the optical properties of a metasurface could significantly speed up the design process by restricting the optimisation to the degree of disorder of a metasurface. However, despite many methods existing to quantify disorder, they all have their strength and weaknesses and are only relevant for specific applications 32. In this work, we present new topology inspired numerical tools suitable for the characterisation of disordered metasurfaces. Their universality makes them useful for the characterisation of both correlated and uncorrelated disorder, and can be used either for the characterisation of disordered metasurfaces built with techniques similar to those mentioned above, or for the fast and accurate design of metasurfaces of specific disorder levels. We demonstrate the relevance of these tools by designing and fabricating metasurfaces made of plasmonic nanostructures embedded in dielectric media whose structural correlated disorder is related to the strength of their surface lattice resonances (SLR).
1 Results and discussion
We first present a generalised model of disorder generation. We show that a large correlation length may lead to potentially ambiguous designs, where the degree of disorder is poorly represented by the generative/statistical parameters, hinting to the need for better disorder descriptors. We then introduce the field of Topological Data Analysis (TDA) and the tools required to characterise metasurfaces. Using them, we show that correlated disordered metasurfaces are poorly represented by their generative parameters, while being suitably described by these topological descriptors. We then prove the characterisation accuracy and predictive properties of these tools by designing metasurfaces with specific disorder levels, first theoretically then experimentally.
1.1 Models of correlated and uncorrelated disorder
A recent work17 presented a model of disorder to study how correlated and uncorrelated disorder influences the far-field optical response of a metasurface. We apply our characterisation of disorder on their model that we reintroduce here.
Starting with a regular lattice, such as a square lattice of period made of nanostructures whose positions are defined by , we can define correlated and uncorrelated disorder as follows. Each nanostructure position is modified by a random vector whose and components are generated from a continuous uniform probability distribution bounded by . The non dimensional parameter determines the strength of the uncorrelated disorder. A correlation length can be implemented by adding to the uncorrelated disorder of nearby nanostructures, indexed by , weighted according to how far they are with a factor ,
| (1) |
with the distance between the nanostructure and , including the uncorrelated disorder applied to and . The correlation length is given by the full width at half maximum of which is equal to , which is proportional to the non dimensional parameter . The total disorder perturbation can be summarised as:
| (2) |
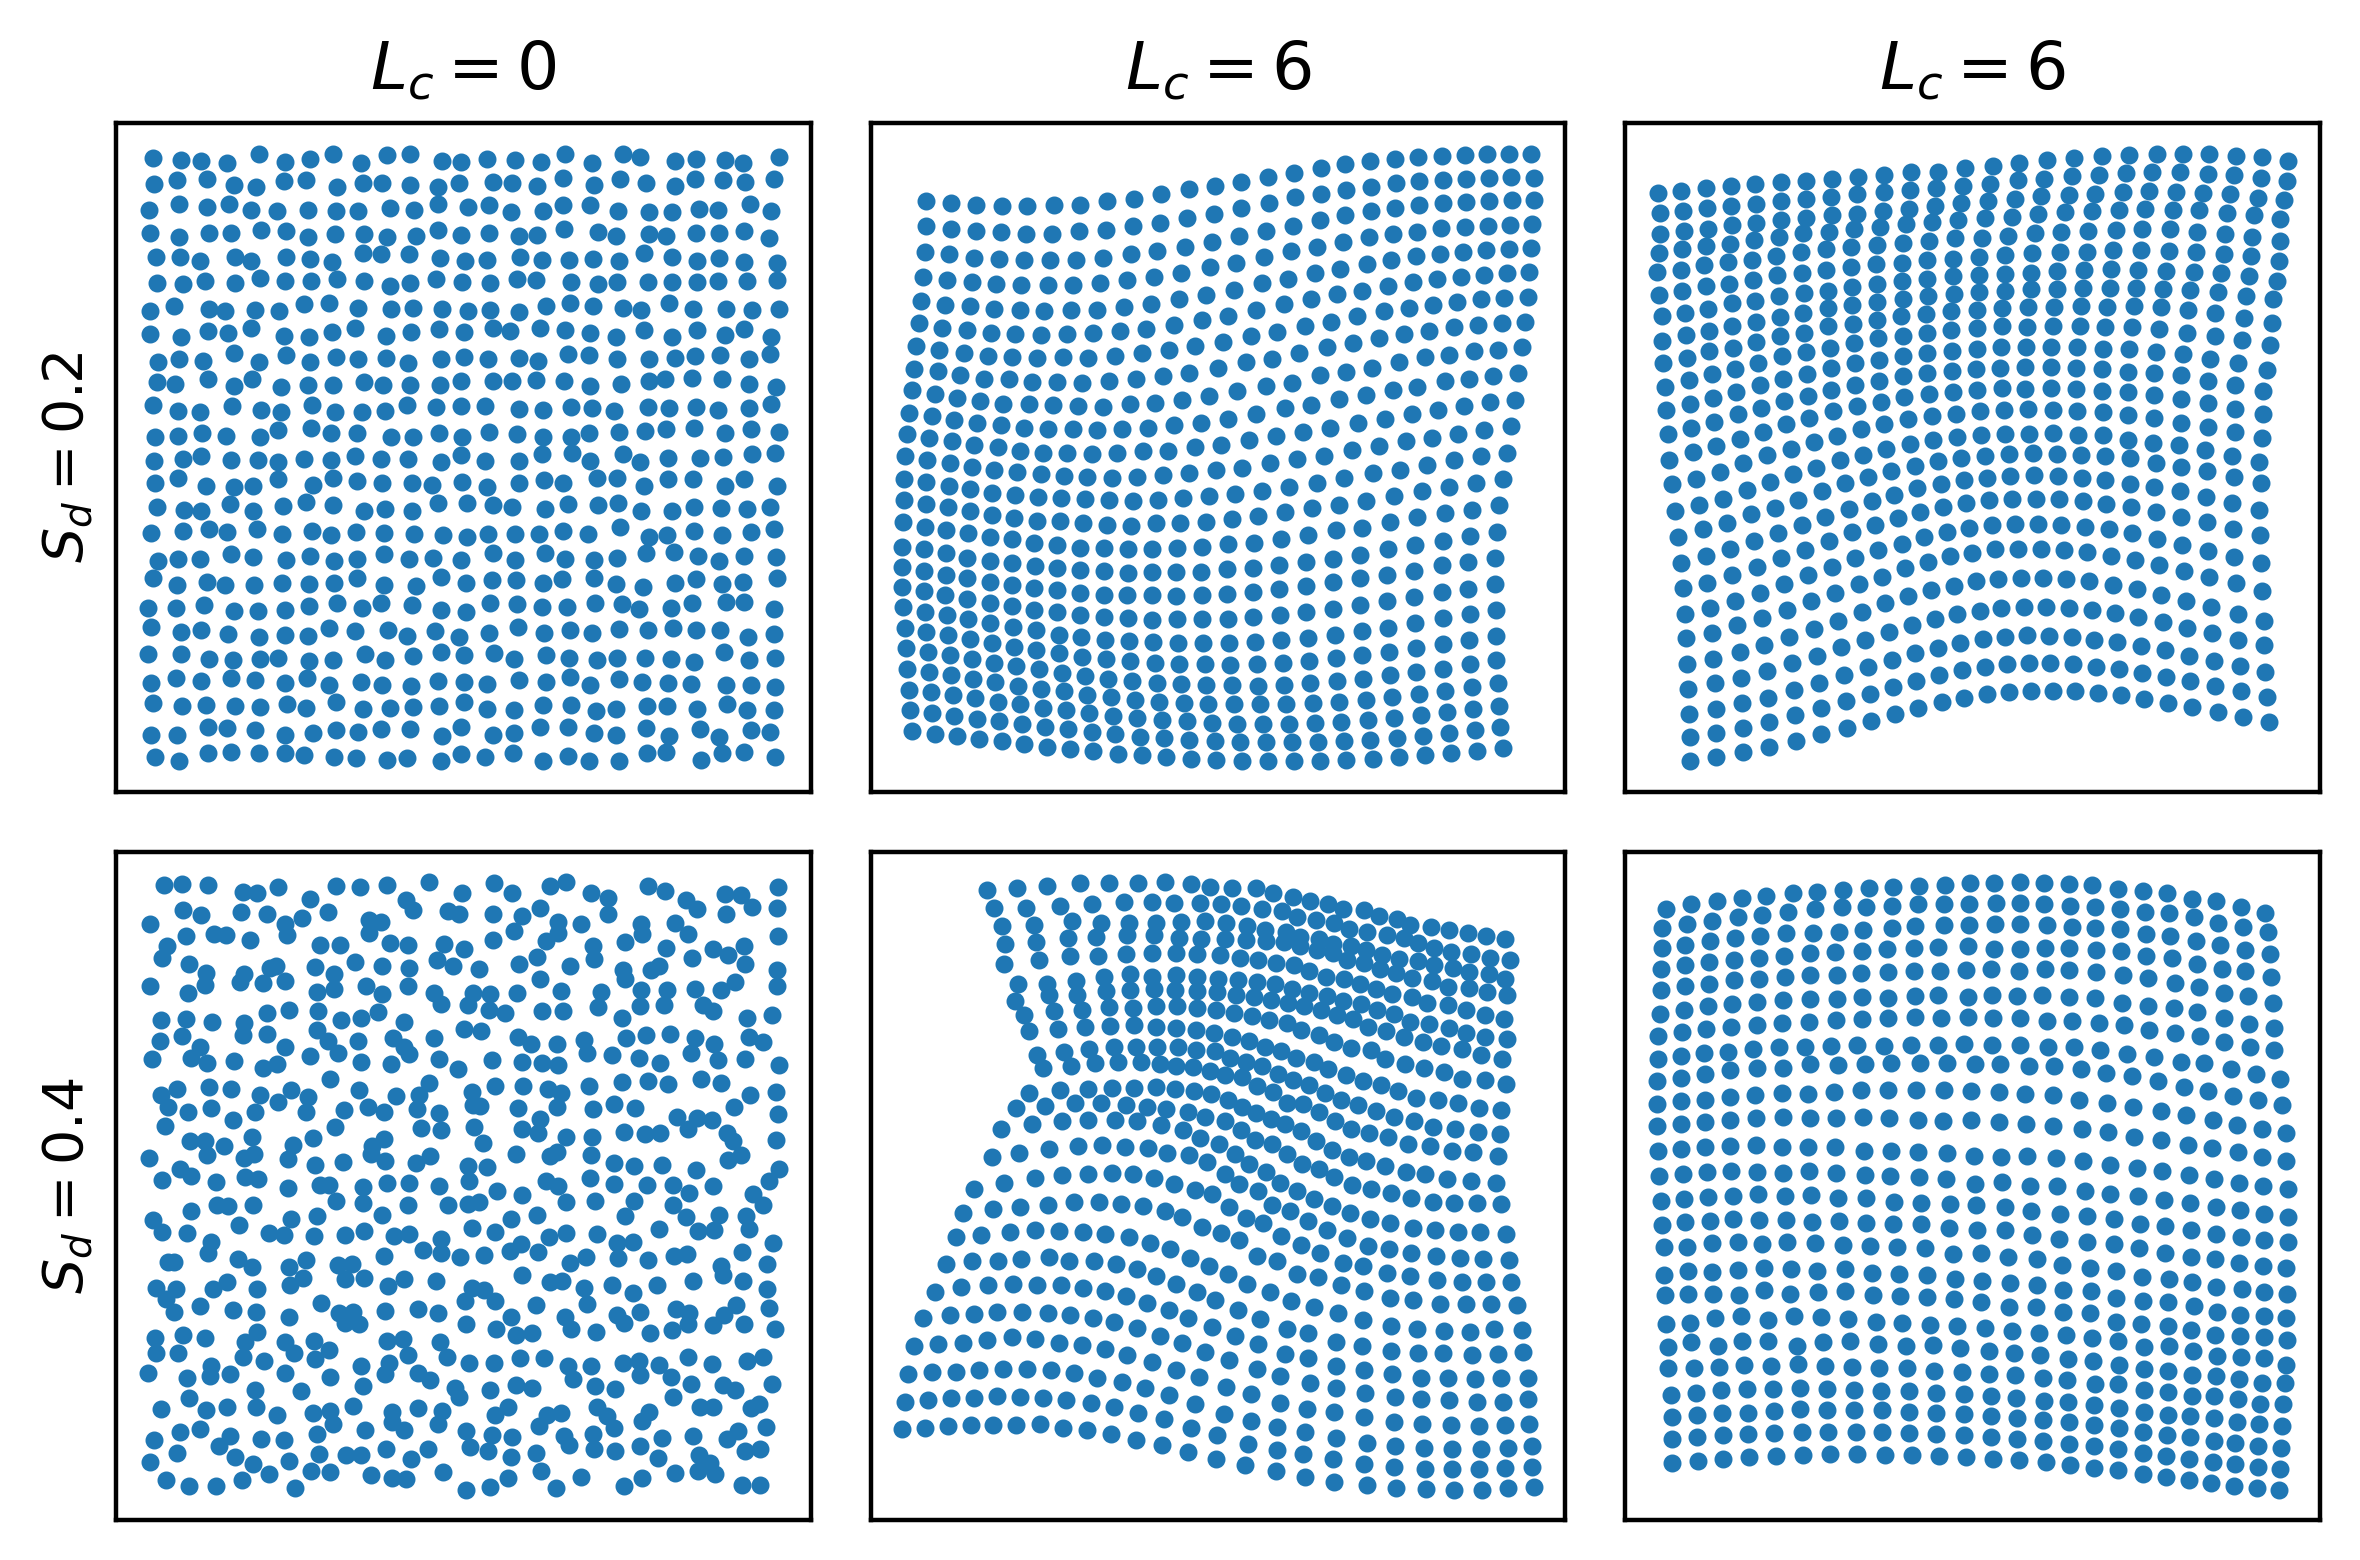
Using the expression (2), we generated lattices with varying values of and , see figure 1. On the lef column of figure 1, one can visually appreciate that the strength of uncorrelated disorder, for , is well represented by . Adding a correlation length, for example in the middle and right columns of figure 1 makes the lattices’ distortion smoother. However, if one can still guess that the middle column, bottom lattice is more disordered than the middle column, top lattice, as they were respectively generated with and , this is not systematically the case. Indeed, the lattices in the right column were generated with the same parameters and as in the middle column, however the relative disorder strength of these two lattices is ambiguous.
While a correlation length makes the generative parameter less accurate to represent the positional disorder of a lattice, it also destroys the information about the original regular lattice by inducing collective movements of the lattice’s points. This makes a statistical description of correlated disordered lattices much harder due to not having a reference lattice to compare them to. In order to circumvent these constraints, we introduce topology inspired numerical tools allowing to compare lattices with each other in a way that highlights the influence of a correlation length and provides a more accurate measure of disorder than .
1.2 Topological characterisation of disorder
Topological Data Analysis (TDA) is a collection of tools inspired from topology and geometry designed to provide qualitative and quantitative descriptors of structures in datasets. It has had various applications in different fields ranging from cosmology40, 41 to solid state physics 42, 43, 44, 45, 46. One of its sub-fields, persistent homology, is particularly efficient to recover the scale of topological features. We provide here a brief description of the procedure. Interested readers can find detailed introductory notes47, 48 and the whole process can be executed using standard libraries such as GUDHI49 or Ripser50.
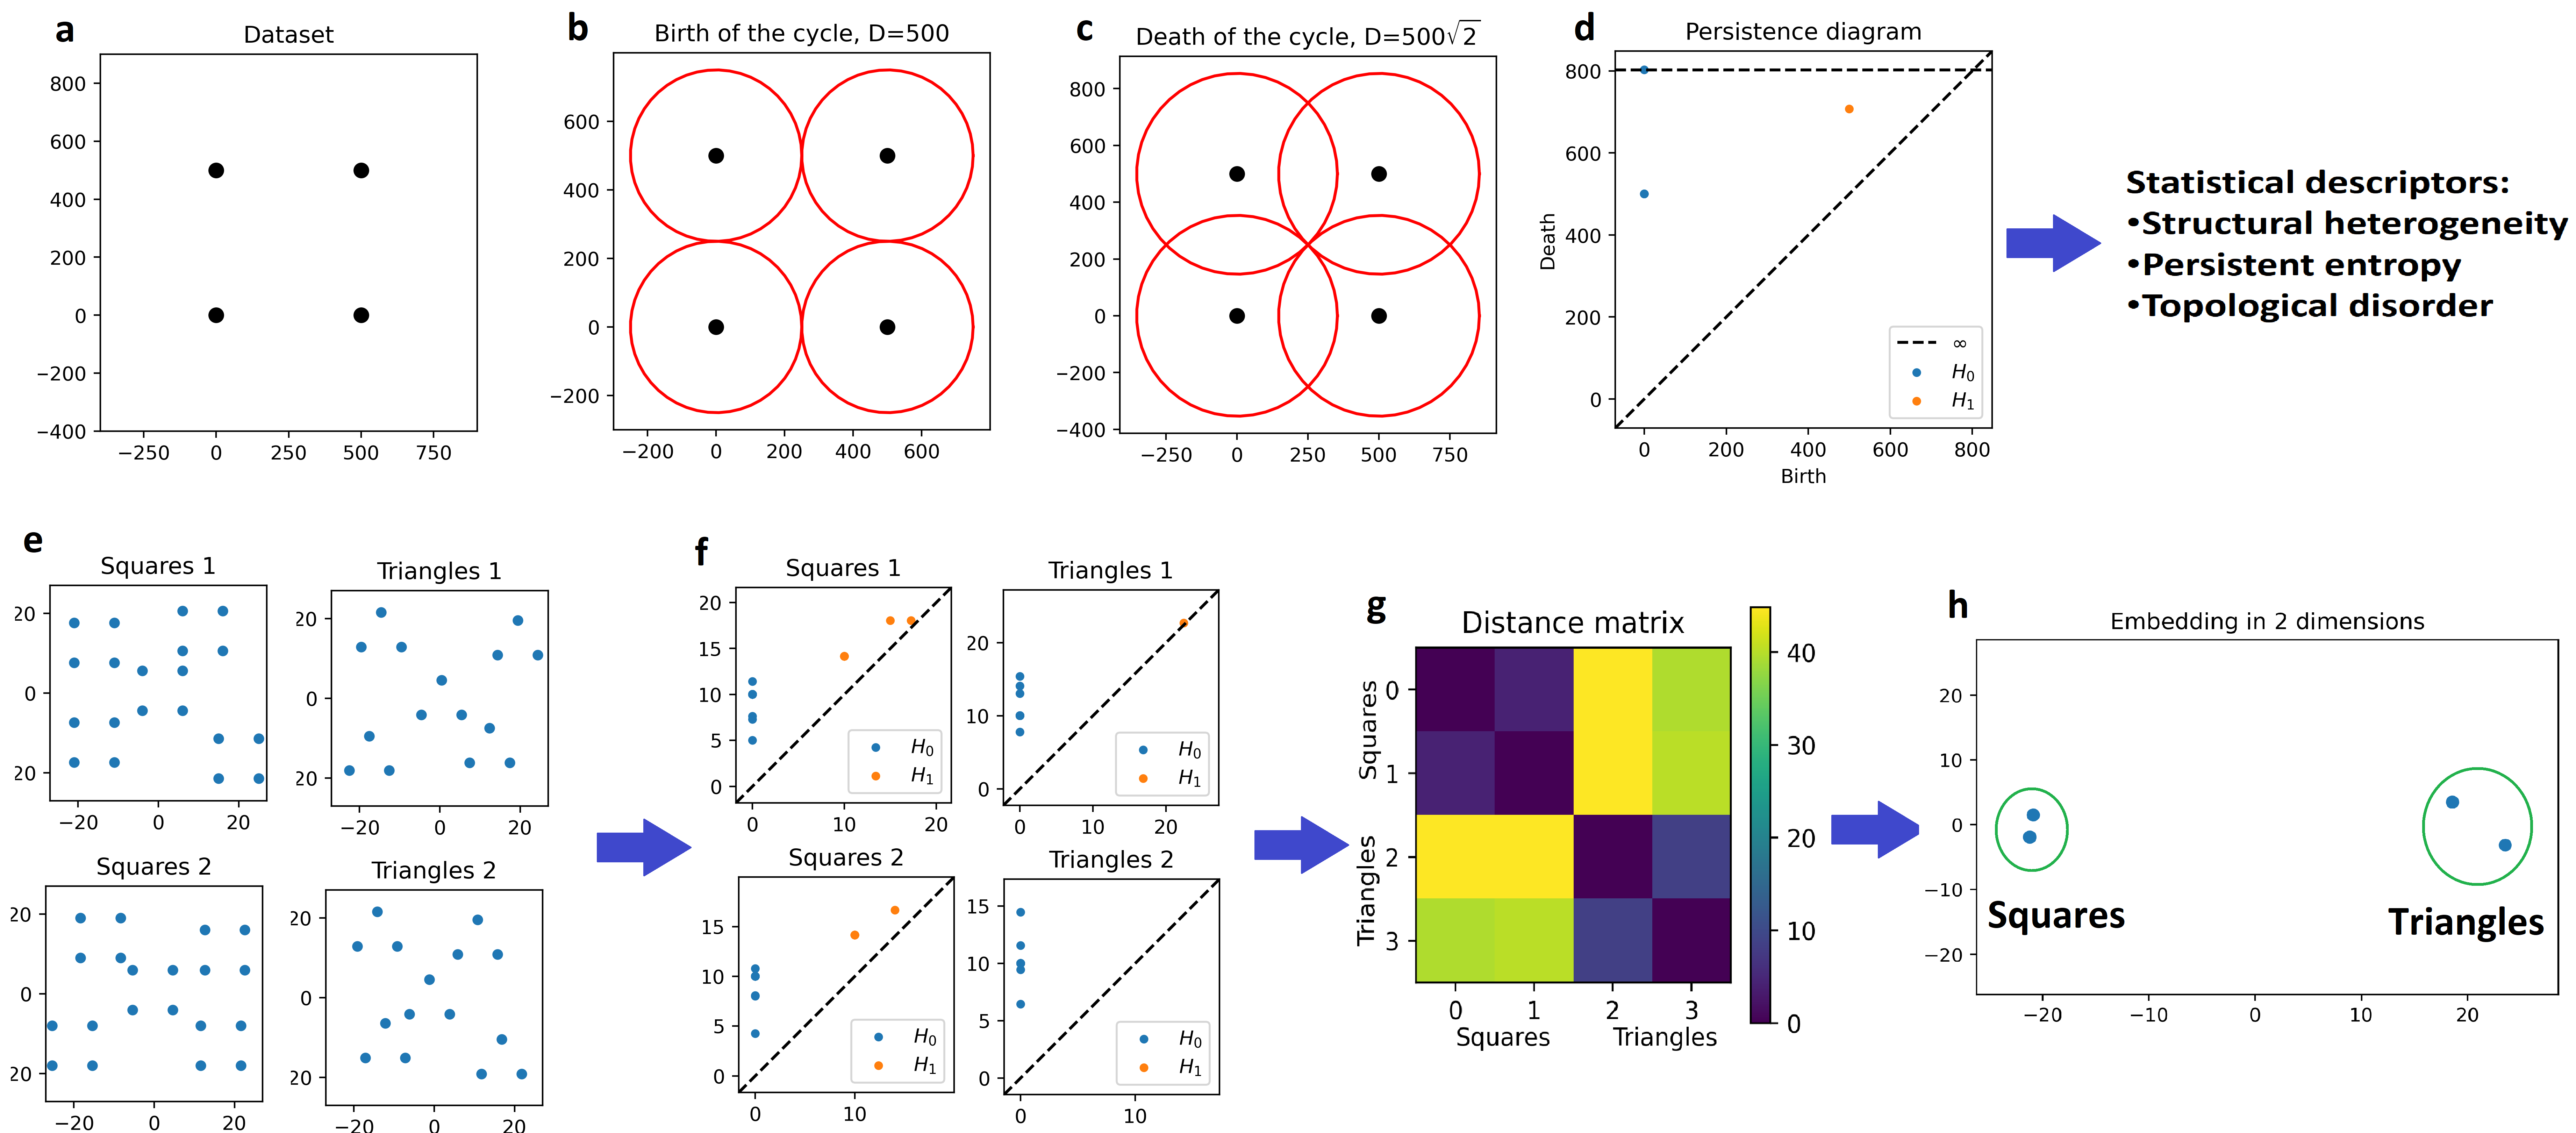
Starting from a point cloud such as that in panel a of figure 1, we build a collection of topological spaces called Rips simplicial complexes, indexed by a real number . For a given value of , the complex is constructed as follows. A ball of radius is drawn around each point of the point cloud. If two balls intersect, we add a link between their respective centres. Similarly, higher order links are added to the complex upon the intersection of three or more balls. Restricting ourselves to only two dimensions, which is relevant for flat metasurfaces, we draw circles of radius around each point and we only consider connections between pairs and triplets of points. The topological properties of each simplicial complex, the number of connected components and the number of loops in two dimensions, can be directly computed using algebraic topology. Tracking the evolution of these topological features for different values of provide useful insight over their scale. These features can be summarise in a persistence diagram for which each feature, indexed by the integer , is represented by two coordinates, their "birth", and their "death", , which are the values of at which they appear and disappear.
For example, if we consider a simple point cloud such as a square of side 500 in figure 2a, we see the birth of a loop when the diameter of the circles is equal to the side length of the square, figure 2b. This loop dies when the diameter is equal to the diagonal of the square, figure 2c, and the birth and death of this loop is represented as the point at coordinates in a persistence diagram, figure 2d. Additionally, four connected components are born at and three of them die such that only one remains after the circles intersect in figure 2b. Therefore, three (overlapping) points at coordinates are represented in figure 2d. The last connected components remains for . As we stopped the computation of persistent homology at we assign to this point coordinates .
The second row of figure 3 illustrates how TDA can be used for the clustering analysis of point clouds. The first step is to measure the “distance” between point clouds (figure 3e). We do this by measuring the distance between their corresponding persistence diagrams. Several metrics can be defined over the space of the persistence diagrams and we have selected to use the Wasserstein distance51 for its simplicity of use (figure 3f and 3g). If several point clouds are considered, one can build a geometrical embedding, for example via classical multidimensional scaling52, in which each point cloud can be represented as one point and the distance between each point is given by the distance between their respective persistence diagrams (figure 3h). This provides a visual representation of the configuration space of the different point clouds and can be used to detect clustering. For example, we considered two sets of four point clouds made of either triangles or squares, such as represented in figure 2e. Upon computing their persistence diagrams,figure 2f, and the distance matrix between then, figure 2g, we observe that a square seems to be more similar, or closer, to the other square than to the triangles. This can be directly visualised in their embedding in figure 2h, where we observe two clusters corresponding to the sets of squares and triangles.
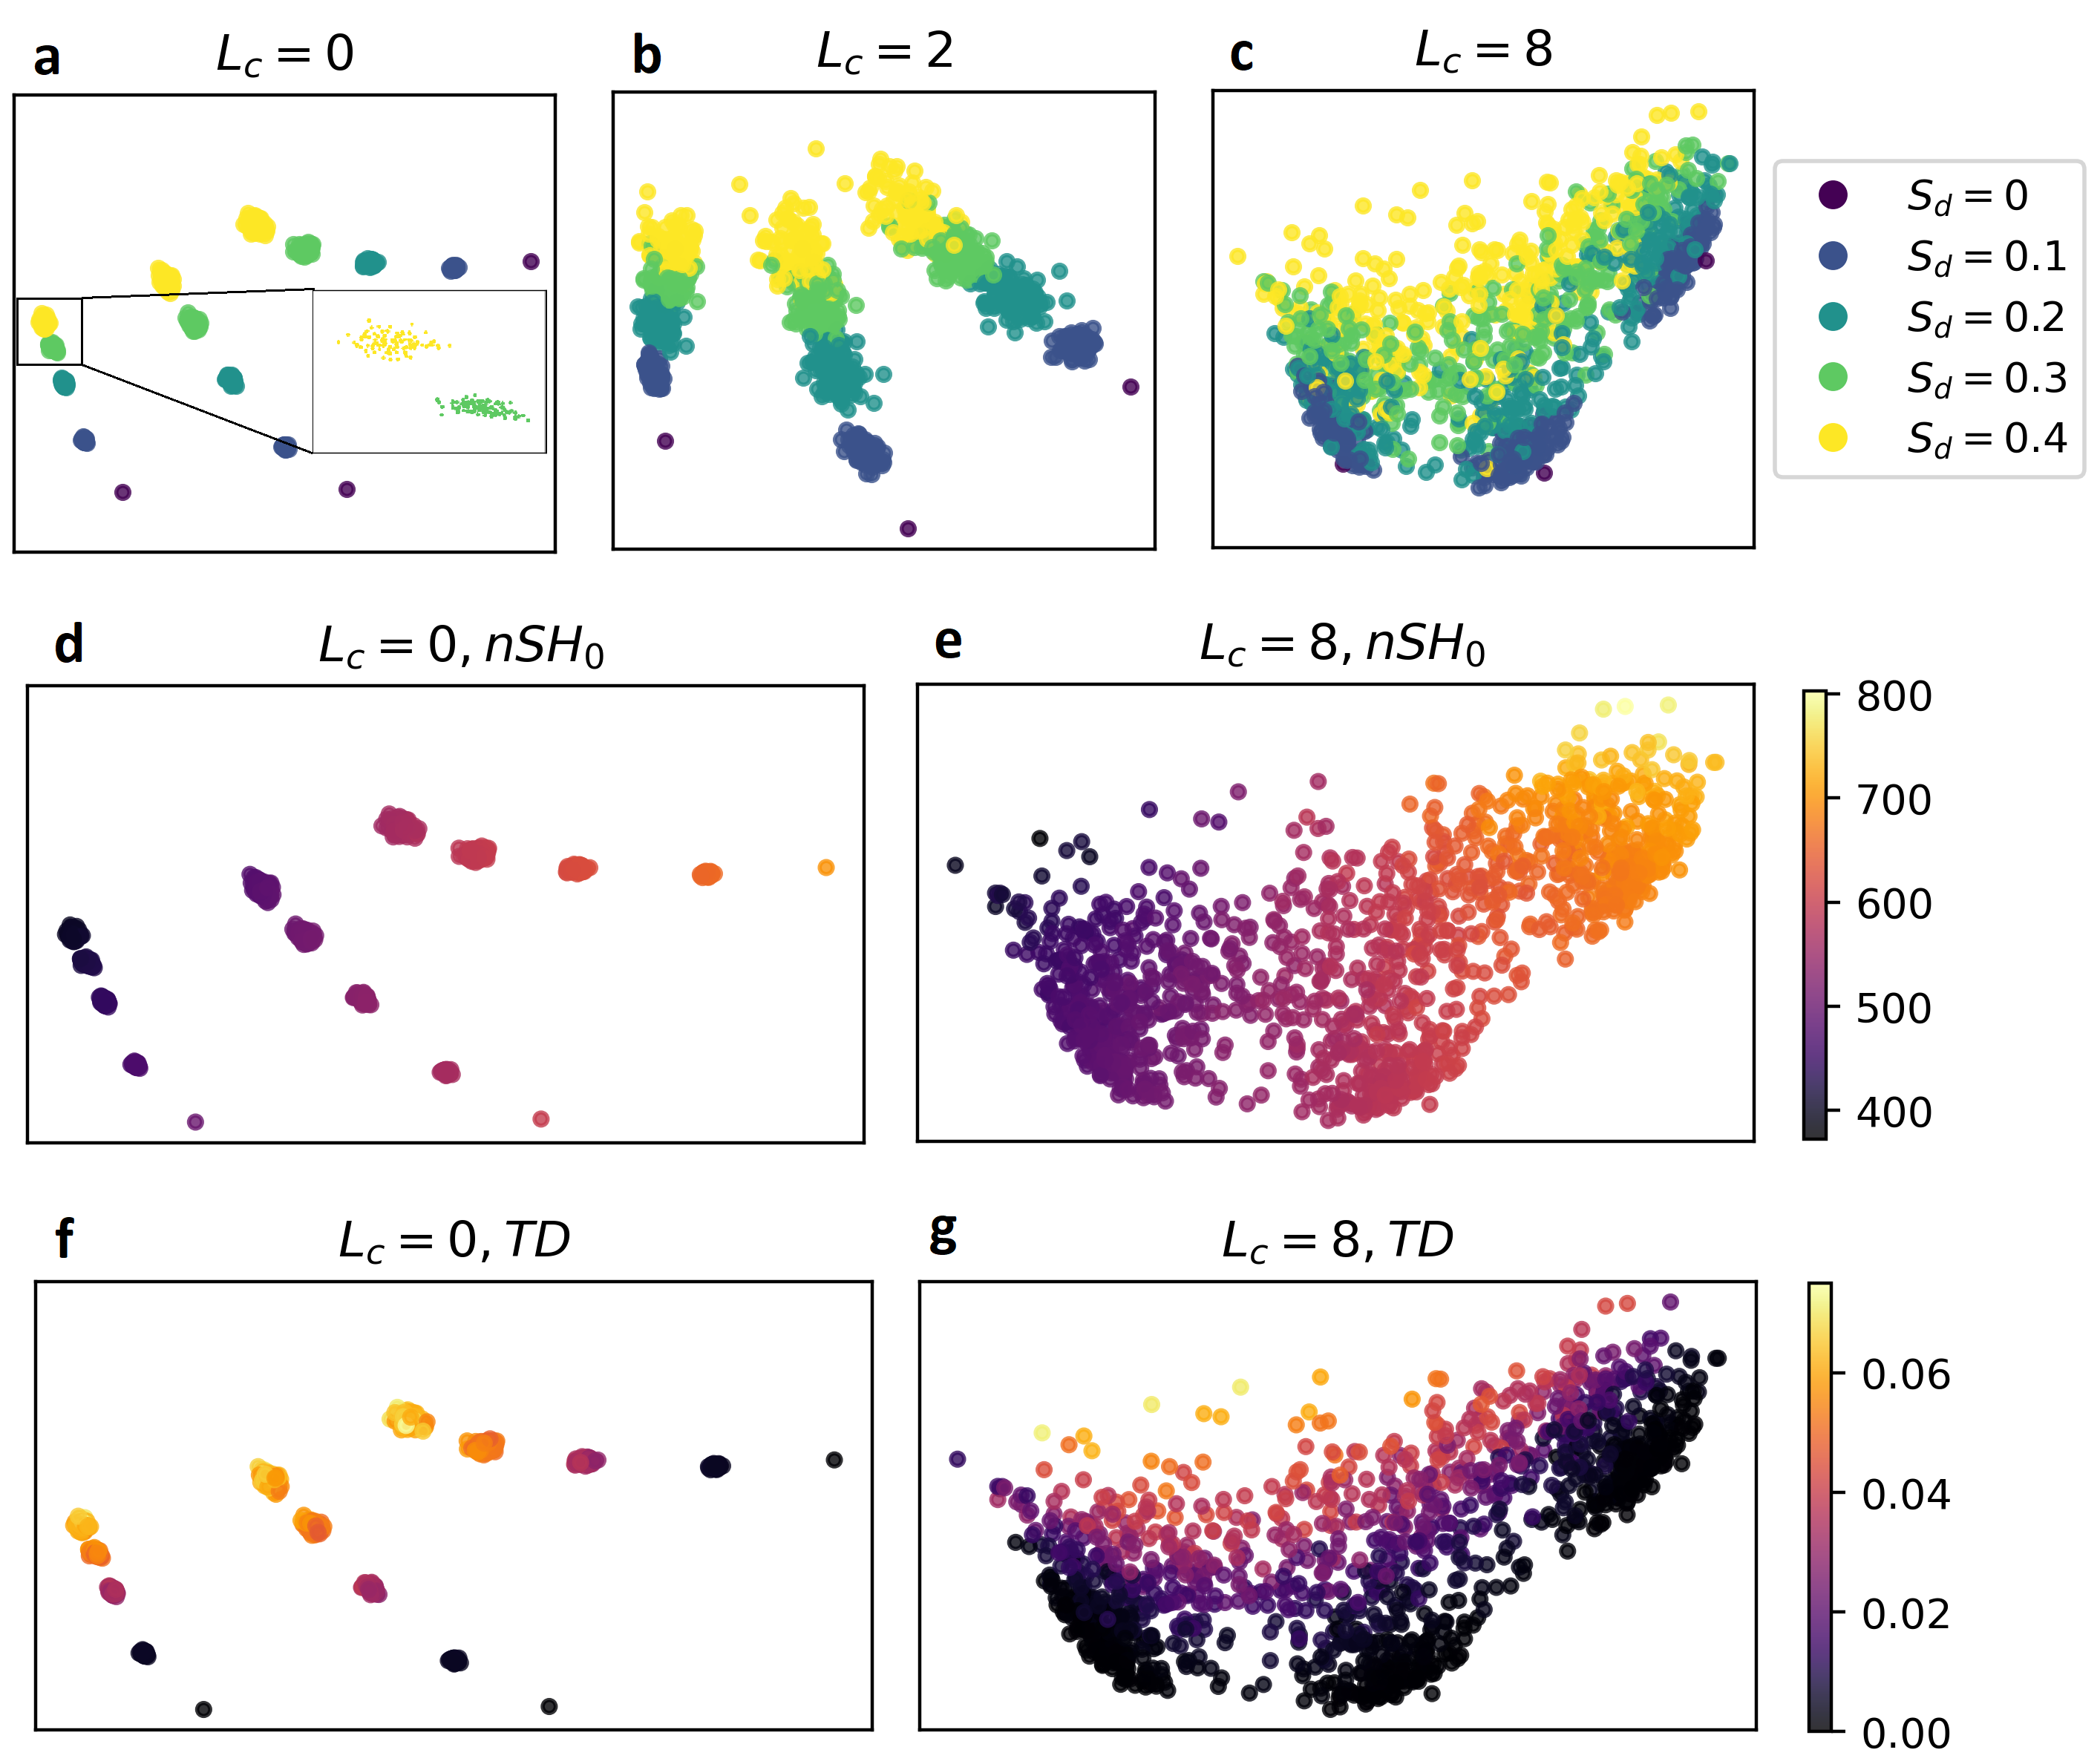
In order to visualise the space of configurations obtained from the definition of correlated disordered lattices in (2), we performed the embedding of 1203 lattices generated for three different lattice periods, 500, 600 and , and five different values of . We repeated this for uncorrelated disorder, =0, weakly correlated disorder, =2, and strongly correlated disorder, =8 (panels a,b and c of figure 3). We see in figure 3a an unambiguous clustering of the uncorrelated disorder lattices generated with the same parameters, i.e. and the original lattice period. For a fixed value of the period, the lattices appear to live on a simple curve on which we see five separated clusters of points corresponding to the five values of considered. As can be seen in figure 3b, a correlation length increases the size of each cluster, allowing them to overlap. For a large correlation length, like in figure 3c, each cluster is so large that they form one common cluster between the three different periodicities and the different values of . This is in agreement with what we presented in the previous section. A non-zero correlation length allows the lattices to explore a broader configuration space. Therefore, one can generate lattices that are more different from each other despite using the same parameters and the overall size of the clusters, related to the maximum distance between the persistence diagrams of the generated lattices, is bigger. This expansion of the lattices configuration space leads to situations where two lattices generated with different parameters may actually be very similar to each other, which is represented by the overlap between the clusters in figure 3b. Eventually, a large enough correlation length will make the clusters big enough to make the generative parameters obsolete, which is what we observe in figure 3c. Indeed, even if one can see some general trend between the overall lattices position and the value of , one cannot accurately recover the value of based on the lattice position. This can lead to situations where a lattice generated with a high amount of disorder, i.e. a large value of , may be as, or more, ordered than a lattice generated with a small amount of disorder, such as represented in the right column of figure 1.
Using TDA, we were able to show the limitation of the parameter to characterise generated lattices. One can build several metrics to describe persistence diagrams, which can be used as simpler descriptors of the topology of datasets, or as inputs of more refined machine learning based models 53, 54. In this work, we use two statistical descriptors based on lattices’ persistence diagrams in order to describe both the typical distance between each point of the lattices and their positional disorder. The first numerical descriptor is normalised structural heterogeneity of degree 0 (n) and is the sum of the lifetime of the topological features of degree 0, the connected components55, divided by the number of points of the lattice, :
| (3) |
with and the birth and death of each topological feature of degree 0, , of the persistence diagram . As the death of the topological features of degree 0 is proportional to the distance between the points of the lattices, n can be directly related to the average nearest neighbour distance between the nanostructures. If we colour the embeddings of uncorrelated and strongly correlated, =8, lattices of figure 2 according to the value of n of each lattice, we see in figure 2d that this quantity almost recovers perfectly the periodicity of the lattice for uncorrelated disorder, which confirms our interpretation of the topological features of degree 0. When applied to strongly correlated disordered lattices, figure 2e, provides a smooth ordering of the lattices, following a similar trend as for uncorrelated disordered lattices.
We also introduce a new descriptor that we call Topological Disorder (), inspired from the persistent entropy () 56, 57, 58. is defined as
| (4) |
is maximal for and equal to , with the total number of topological features in . Therefore, is maximal for regular, periodic lattices and measures how ordered lattices are. In order to avoid the counter intuitive association of a highly ordered lattice with its high persistent entropy, and to define a measure of disorder independent of the lattice’s size, which modifies the number of topological features , we define as
| (5) |
where we split the computation over the degrees of the topological features, in order to capture the fundamental differences between topological features of different degree. Indeed, one can see on figure 2d that, despite the regularity of the dataset in figure 2a, the topological features in the persistence diagram are located in different places, which would artificially increase the value of . While the example in figure 2a is simple, this remains the case for ordered lattices. By construction, is invariant by rescaling of the typical length of the lattices, making it an orthogonal descriptor of the lattices with respect to n. is also minimal for ordered lattices, equal to 0, and is independent of the number of points of the lattices. Therefore, it can be used as a universal measure of disorder, not only for point clouds perturbed from different periodic lattices array, but also for point clouds without any inherent order, such as in self-assembled systems. If we colour the embeddings of uncorrelated and strongly correlated lattices of figure 3 according to their , we see in figure 3f that recovers perfectly the strength of the uncorrelated disorder, regardless of the lattices’ periodicity, which confirms that is indeed a measure of the lattices’ disorder. When applied to strongly correlated disordered lattices, figure 3g, provides another smooth ordering of the lattices, orthogonal to the one given by n.
These observations suggest that and n are two topologically inspired descriptors that can be used to quantify the positional disorder and the typical distance between points of a dataset respectively. Being, by construction, independent of any reference dataset, these tools are suitable to classify datasets that are not easily described using classical statistical methods, such as correlated disorder point clouds or self-assembled systems.
1.3 Tailored metasurface design, fabrication and spectroscopy
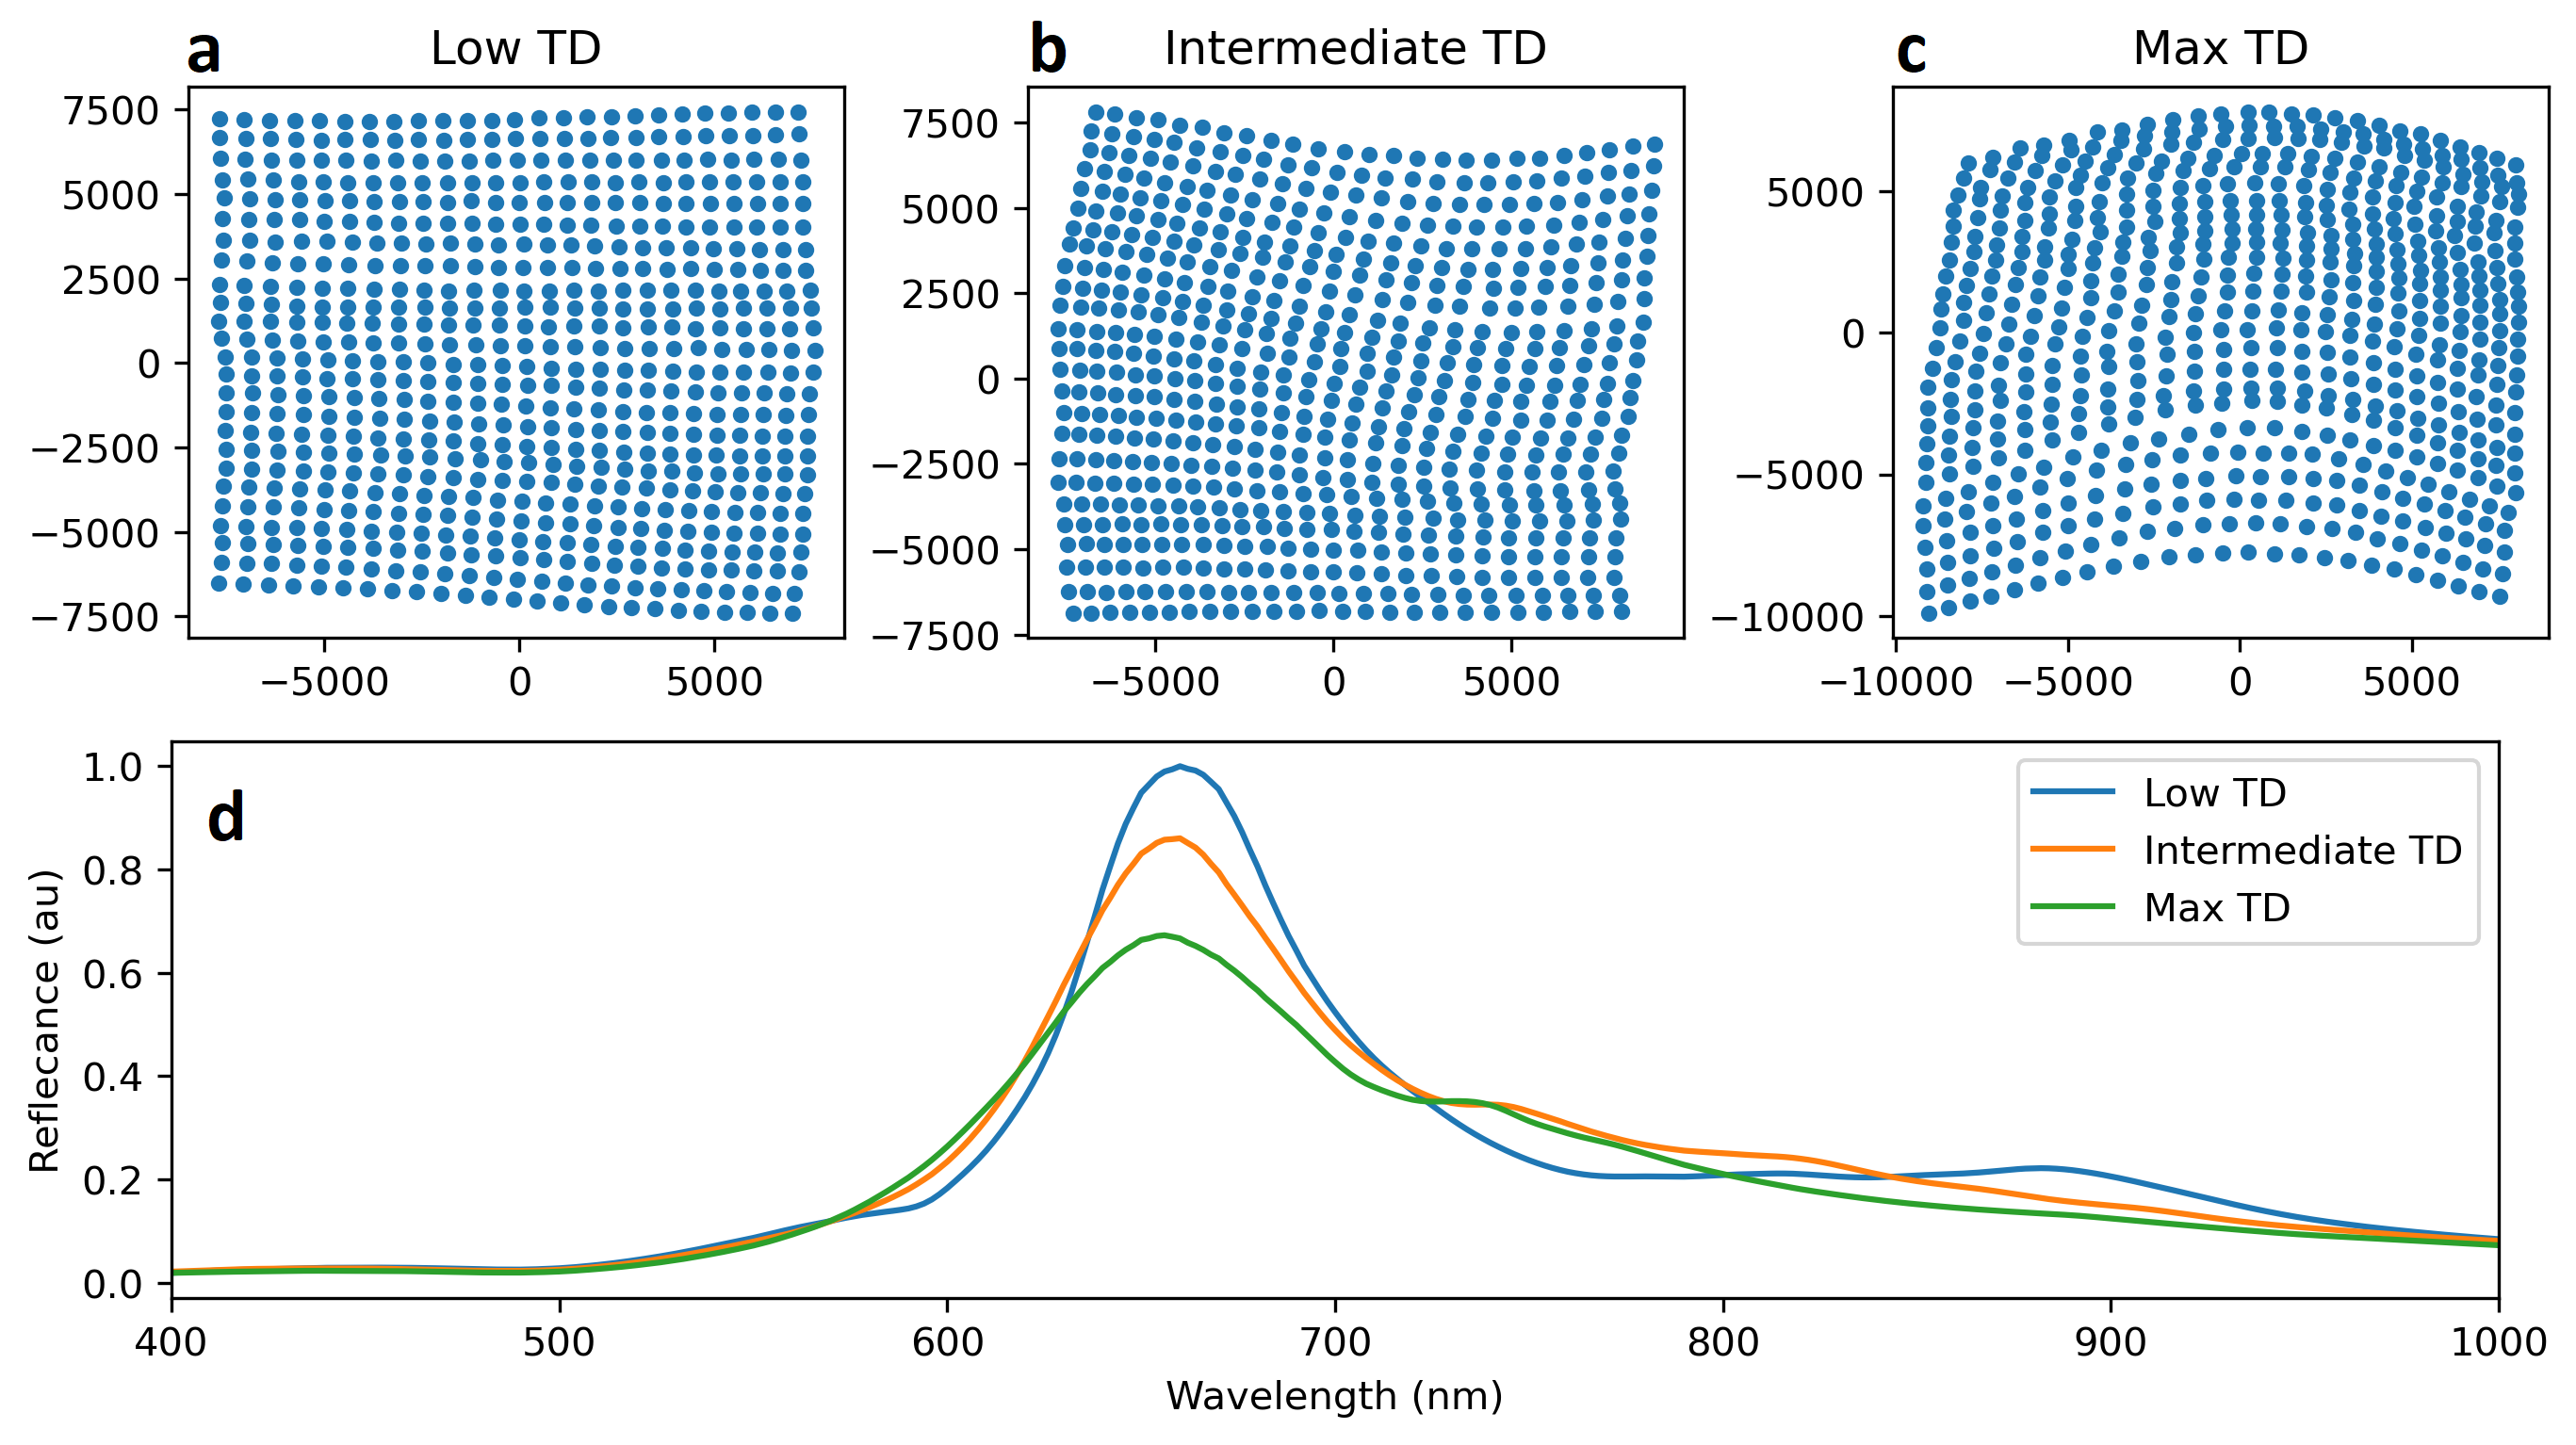
We demonstrate the accuracy of by using it to design, and subsequently build, plasmonic metasurfaces of specific degree of disorder, that we relate to the strength of their SLRs. We first investigate the link between and the strength of the SLRs theoretically using the discrete dipole approximation59. We randomly generated lattices of 2525 points with =8 and =0.3, starting from a square lattice of period , where each point represents the position of a plasmonic nanostructure. Filtering the point clouds using n, we restrict ourselves to metasurfaces of similar nearest neighbour distance. From these point clouds, we pick those with the highest, lowest and median value of (figure 4a, b and c). We consider each nanostructure to be a gold nanocylinder of height and diameter whose optical properties, under the dipole approximation, are fully determined by their polarisability. The gold nanocylinders are assumed to be embedded in an homogeneous glass like dielectric layer of refractive index 1.41. We numerically compute the reflectance of the three metasurfaces under illumination by a circularly polarised plane at normal incidence, figure 4d. As predicted, the higher the topological disorder, the weaker the SLRs are. Indeed, we can see on figure 4d that the amplitude of SLR dip is inversely proportional to . Similarly, the quality factors of these resonances which are 8.2, 7.5 and 6.5 for the lowest, median and highest respectively.
1.4 Experimental verification of the –SLR link
We additionally experimentally confirmed the link between and the strength of SLRs by designing metasurfaces built using Focused Ion Beam (FIB) lithography. Using three different correlation lengths and starting from a regular square lattice of period , we generated several hundreds of lattices for two values of : 0.2 and 0.4. For each value of , we selected two lattices to compare with each other: the one with the highest value of among those generated with =0.2 and the one with the lowest value of among those generated with =0.4. Similarly to the previous section, we used to select lattices of similar nearest neighbour distances. We built two sets of seven metasurfaces, three pairs for each value of and one reference square lattice of period . The two sets only differ in the size of the nanostructures, which in both cases were elongated thick gold nanodisk. The top nanodisk crossections are elliptical with - and -axis of size (160,180) nm and (120,140) nm for the first and second set respectively. The resonant wavelength of the SLRs depends both on the distance between the nanostructures and on their polarisability. The latter is strongly affected by the shape of the nanostructures and their anisotropy induces a shift of the SLRs wavelength of up to according to the polarisation of the exciting light. We therefore report the optical properties of the metasurfaces excited under normal incidence light for two linear polarisation: polarised along the -direction, parallel to the nanostructures’ long axis and polarised along the -direction, perpendicular to the nanostructures’ short axis. SEM images of the first set, as well as their transmittance spectrum compared to the square lattice are in figure 5. The results for the second set of metasurafaces, the comparison of these experimental results to the dipolar model and close up SEM images are in the supplementary information.
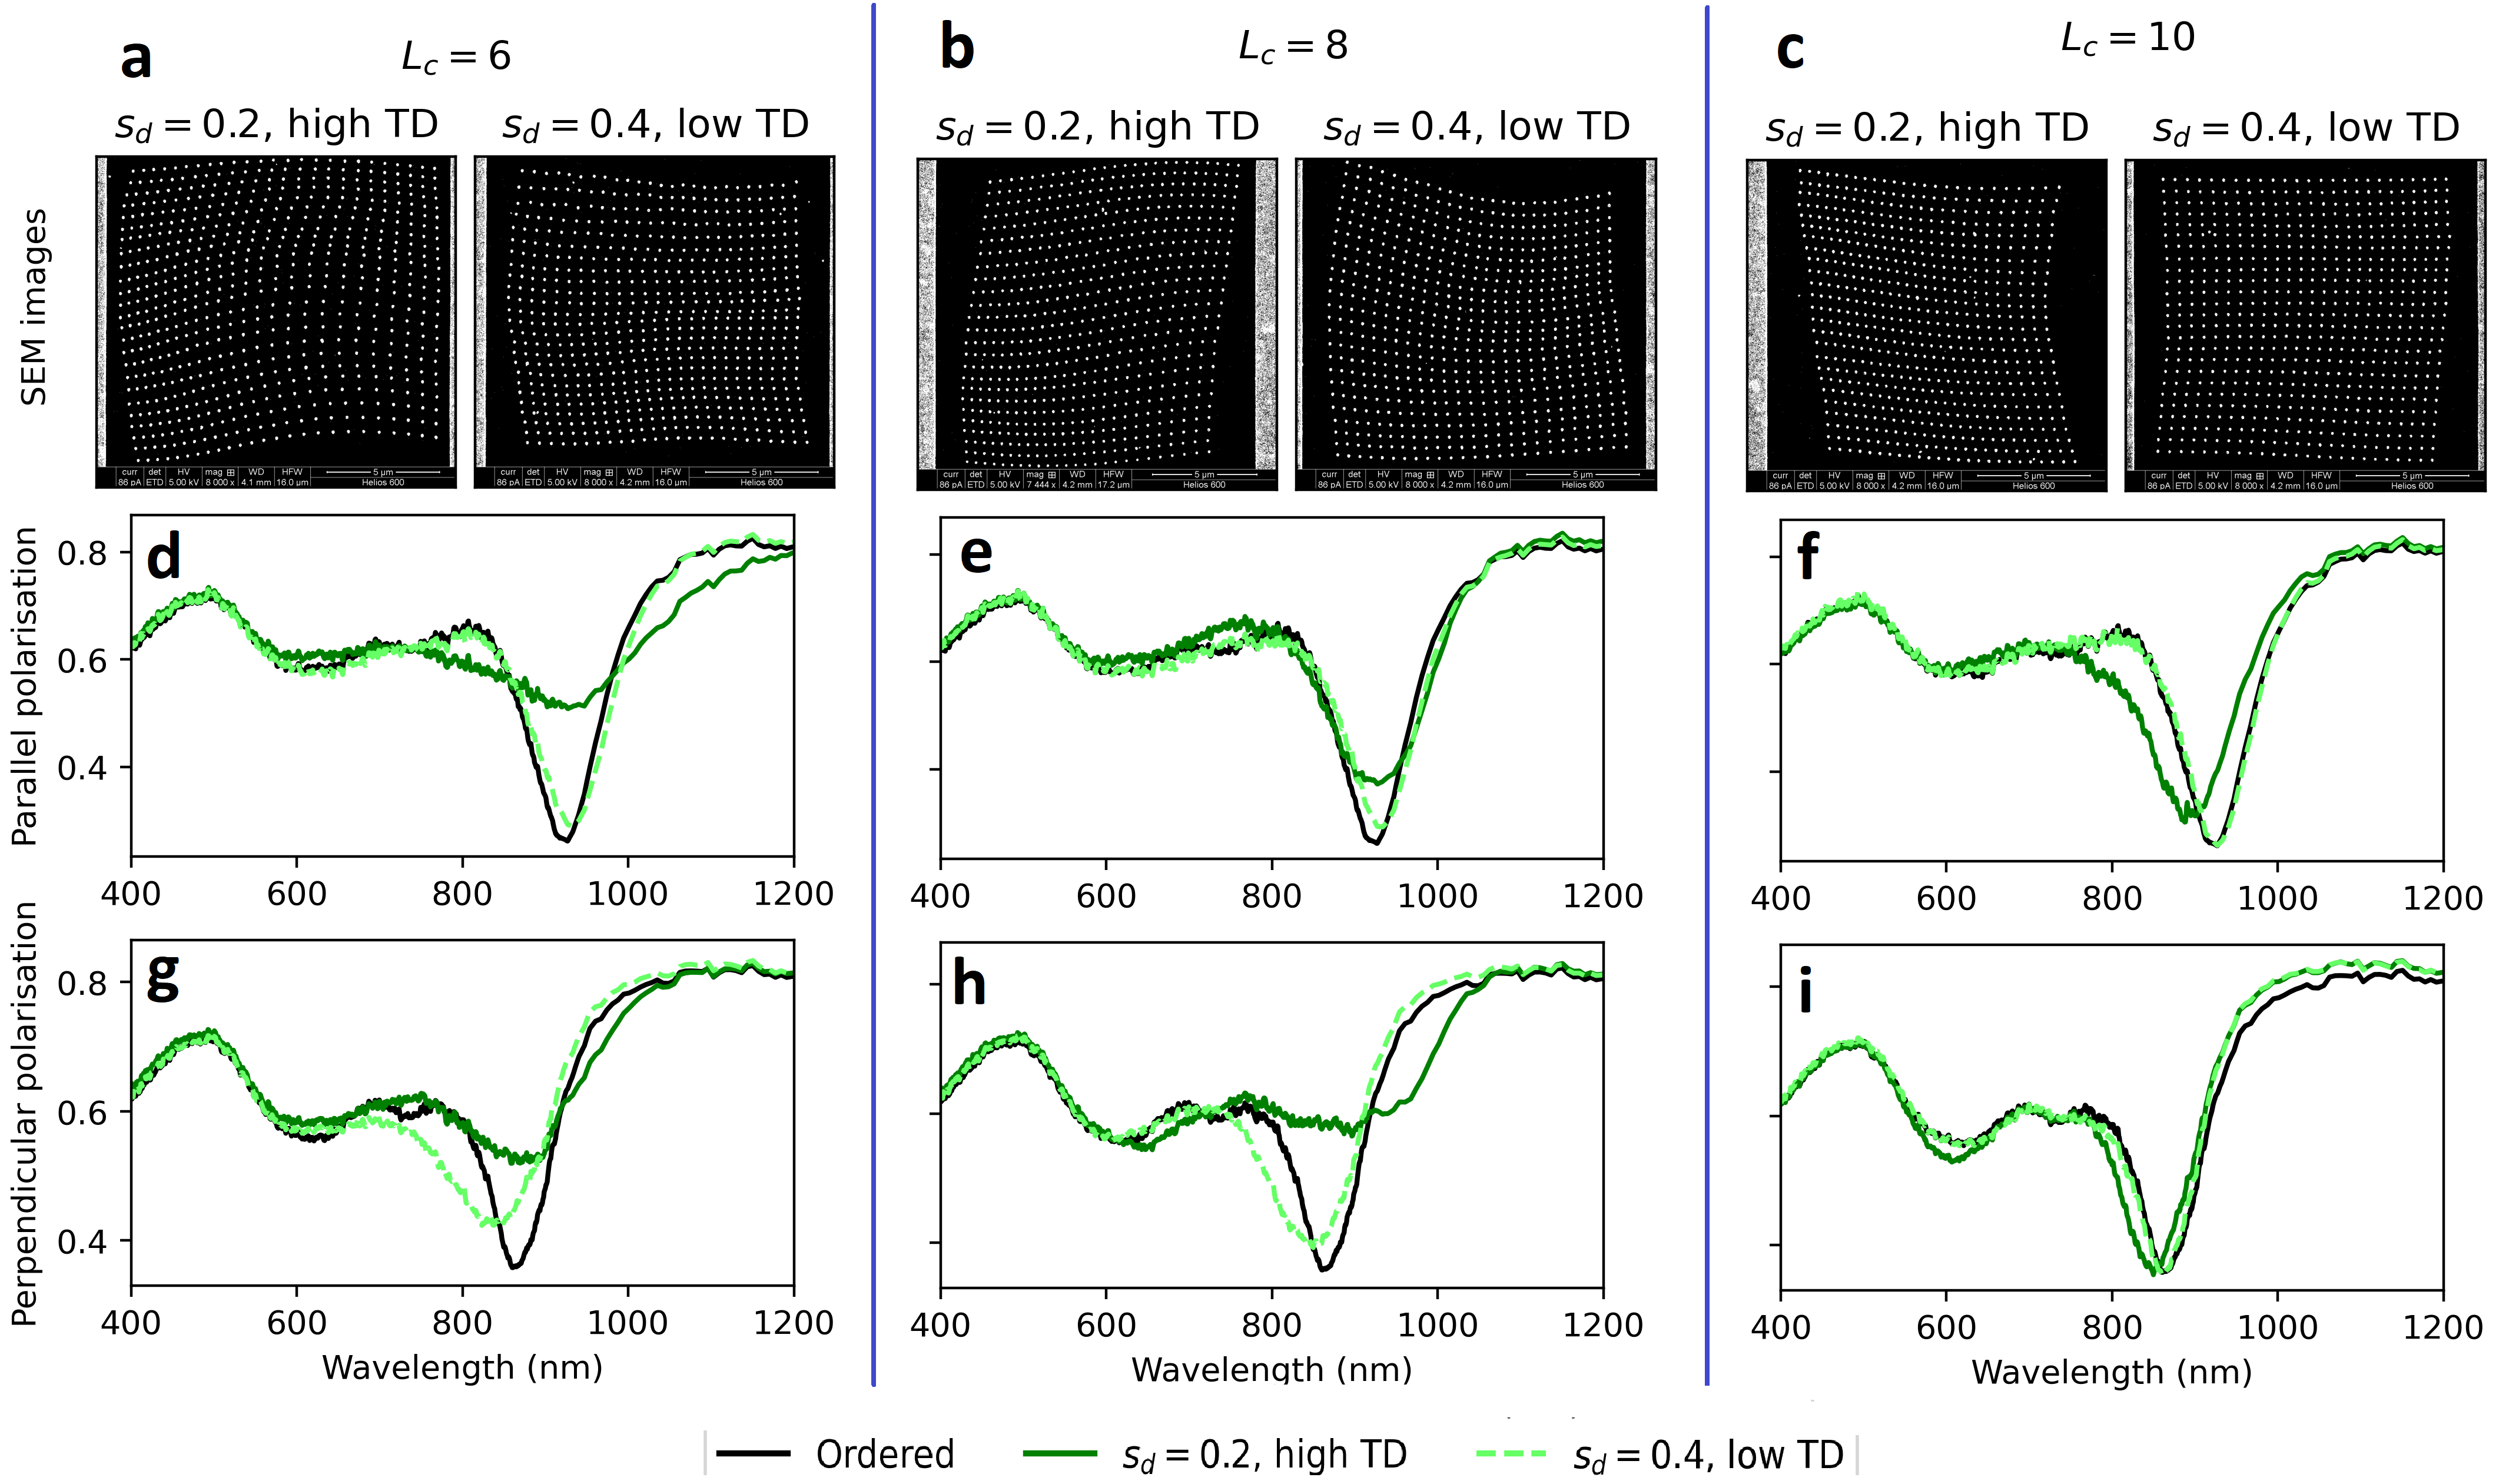
The three columns of figure 5 contain for each , the SEM images of the designed pair of metasurfaces (first row) and their transmittance spectra upon excitation by light polarised parallel to the nanostructures’ long axis (second row) and perpendicular to the nanostructures’ short axis (third row). The transmittance spectrum of a periodic metasurface with the same pitch is added for comparison (black lines). We report in table 1 the quality factors of all the SLRs shown in figure 5 as well as the of the corresponding metasurfaces.
| Lattice parameters | Q (parallel) | Q (perpendicular) | |
| =0, =0 | 0. | 10.1 | 11.5 |
| =6, =0.2 | 0.030 | 4 | 5.2 |
| =6, =0.4 | 0.012 | 9.3 | 6.8 |
| =8, =0.2 | 0.025 | 6.7 | 4.4 |
| =8, =0.4 | 0.005 | 7.8 | 7 |
| =10, =0.2 | 0.026 | 8 | 11.5 |
| =10, =0.4 | 0.002 | 10.1 | 11.5 |
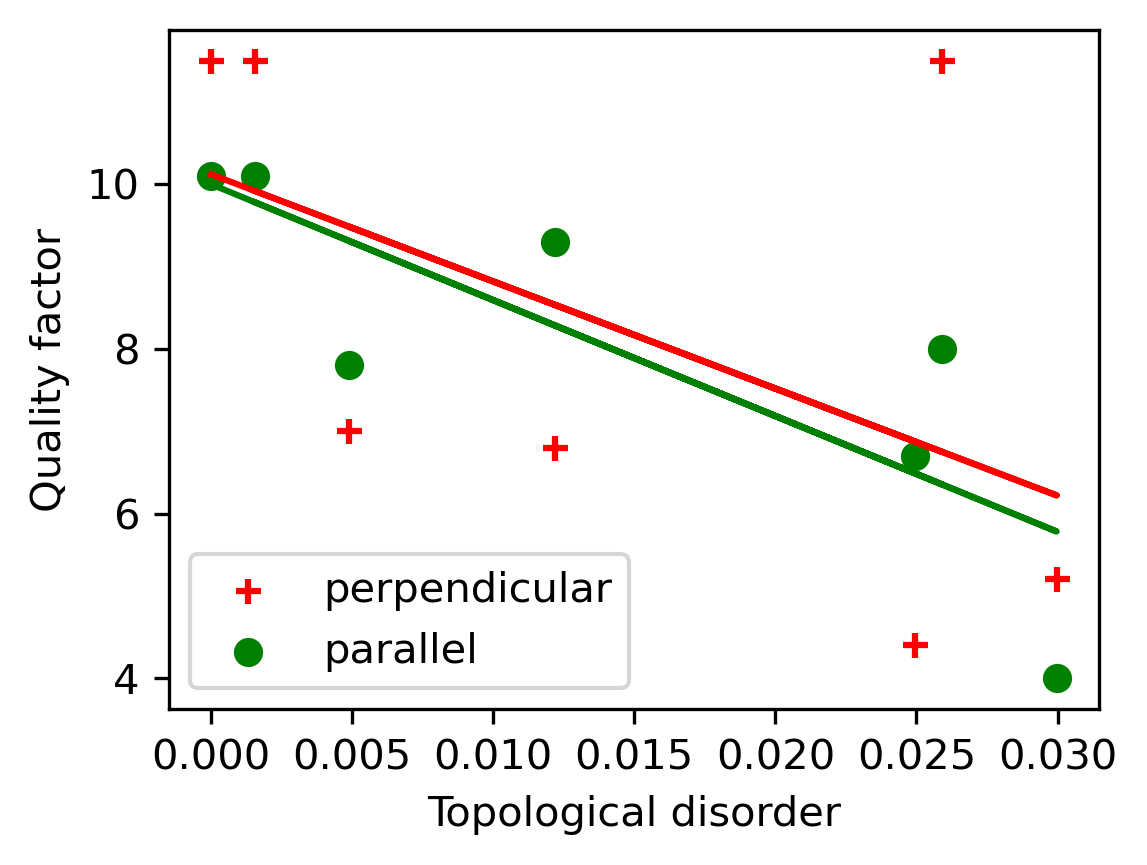
As can be seen in figure 5 and table 1, in five configurations out of six, the SLRs of the metasurfaces designed with a high but a low are stronger and have a larger quality factor than the metasurfaces designed with a low but a high , proving that is indeed an accurate measure of disorder. The only exception is the configuration with =10 and perpendicular polarisation, figure 5i, for which both metasurfaces have similarly strong SLRs with a quality factor of 11.5, equivalent to the square lattice for this polarisation. Upon inspecting the lattices of the two metasurfaces generated for =10, shown in the panel c of figure 5 or in larger versions in the supplementary information, one can visually appreciate that positional distortion seems to be only noticeable at a large-scale, while at short scales, the nanostructures seem to be more regularly spaced as if they were on a square lattice. Indeed, larger values of average out the uncorrelated disorder of more nearby nanostructures which effectively smooths out the positional shift of each nanostructure, while maintaining large-scale shifts, responsible for the wavy patterns of the two right columns of figure 1. Although is able to detect this large-scale distortion, and treats it similarly to short scale disorder, the strength of SLR depends mostly on the latter. Indeed, the interaction strength between the nanostructures decreases as the inverse of the distance between them, under the dipolar approximation, and, effectively, a nanostructure only interact with a few of their neighbours. Therefore, a metasurface with short scale order but long scale disorder, such as those generated for =10 can exhibit strong SLRs despite having a large . This effect can also be visualised if we represent the quality factors of the SLRs in terms of the of the metasurfaces for both polarisation of the exciting light, figure 6. We see a decreasing trend of the quality factor in terms of despite outliers, such as the metasurface generated with =10, =0.2 that we just commented on, and some fluctuations that we similarly explain as being affected by large-scale disorder while the quality factor isn’t. A simple improvement would be to only define locally, on the scale that is relevant to the optical property dependant on the metasurfaces’ disorder. However, we chose for simplicity to keep the definition of , equation (5), global in this work.
This demonstrates that is a more accurate measure of the positional disorder of these metasurfaces compared to as in all of the cases reported here, the metasurface that should have been the most ordered, generated with the lowest value of , is actually at least as disordered as the metasurface that should have been the most disordered, generated with the highest value of . Indeed, while a correlation length, induced by , made more ambiguous to describe the disorder of the metasurfaces, was able to accurately select lattices of chosen disorder, that we experimentally probed via the quality factor of their SLRs, despite the non unique relationship between and SLRs quality factors.
2 Conclusion
We have shown how Topological Data Analysis and persistent homology can be used to classify both correlated and uncorrelated disordered metasurfaces via their topological disorder. In particular, we showed that for correlated disorder, topological disorder is a significantly more accurate measure of disorder than generative probabilistic parameters. We proved, theoretically and experimentally, this accuracy by correlating topological disorder to the strength of surface lattice resonances of metasurfaces made of plasmonic nanostructures, despite the global definition of topological disorder being sensitive to large-scale distortion, while surface lattice resonances are not. We argue that the universality, accuracy and computational speed of topological disorder makes it an advantageous tool to characterise and tune the fabrication methods of self assembled disordered metasurfaces, as well as to help design metasurfaces of specific degree of disorder, for example to enhance light extraction for more efficient LEDs or light absorption for improved solar cells.
3 Experimental / Method
The metasurfaces have lateral size approximately and were fabricated in a thick film of Au coated glass substrate using a focused ion beam facility, Helios Nanolab 600 from FEI ThermoFisher Scientific. The metasurfaces were then spin-coated with IC1-200 whose refractive index is similar to that of the glass substrate.
The spectral characterisation was performed in transmittance at normal incidence using a microspectrophotometer (CRAIC Technologies) equipped with a tungsten-halogen light source and cooled CCD array.
The persistent homology of all lattices was computed using the Ripser python package50. The computation for each lattice, made of 625 nanostructures, was done in a fraction of a second. The computation of the distance between each lattice’s persistence diagrams considered for the figure 3 was done using the Wasserstein distance from the GUDHI python package49. Embeddings were obtained from the distance matrices by using classical multidimensional scaling. We projected the embeddings in two dimensions for the visual representations in figure 3. In general such embeddings live in a very high dimensional, non necessarily euclidean, space and a projection to a two dimensional flat space can lead to distortions. However, the magnitude of these distortions can be estimated in the classical multidimensional scaling methods by considering the relative absolute value of the eigenvalues of the embedding in each dimension60. For the embedding represented in figure 3, the eigenvalues of the two largest dimension, used to represent the embedding in 2D, are respectively 278 and 40 time larger than the largest negative eigenvalue, proving that an embedding in an euclidean space is a good approximation. Similarly, the eigenvalues of the two largest dimension are respectively 22 and 3 times larger than the third largest positive eigenvalue, hinting that a projection in 2D is an accurate visual representation of the embedding.
The numerical simulations of the metasurfaces optical properties were done using the discrete dipole approximation59 where each nanostructure is modelled as a dipole of the same polarisability. We assumed that the nanostructures were located in an homogeneous dielectric medium of refractive index which is a good approximation of the refractive index of the glass substrate and of the IC1 layer. The reflectance was measured by computing the electromagnetic flux in the direction perpendicular to the surface, assuming a numerical aperture of , to match the experimental setup. The nanostructures polarisability was computed from simulating the optical response of an isolated nanostructure upon excitation by plane waves of different polarisability 17 , that we performed using the electromagnetic waves, frequency domain interface of the optics module of COMSOL 5.6, solved with a direct solver 61.
The authors acknowledge the use of the IRIDIS High Performance Computing Facility, and associated support services at the University of Southampton, in the completion of this work. This work was supported by the Leverhulme Trust (grant RPG- 2019-055).
References
- Chen et al. 2016 Chen, H.-T.; Taylor, A. J.; Yu, N. A review of metasurfaces: physics and applications. Reports on Progress in Physics 2016, 79, 076401, Publisher: IOP Publishing
- Mao et al. 2021 Mao, P.; Liu, C.; Li, X.; Liu, M.; Chen, Q.; Han, M.; Maier, S. A.; Sargent, E. H.; Zhang, S. Single-step-fabricated disordered metasurfaces for enhanced light extraction from LEDs. Light-Science & Applications 2021, 10, 180, Place: London Publisher: Springernature WOS:000694248200001
- Ushkov et al. 2021 Ushkov, A.; Dellea, O.; Verrier, I.; Kampfe, T.; Shcherbakov, A.; Michalon, J.-Y.; Jourlin, Y. Nanosphere Photolithography: The Influence of Nanopore Arrays Disorder on Extraordinary Optical Transmission. Photoptics: Proceedings of the 9th International Conference on Photonics, Optics and Laser Technology. Setubal, 2021; pp 46–53, WOS:000661460100006
- Yildirim et al. 2019 Yildirim, D. U.; Ghobadi, A.; Soydan, M. C.; Atesal, O.; Toprak, A.; Caliskan, M. D.; Ozbay, E. Disordered and Densely Packed ITO Nanorods as an Excellent Lithography-Free Optical Solar Reflector Metasurface. Acs Photonics 2019, 6, 1812–1822, Place: Washington Publisher: Amer Chemical Soc WOS:000476684300030
- Wu et al. 2022 Wu, Z.; Zhang, Y.; Du, B.; Yang, K.; Wu, J.; Dai, T.; Dong, C.; Xia, J.; Wu, A.; Zhao, Z. Disordered metasurface-enhanced perovskite composite films with ultra-stable and wide color gamut used for backlit displays. Nano Energy 2022, 100, 107436, Place: Amsterdam Publisher: Elsevier WOS:000811310400001
- Tani et al. 2014 Tani, T.; Hakuta, S.; Kiyoto, N.; Naya, M. Transparent near-infrared reflector metasurface with randomly dispersed silver nanodisks. Optics Express 2014, 22, 9262–9270, Publisher: Optica Publishing Group
- Chen et al. 2019 Chen, H.; Zhao, J.; Fang, Z.; An, D.; Zhao, X. Visible Light Metasurfaces Assembled by Quasiperiodic Dendritic Cluster Sets. Advanced Materials Interfaces 2019, 6, 1801834, Place: Hoboken Publisher: Wiley WOS:000459485500013
- Piechulla et al. 2021 Piechulla, P. M.; Slivina, E.; Batzner, D.; Fernandez-Corbaton, I.; Dhawan, P.; Wehrspohn, R. B.; Sprafke, A. N.; Rockstuhl, C. Antireflective Huygens’ Metasurface with Correlated Disorder Made from High-Index Disks Implemented into Silicon Heterojunction Solar Cells. Acs Photonics 2021, 8, 3476–3485, Place: Washington Publisher: Amer Chemical Soc WOS:000753681400009
- Shutsko et al. 2022 Shutsko, I.; Buchmueller, M.; Meudt, M.; Goerrn, P. Light-Controlled Fabrication of Disordered Hyperuniform Metasurfaces. Advanced Materials Technologies 2022, 7, 2200086, Place: Hoboken Publisher: Wiley WOS:000803023000001
- Piechulla et al. 2018 Piechulla, P. M.; Muehlenbein, L.; Wehrspohn, R. B.; Nanz, S.; Abass, A.; Rockstuhl, C.; Sprafke, A. Fabrication of Nearly-Hyperuniform Substrates by Tailored Disorder for Photonic Applications. Advanced Optical Materials 2018, 6, 1701272, _eprint: https://onlinelibrary.wiley.com/doi/pdf/10.1002/adom.201701272
- Narasimhan et al. 2020 Narasimhan, V.; Siddique, R. H.; Park, H.; Choo, H. Bioinspired Disordered Flexible Metasurfaces for Human Tear Analysis Using Broadband Surface-Enhanced Raman Scattering. Acs Omega 2020, 5, 12915–12922, Place: Washington Publisher: Amer Chemical Soc WOS:000541503700034
- Siddique et al. 2017 Siddique, R. H.; Donie, Y. J.; Gomard, G.; Yalamanchili, S.; Merdzhanova, T.; Lemmer, U.; Hölscher, H. Bioinspired phase-separated disordered nanostructures for thin photovoltaic absorbers. Science Advances 2017, 3, e1700232, Publisher: American Association for the Advancement of Science
- Donie et al. 2021 Donie, Y. J.; Schlisske, S.; Siddique, R. H.; Mertens, A.; Narasimhan, V.; Schackmar, F.; Pietsch, M.; Hossain, I. M.; Hernandez-Sosa, G.; Lemmer, U.; Gomard, G. Phase-Separated Nanophotonic Structures by Inkjet Printing. Acs Nano 2021, 15, 7305–7317, Place: Washington Publisher: Amer Chemical Soc WOS:000645436800116
- Cao and Eliezer 2022 Cao, H.; Eliezer, Y. Harnessing disorder for photonic device applications. Applied Physics Reviews 2022, 9, 011309
- El Shamy et al. 2019 El Shamy, E.; Jaeck, J.; Haidar, R.; Bouchon, P. Light scattering by correlated disordered assemblies of nanoantennas. Applied Physics Letters 2019, 115, 041103, Place: Melville Publisher: Amer Inst Physics WOS:000477625500006
- Antosiewicz and Tarkowski 2015 Antosiewicz, T. J.; Tarkowski, T. Localized Surface Plasmon Decay Pathways in Disordered Two-Dimensional Nanoparticle Arrays. ACS Photonics 2015, 2, 1732–1738, Publisher: American Chemical Society
- Sterl et al. 2021 Sterl, F.; Herkert, E.; Both, S.; Weiss, T.; Giessen, H. Shaping the Color and Angular Appearance of Plasmonic Metasurfaces with Tailored Disorder. Acs Nano 2021, 15, 10318–10327, Place: Washington Publisher: Amer Chemical Soc WOS:000665748900097
- Chevalier et al. 2015 Chevalier, P.; Bouchon, P.; Jaeck, J.; Lauwick, D.; Bardou, N.; Kattnig, A.; Pardo, F.; Haider, R. Absorbing metasurface created by diffractionless disordered arrays of nanoantennas. Applied Physics Letters 2015, 107, 251108, Place: Melville Publisher: Amer Inst Physics WOS:000368442100008
- Zhang et al. 2021 Zhang, H.; Cheng, Q.; Chu, H.; Christogeorgos, O.; Wu, W.; Hao, Y. Hyperuniform disordered distribution metasurface for scattering reduction. Applied Physics Letters 2021, 118, 101601, Place: Melville Publisher: Amer Inst Physics WOS:000630491100001
- Haghtalab et al. 2020 Haghtalab, M.; Tamagnone, M.; Zhu, A. Y.; Safavi-Naeini, S.; Capasso, F. Ultrahigh Angular Selectivity of Disorder-Engineered Metasurfaces. Acs Photonics 2020, 7, 991–1000, Place: Washington Publisher: Amer Chemical Soc WOS:000526355400019
- Bertin et al. 2018 Bertin, H.; Brule, Y.; Magno, G.; Lopez, T.; Gogol, P.; Pradere, L.; Gralak, B.; Barat, D.; Demesy, G.; Dagens, B. Correlated Disordered Plasmonic Nanostructures Arrays for Augmented Reality. Acs Photonics 2018, 5, 2661–+, Place: Washington Publisher: Amer Chemical Soc WOS:000439532600018
- Sterl et al. 2020 Sterl, F.; Strohfeldt, N.; Both, S.; Herkert, E.; Weiss, T.; Giessen, H. Design Principles for Sensitivity Optimization in Plasmonic Hydrogen Sensors. Acs Sensors 2020, 5, 917–927, Place: Washington Publisher: Amer Chemical Soc WOS:000529155400005
- Roubaud et al. 2020 Roubaud, G.; Bondareff, P.; Volpe, G.; Gigan, S.; Bidault, S.; Gresillon, S. Far-Field Wavefront Control of Nonlinear Luminescence in Disordered Gold Metasurfaces. Nano Letters 2020, 20, 3291–3298, Place: Washington Publisher: Amer Chemical Soc WOS:000535255300046
- Veksler et al. 2015 Veksler, D.; Maguid, E.; Shitrit, N.; Ozeri, D.; Kleiner, V.; Hasman, E. Multiple Wavefront Shaping by Metasurface Based on Mixed Random Antenna Groups. Acs Photonics 2015, 2, 661–667, Place: Washington Publisher: Amer Chemical Soc WOS:000355066900014
- Jang et al. 2018 Jang, M.; Horie, Y.; Shibukawa, A.; Brake, J.; Liu, Y.; Kamali, S. M.; Arbabi, A.; Ruan, H.; Faraon, A.; Yang, C. Wavefront shaping with disorder-engineered metasurfaces. Nature Photonics 2018, 12, 84–90, Number: 2 Publisher: Nature Publishing Group
- Kim et al. 2021 Kim, W.; Simpkins, B. S.; Guo, H.; Hendrickson, J. R.; Guo, J. Hyperuniform disordered metal-insulator-metal gap plasmon metasurface near perfect light absorber. Optical Materials Express 2021, 11, 4083–4092, Publisher: Optica Publishing Group
- Reyes-Coronado et al. 2022 Reyes-Coronado, A.; Pirruccio, G.; Gonzalez-Alcalde, A. K.; Urrutia-Anguiano, J. A.; Polanco-Mendoza, A. J.; Morales-Luna, G.; Vazquez-Estrada, O.; Rodriguez-Gomez, A.; Issa, A.; Jradi, S.; Garcia-Valenzuela, A.; Barrera, R. G. Enhancement of Light Absorption by Leaky Modes in a Random Plasmonic Metasurface. Journal of Physical Chemistry C 2022, 126, 3163–3170, Place: Washington Publisher: Amer Chemical Soc WOS:000766228300025
- Jouanin et al. 2016 Jouanin, A.; Hugonin, J. P.; Lalanne, P. Designer Colloidal Layers of Disordered Plasmonic Nanoparticles for Light Extraction. Advanced Functional Materials 2016, 26, 6215–6223, _eprint: https://onlinelibrary.wiley.com/doi/pdf/10.1002/adfm.201600730
- Bertolotti 2018 Bertolotti, J. Designing disorder. Nature Photonics 2018, 12, 59–60, Number: 2 Publisher: Nature Publishing Group
- Rothammer et al. 2021 Rothammer, M.; Zollfrank, C.; Busch, K.; von Freymann, G. Tailored Disorder in Photonics: Learning from Nature. Advanced Optical Materials 2021, 9, 2100787, _eprint: https://onlinelibrary.wiley.com/doi/pdf/10.1002/adom.202100787
- Dupré et al. 2018 Dupré, M.; Hsu, L.; Kanté, B. On the design of random metasurface based devices. Scientific Reports 2018, 8, 7162, Number: 1 Publisher: Nature Publishing Group
- Yu et al. 2021 Yu, S.; Qiu, C.-W.; Chong, Y.; Torquato, S.; Park, N. Engineered disorder in photonics. Nature Reviews Materials 2021, 6, 226–243, Number: 3 Publisher: Nature Publishing Group
- Pestourie et al. 2023 Pestourie, R.; Yao, W.; Kanté, B.; Johnson, S. G. Efficient Inverse Design of Large-Area Metasurfaces for Incoherent Light. ACS Photonics 2023, 10, 854–860, Publisher: American Chemical Society
- Li et al. 2022 Li, Z.; Pestourie, R.; Lin, Z.; Johnson, S. G.; Capasso, F. Empowering Metasurfaces with Inverse Design: Principles and Applications. ACS Photonics 2022, 9, 2178–2192, Publisher: American Chemical Society
- Jiang et al. 2021 Jiang, J.; Chen, M.; Fan, J. A. Deep neural networks for the evaluation and design of photonic devices. Nature Reviews Materials 2021, 6, 679–700, Number: 8 Publisher: Nature Publishing Group
- Khoram et al. 2023 Khoram, E.; Wu, Z.; Qu, Y.; Zhou, M.; Yu, Z. Graph Neural Networks for Metasurface Modeling. ACS Photonics 2023, 10, 892–899, Publisher: American Chemical Society
- Hammond et al. 2023 Hammond, A. M.; Slaby, J. B.; Probst, M. J.; Ralph, S. E. Phase-Injected Topology Optimization for Scalable and Interferometrically Robust Photonic Integrated Circuits. ACS Photonics 2023, 10, 808–814, Publisher: American Chemical Society
- Ballew et al. 2023 Ballew, C.; Roberts, G.; Zheng, T.; Faraon, A. Constraining Continuous Topology Optimizations to Discrete Solutions for Photonic Applications. ACS Photonics 2023, 10, 836–844, Publisher: American Chemical Society
- Xu et al. 2022 Xu, M.; He, Q.; Pu, M.; Zhang, F.; Li, L.; Sang, D.; Guo, Y.; Zhang, R.; Li, X.; Ma, X.; Luo, X. Emerging Long-Range Order from a Freeform Disordered Metasurface. Advanced Materials 2022, 34, 2108709, Place: Weinheim Publisher: Wiley-V C H Verlag Gmbh WOS:000772421000042
- Xu et al. 2019 Xu, X.; Cisewski-Kehe, J.; Green, S. B.; Nagai, D. Finding cosmic voids and filament loops using topological data analysis. Astronomy and Computing 2019, 27, 34–52
- Heydenreich et al. 2021 Heydenreich, S.; Brück, B.; Harnois-Déraps, J. Persistent homology in cosmic shear: Constraining parameters with topological data analysis. Astronomy & Astrophysics 2021, 648, A74, Publisher: EDP Sciences
- Cramer Pedersen et al. 2020 Cramer Pedersen, M.; Robins, V.; Mortensen, K.; Kirkensgaard, J. J. K. Evolution of local motifs and topological proximity in self-assembled quasi-crystalline phases. Proceedings of the Royal Society a-Mathematical Physical and Engineering Sciences 2020, 476, 20200170, Place: London Publisher: Royal Soc WOS:000571133900001
- Hiraoka et al. 2016 Hiraoka, Y.; Nakamura, T.; Hirata, A.; Escolar, E. G.; Matsue, K.; Nishiura, Y. Hierarchical structures of amorphous solids characterized by persistent homology. Proceedings of the National Academy of Sciences of the United States of America 2016, 113, 7035–7040, Place: Washington Publisher: Natl Acad Sciences WOS:000379033400037
- Ormrod Morley et al. 2021 Ormrod Morley, D.; Salmon, P. S.; Wilson, M. Persistent homology in two-dimensional atomic networks. The Journal of Chemical Physics 2021, 154, 124109, Publisher: American Institute of Physics
- Hirata et al. 2020 Hirata, A.; Wada, T.; Obayashi, I.; Hiraoka, Y. Structural changes during glass formation extracted by computational homology with machine learning. Communications Materials 2020, 1, 98, Place: London Publisher: Springernature WOS:000610591200004
- Onodera et al. 2020 Onodera, Y.; Kohara, S.; Salmon, P. S.; Hirata, A.; Nishiyama, N.; Kitani, S.; Zeidler, A.; Shiga, M.; Masuno, A.; Inoue, H.; Tahara, S.; Polidori, A.; Fischer, H. E.; Mori, T.; Kojima, S.; Kawaji, H.; Kolesnikov, A. I.; Stone, M. B.; Tucker, M. G.; McDonnell, M. T. et al. Structure and properties of densified silica glass: characterizing the order within disorder. Npg Asia Materials 2020, 12, 85, Place: Berlin Publisher: Nature Research WOS:000603065100002
- Edelsbrunner and Harer 2022 Edelsbrunner, H.; Harer, J. L. Computational Topology: An Introduction; American Mathematical Society, 2022; Google-Books-ID: LiljEAAAQBAJ
- Chazal and Michel 2021 Chazal, F.; Michel, B. An Introduction to Topological Data Analysis: Fundamental and Practical Aspects for Data Scientists. Frontiers in Artificial Intelligence 2021, 4
- The GUDHI Project 2015 The GUDHI Project, GUDHI User and Reference Manual; GUDHI Editorial Board, 2015
- Bauer 2021 Bauer, U. Ripser: efficient computation of Vietoris-Rips persistence barcodes. J. Appl. Comput. Topol. 2021, 5, 391–423
- Edelsbrunner et al. 2000 Edelsbrunner, H.; Letscher, D.; Zomorodian, A. Topological persistence and simplification. Proceedings 41st Annual Symposium on Foundations of Computer Science. 2000; pp 454–463, ISSN: 0272-5428
- Wang 2012 Wang, J. In Geometric Structure of High-Dimensional Data and Dimensionality Reduction; Wang, J., Ed.; Springer: Berlin, Heidelberg, 2012; pp 115–129
- Hensel et al. 2021 Hensel, F.; Moor, M.; Rieck, B. A Survey of Topological Machine Learning Methods. Frontiers in Artificial Intelligence 2021, 4
- Leykam and Angelakis 2023 Leykam, D.; Angelakis, D. G. Topological data analysis and machine learning. Advances in Physics: X 2023, 8, 2202331, Publisher: Taylor & Francis _eprint: https://doi.org/10.1080/23746149.2023.2202331
- Membrillo Solis et al. 2022 Membrillo Solis, I.; Orlova, T.; Bednarska, K.; Lesiak, P.; Woliński, T. R.; D’Alessandro, G.; Brodzki, J.; Kaczmarek, M. Tracking the time evolution of soft matter systems via topological structural heterogeneity. Communications Materials 2022, 3, 1–11, Number: 1 Publisher: Nature Publishing Group
- Atienza et al. 2018 Atienza, N.; Gonzalez-Diaz, R.; Soriano-Trigueros, M. A new entropy based summary function for topological data analysis. Electronic Notes in Discrete Mathematics 2018, 68, 113–118
- He et al. 2022 He, Y.; Xia, S.; Angelakis, D. G.; Song, D.; Chen, Z.; Leykam, D. Persistent homology analysis of a generalized Aubry-Andre-Harper model. Physical Review B 2022, 106, 054210, Place: College Pk Publisher: Amer Physical Soc WOS:000861332900001
- Ali et al. 2022 Ali, D.; Asaad, A.; Jimenez, M.-J.; Nanda, V.; Paluzo-Hidalgo, E.; Soriano-Trigueros, M. A Survey of Vectorization Methods in Topological Data Analysis. 2022; \urlhttp://arxiv.org/abs/2212.09703, arXiv:2212.09703 [math]
- Fradkin et al. 2019 Fradkin, I. M.; Dyakov, S. A.; Gippius, N. A. Fourier modal method for the description of nanoparticle lattices in the dipole approximation. Physical Review B 2019, 99, 075310
- Cox 2000 Cox, T. C., Michael Multidimensional Scaling, 2nd ed.; Chapman and Hall/CRC: New York, 2000
- 61 COMSOL® v. 5.6. www.comsol.com. COMSOL AB, Stockholm, Sweden.