Network community detection via neural embeddings
Abstract
Recent advances in machine learning research have produced powerful neural graph embedding methods, which learn useful, low-dimensional vector representations of network data. These neural methods for graph embedding excel in graph machine learning tasks and are now widely adopted. However, how and why these methods work—particularly how network structure gets encoded in the embedding—remain largely unexplained. Here, we show that shallow neural graph embedding methods encode community structure as well as, or even better than, spectral embedding methods for both dense and sparse networks, with and without degree and community size heterogeneity. Our results provide the foundations for the design of novel effective community detection methods as well as theoretical studies that bridge network science and machine learning.
Significance statement
Graph embeddings map network data onto low-dimensional vector representations, which can be easily integrated into machine learning applications. We demonstrate that, for networks with planted communities, shallow linear neural networks for graph embedding—node2vec, DeepWalk, and LINE—capture the community structure down to the theoretical community detectability limit. Using benchmark networks with built-in communities, we show that neural embedding is a practical and robust approach to representing community structure, with comparable or even superior performance with respect to spectral embedding methods. Our results reveal that neural graph embedding can achieve the fundamental limit of community detectability without the need for deep layers and non-linear activation functions, laying the foundation for future research at the interface between network science and machine learning.
1 Introduction
Networks represent the structure of complex systems as sets of nodes connected by edges [1, 2, 3] and are ubiquitous across diverse domains, including social sciences [4, 5], transportation [6, 7], finance [8, 9], science of science [10, 11], neuroscience [12, 13], and biology [14, 15, 16]. Networks are complex, high-dimensional, and discrete objects, making it highly non-trivial to obtain useful representations of their structure. For instance, recommendation systems for social networks typically require informative variables (or “features”) that capture the most important structural characteristics. Often, these features are designed through trial and error, and may not be generalizable across networks.
Graph embeddings automatically identify useful structural features for network elements, most commonly for the nodes [17, 18]. Each node is represented as a point in a compact and continuous vector space. Such a vector representation enables the direct application of powerful machine learning methods, capable of solving various tasks, such as visualization [19, 20], clustering [21, 22], and prediction [23, 18, 24]. This representation can facilitate the operationalization of abstract concepts using vectorial operations [25, 26, 20, 27, 28]. Graph embeddings have been studied in various contexts. For example, spectral embedding stems from the spectral analysis of networks [17, 29]. A closely related formulation is matrix factorization [30, 31]. Recent years have witnessed a substantial shift towards a new paradigm of graph embeddings based on neural networks [32, 33, 34, 35, 36, 37, 20, 38, 22, 39, 40], which have demonstrated remarkable effectiveness across many computational tasks [23, 34, 38, 39, 35, 39, 40]. Yet, due to the inherent black-box nature of neural networks, how and why these methods work is still largely unknown, and we lack firm understanding of the process of encoding certain network structure onto embeddings.
One of the fundamental and ubiquitous features of networks is community structure, i.e., the existence of cohesive groups of nodes, characterized by a density of within-group edges that is higher than the density of edges between them [41, 42, 43]. In practice, neural graph embedding methods are widely used to discover communities from networks [31, 34, 38, 26].
The stochastic block model (SBM) is a basic generative model of networks with community structure [44, 45] and is regularly used as a benchmark for community detection algorithms. Some clustering methods are able to correctly classify all nodes into communities in large and dense networks generated by the SBM, provided that the average degree increases as the number of nodes increases [46, 47, 48, 21, 49, 50]. However, most networks of interest in applications are sparse [51, 1], in that their average degree is usually much smaller than the network size. The task of community detection is particularly hard on very sparse networks. For instance, the performance of many spectral methods significantly worsens as the graph gets sparser [52, 53], which has led to the development of remedies such as non-backtracking walks [52, 54, 53] and consensus clustering [55]. However, it remains unclear how neural graph embeddings perform on sparse networks, how much edge sparsity hampers their ability to detect communities, and how they fare for traditional clustering techniques, especially spectral methods.
Here, we prove that graph embedding methods based on a shallow neural network without non-linear activation—such as DeepWalk [38], LINE [39], and node2vec [34]—can detect communities all the way down to the information-theoretical limit on graphs generated by the SBM [56]. Our results imply that two common components of deep learning—multiple “deep” layers and non-linear activation—are not necessary to achieve the optimal limit of community detectability. Numerical experiments reveal that they have a remarkable performance also in the limit of sparse networks, getting close to the theoretically optimal performance curve of the belief propagation (BP) method [56] for networks generated by the SBM. In particular, node2vec [34] learns the community structure in more realistic networks with heterogeneous distributions of degree and community size substantially better than spectral embeddings, BP, and traditional clustering techniques. The excellent performance of node2vec is consistent across different levels of edge sparsity, community sizes, and degree heterogeneity. Our results might inform powerful community detection algorithms and improve our theoretical understanding of clustering via neural embeddings. We have made available the code to reproduce all the results at [57].
2 Results
2.1 Detectability limit of communities
We first consider the standard setting studied in papers concerning community detectability [53, 52, 58]. We focus on undirected and unweighted networks with community structure generated according to the planted partition model (PPM) [59], a special case of the SBM where nodes are divided into equal-sized communities, and two nodes are connected with probability if they are in the same community and with probability if they are in different communities. We assume that the networks are sparse, i.e., and are inversely proportional to the number of nodes. Therefore, the average degree and the ratio of edge probabilities do not depend on . We specify the edge probabilities via the mixing parameter . The mixing parameter indicates how blended communities are with each other. As , communities are well separated and easily detectable. For larger values of , community detection becomes harder. For , which corresponds to , the network is an Erdős-Rényi random graph and, as such, has no community structure. We note that the mixing parameter is slightly different from the traditional mixing parameter used in the Lancichinetti-Fortunato-Radicchi (LFR) benchmark, which is defined as . The difference between and is negligible for large .
Communities are present for all -values in the range , because the edges are more densely distributed within communities than between them. For a given algorithm, communities are detectable if the partition found by the algorithm has greater similarity with the planted partition than the trivial division in which node labels are randomly shuffled. However, it is shown that there is a regime , in which communities are not detectable by any algorithm [58, 56]. This is because, due to fluctuations in the numbers of neighbors within and between the groups, the true communities are effectively indistinguishable from random subgraphs with the same size, with respect to the imbalance between the internal and the external degree of the nodes. The threshold marks the information-theoretical detectability limit of communities in graphs generated by the PPM.
2.2 Detectability limit of node2vec
We determine the maximum mixing parameter below which communities are detectable by an algorithm, which we refer to as the algorithmic detectability limit. We first give a high-level description of our derivation of the algorithmic detectability limit for node2vec. We note that our derivation can be directly applied to other neural graph embeddings such as DeepWalk [38] and LINE [39]. See the Methods section for the step-by-step derivations.
Our analysis is based on the fact that node2vec generates its embedding by effectively factorizing a matrix when the number of dimensions is sufficiently large [30]. This insight enables us to study node2vec as a spectral method (see Methods). Spectral algorithms identify communities by computing the eigenvectors associated with the largest or smallest eigenvalues of a reference operator such as the combinatorial and normalized Laplacian matrices. Each eigenvector corresponds to a community in a network, with the entries having similar values for the nodes in that community. Therefore, when using eigenvectors to represent the network in vector space, nodes in the same community are projected onto points in space lying close to each other so that a data clustering algorithm can separate them [17].
The existence of such localized eigenvectors can be inferred by analyzing the spectrum of the reference operator using random matrix theory. For instance, this approach has been applied to determine the detectability limit of the normalized Laplacian matrix generated by the PPM [60]. We find that, under some mild conditions, the spectrum of the node2vec matrix is equivalent to that of the normalized Laplacian matrix. Hence, the detectability limit of node2vec matches that of the spectral embedding with the normalized Laplacian matrix [60]:
| (1) |
See Supporting Information Section 2 for the expression of the detectability limit in terms of the mixing parameter . This threshold exactly corresponds to the information-theoretical detectability limit of the PPM [58, 55]. In other words, node2vec has the ability to detect communities down to the information-theoretic limit in principle. However, like in the case of spectral modularity maximization [58], our analysis is only valid when the average degree is sufficiently large. Nevertheless, as we shall see, our numerical simulations show that node2vec performs well even if the average degree is small.
2.3 Experiment setup
As baselines, we use two spectral embedding methods whose detectability limit matches the information-theoretical one: spectral modularity maximization [58] and Laplacian EigenMap [61]. In addition, we use two other neural embeddings, DeepWalk [38] and LINE [39]. DeepWalk and LINE share the same architecture as node2vec but are trained with different objective functions [30, 62]. Furthermore, we employ the spectral algorithm based on the leading eigenvectors of the non-backtracking matrix, which reaches the information-theoretical limit even in the sparse case for networks generated by the PPM [52]. For all embedding methods, we set the number of dimensions, , to . Finally, we employ three community detection algorithms: Infomap [63], statistical inference of the microscopic degree-corrected SBM [44], and the BP algorithm [56]. Note that we set the initial parameters of the BP algorithm based on the ground-truth communities to yield the maximal performance. See Supporting Information Section 4 for the parameter choices of the models and the implementations we used.
Community detection via graph embedding is a two-step process:
-
•
First, the network is embedded, which yields a projection of nodes onto points in a vector space.
-
•
Second, the points are divided into groups using a data clustering method (e.g., -means clustering).
Thus, the performance of community detection depends on both the quality of the embedding and the performance of the subsequent data clustering procedure. Since we focus on the ability of neural embedding methods to generate representations where clusters are detectable, we want to control the second step by using an ideal clustering method that can optimally find the clusters for a given representation. To do so, we use a -means algorithm with fixed centroids (i.e., Voronoi clustering), whose positions are determined by the locations of the true communities in the embedding space, and clustering is performed by assigning each point/node to the centroid/cluster with the highest cosine similarity. See Supporting Information Section 6 for the results for the ordinal -means algorithm. By using this algorithm, we can focus on the question of whether an embedding method can successfully encode community structure or not.
We assess the performance by comparing the similarity between the planted partition of the network and the detected partition of the algorithm. We used the element-centric similarity [64], denoted by , with an adjustment such that a random shuffling of the community memberships for the two partitions yields on expectation (See Supporting Information Section 1). This way, for planted divisions into equal-sized communities, represents the baseline performance of the trivial algorithm, while indicates that communities are detectable by the given algorithm.
2.4 Simulations: Planted Partition Model
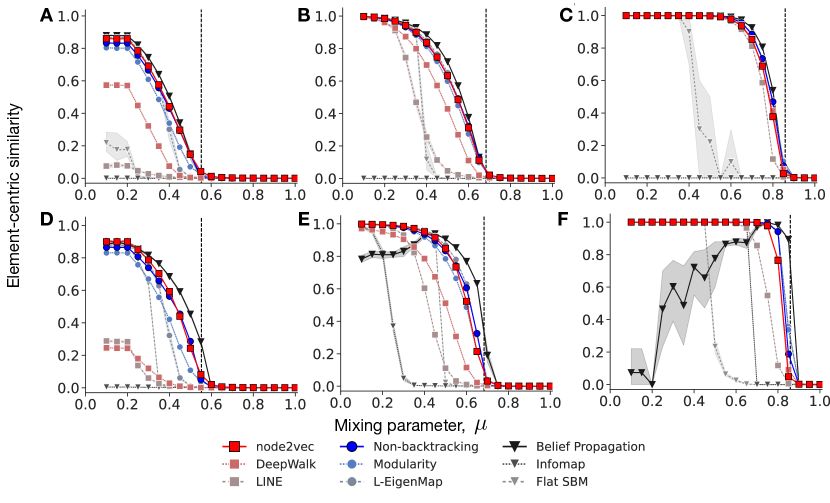
We test the graph embedding and community detection algorithms on networks of nodes generated by the PPM, with communities of equal size and average degree (Fig. 1). Spectral methods find communities better than random guessing below the detectability limit , i.e. , for and (Figs. 1C and F). However, their performance is much worse when the average degree is small (, Figs. 1A and D). For example, Laplacian EigenMap falls short below the detectability limit (), despite having the optimal detectability limit when the average degree is sufficiently large [65]. All techniques, including BP, which is supposed to be optimal for sparse networks, fail the exact recovery of the clusters for sparse networks even if the value of is low (, Figs. 1A and D). We find that misclassifications are inevitable for these highly sparse networks because some nodes end up being connected with other communities more densely than with their own community by random chance. The BP algorithm also fails for the networks with communities, even for small values. This may be because BP employs a greedy optimization strategy that may converge to a suboptimal solution near the starting point. Notably, the poor performance of the BP algorithm is mainly observed in the networks with 50 communities (), where the prevalence of many local minima may exacerbate the limitations of the greedy optimization.
On the other hand, node2vec is substantially better than the spectral methods, and its performance is the closest to that of the BP algorithm for sparse networks (Figs. 1A and D). node2vec consistently achieves a good performance across different numbers of communities and different network sparsity. Furthermore, node2vec performs well even if we reduce the embedding dimension from to , which is smaller than the number of communities in the cases where (Supporting Information Section 5).
2.5 Simulations: LFR benchmark
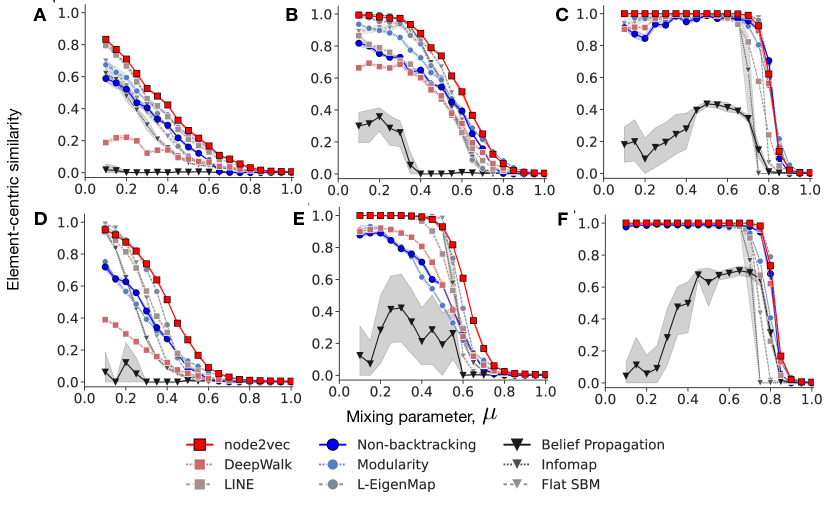
The PPM is a stylized model that lacks key characteristics of empirical community structure. We test the graph embedding using more realistic networks generated by the LFR model [66], which produces networks with heterogeneous degree and community size distributions, to assess the performance of the methods in a more practical context. Unlike the PPM, however, the theoretical detectability limit of communities in LFR networks is not known. We build the LFR networks by using the following parameter values: number of nodes , degree exponent , average degree , maximum degree , community-size exponent , community size range .
In LFR networks, the BP algorithm and the non-backtracking embedding—which have an excellent performance on the PPM networks, at least in theory—underperform noticeably, suggesting that optimal methods for the standard PPM may not perform well in practice. On the other hand, node2vec consistently has the best performance, with a larger margin in sparser networks (Fig. 2). The performance of node2vec is also consistent across networks with different levels of degree heterogeneity. Even with the smaller embedding dimension , node2vec performs comparably well with Infomap, which is known to be very accurate on LFR networks [67] (Supporting Information Section 5).
3 Discussion
We investigated the ability of neural graph embeddings to encode communities by focusing on shallow linear graph neural networks—node2vec, DeepWalk, and LINE—and comparing them with traditional spectral approaches. We proved that, for not too sparse networks created by the PPM, node2vec is an optimal method to encode their community structure in that the algorithmic detectability limit coincides with the information-theoretic limit. In particular, our experiments on the PPM and LFR benchmarks show that node2vec consistently excels on sparse networks with small and moderate average degree, with homogeneous and heterogeneous degrees and community sizes in the detectable regime, demonstrating its high robustness and potential in the analysis of empirical networks.
Our results provide an alternative perspective to the common design principles of neural networks widely accepted for text and image processing. In these applications, deep neural structures and non-linear activation are considered indispensable in order to achieve high performance. The neural network architecture is also critical for graph neural networks for community detection task [68]. Our findings further demonstrate that a simple neural network with only one hidden layer and no non-linear activation can achieve the information-theoretical detectability limit of communities with performance close to or superior than the best methods for community detection.
DeepWalk [38] and LINE [39] are also optimal in terms of the detectability limit of communities (Supplementary Information Section 2). However, node2vec surpasses both DeepWalk and LINE in numerical tests, owing to two key features. First, node2vec learns degree-agnostic embeddings, which are highly robust against degree heterogeneity [62]. By contrast, DeepWalk tends to learn node degree as the primary dimension in the embedding space [62]. Consequently, degree heterogeneity introduces considerable noise to the community structure in the DeepWalk embedding. Second, LINE is a specific instance of node2vec with window size [30], and thus learns the dyadic relationships between nodes. As is the case for node2vec, LINE is resilient to degree heterogeneity, and performed closely to node2vec for some networks in our simulations. However, it did not perform as well as node2vec, and this discrepancy may be attributed to LINE’s emphasis on learning stochastic and noisy dyadic relationships, as opposed to the indirect relationships that node2vec captures.
Our results come with caveats. First, we focused on the best achievable clustering performance—by using Voronoi clustering with the centroids of the planted communities—because we wanted to control any factors coming from the data clustering step so that we could focus on the representation learning. However, we also fine-tuned other community detection methods—the SBM and the BP algorithm—using the information on the planted partition, such as the number of communities, their sizes, and edge probabilities. Thus, caution should be taken when interpreting the results: our analysis reports an upper bound on the performance, and the actual performance in practice will depend on the choice and configuration of the data clustering method. Indeed, a previous study [22] using the -means algorithm demonstrated that node2vec did not perform as well as standard community detection methods even if its hyperparameters are fine-tuned. By contrast, we did not fine-tune the parameters of our embedding methods. Hence, we believe that the previous results [22] are primarily due to the limitations of the -means clustering algorithm (when the initial position of the centroids is arbitrarily chosen), rather than to the embedding.
Second, in our analytical derivations, we assumed that the average degree is sufficiently large, as is the case for the corresponding analysis of spectral modularity maximization [58]. Thus, the optimality may not hold if networks are substantially sparse. However, our simulations suggested that node2vec is resilient to network sparsity compared with traditional spectral embedding methods. Understanding the factor inducing such resilience will be interesting for future work.
Third, while we restricted ourselves to the community detection task, graph embeddings have been used for other tasks, including link prediction, node classification, and anomaly detection. Investigating the theoretical foundation behind the performance of neural embeddings in other tasks is a promising research direction.
Even with these caveats, we believe that our study will provide the foundation for future studies that uncover the inner workings of neural embedding methods and bridge the study of artificial neural networks to network science.
4 Methods
4.1 node2vec as spectral embedding
node2vec learns the structure of a given network based on random walks. A random walk traverses a given network by following randomly chosen edges and generates the sequence of nodes . The sequence is then fed into skip-gram word2vec [69], which learns how likely it is that a node appears in the surrounding of another node up to a certain time lag (i.e., window length) through the conditional probability
where , , and is a normalization constant. Each node is associated to two vectors: vector represents the embedding of node ; represents node as a context of other nodes. Because the normalization constant is computationally expensive, node2vec uses a heuristic training algorithm, i.e., negative sampling [69]. When trained with negative sampling, skip-gram word2vec is equivalent to a spectral embedding that factorizes matrix with elements [70, 30]:
| (2) |
in the limit of with greater than or equal to the network diameter, where is the probability that the node in the given sequence is node (see Supporting Information Section 3 for the step-by-step derivation). This interpretation of node2vec as a spectral embedding allows us to derive the algorithmic detectability limit from the spectrum of .
Deriving the spectrum of in a closed form is challenging because involves element-wise logarithms. We approximate the element-wise logarithm by a linear function by assuming that the window length is sufficiently large. To demonstrate our argument, let us describe in the language of random walks. Given that the network is undirected and unweighted, the probability corresponds to the long-term probability of finding the random walker at node . The probability refers to the transition of a walker from node to node after steps. In the limit , the walker reaches the stationary state, and approaches . Thus, in the regime of a sufficiently large , we take the Taylor expansion of around and obtain
| (3) |
In matrix form,
| (4) |
where is the adjacency matrix, is a diagonal matrix whose diagonal element is the degree of node , is the number of edges in the network, and is the all-one matrix. We used and , derived from the fact that is proportional to degree in undirected networks; is the transition matrix, whose th power represents the random walk transition probability after steps.
The node2vec matrix has a connection to the normalized Laplacian matrix, , which is tightly related to the characteristics of random walks and network communities [71]. The normalized Laplacian matrix is defined by . By using an alternative expression of the transition probability, i.e., , we rewrite as
| (5) |
where is a column vector of length . We note that vector is a trivial eigenvector of associated with the null eigenvalue, . Furthermore, changes the eigenvalues while keeping the eigenvectors intact. This means that can be specified by using the spectrum of , i.e.,
| (6) |
where is the matrix of the eigenvectors of , and is a graph kernel [18] that transforms the eigenvalues () of by
| (9) |
or equivalently if (Fig. 3). Equation (6) tells us that the eigenvectors of are equivalent to the eigenvectors of the normalized Laplacian matrix, up to a linear transformation given by
| (10) |
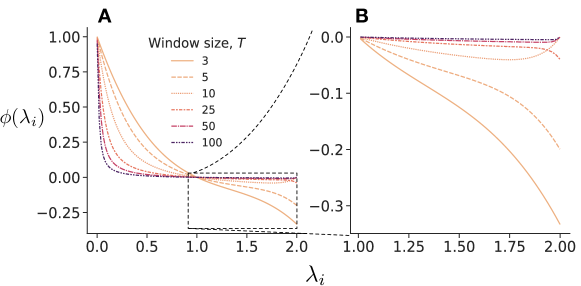
Building on the correspondence between the normalized Laplacian and the node2vec matrix , we derive the algorithmic community detectability limit of node2vec. Following [58, 65, 60], we assume that the network consists of two communities generated by the PPM. Then, the non-trivial eigenvector of encodes the communities and has the optimal detectability limit of communities, provided that the average degree is large ((1)) [58, 65, 60]. This non-trivial eigenvector of corresponds to the principal eigenvector of . Specifically, the non-trivial eigenvector of is associated with the smallest non-zero eigenvalue , which is when each community is densely connected within itself and sparsely with other communities [17]. The eigenvalues are mirrored in the eigenvalues of , and —the smallest non-zero eigenvalue—yields the maximum -value (Fig. 3)
This correspondence of non-trivial eigenvectors between and suggests that communities detectable by are also detectable by and vice versa. Thus, spectral embedding with has the same information-theoretic detectability limit as spectral methods relying on eigenvectors of , for networks with sufficiently high degree.
4.2 Detectability limit of DeepWalk
We expand our argument to include DeepWalk [38]. Similar to node2vec, DeepWalk also trains word2vec but with a different objective function. Furthermore, DeepWalk is equivalent to a matrix factorization if the embedding dimension is sufficiently large and the window size is greater than the network’s diameter [30, 62]. More specifically, DeepWalk generates an embedding by factorizing a matrix with entries [62]:
| (11) |
in the limit of with being greater than the network diameter. When the random walker is in the stationary state at time and makes sufficiently many steps , we have
| (12) |
In particular, if the degree distribution is Poisson and the average degree is sufficiently large,
| (13) |
which is true for the PPM. By substituting (13) into (12), we obtain
| (14) |
Armed with this result, let us derive the detectability limit of DeepWalk. Assuming that the window length is large, we take the Taylor expansion of (11) around and obtain
| (15) |
In matrix form,
| (16) |
Note that is similar to the node2vec matrix ((4)). The right/left eigenvectors of are obtained from those of the normalized Laplacian by simple multiplications by the operators and , respectively. Therefore, DeepWalk has the information-theoretical detectability limit as well.
4.3 Detectability limit of LINE
LINE [39] is a special version of node2vec with the window length being . The corresponding matrix factorized by LINE is given by [30]:
| (17) |
For LINE, although Ref. [30] shows , we introduce a small positive value to prevent the matrix elements from being infinite for . To obtain the spectrum of , we exploit the Taylor expansion around , where . Specifically, assuming that the average degree is sufficiently large, we obtain
| (18) |
or equivalently in matrix form
| (19) |
where . Equation (19) is reminiscent of (5) for node2vec. Comparing Eqs. (19) and (5), it immediately follows that they share the same eigenvectors, and thus node2vec and LINE have the same detectability threshold.
Acknowledgement
This project was partially supported by the Army Research Office under contract number W911NF-21-1-0194, by the Air Force Office of Scientific Research under award numbers FA9550-19-1-0391 and FA9550-21-1-0446, and by the National Science Foundation under award numbers 1927418, and by the National Institutes of Health under awards U01 AG072177 and U19 AG074879.
Contributions
All authors conceived the research, discussed, and wrote the manuscript. S.K. and F.R. performed the analysis and experiments.
Competing interest
The authors have no competing interest.
Data sharing plans
We made available the code and documentations to reproduce all results. See [57] for details.
References
- [1] Albert-László Barabási and Márton Pósfai. Network Science. Cambridge University Press, Cambridge, United Kingdom, 1st edition edition, 2016.
- [2] Filippo Menczer, Santo Fortunato, and Clayton A. Davis. A First Course in Network Science. Cambridge University Press, Cambridge, 1st edition edition, 2020.
- [3] Mark Newman. Networks. Oxford University Press, Oxford, United Kingdom ; New York, NY, United States of America, 2nd edition edition, 2018.
- [4] Alan Mislove, Sune Lehmann, Yong-Yeol Ahn, Jukka-Pekka Onnela, and J. Rosenquist. Understanding the Demographics of Twitter Users. Proceedings of the International AAAI Conference on Web and Social Media, 5(1):554–557, 2011.
- [5] Sadamori Kojaku, Laurent Hébert-Dufresne, Enys Mones, Sune Lehmann, and Yong-Yeol Ahn. The effectiveness of backward contact tracing in networks. Nature Physics, 17(5):652–658, 2021.
- [6] Marc Barthélemy. Spatial networks. Physics Reports, 499(1):1–101, 2011.
- [7] Vittoria Colizza, Alain Barrat, Marc Barthélemy, and Alessandro Vespignani. The role of the airline transportation network in the prediction and predictability of global epidemics. Proceedings of the National Academy of Sciences, 103(7):2015–2020, 2006.
- [8] Marco Bardoscia, Paolo Barucca, Stefano Battiston, Fabio Caccioli, Giulio Cimini, Diego Garlaschelli, Fabio Saracco, Tiziano Squartini, and Guido Caldarelli. The physics of financial networks. Nature Reviews Physics, 3(7):490–507, 2021.
- [9] Paolo Barucca, Marco Bardoscia, Fabio Caccioli, Marco D’Errico, Gabriele Visentin, Guido Caldarelli, and Stefano Battiston. Network valuation in financial systems. Mathematical Finance, 30(4):1181–1204, 2020.
- [10] M. E. J. Newman. The structure of scientific collaboration networks. Proceedings of the National Academy of Sciences, 98(2):404–409, 2001.
- [11] Aaron Clauset, Samuel Arbesman, and Daniel B. Larremore. Systematic inequality and hierarchy in faculty hiring networks. Science Advances, 1(1):e1400005, 2015.
- [12] Danielle S. Bassett and Olaf Sporns. Network neuroscience. Nature Neuroscience, 20(3):353–364, 2017.
- [13] Danielle Smith Bassett and ED Bullmore. Small-world brain networks. The neuroscientist, 12(6):512–523, 2006.
- [14] Junil Kim, Sang-Min Park, and Kwang-Hyun Cho. Discovery of a kernel for controlling biomolecular regulatory networks. Scientific Reports, 3, 2013.
- [15] Regina Samaga and Steffen Klamt. Modeling approaches for qualitative and semi-quantitative analysis of cellular signaling networks. Cell Communication and Signaling : CCS, 11:43 – 43, 2013.
- [16] Jordan C. Rozum, Jorge Gómez Tejeda Zañudo, Xiao Gan, Dávid Deritei, and Réka Albert. Parity and time reversal elucidate both decision-making in empirical models and attractor scaling in critical boolean networks. Science Advances, 7, 2020.
- [17] Ulrike von Luxburg. A tutorial on spectral clustering. Statistics and Computing, 17(4):395–416, 2007.
- [18] Jérôme Kunegis and Andreas Lommatzsch. Learning spectral graph transformations for link prediction. In Proceedings of the 26th Annual International Conference on Machine Learning, ICML ’09, pages 561–568, New York, NY, USA, 2009. Association for Computing Machinery.
- [19] Maximillian Nickel and Douwe Kiela. Poincaré Embeddings for Learning Hierarchical Representations. In Advances in Neural Information Processing Systems, volume 30. Curran Associates, Inc., 2017.
- [20] Hao Peng, Qing Ke, Ceren Budak, Daniel M. Romero, and Yong-Yeol Ahn. Neural embeddings of scholarly periodicals reveal complex disciplinary organizations. Science Advances, 7(17):eabb9004, 2021.
- [21] Aman Barot, Shankar Bhamidi, and Souvik Dhara. Community detection using low-dimensional network embedding algorithms. (arXiv:2111.05267), 2021.
- [22] Aditya Tandon, Aiiad Albeshri, Vijey Thayananthan, Wadee Alhalabi, Filippo Radicchi, and Santo Fortunato. Community detection in networks using graph embeddings. Physical Review E, 103(2):022316, 2021.
- [23] Hongxu Chen, Hongzhi Yin, Weiqing Wang, Hao Wang, Quoc Viet Hung Nguyen, and Xue Li. PME: Projected Metric Embedding on Heterogeneous Networks for Link Prediction. In Proceedings of the 24th ACM SIGKDD International Conference on KDD, KDD ’18, pages 1177–1186, New York, NY, USA, 2018. Association for Computing Machinery.
- [24] Farzan Masrour, Tyler Wilson, Heng Yan, Pang-Ning Tan, and Abdol Esfahanian. Bursting the Filter Bubble: Fairness-Aware Network Link Prediction. Proceedings of the AAAI Conference on Artificial Intelligence, 34(01):841–848, 2020.
- [25] Haewoon Kwak, Jisun An, Elise Jing, and Yong-Yeol Ahn. FrameAxis: Characterizing microframe bias and intensity with word embedding. PeerJ Computer Science, 7:e644, 2021.
- [26] Dakota Murray, Jisung Yoon, Sadamori Kojaku, Rodrigo Costas, Woo-Sung Jung, Staša Milojević, and Yong-Yeol Ahn. Unsupervised embedding of trajectories captures the latent structure of mobility. (arXiv:2012.02785), 2021.
- [27] Jamshid Sourati and James Evans. Accelerating science with human versus alien artificial intelligences. (arXiv:2104.05188), 2021.
- [28] Vahe Tshitoyan, John Dagdelen, Leigh Weston, Alexander Dunn, Ziqin Rong, Olga Kononova, Kristin A. Persson, Gerbrand Ceder, and Anubhav Jain. Unsupervised word embeddings capture latent knowledge from materials science literature. Nature, 571(7763):95–98, 2019.
- [29] M. E. J. Newman. Finding community structure in networks using the eigenvectors of matrices. Physical Review E, 74(3):036104, 2006.
- [30] Jiezhong Qiu, Yuxiao Dong, Hao Ma, Jian Li, Kuansan Wang, and Jie Tang. Network Embedding as Matrix Factorization: Unifying DeepWalk, LINE, PTE, and node2vec. In Proceedings of the Eleventh ACM International Conference on WSDM, WSDM ’18, pages 459–467, New York, NY, USA, 2018. Association for Computing Machinery.
- [31] Jeffrey Pennington, Richard Socher, and Christopher Manning. GloVe: Global Vectors for Word Representation. In Proceedings of the 2014 Conference on EMNLP, pages 1532–1543, Doha, Qatar, 2014. Association for Computational Linguistics.
- [32] Chirag Agarwal, Himabindu Lakkaraju, and Marinka Zitnik. Towards a unified framework for fair and stable graph representation learning. In Cassio de Campos and Marloes H. Maathuis, editors, Proceedings of the Thirty-Seventh Conference on Uncertainty in Artificial Intelligence, volume 161 of Proceedings of Machine Learning Research, pages 2114–2124. PMLR, 2021.
- [33] Arash Dehghan-Kooshkghazi, Bogumił Kamiński, Łukasz Kraiński, Paweł Prałat, and François Théberge. Evaluating node embeddings of complex networks. Journal of Complex Networks, 10(4):cnac030, 2022.
- [34] Aditya Grover and Jure Leskovec. Node2vec: Scalable Feature Learning for Networks. In Proceedings of the 22nd ACM SIGKDD International Conference on KDD, KDD ’16, pages 855–864, New York, NY, USA, 2016. Association for Computing Machinery.
- [35] Will Hamilton, Zhitao Ying, and Jure Leskovec. Inductive Representation Learning on Large Graphs. In Advances in Neural Information Processing Systems, volume 30. Curran Associates, Inc., 2017.
- [36] Lu Liu, Nima Dehmamy, Jillian Chown, C. Lee Giles, Dashun Wang, and Dashun Wang. Understanding the onset of hot streaks across artistic, cultural, and scientific careers. Nature Communications, 12(1):5392, 2021.
- [37] Lingqi Meng and Naoki Masuda. Analysis of node2vec random walks on networks. Proceedings of the Royal Society A: Mathematical, Physical and Engineering Sciences, 476(2243):20200447, 2020.
- [38] Bryan Perozzi, Rami Al-Rfou, and Steven Skiena. DeepWalk: Online learning of social representations. In Proceedings of the 20th ACM SIGKDD International Conference on KDD, KDD ’14, pages 701–710, New York, NY, USA, 2014. Association for Computing Machinery.
- [39] Jian Tang, Meng Qu, Mingzhe Wang, Ming Zhang, Jun Yan, and Qiaozhu Mei. LINE: Large-scale Information Network Embedding. In Proceedings of the 24th International Conference on World Wide Web, WWW ’15, pages 1067–1077, Republic and Canton of Geneva, CHE, 2015. International World Wide Web Conferences Steering Committee.
- [40] Petar Veličković, Guillem Cucurull, Arantxa Casanova, Adriana Romero, Pietro Liò, and Yoshua Bengio. Graph Attention Networks. International Conference on Learning Representations, 2018. accepted as poster.
- [41] Santo Fortunato. Community detection in graphs. Physics Reports, 486(3):75–174, 2010.
- [42] Santo Fortunato and Darko Hric. Community detection in networks: A user guide. Physics Reports, 659:1–44, 2016.
- [43] Santo Fortunato and Mark E. J. Newman. 20 years of network community detection. Nature Physics, 18(8):848–850, 2022.
- [44] Tiago P. Peixoto. Parsimonious module inference in large networks. Physical Review Letters, 110(14):148701, 2013.
- [45] Brian Karrer and M. E. J. Newman. Stochastic blockmodels and community structure in networks. Physical Review E, 83(1):016107, 2011.
- [46] Yichi Zhang and Minh Tang. Exact Recovery of Community Structures Using DeepWalk and Node2vec. (arXiv:2101.07354), 2022.
- [47] Pin-Yu Chen and Alfred O. Hero. Universal phase transition in community detectability under a stochastic block model. Physical Review E, 91(3):032804, 2015.
- [48] Pin-Yu Chen and Alfred O. Hero. Phase Transitions in Spectral Community Detection. IEEE Transactions on Signal Processing, 63(16):4339–4347, 2015.
- [49] Yichi Zhang and Minh Tang. Consistency of random-walk based network embedding algorithms. (arXiv:2101.07354), 2021.
- [50] Emmanuel Abbe and Colin Sandon. Community detection in general stochastic block models: Fundamental limits and efficient algorithms for recovery. 2015 IEEE 56th Annual Symposium on Foundations of Computer Science, pages 670–688, 2015.
- [51] M. E. J. Newman. Networks: An introduction. Oxford University Press, Oxford; New York, 2010.
- [52] Florent Krzakala, Cristopher Moore, Elchanan Mossel, Joe Neeman, Allan Sly, Lenka Zdeborová, and Pan Zhang. Spectral redemption in clustering sparse networks. Proceedings of the National Academy of Sciences, 110(52):20935–20940, 2013.
- [53] Florent Benaych-Georges, Charles Bordenave, and Antti Knowles. Spectral radii of sparse random matrices. Annales de l’Institut Henri Poincaré, Probabilités et Statistiques, 56(3):2141 – 2161, 2020.
- [54] M. E. J. Newman. Spectral community detection in sparse networks. (arXiv:1308.6494), 2013.
- [55] Pan Zhang and Cristopher Moore. Scalable detection of statistically significant communities and hierarchies, using message passing for modularity. PNAS, 111(51):18144–18149, 2014.
- [56] Aurelien Decelle, Florent Krzakala, Cristopher Moore, and Lenka Zdeborová. Asymptotic analysis of the stochastic block model for modular networks and its algorithmic applications. Physical Review E, 84(6):066106, 2011.
- [57] Code: Network clustering via neural embedding. https://github.com/skojaku/research_graph_emb_detec_limit, 2023. Accessed: 2023-06-08.
- [58] Raj Rao Nadakuditi and M. E. J. Newman. Graph Spectra and the Detectability of Community Structure in Networks. Physical Review Letters, 108(18):188701, 2012.
- [59] Anne Condon and Richard M. Karp. Algorithms for Graph Partitioning on the Planted Partition Model. In Dorit S. Hochbaum, Klaus Jansen, José D. P. Rolim, and Alistair Sinclair, editors, Randomization, Approximation, and Combinatorial Optimization. Algorithms and Techniques, Lecture Notes in Computer Science, pages 221–232, Berlin, Heidelberg, 1999. Springer.
- [60] Filippo Radicchi. Detectability of communities in heterogeneous networks. Phys. Rev. E, 88:010801, 7 2013.
- [61] Mikhail Belkin and Partha Niyogi. Laplacian Eigenmaps for Dimensionality Reduction and Data Representation. Neural Computation, 15(6):1373–1396, 2003.
- [62] Sadamori Kojaku, Jisung Yoon, Isabel Constantino, and Yong-Yeol Ahn. Residual2Vec: Debiasing graph embedding with random graphs. In Advances in Neural Information Processing Systems, volume 34, pages 24150–24163. Curran Associates, Inc., 2021.
- [63] Martin Rosvall and Carl T. Bergstrom. Maps of random walks on complex networks reveal community structure. Proceedings of the National Academy of Sciences, 105(4):1118–1123, 2008.
- [64] Alexander J. Gates, Ian B. Wood, William P. Hetrick, and Yong-Yeol Ahn. Element-centric clustering comparison unifies overlaps and hierarchy. Scientific Reports, 9(1):8574, 2019.
- [65] Filippo Radicchi. A paradox in community detection. EPL (Europhysics Letters), 106(3):38001, 2014.
- [66] Andrea Lancichinetti, Santo Fortunato, and Filippo Radicchi. Benchmark graphs for testing community detection algorithms. Physical Review E, 78(4):046110, 2008.
- [67] Andrea Lancichinetti and Santo Fortunato. Community detection algorithms: a comparative analysis. Physical review E, 80(5):056117, 2009.
- [68] Tatsuro Kawamoto, Masashi Tsubaki, and Tomoyuki Obuchi. Mean-field theory of graph neural networks in graph partitioning. In Advances in Neural Information Processing Systems, volume 31. Curran Associates, Inc., 2018.
- [69] Tomas Mikolov, Ilya Sutskever, Kai Chen, Greg S Corrado, and Jeff Dean. Distributed Representations of Words and Phrases and their Compositionality. In Advances in Neural Information Processing Systems, volume 26. Curran Associates, Inc., 2013.
- [70] Omer Levy and Yoav Goldberg. Neural Word Embedding as Implicit Matrix Factorization. In Advances in Neural Information Processing Systems, volume 27. Curran Associates, Inc., 2014.
- [71] Naoki Masuda, Mason A. Porter, and Renaud Lambiotte. Random walks and diffusion on networks. Physics Reports, 716–717:1–58, 2017.