Spatially Resolved Kinematics of Extraplanar Diffuse Ionized Gas in NGC 3511 and NGC 3513
Abstract
Gaseous, disk-halo interfaces are shaped by physical processes that are critical to disk galaxy evolution, including gas accretion and galactic outflows. However, observations indicate that extraplanar diffuse ionized gas (eDIG) layers have scale heights several times higher than their thermal scale heights. This discrepancy poses a challenge to our current understanding of the disk-halo interface. In this paper, we present a spatially-resolved case study of the eDIG layers in a nearby pair of sub- disk galaxies NGC 3511/3513 using long-slit spectroscopy. We decompose optical nebular lines from the warm interstellar medium and disk-halo interfaces into narrow and broad velocity components. We show that in NGC 3511, the broad component has three distinctive characteristics in comparison to the narrow component: (1) elevated [N ii]6583/H and [S ii]6716/H line ratios, (2) significantly higher velocity dispersions (a median km s-1compared to km s-1), and (3) a rotational velocity lag. Together, these characteristics support an origin in an extraplanar, thick gaseous disk. In NGC 3513, the broad component is consistent with localized outflows making their way out of the galactic disk. Our findings demonstrate that gas circulation at the disk-halo interface is present in both galaxies. Additionally, we test a dynamic equilibrium model with pressure support supplied by thermal and turbulent motions. Based on measurements of the eDIG velocity dispersion in NGC 3511, we demonstrate that turbulent motions increase the scale height by at least a factor of a few above the thermal scale height, with kpc at kpc. This highlights the importance of turbulent motions to the vertical structure of the gaseous, disk-halo interface.
keywords:
galaxies: disc – galaxies: ISM – ISM: kinematics and dynamics – turbulence1 Introduction
The exchange of gas, metals, and energy through a boundary layer where the galactic disk transitions into the galactic halo, i.e. the gaseous disk-halo interface, drives the evolution of disk galaxies. Gas accretion is needed to replenish galaxies’ gas supplies and sustain star formation, while star-formation feedback expels chemically-enriched gas into the surrounding circumgalactic medium (CGM) and intergalactic medium (IGM). Together, these processes determine the star-formation histories of galaxies and affect their chemical abundances. Since gas passes through the disk-halo interface in all of the accretion and feedback processes, studying the density distribution and kinematics of the disk-halo interface gives important information about these key processes driving galaxy evolution.
Across the disk–halo interface, there is a transition in the phase, density, and kinematics of the gas. Early observations revealed the presence of a diffuse layer of warm ionized gas in our own Milky Way, known as the Reynolds Layer (Hoyle & Ellis, 1963; Reynolds et al., 1973). Reynolds (1989) found that this ionized gas has unexpectedly large scale height ( kpc) compared to its thermal scale height ( kpc). In many nearby galaxies, analogous distributions of extraplanar diffuse ionized gas (eDIG) have been found (e.g., Dettmar, 1990; Rand et al., 1990; Lehnert & Heckman, 1995; Rand, 1996; Hoopes et al., 1999; Rossa & Dettmar, 2003a; Haffner et al., 2009; Jones et al., 2017; Levy et al., 2019). These diffuse gas layers are vertically extended and photoionized with a typical temperature of K and an inferred mid-plane mean electron density of cm-3.
| SFR b | ||||||
| Galaxy | Redshift | (arcmin) | (deg) | (/yr) | )c | log(Specific SFR/yr-1) |
| NGC 3511 | 0.00370 | 6.0 | 74.5 | 0.8 | ||
| NGC 3513 | 0.00398 | 2.8 | 39.0 | 0.2 | ||
| a Disk diameter corresponding to mag arcsec-2 isophot (Makarov et al., 2014). | ||||||
| b SFR based on FUV and MIR observations with an uncertainty of 0.2 dex (Leroy et al., 2019, 2021). | ||||||
| c reported by Leroy et al. (2019) and Leroy et al. (2021). | ||||||
The dynamic state of the eDIG layers and its implications are not yet understood. Proposed mechanisms for the eDIG origin include (a) internally, the star-formation driven disk-halo flow (e.g., the superbubble breakout model (Mac Low & McCray, 1988), the galactic chimney model (Norman & Ikeuchi, 1989), the galactic fountain model (Shapiro & Field, 1976), and the galactic wind model (Veilleux et al., 2005, and references therein)), and (b) externally, gas accretion from the IGM (e.g., Binney, 2005; Putman, 2017, and references therein), or the hot halo (Marasco et al., 2012; Li et al., 2023). Numerous models exist to explain the vertical structure and kinematics of the eDIG layers. A simple first step is to determine the ingredients needed to generate sufficient vertical pressure to stably support eDIG layers under a dynamic equilibrium. In a series of papers (Boettcher et al., 2016, 2017, 2019), individual case studies were conducted on nearby galaxies to investigate whether or not turbulent, magnetic field, and cosmic-ray pressure gradients, in addition to the thermal pressure gradient, are sufficient to support the eDIG layers at the observed scale heights. However, constraints on the vertical kinematics of the eDIG have been limited to date (e.g., Fraternali et al., 2004; Boettcher et al., 2017; Li et al., 2021), hindering our understanding of eDIG dynamics perpendicular to their host galaxies. In this paper, we apply such analysis to a nearby galaxy pair NGC 3511 and NGC 3513.
NGC 3511 is a nearby disk galaxy (; Koribalski et al. 2004) that is highly inclined with an inclination angle of (Makarov et al. 2014). It is in close proximity to the companion galaxy NGC 3513, with a projected separation of kpc. NGC 3513 is a nearly face-on () SBc spiral at (Kaldare et al., 2003). NGC 3511 and NGC 3513 have star formation rates (SFRs) derived jointly from the far-ultraviolet (FUV) and mid-infrared (MIR) of SFR and SFR , respectively (Leroy et al., 2019, 2021). NGC 3511 and NGC 3513 have stellar masses of and , respectively, with a mass ratio of (Leroy et al., 2019, 2021). The physical properties of the galaxy pair are summarized in Table 1. Rossa & Dettmar (2003a) identified thresholds in two far-IR (FIR) SFR indicators, the FIR surface brightness and the FIR color at and m, above which eDIG is detected almost ubiquitously in H imaging surveys of edge-on galaxies. NGC 3511 and NGC 3513 are selected to fall above the thresholds where eDIG is expected to be detected.111We adopt and , the and m flux densities, as reported by Surace et al. (2004). NGC 3511 has and ; NGC 3513 has and , where the latter quantity inside the log has units of erg s-1 kpc-2.
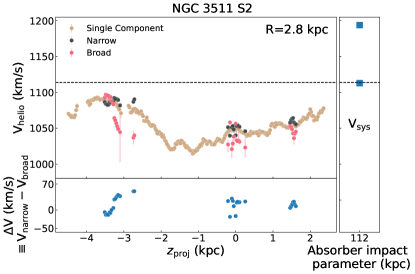
This galaxy pair is associated with a absorber () identified along the sightline toward QSO PMN J11032329 (Keeney et al., 2017). The QSO sightline occurs near the minor axis of NGC 3511, at a projected distance of kpc ( kpc from NGC 3513). The association of the detected absorber with one galaxy or the other is ambiguous. Keeney et al. (2017) showed that the absorber can be decomposed into two components at km s-1and 1194 km s-1, which coincide with the systemic velocities of NGC 3511 and NGC 3513 at km s-1 and km s-1, respectively. Additionally, their photoionization analysis indicates that the gas is highly enriched to twice solar, which is surprisingly high considering the large distances from the nearest galaxies. Our studies of the extraplanar gas layers in this galaxy pair may provide additional insight into the circulation of mass and metals between the galaxies and their gaseous environment.
This paper is organized as follows. In Section 2, we discuss the data acquisition and reduction procedures. In Section 3, we detail our spectral fitting strategies and our identification of the eDIG components in optical emission lines. In Section 4, we show the observational results, which strongly support that the eDIG components are extraplanar in origin. In Section 5, we build a dynamic equilibrium model of the eDIG layer in NGC 3511 and show that turbulent motions provide significant support to the eDIG layer. In Section 6, we discuss the impact of star formation activities on the dynamics and morphology of the eDIG and explore the possibility of associating the galaxy pair with the nearby absorber. Throughout the paper, we adopt a cosmology with , , and km s-1 Mpc-1.
2 Observations & DATA REDUCTION
To characterize the dynamic state of diffuse gas in galaxies NGC 3511/3513, we have obtained spatially-resolved high-resolution optical spectra along the disks of these galaxies. In this section, we summarize the observations and data reduction.
| RAa | Deca | P.A.b | ||
| Target + Slit Name | (J2000) | (J2000) | (deg) | (sec) |
| NGC 3511 S1 | 11:03:27.13 | 23:05:02.18 | 72 | 31800 |
| NGC 3511/3513 S2 | 11:03:46.65 | 23:14:35.17 | 72 | 31800 |
| NGC 3513 S1 | 11:03:46.65 | 23:14:35.17 | 335 | 31800 |
| a The RA and Dec at the center of the slit. | ||||
| b The position angle measured from North to East. | ||||
2.1 Observations
Optical spectroscopy of NGC 3511 and NGC 3513 was carried out on 2019 May 01 - 02 and on 2020 March 16 using a long slit and the f/4 camera in the Inamori-Magellan Areal Camera & Spectrograph (IMACS) multi-object imaging spectrograph (Dressler et al., 2011) on the Magellan Baade Telescope. IMACS f/4 covers a field of view of in diameter with a spatial plate scale of /pixel. The typical seeing was in 2019 and in 2020. In May 2019, the observations were performed using the grating with a blaze angle of . The tilt angle was chosen to match the blaze angle, which yielded a dispersion of 0.194 Å/pixel and a resolution of (or equivalently 42 km s-1) at around 6600 Å. In March 2020, the grating with a blaze angle of was used at a tilt angle of , which yielded a dispersion of 0.194 Å/pixel and (or equivalently 52 km s-1) at around 5000 Å.
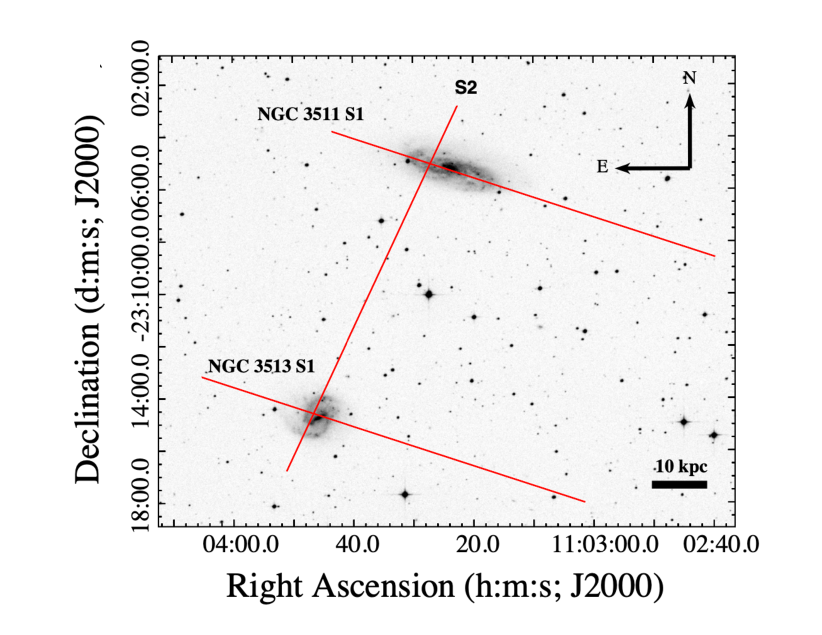
With the grating setup in the May 2019 observing run, the spectroscopic data cover emission features due to [N ii] 6548, 6583, H, and [S ii] 6716, 6731 emission lines from the galaxies. The data obtained in March 2020 provide additional spectral coverage for H and [O iii] 4959, 5007 emission lines. Hereafter, we refer to the May 2019 data as the “red data” and the March 2020 data as the “blue data”. In May 2019, the observations were carried out in three slit positions, two of which were aligned along the major axis of each of the two galaxies to maximize the information collected at different galactocentric radii (S1). A third slit position was employed to cover both galaxies at once. This third slit position is also approximately perpendicular to the first two slit positions. In March 2020, we placed the slit along the major axis of NGC 3511. Note that although we intended to place the slit masks at the same locations in 2019 and 2020, there is a spatial offset of about one slit width (). The locations of S1 and S2 relative to the two galaxies are illustrated in Figure 1. A brief journal of the observations is given in Table 2.
2.2 Data Reduction
We used custom software developed exclusively for this project to reduce the IMACS data. The two-dimensional spectra were bias subtracted using the overscan region and corrected for flat-field variations using a spectral flat obtained before each set of science exposures. Sky subtraction was performed for each exposure using a model sky spectrum constructed from sky regions selected to exclude contamination from the galaxy. Individual sky-subtracted frames were then median combined to form a final stack. Throughput correction and flux calibration were then performed using a standard star observed on the same night (LTT3864 in May 2019 and EG274 in March 2020). In addition, wavelength solutions were obtained using the HeArNe comparison lamp spectrum taken before each set of science exposures. These arc lines also provided an empirical measure of the spectral resolution of the adopted slit-grating combination.
We extracted one-dimensional (1D) spectra using an aperture of 3 spatial pixels along the cross-dispersion direction. This aperture size is both sufficiently small to ensure that we do not introduce artificial eDIG signals due to velocity shear across the aperture and moderately large to boost the signal-to-noise ratio (S/N) of the 1D spectra. For each spectrum, we estimate the flux uncertainty assuming that S/N scales according to Poisson statistics (uncertainty=, where is the flux count in units of electrons). Finally, we perform continuum subtraction by masking the emission lines and adopting a local, linear model for the continuum adjacent to the emission lines. For NGC 3511, we fit a total number of 1124 spectra (844 for S1 and 280 for S2) and 609 for NGC 3513 (262 for S1 and 347 for S2).
3 Methodology for line profile analysis
The optical spectra of NGC 3511 and NGC 3513 exhibit prominent nebular lines typical of H ii regions. By measuring the line centroid and line width, we are able to delineate contributions from local star-forming regions and from the eDIG layer. In this section, we describe the steps we take to map the gas motion at different locations along the disks of these galaxies and to estimate the associated uncertainties.
3.1 Emission-line measurements
From previous studies, we expect that the velocity dispersion in the diffuse gas may be higher than in the H ii regions (e.g., Heald et al., 2006b, a, 2007; Boettcher et al., 2016, 2017, 2019). This motivates us to model the emission lines using a two-component Gaussian model with a narrow component representing the planar emission and a broad component for the extraplanar gas.
In addition, the components sharing common origins are expected to exhibit similar velocity profiles. Therefore, the broad and narrow components of different nebular lines are assumed to share the same velocity centroid and dispersion in the model profiles. The results of the emission line measurements include velocity centroid, line width, total line flux, continuum level, and line ratios.
3.2 Uncertainty estimates
To obtain robust uncertainties of best-fit parameters, we employ a Markov Chain Monte Carlo (MCMC) method. We use an open-source Python implementation of Affine Invariant (Goodman & Weare, 2010) MCMC Ensemble sampler emcee (Foreman-Mackey et al., 2013) to sample the posterior distribution. emcee uses the integrated autocorrelation time (IAT) to assess convergence. IAT is an estimate of the number of iterations for an independent sample to be drawn in a Markov chain. That is, the number of independent samples is of order the number of samples divided by the IAT, which we denote as (). In our line fitting, we declare convergence when is smaller than , as suggested by the emcee documentation. We run our ensemble sampler with 100 walkers and 60,000 steps for every spectrum we fit. Most of the chains are converged by the IAT criterion. For the several cases that do not, it is usually because there are some unphysical local minima in the posterior. Also note that we assume a Gaussian PDF to derive the likelihood function.
Using emcee, for the red data, we fit the [N ii] 6583, H, and [S ii] 6716, 6731 emission lines at once. We do not include the [N ii] 6548 lines due to generally low S/N and contamination by a sky line. As the ratio of [N ii] 6548 to [N ii] 6583 is constant, we do not lose any information by neglecting the [N ii] 6548 line and in fact, the fitting quality improves when [N ii] 6548 is dropped. We probe a 12-dimensional parameter space defined by the broad- and narrow-component velocities, velocity dispersions, and line intensities of the four emission lines. Additionally, we experiment with fitting the four emission lines with a single-component model, i.e., an eight-dimensional parameter space defined by four emission line intensities, one velocity, and one velocity dispersion. The single-component model corresponds to the physical scenario under which the lines share a common origin and exhibit symmetric profiles (e.g., from H ii regions or planar DIG). Similarly, for the blue data, we consider both two-component and single-component models for the observed H and [O iii] 5007 lines. [O iii] 4959 is not included in the fitting due to the low S/N.
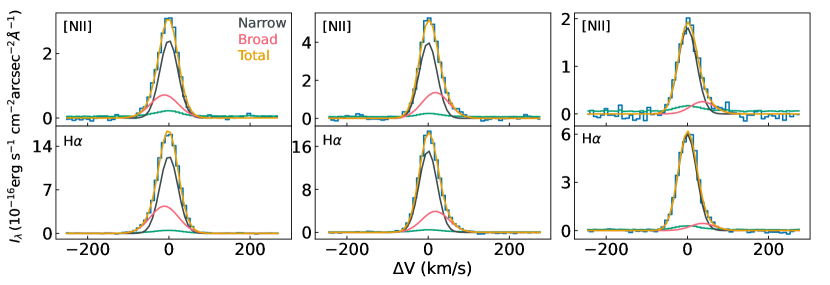
To determine whether the spectra are better described by a two-component or single-component model, we use the Bayesian Information Criterion (BIC) (Schwarz, 1978). BIC measures the trade-off between model fit and complexity of the model. Models with lower BIC values are generally preferred. Note that here we compute BIC using only information from H due to its high S/N. For each H spectrum, we first compute BIC values for both the two-component fit () and the single-component fit (). Then, we calculate . After visually examining the spectra and the fitting results, we conclude that the two-component model is favored when is . We show in Figure 2 three example spectra along with their best-fit two-component models.
4 Results
The line-profile analysis described in § 3 allows us to robustly decompose the observed emission signals into contributions from planar and extraplanar gas across the star-forming disks of NGC 3511 and 3513. In particular, the kinematics of the diffuse gas provide important information about how gas circulates at the disk-halo interface. The emission-line ratios in eDIG layers are known to be distinct from those of H ii regions (e.g., Haffner et al., 2009). We discuss our findings for the two galaxies separately in the following subsections.
4.1 NGC 3511
Recall that NGC 3511 is a disk galaxy of with an inclination angle of and . The IMACS observations have uncovered robust signals for multiple nebular lines across the disk of kpc in diameter. A distinct broad component is seen in approximately 15% of the disk. The kinematic and ionization properties of this broad component exemplify a typical eDIG layer, which are summarized in the following subsections. In addition, we also examine connection of the eDIG layer to the local star formation properties along the disk.
4.1.1 Gas Kinematics
We first examine the line-of-sight velocity dispersion () and velocity centroid of the narrow, broad, and single-component models. The kinematic differences reveal distinctive physical properties between the narrow, broad, and single-component emission and constrain the origin of eDIG layers. Note that throughout the paper, we report values after correcting for the instrumental line width ().
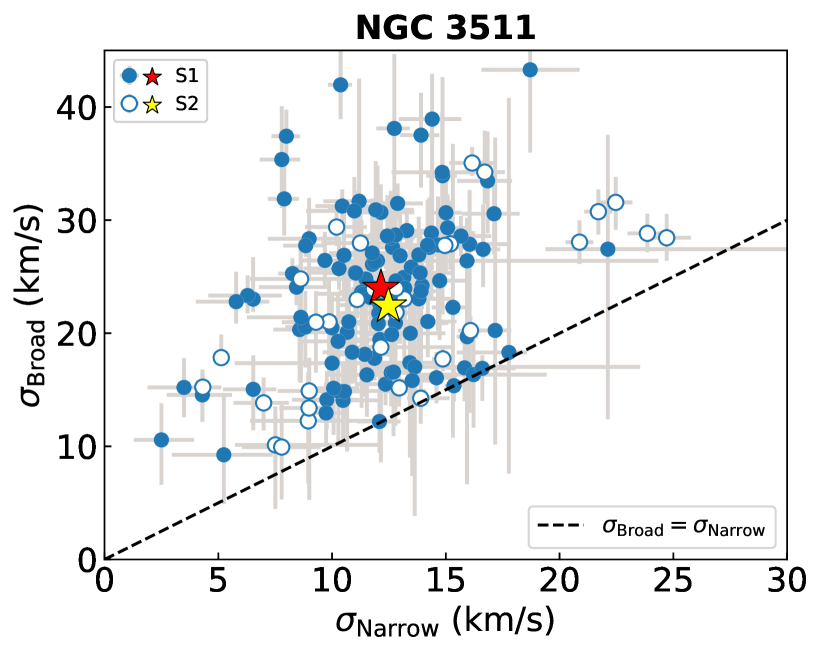
In Figure 3, we compare the broad-component velocity dispersion with what is seen in the narrow component. Overall, we observe a much higher velocity dispersion for the broad emission than for the narrow or single-component emission. The median velocity dispersion for the broad emission is km s-1, whereas for the narrow emission we find km s-1. Differences between S1 and S2 measurements are small. Furthermore, the broad emission shows a much larger scatter in the observed velocity dispersion, ranging from 9 km s-1to 45 km s-1. (Note here that the thermal line width for K gas is 10 km s-1, so any measured value below this threshold is likely due to uncertainty in the observational data.) The larger velocity dispersion in the broad component implies an origin in a thick gaseous disk, while the narrow- and single component emission is likely from the thin galactic disk. In Section 5, we consider the scale height produced by the broad velocity dispersion and the implications for the extraplanar origin of the gas.
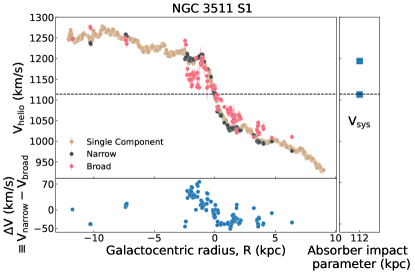
Next, we examine the line-of-sight velocity as a function of position along S1 and S2, which are displayed in the top and bottom panels of Figure 4, respectively. The center of the galaxy is defined as the position where the rotation curve exhibits the steepest slope. We show S1 velocities as a function of galactocentric radius (), and note that S2 crosses S1 at kpc. Since the galaxy is moderately inclined (), we define the projected distance away from the disk plane in S2 “” to make a distinction from the intrinsic height () above the disk plane. In the top panel, we observe a clear difference in radial velocity between the narrow and broad components. This difference, , is shown as a function of below the rotation curve. The broad component is moving at a lower speed than the narrow or single component. The observed velocity lag ranges from km s-1to 70 km s-1in projection, with a median value of km s-1. A rotational velocity lag is characteristic of eDIG, with typical values of km s-1 kpc-1 measured in edge-on galaxies (e.g., Heald et al., 2006b, a, 2007; Bizyaev et al., 2017).
Due to the dependence of , we expect that the eDIG signal in NGC 3511 is dominated by gas that is close to the disk ( kpc), and thus a lag as large as km s-1 somewhat exceeds expectations (note that the inclination correction for rotational velocity is negligible for NGC 3511.). It is possible that blueshifted outflows contribute to the radial velocities, as hinted at by the somewhat larger values of on the receding side of the galaxy than on the approaching side (see the top panel of Figure 4). We also observe evidence of outflows in S2, as shown in the bottom panel of Figure 4, where the velocity of the broad component is distinct and blue-shifted from the narrow component.
4.1.2 Emission-Line Ratios
Emission-line ratios provide a diagnostic power for assessing the physical conditions of the gas. We leverage different line ratios to determine the likelihood that the broad component indeed originates in an extraplanar gas layer.
Physically, [N ii]6583/H and [S ii]6716/H probe the abundances, temperature and ionization state of the gas. The explicit dependence is shown in Haffner et al. (1999) and Osterbrock & Ferland (2006):
| (1) |
and
| (2) |
We estimate the metallicity of NGC 3511 to be solar by adopting a mass-metallicity relation appropriate for nearby galaxies (Tremonti et al., 2004). For the solar abundance pattern, we expect N/H and S/H (Asplund et al., 2009), but we adopt a sulphur to nitrogen ratio that is twice the solar value following what is found in low-mass galaxies (e.g., Rubin et al., 1984). For the warm ionized gas, we assume that H and N are 100% and 80% ionized, respectively, based on measurements and models of the Milky Way ISM (Reynolds et al., 1998; Sembach et al., 2000). The ionization energy of N is 14.5 eV, while the ionization energy of S is 10.4 eV. This means that when N is mostly ionized, S is also mostly ionized. However, at 23.3 eV and at 29.6 eV. Therefore, can vary while remains constant if the ionizing energy does not reach 29.6 eV. Consequently, we expect more variation in under eDIG conditions.
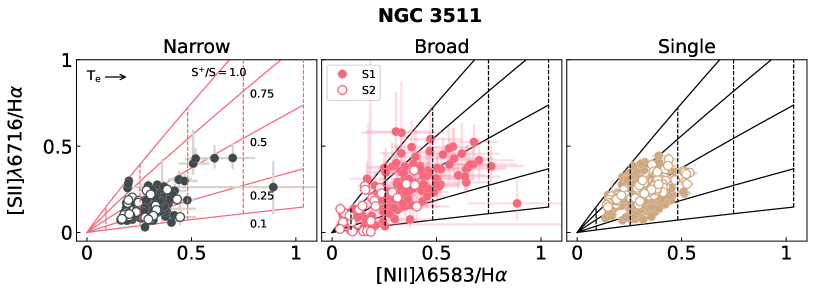
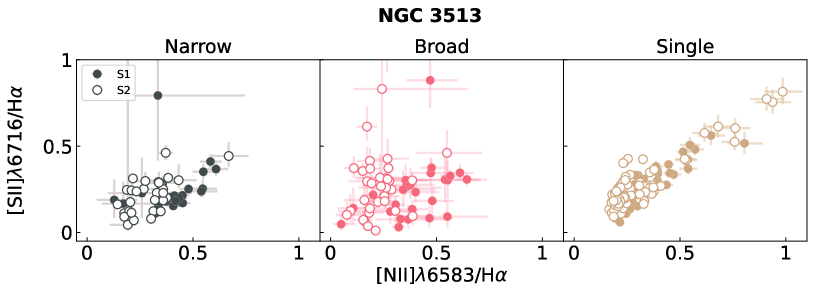
In Figure 5, we plot [S ii]6716/H versus [N ii]6583/H for the narrow, broad, and single-component emission detected in both S1 and S2. We also include model expectations for constant electron temperature (, dashed) and constant (solid) in each panel.
Our observed single and broad-component line ratios are consistent with arising from H ii regions and the DIG, respectively. The single-component emission has intermediate line ratios, suggesting an origin with a mixture of physical conditions. Indeed, we see in Figure 5 that the broad component tends toward a lower ionization state (higher ) compared to the narrow component; this is observed in diffuse gas in the Milky Way and nearby galaxies and is due to the lower ionization parameter in the DIG and the reprocessing of the ionizing spectrum as it travels through the ISM (see Haffner et al. 2009 and references therein). Additionally, we see in Figure 5 that the elevated line ratios in the broad component correspond to warmer temperatures ( K) than the narrow component. This change in physical conditions in the DIG compared to H ii regions suggests spectral reprocessing of the ionizing radiation field and, potentially, supplemental sources of heating. Supplemental heating mechanisms that may raise the electron temperature of the diffuse gas include cosmic ray heating (Wiener et al., 2013) and dissipation of turbulence (Minter & Spangler, 1997). The elevated line ratios may also arise due to photoionization by a hard spectrum produced by hot, low-mass evolved stars (Flores-Fajardo et al., 2011), shocks, or turbulent mixing layers (e.g., Rand, 1998).
To probe the ionization mechanism producing the DIG layer, we now include the blue data and consider [O iii]5007/H versus [N ii]6583/H in Figure 6. Note that although there is an offset of one slit width between the blue and red data, the spatial fluctuations observed along S2, perpendicular to S1, indicate that strong line ratios vary on scales much larger than . Therefore, we assume the same gas kinematics for [O iii]5007 and H as for [N ii]6583 and H; we only fit the amplitudes of [O iii]5007 and H. Figure 6 is commonly referred to as the BPT diagram and is used to distinguish between gas photoionized by AGN and by young stars in H ii regions (Baldwin et al., 1981). Gas with line ratios below the Kewley et al. (2013) line is expected to originate in star-forming regions. Schawinski et al. (2007) provide a division line between Seyferts (upper) and low-ionization nuclear emission-line regions (LINERs; lower). We show that most of the narrow and single-component emission falls in the star-forming region; this is consistent with the conclusion that this emission arises in and around H ii regions. On the other hand, some of the broad components have higher line ratios in both [O iii]5007/H and [N ii]6583/H than gas in the H ii regions. We color-code the broad components based on their distance from the galactic center in the bottom panel of Figure 6. It is clearly shown that the broad components sitting to the right of the Kewley et al. (2013) line tend to reside near the galaxy center. The proximity of the LINER-like emission to the nucleus suggests that this emission may arise from gas heated by shocks from a nuclear outflow. While it is possible that a low-luminosity AGN contributes to photoionizing the nuclear region of this Seyfert galaxy, the LINER-like emission falls at kpc, leading us to favor a shock origin for the elevated line ratios.

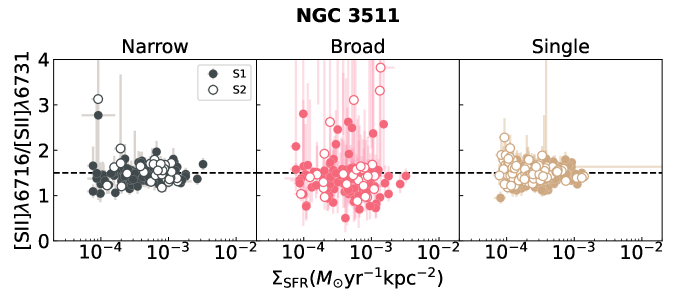
We also infer the underlying electron gas density based on the observed [S ii]6716/[S ii]6731 doublet ratios. In Figure 7, we compare [S ii]6716/[S ii]6731 of the narrow, broad, and single-component emission. This ratio decreases as the electron gas density increases; at the low-density limit, [S ii]6716/[S ii]6731 = 1.5, corresponding to an electron density of (Osterbrock & Ferland, 2006). The low-density limit is plotted with a dashed line for comparison. It is clear that the narrow and single components have line ratios close to the low-density limit (corresponding to 10 or lower). The broad components, on the other hand, display a larger scatter and generally have lower [S ii]6716/[S ii]6731 values, with a median value of 1.2, implying . Similar [S ii]6716/[S ii]6731 line ratios of the eDIG components are found in regions of M83 (Boettcher et al., 2017). The low doublet ratios and their implied high gas density are consistent with some of the broad components originating in shocks.

4.1.3 Correlation with Star Formation Activities
We have shown that both the kinematic properties (velocity lag and dispersion) and strong line ratios observed in the broad component support the presence of an eDIG layer in NGC 3511. To gain a better understanding of the physical processes that result in the eDIG layer, here we examine how the conditions in the eDIG layer are connected to local star formation. To quantify local star formation activities, we employ two empirical measures: the SFR surface density () in units of SFR per unit area and the equivalent width of H (EW). The former provides an estimate of instantaneous local star formation intensity, while the latter provides an estimate of the burstiness of the star formation history.
We compute from the observed H flux, (H) following (Kennicutt, 1998). This quantity is directly proportional to the number of ionizing photons produced by stars per unit area. Since the lifetime of a typical O or B star is a few years, is a measure of the current rate of star formation over this timescale. A higher value of suggests that the region has a higher density of, or is in closer proximity to, ionizing sources. Figure 7 shows that the electron density of either the planar or extraplanar gas does not depend sensitively on its distance to the ionizing sources.
In Figure 8, we plot [S ii]6716/H versus in the top panel and EW in the bottom. We observe a clear decreasing trend with increasing for the narrow and single components. This trend is characteristic of emission from H ii regions and planar DIG (e.g., Haffner et al., 1999), due to the lower ionization parameter in regions with lower SFRs and the reprocessing of the ionizing spectrum with distance from ionizing sources. For the broad, eDIG component, the scatter is large within the observed range in , and no correlation between the line ratio and can be detected. However, when we examine the measurements from Boettcher et al. (2017) for M83 (shown in blue), which span a wider range of , we see a clearer decreasing trend with increasing for all components. At fixed , we observe higher values of the emission-line ratios in M83 than in NGC 3511. This result suggests that is correlated with, but not fully predictive of, the physical conditions in the gas.
In the bottom panel of Figure 8, we show the line ratios as a function of the H EW. The EW is an observational proxy for the SFR per unit mass with lower and higher EWs associated with on average older and younger stellar populations, respectively. In the bottom panel of Figure 8, we observe an even clearer decreasing trend in line ratios with increasing EW, as compared to . This trend is coherent across the dynamic range in EW observed in M83 and NGC 3511, suggesting that the EW is more predictive of the physical conditions in the gas than alone. In NGC 3511, the highest EWs (youngest stellar populations) are seen in S2 (open symbols in Figure 8). The broad-component emission-line ratios in this region most closely resemble those in H ii regions. In contrast, NGC 3511 S1 (closed symbols in Figure 8) and M83 generally have intermediate and low EWs, respectively, with increasingly elevated broad emission-line ratios observed with decreasing EW. Regions with the lowest EWs have broad emission-line ratios that are most characteristic of typical eDIG layers. This implies that the build-up of the eDIG layer, and the physical conditions in the gas, are driven locally by the burstiness of the galaxy’s star formation history.
4.2 NGC 3513
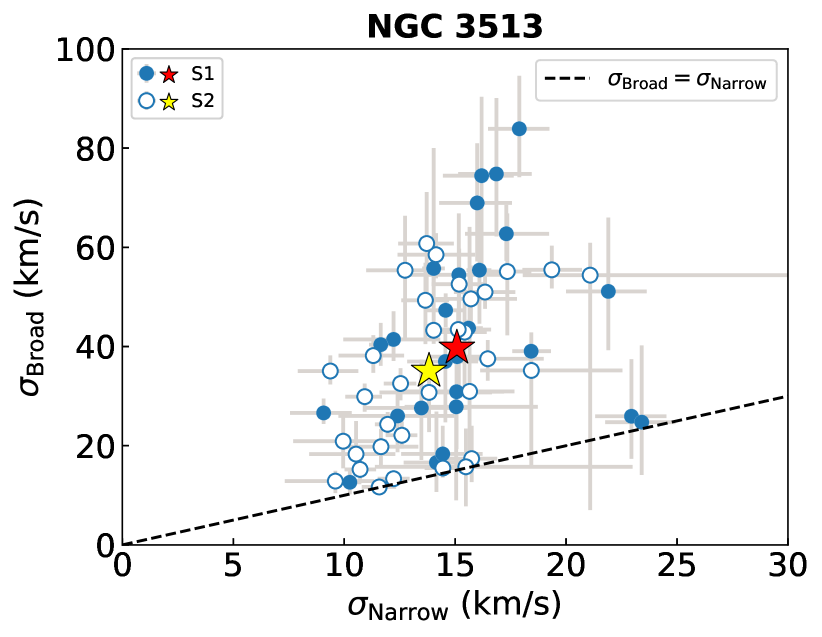
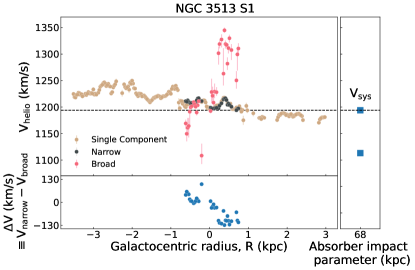
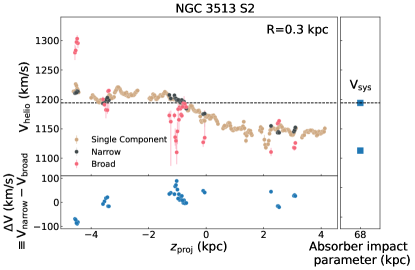
We now turn to NGC 3513. Recall that NGC 3513 is a companion galaxy of with an inclination angle of and . The IMACS observations have uncovered robust signals for multiple nebular lines across the disk of kpc in diameter. In Figure 9, we compare the broad-component velocity dispersion with what is seen in the narrow component. Similar to NGC 3511, we observe a much higher velocity dispersion for the broad emission than for the narrow or single-component emission. The median velocity dispersion for the broad emission is km s-1, whereas for the narrow emission we find km s-1. Differences between S1 and S2 measurements are small. The line-of-sight velocity as a function of position along S1 and S2 displayed in Figure 10 shows that a distinct broad component is seen in approximately 20% of the disk. We note that for NGC 3513 S2 crosses S1 at kpc.
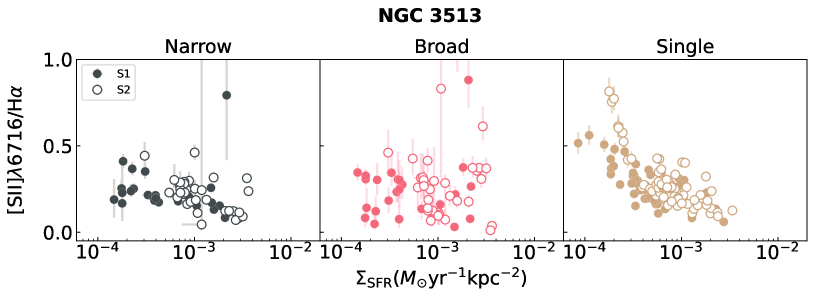
For this galaxy, the most prominent feature is the large velocity difference () between the broad components and the narrow and single components, as shown in Figure 10. The escape velocities for NGC 3513 at kpc are 300 km s-1, based on the galactic gravitational potential model that we describe in Appendix B. The largest value we observe in the broad component is 130 km s-1( 207 km s-1after correcting for inclination), which is smaller than the escape velocities. However, it is clear that the rotation curve displays a signature of gas outflow close to the center of the galaxy, a sign of disk-halo circulation. In addition, we observe only modest evidence for elevated line ratios in a minority of the broad components in NGC 3513. We include the line ratio plots for reference in Appendix A.
5 A Dynamic Equilibrium Model of NGC 3511
The unexpectedly large scale height of eDIG layers has puzzled researchers since its discovery. The characteristic scale height of the eDIG layer in the Milky Way and nearby edge-on disk galaxies is 1 kpc, which is a factor of a few larger than the thermal scale height (e.g., Rand, 1997; Haffner et al., 1999; Collins & Rand, 2001). The scale height problem is central to our understanding of eDIG vertical structure and dynamics. In this section, we study the extent to which thermal and turbulent pressure gradients can support the eDIG layer in NGC 3511 by examining the expected scale heights supported by different pressure forces. Although it has been demonstrated that additional support from the magnetic field and cosmic ray pressure gradients may be needed in some galaxies (e.g., Boettcher et al., 2016), we do not have observational constraints to measure these non-thermal contributions in NGC 3511. Instead, we ask whether the observed thermal and turbulent motions imply the need for additional non-thermal pressure support to produce the expected eDIG scale height.

We construct a dynamic equilibrium model of the eDIG layer in NGC 3511 in order to infer how the eDIG scale height depends on the eDIG velocity dispersion. Under the hydrostatic equilibrium assumption, we expect the vertical pressure gradient to be balanced by gravity following
| (3) |
where is the gravitational acceleration perpendicular to the plane, along the -direction. By adopting an equation of state of the form
| (4) |
where is the velocity dispersion as a function of height and is the density profile of the eDIG layer, we find a general solution to Equation 3:
| (5) |
To examine the connection between the velocity dispersion and the spatial profile of the eDIG layer, we first consider an exponential form for the eDIG vertical density distribution, , where is the scale height. This exponential distribution is motivated by the vertical H intensity profiles observed in the eDIG layers of some nearby, edge-on galaxies (e.g., Rand et al., 1990). It follows that the left-hand side of Equation 5 reduces to . By taking the derivative with respect to and rearranging terms on both sides, Equation 5 is further simplified to
| (6) |
with a solution of
| (7) |
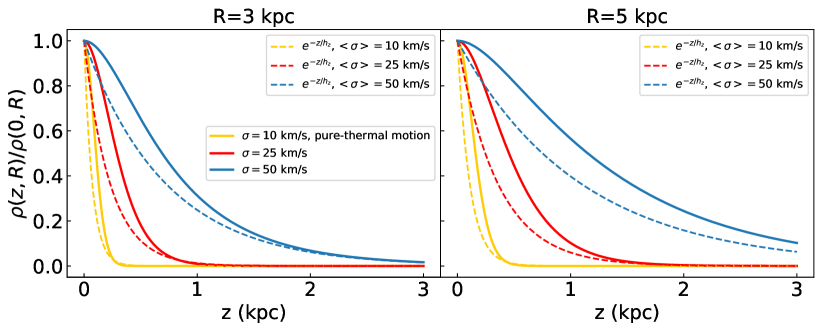
Equation 7 illustrates how is correlated with of an exponential density profile for a given . To calculate the predicted for NGC 3511, we compute its galactic gravitational potential based on a mass model constructed from combining known stellar and dark matter components. See Appendix B for details.
In Figure 11, we show the model-predicted eDIG velocity dispersion, , for a characteristic set of kpc, at kpc (left panel) and kpc (right panel). The shaded region indicates the range of observed values in NGC 3511. We see from Figure 11 that from the disk plane ( kpc) to kpc, the variation of with is small. In addition, when is comparable to thermal motions alone ( km s-1), the eDIG layer is vertically compact, with kpc. In contrast, the observed range in implies a scale height as large as kpc at kpc and kpc at kpc. The observed translates to kpc over this range in . The large scale height inferred for the eDIG together with the observed large velocity dispersion, exceeding thermal motions, highlights the important role that turbulence plays in supporting the eDIG layer. However, a caveat is the presumed exponential density profile, which does not necessarily provide an accurate description of the eDIG profile close to the disk.
Next, we consider a second scenario in which the eDIG velocity dispersion is constant with -height. This scenario has the benefit of enabling direct comparisons of expected and observed . In turn, it allows a density profile that departs from an exponential form. Returning to Equation 5, a constant leads to a density profile of
| (8) |
which characterizes the expected density profile of eDIG for a given and .
In Figure 12, we compare the exponential density profiles with those from Equation 8 at kpc (left panel) and kpc (right panel). The choices of constant represent the lower bound, median, and upper bound of our observed for NGC 3511. For the exponential models, we show the density profiles produced with the -weighted mean equal to the same set of constant values. This -weighting accounts for the density dependence of the emission measure from the observed H intensity. We find that the inferred density distribution declines more gradually with -height for the constant models. For instance, the inferred eDIG density for the observed km s-1 is % higher at kpc from the constant model than that from the exponential profile. Figure 12 shows that for a given observed velocity dispersion, the eDIG layer is expected to be more spatially extended if varies less with -height.
We emphasize here that, due to the inclination angle of NGC 3511, the observed value and the vertical in our theoretical models may not be the same quantity. In the limiting case that the velocity dispersion is isotropic, the observed value is the true vertical velocity dispersion. In the contrasting limiting case, where the velocity dispersion is fully in the -direction, then the observed is smaller than the true vertical by a factor of , where is the inclination angle of the galaxy (). The characteristic may thus fall between the median observed km s-1and the inclination-corrected value of 80 km s-1. In the case of a highly anisotropic dispersion, the vertical extent of the eDIG layer may therefore significantly exceed that predicted by the observed .
6 Discussion and Conclusions
We have demonstrated a technique to kinematically separate extraplanar warm ionized gas from planar signals in high-resolution optical spectra of the sub- disk galaxy pair NGC 3511/3513. We found a widespread eDIG layer in NGC 3511 and confirmed its extraplanar nature through its 1) lagging rotational velocity ( km s-1), 2) higher velocity dispersion ( km s-1, as compared to km s-1), and 3) elevated [N ii]6583/H and [S ii]6716/H emission-line ratios with respect to the H ii regions. In NGC 3513, we observe evidence of local, ionized outflows close to the nucleus ( km s-1). These are among the first galaxies with in which the eDIG kinematics have been spatially resolved, permitting direct constraints on dynamical models of the gaseous, disk-halo interface.
The observed eDIG layers in NGC 3511 and NGC 3513 exhibit different spatial distributions. In NGC 3511, the eDIG is more widespread than in NGC 3513, with detected signals on the scale of several kiloparsecs from the galaxy center ( kpc). This is suggestive of the extensive, ”classical” eDIG layers observed in galaxies like the Milky Way and the edge-on galaxy, NGC 891 (e.g., Rand, 1996; Haffner et al., 2003). In contrast, NGC 3513 displays localized outflows that are largely confined to kpc. The difference in the spatial distribution is consistent with the known diversity in extraplanar H emission in nearby, edge-on galaxies, in which local patches or filaments of H emission are more commonly observed than the pervasive eDIG layer observed in the Galaxy (e.g., Rossa & Dettmar, 2003b). Thus, the extraplanar gas properties in NGC 3511 may more closely resemble those of the Milky Way, while those of NGC 3513 may be more representative of nearby, low-mass galaxies.
As this is among the first efforts to measure a projection of the vertical velocity dispersion of the eDIG (see also Haffner et al., 2003; Fraternali et al., 2004; Boettcher et al., 2017; Li et al., 2021), a main goal of this paper is to study how the eDIG layer is vertically supported. The characteristic line widths observed in the eDIG of both NGC 3511 and NGC 3513 are a factor of a few larger than the thermal line widths, demonstrating that turbulent motions are dynamically important. Combining observational measurements with a dynamic model, we have found that in NGC 3511, the median observed velocity dispersion suffices to produce significant scale heights ( kpc at kpc; see Section 5). This is somewhat smaller than the characteristic kpc observed in extensive eDIG layers in galaxies like NGC 891 (e.g., Rand et al., 1990). However, due to the high inclination of NGC 3511, the observed may be significantly smaller than the true vertical if the velocity dispersion is anisotropic; thus, the scale height may be under-predicted. There is also evidence that magnetic field and cosmic ray pressure gradients may contribute significantly to elevating the scale height of eDIG (Boettcher et al., 2016, 2019). Our techniques can be applied to other galaxies and we expect more observational measurements to enable a more robust comparison to predictions from high-resolution numerical simulations (e.g., Chan et al., 2022).
Whether or not the velocity dispersion of the eDIG depends on the star-formation properties of the host galaxy is an important open question. With the present sample, we cannot robustly assess the connection between the velocity dispersion and the global specific SFR (sSFR; i.e., whether or not higher turbulent energy injection per unit mass in higher sSFR galaxies tends to produce larger eDIG velocity dispersions). We consider here five galaxies with for which measurements of the eDIG velocity dispersion are available - the NGC 3511/3513 pair, M83 (Boettcher et al., 2017), and NGC 3982 and NGC 4152 (Li et al., 2021). Among these galaxies, M83 has the highest SFR (SFR yr-1) and stellar mass (; Leroy et al. 2021), but its sSFR of log(sSFR/yr-1) is comparable to that of NGC 3513 and % higher than that of NGC 3511. The median eDIG velocity dispersion in M83, km s-1, is a factor of higher than that in NGC 3513 ( km s-1) and a factor of higher than that in NGC 3511 ( km s-1). NGC 3982 and NGC 4152 have similar sSFRs to NGC 3513 (log(sSFR/yr-1) and , respectively; Leroy et al. 2019), and their eDIG velocity dispersions are km s-1(Li et al., 2021). However, the determination of any trends in the velocity dispersion with the sSFR is limited by two important caveats. First, due to the relatively high inclination of NGC 3511, the vertical velocity dispersion in this galaxy may be significantly higher than observed. Secondly, the dynamic range in sSFR is small (by a factor of four) among these five galaxies. Our study thus motivates measurements of the eDIG velocity dispersion in a statistically significant sample covering an increased dynamic range in the sSFR.
In contrast to the global star-formation properties, we have strong statistics to probe correlations of the spatially resolved eDIG properties with the local star-formation activity within each galaxy. The strong anti-correlation between the eDIG emission-line ratios and the local H EW shown in Figure 8 suggests that the conditions in the extraplanar gas are determined by the local star-formation history, with significant variation observed within individual galaxies.
Indeed, Figure 8 demonstrates that the physical conditions that most resemble those in the classical eDIG (in particular, elevated ), are associated with regions with the lowest EWs (i.e., the oldest stellar populations). This suggests that the conditions in the eDIG are more reflective of the burstiness of the star-formation history than of the instantaneous star-formation rate.
Notably, we do not observe a statistically significant correlation between the eDIG velocity dispersion and the local or H EW. This is qualitatively consistent with the expectations of galactic fountain models. If the eDIG is produced by a galactic fountain flow, then we expect the gas temperature and ionization state to couple more closely to the local, underlying stellar population than the gas kinematics. This is because under the fountain models, extraplanar gas clouds can travel distances ranging from hundreds of parsecs to a thousand parsecs away from their originating star-forming regions (e.g., Collins et al., 2002), resulting in the decoupling of the eDIG kinematics and the local, underlying disk properties. At the same time, the eDIG temperature and ionization state would more closely reflect the local stellar population and the associated photoionizing spectrum, as the recombination time is significantly shorter than the cloud orbital time. Going forward, we hope to gain more insight into how eDIG properties and dynamics are related to star-formation activities by obtaining observational data for more galaxies that are less inclined than NGC 3511 that (1) meet the SFR per unit area threshold of Rossa & Dettmar (2003a) and (2) increase the dynamic range in SFR and sSFR both locally and globally.
The warm ionized gas kinematics at the disk-halo interface have implications for the co-evolution of galaxies and their circumgalactic medium. In the NGC 3511/3513 system, we find that gas circulation at the disk-halo interface is present in both galaxies. While the presence of the sightline along the minor axis of NGC 3511 has led to the association of the absorber towards QSO PMN J11032329 with this galaxy (Stocke et al., 2013), the closer proximity of NGC 3513 to the sightline, at a projected distance of kpc north of the QSO, as well as the evidence for active outflow from star-forming regions in the galaxy, make NGC 3513 a more likely host for the absorber. We note that for the gas to travel a distance of 68 kpc the launch velocity at kpc needs to be 250 km s-1(160 km s-1measured at the observed inclination), and our measured gas velocity is below this threshold ( km s-1). However, while we do not observe direct evidence for warm outflows that will reach the spatial scale of the absorber, the absorber may be associated with past epochs of more vigorous star-formation activity. Alternatively, the gas may be the cooled product of a hot outflow launched at higher velocities. To conclude, this system illustrates the need to proceed with caution when associating absorbers to host galaxies in pairs or group environments. NGC 3511 and NGC 3513 are members of the MHONGOOSE deep H 1 survey being conducted with MeerKAT (Sardone et al., 2021), which will map the neutral gas morphology and kinematics in these galaxies to unprecedented sensitivity. Paired with our nebular spectroscopy, this will provide a multi-phase window on the role of stellar feedback in mediating the disk-halo connection via turbulent gas motions.
Acknowledgements
We thank Jay Gallagher and Ellen Zweibel for helpful discussions that motivated this study, and Christy Tremonti for useful discussions about the role of metallicity. HZ acknowledges discussions with Nick Gnedin and Andrey Kravtsov. EB acknowledges partial support by NASA under award number 80GSFC21M0002.
Data Availability
The data underlying this article will be shared on reasonable request to the authors.
References
- Asplund et al. (2009) Asplund M., Grevesse N., Sauval A. J., Scott P., 2009, ARA&A, 47, 481
- Baldwin et al. (1981) Baldwin J. A., Phillips M. M., Terlevich R., 1981, PASP, 93, 5
- Behroozi et al. (2019) Behroozi P., Wechsler R. H., Hearin A. P., Conroy C., 2019, MNRAS, 488, 3143
- Binney (2005) Binney J., 2005, in Braun R., ed., Astronomical Society of the Pacific Conference Series Vol. 331, Extra-Planar Gas. p. 131 (arXiv:astro-ph/0409639)
- Bizyaev et al. (2017) Bizyaev D., et al., 2017, ApJ, 839, 87
- Bland-Hawthorn & Gerhard (2016) Bland-Hawthorn J., Gerhard O., 2016, ARA&A, 54, 529
- Boettcher et al. (2016) Boettcher E., Zweibel E. G., Gallagher J. S. I., Benjamin R. A., 2016, ApJ, 832, 118
- Boettcher et al. (2017) Boettcher E., Gallagher J. S. I., Zweibel E. G., 2017, ApJ, 845, 155
- Boettcher et al. (2019) Boettcher E., Gallagher J. S. I., Zweibel E. G., 2019, ApJ, 885, 160
- Chan et al. (2022) Chan T. K., Kereš D., Gurvich A. B., Hopkins P. F., Trapp C., Ji S., Faucher-Giguère C.-A., 2022, MNRAS, 517, 597
- Collins & Rand (2001) Collins J. A., Rand R. J., 2001, ApJ, 551, 57
- Collins et al. (2002) Collins J. A., Benjamin R. A., Rand R. J., 2002, ApJ, 578, 98
- Cuddeford (1993) Cuddeford P., 1993, MNRAS, 262, 1076
- Dettmar (1990) Dettmar R. J., 1990, A&A, 232, L15
- Diemer & Joyce (2019) Diemer B., Joyce M., 2019, ApJ, 871, 168
- Dressler et al. (2011) Dressler A., et al., 2011, PASP, 123, 288
- Flores-Fajardo et al. (2011) Flores-Fajardo N., Morisset C., Stasińska G., Binette L., 2011, MNRAS, 415, 2182
- Foreman-Mackey et al. (2013) Foreman-Mackey D., Hogg D. W., Lang D., Goodman J., 2013, PASP, 125, 306
- Fraternali et al. (2004) Fraternali F., Oosterloo T., Sancisi R., 2004, A&A, 424, 485
- Goodman & Weare (2010) Goodman J., Weare J., 2010, Communications in Applied Mathematics and Computational Science, 5, 65
- Haffner et al. (1999) Haffner L. M., Reynolds R. J., Tufte S. L., 1999, ApJ, 523, 223
- Haffner et al. (2003) Haffner L. M., Reynolds R. J., Tufte S. L., Madsen G. J., Jaehnig K. P., Percival J. W., 2003, ApJS, 149, 405
- Haffner et al. (2009) Haffner L. M., et al., 2009, Reviews of Modern Physics, 81, 969
- Heald et al. (2006a) Heald G. H., Rand R. J., Benjamin R. A., Collins J. A., Bland-Hawthorn J., 2006a, ApJ, 636, 181
- Heald et al. (2006b) Heald G. H., Rand R. J., Benjamin R. A., Bershady M. A., 2006b, ApJ, 647, 1018
- Heald et al. (2007) Heald G. H., Rand R. J., Benjamin R. A., Bershady M. A., 2007, ApJ, 663, 933
- Hoopes et al. (1999) Hoopes C. G., Walterbos R. A. M., Rand R. J., 1999, ApJ, 522, 669
- Hoyle & Ellis (1963) Hoyle F., Ellis G. R. A., 1963, Australian Journal of Physics, 16, 1
- Jones et al. (2017) Jones A., et al., 2017, A&A, 599, A141
- Kaldare et al. (2003) Kaldare R., Colless M., Raychaudhury S., Peterson B. A., 2003, MNRAS, 339, 652
- Keeney et al. (2017) Keeney B. A., et al., 2017, ApJS, 230, 6
- Kennicutt (1998) Kennicutt Robert C. J., 1998, ARA&A, 36, 189
- Kewley et al. (2013) Kewley L. J., Maier C., Yabe K., Ohta K., Akiyama M., Dopita M. A., Yuan T., 2013, ApJ, 774, L10
- Koribalski et al. (2004) Koribalski B. S., et al., 2004, AJ, 128, 16
- Lehnert & Heckman (1995) Lehnert M. D., Heckman T. M., 1995, ApJS, 97, 89
- Leroy et al. (2019) Leroy A. K., et al., 2019, ApJS, 244, 24
- Leroy et al. (2021) Leroy A. K., et al., 2021, ApJS, 257, 43
- Levy et al. (2019) Levy R. C., et al., 2019, ApJ, 882, 84
- Li et al. (2021) Li A., Marasco A., Fraternali F., Trager S., Verheijen M. A. W., 2021, MNRAS, 504, 3013
- Li et al. (2023) Li A., Fraternali F., Marasco A., Trager S. C., Pezzulli G., Mancera Piña P. E., Verheijen M. A. W., 2023, MNRAS, 520, 147
- Mac Low & McCray (1988) Mac Low M.-M., McCray R., 1988, ApJ, 324, 776
- Makarov et al. (2014) Makarov D., Prugniel P., Terekhova N., Courtois H., Vauglin I., 2014, A&A, 570, A13
- Marasco et al. (2012) Marasco A., Fraternali F., Binney J. J., 2012, MNRAS, 419, 1107
- Minter & Spangler (1997) Minter A. H., Spangler S. R., 1997, ApJ, 485, 182
- Navarro et al. (1997) Navarro J. F., Frenk C. S., White S. D. M., 1997, ApJ, 490, 493
- Norman & Ikeuchi (1989) Norman C. A., Ikeuchi S., 1989, ApJ, 345, 372
- Osterbrock & Ferland (2006) Osterbrock D. E., Ferland G. J., 2006, Astrophysics of gaseous nebulae and active galactic nuclei
- Putman (2017) Putman M. E., 2017, in Fox A., Davé R., eds, Astrophysics and Space Science Library Vol. 430, Gas Accretion onto Galaxies. p. 1 (arXiv:1612.00461), doi:10.1007/978-3-319-52512-9˙1
- Rand (1996) Rand R. J., 1996, ApJ, 462, 712
- Rand (1997) Rand R. J., 1997, ApJ, 474, 129
- Rand (1998) Rand R. J., 1998, ApJ, 501, 137
- Rand et al. (1990) Rand R. J., Kulkarni S. R., Hester J. J., 1990, ApJ, 352, L1
- Reynolds (1989) Reynolds R. J., 1989, ApJ, 339, L29
- Reynolds et al. (1973) Reynolds R. J., Scherb F., Roesler F. L., 1973, ApJ, 185, 869
- Reynolds et al. (1998) Reynolds R. J., Hausen N. R., Tufte S. L., Haffner L. M., 1998, ApJ, 494, L99
- Rossa & Dettmar (2003a) Rossa J., Dettmar R. J., 2003a, A&A, 406, 493
- Rossa & Dettmar (2003b) Rossa J., Dettmar R. J., 2003b, A&A, 406, 505
- Rubin et al. (1984) Rubin V. C., Ford W. K. J., Whitmore B. C., 1984, ApJ, 281, L21
- Sardone et al. (2021) Sardone A., Pisano D. J., Pingel N. M., Sorgho A., Carignan C., de Blok W. J. G., 2021, ApJ, 910, 69
- Schawinski et al. (2007) Schawinski K., Thomas D., Sarzi M., Maraston C., Kaviraj S., Joo S.-J., Yi S. K., Silk J., 2007, MNRAS, 382, 1415
- Schwarz (1978) Schwarz G., 1978, Annals of Statistics, 6, 461
- Sembach et al. (2000) Sembach K. R., Howk J. C., Ryans R. S. I., Keenan F. P., 2000, ApJ, 528, 310
- Shapiro & Field (1976) Shapiro P. R., Field G. B., 1976, ApJ, 205, 762
- Stocke et al. (2013) Stocke J. T., Keeney B. A., Danforth C. W., Shull J. M., Froning C. S., Green J. C., Penton S. V., Savage B. D., 2013, ApJ, 763, 148
- Surace et al. (2004) Surace J. A., Sanders D. B., Mazzarella J. M., 2004, AJ, 127, 3235
- Tremonti et al. (2004) Tremonti C. A., et al., 2004, ApJ, 613, 898
- Veilleux et al. (2005) Veilleux S., Cecil G., Bland-Hawthorn J., 2005, ARA&A, 43, 769
- Wiener et al. (2013) Wiener J., Zweibel E. G., Oh S. P., 2013, ApJ, 767, 87
Appendix A NGC 3513: Emission-line Ratios
Similar to Figure 5, we show [S ii]6716/H versus [N ii]6583/H for NGC 3513 in Figure 13. In addition, we display the dependence of the line ratios on in Figure 14. We do not observe the elevated line ratios typically associated with eDIG layers in the broad component of NGC 3513.
Appendix B Constructing Mass Models for NGC 3511 and NGC 3513
In this section, we construct mass models for NGC 3511 and NGC 3513 to determine their galactic gravitational potentials. We model both the stellar disk component and the dark matter halo component of each galaxy.
We assume that both the vertical (-direction) and radial (-direction) density profiles for the stellar disk are exponential:
| (9) |
Here is the distance away from the midplane in the vertical direction, is the distance from the center in the radial direction, and is the density of the stellar disk at the disk center (, ). is the disk scale height in the vertical direction, and is the disk scale height in the radial direction. For both galaxies, we assume kpc and kpc, which is consistent with values reported for the Milky Way (Bland-Hawthorn & Gerhard, 2016). We use the stellar mass measurements in Table 1 to obtain for NGC 3511 and for NGC 3513. The corresponding gravitational potential and vertical gravitational acceleration have been derived by Cuddeford (1993).
For the dark matter halo, we assume a Navarro–Frenk–White (NFW) density profile (Navarro et al., 1997). From the stellar mass-halo mass relation of Behroozi et al. (2019), we adopt a dark matter halo mass from the stellar mass. We additionally assume that the concentration parameter is tightly correlated with the dark matter halo mass following the Diemer & Joyce (2019) model. This yields the NFW profile and corresponding gravitational potential and vertical gravitational acceleration. We have confirmed that our parameter choices are reasonable based on comparison with the observed rotational velocity curves.