Deficit of Hot Dust in Low-redshift Active Galactic Nuclei
Abstract
We assemble a broad-band spectral energy distribution (SED) ranging from optical to mid-infrared of nearby active galactic nuclei at . SED fitting analysis is performed using semi-empirical templates derived from Palomar-Green quasars to classify the sample into normal, warm-dust-deficient (WDD), and hot-dust-deficient (HDD) AGNs. Kolmogorov–Smirnov tests reveal that HDD AGNs exhibit, on average higher AGN luminosity than normal and WDD AGNs. HDD fraction, on the other hand, is only weakly correlated with black hole mass and inversely correlated with Eddington ratio. By fixing the other parameters, we conclude that the HDD fraction is primarily connected with the AGN luminosity. It implies that there is a causal connection between the covering factor of the hot dust component and AGN luminosity, possibly due to the sublimation of the innermost dust or the thickening of the intervening gas in the broad-line region. Analysis of the outflow properties traced by the wing of [O III] suggests that outflows may be related to the formation and maintenance of the hot dust component. Finally, we demonstrate through comparison with previous studies that the classification of HDD AGNs requires careful subtraction of the host galaxy light.
1 Introduction
Active galactic nuclei (AGNs) are crucial to understanding the evolution and formation of supermassive black holes (SMBHs), which grow substantially in the AGN phase (e.g., Soltan, 1982; Merloni & Heinz, 2008). As the material swirls onto an SMBH, not only an accretion disk but also additional substructures, such as corona and relativistic jet, can emerge in its vicinity, emitting strong radiation over a wide wavelength range from radio to X-rays. According to the orientation-based unification paradigm, AGNs are classified into type 1 and type 2 depending on whether the dusty torus obstructs the line-of-sight to the central part of the AGN (e.g., accretion disk and broad-line region, Antonucci 1993; Urry & Padovani 1995). For example, type 2 AGNs are thought to be covered by the obscuring medium along the line-of-sight. It indicates that torus plays such an important role in the AGN unification model, but its origin and detailed structure are still controversial.
As infrared (IR) thermal emission originates from the dust heated by the X-ray/UV light from the accretion disk, the structure of the torus has traditionally been studied with spectral energy distribution (SED) in the IR wavelength, (Rees et al., 1969). While several studies have suggested that the SED of the torus is well fit with the clumpy clouds rather than the single smooth cloud, an additional hot dust component presumably positioned at the innermost of the torus is still necessary to account for the IR excess (e.g., Nenkova et al., 2002; Ogawa et al., 2021).
Two scenarios have been proposed to explain the physical origin of the torus. (1) The dusty torus is naturally supplied from the host galaxy (e.g., Krolik & Begelman, 1988). (2) The torus is composed of the dusty material condensed from the AGN outflow (e.g., Elvis et al., 2002). The two scenarios predict the location and evolution of hot dust in slightly different ways. For example, from the former scenario, hot dust is expected to be located at the sublimation radius because the innermost radius is set where the dust inflow driven by the cloud-cloud collision is sublimated due to the radiation from the accretion disk. Conversely, the latter scenario predicts the hot dust to be positioned outside the sublimation radius because outflowing clouds must reach times the initial radius of outflowing clouds for dust condensation (see Section 3 of Elvis et al. 2002). Therefore, observational studies to investigate the physical properties of hot dust components will allow us to uncover the origin of the torus, which can be accomplished by reverberation mapping (RM; Clavel et al. 1989; Minezaki et al. 2004; Suganuma et al. 2006; Koshida et al. 2014; Minezaki et al. 2019) and spatially resolved near-infrared (NIR) interferometric observation (Swain et al., 2003; GRAVITY Collaboration et al., 2020a, b).
| Normal | WDD | HDD | Normal+WDD | WDD+HDD | |
|---|---|---|---|---|---|
| (1) | (2) | (3) | (4) | (5) | (6) |
| 550 | 991 | 547 | 1541 | 1538 | |
| R |
Note. — Median values and median absolute deviations for each subgroup. Col. (1): Properties of the subsamples. the number of subsample; redshift; logarithmic 5100 Å monochromatic luminosity in the unit of erg s-1; logarithmic black hole mass in the unit of ; Eddington ratio with bolometric luminosity inferred from .; Infrared luminosity at 3.6 m in the unit of erg s-1; Infrared luminosity at 12 m in the unit of erg s-1; EW ratio of Fe II to broad H. Col. (2): Normal AGNs. Col. (3): WDD AGNs. Col. (4): HDD AGNs. Col. (5): Normal and WDD AGNs. Col. (6): WDD and HDD AGNs.
Based on the assumption that the NIR continuum mainly originates from the innermost torus, RM provides a unique opportunity to directly measure the radius of the hot dust component, which is hardly resolved even with high spatial images from Hubble Space Telescope (Antonucci & Miller, 1985). Although the inner radius of the torus measured by RM is smaller than that observed by NIR interferometry or predicted by dust size-luminosity relation, the hot dust can still be interpreted as being located in the sublimation radius (e.g., Kishimoto et al., 2007; Kawaguchi & Mori, 2010, 2011). However, NIR RM and interferometric studies produce inconsistent outcomes for the same target. The RM investigation of NGC 4151 finds that the hot dust radius is proportional to the AGN luminosity (Koshida et al., 2009), probably attributed to a change in dust sublimation radius and may be indicative of a host origin for the dusty torus. Conversely, using NIR interferometry data, Pott et al. (2010) demonstrated that the hot dust radius is independent of the AGN luminosity, suggesting an outflow origin is preferred.
Although the physical properties of hot dust have been widely studied, the hot dust was considered a generic feature of AGN until Jiang et al. (2010) reported two hot-dust-deficient (HDD) quasars at . Several studies have since explored the properties of HDD quasars, but no consensus has yet been reached on the physical origin of the hot dust deficit. For example, the redshift evolution of HDD fraction was discovered in some studies (e.g., Hao et al., 2010; Jun & Im, 2013), but not in others (e.g., Hao et al., 2011; Mor & Trakhtenbrot, 2011). Furthermore, various studies (Jiang et al., 2010; Mor & Netzer, 2012; Jun & Im, 2013) argued that the HDD quasars tend to have lower BH mass than normal quasars, whereas other studies (e.g., Hao et al., 2010; Mor & Trakhtenbrot, 2011; Lyu et al., 2017) failed to find such a trend. The trend for the Eddington ratio () is more complicated. Jiang et al. (2010) and Jun & Im (2013) argued that of HDD quasars is higher than that of normal quasars, but Lyu et al. (2017) reported the contrary. Although it is unclear what causes this discrepancy, insufficient sample sizes, varied HDD selection methods, or/and narrow dynamic ranges of physical properties may make direct comparisons between various studies difficult.
Based on the above motivation, we investigate the physical properties of a large number of nearby quasar samples in a homogeneous manner to unveil the physical origin of the hot dust component. Section 2 describes sample selection and SED construction using observed data covering the optical to mid-infrared (MIR) wavelength. SED decomposition utilizing semi-empirical AGN templates adopted from Lyu et al. (2017) and Lyu & Rieke (2017, 2018) and its application to SED fit for the AGN classification based on the dust properties are represented in Section 3. Section 4 compares the AGN properties of normal, warm-dust-deficient (WDD), and hot-dust-deficient AGN populations, and presents a discussion of their origins. The summary is presented in Section 5. We adopt the following cosmological parameters: km , , and (Planck Collaboration et al. 2020).
2 Sample and Data
The type 1 AGN sample is initially selected from the 14th data release of the Sloan Digital Sky Survey (SDSS-DR14) quasar catalog (Pâris et al., 2018). The redshift limit () is set to reduce the effect of cosmic evolution on the torus properties. In addition, this redshift cut is crucial to secure the NIR photometric coverage, which is needed to model the stellar continuum (e.g., Son et al., 2022). As a result, 7,720 objects are selected. To perform the SED fit, we collect the optical (), NIR (), and MIR (W1, W2, W3, and W4) photometry from SDSS-DR14, Two Micron All Sky Survey (2MASS) All-Sky Point Source Catalog (Skrutskie et al., 2003, 2006), and Wide-Field Infrared Survey Explorer (WISE) All-Sky Source Catalog (Wright et al., 2010, 2019), respectively. Therefore, the SED covers the wavelength range of . We employ a radius of 2′′ for the cross-match between the catalogs (Son et al., 2022). Finally, 4,355 samples having IR counterparts both in the 2MASS and WISE catalogs are used throughout the paper. The SDSS and 2MASS magnitudes are corrected for the Galactic extinction using a dust reddening map from Schlafly & Finkbeiner (2011), based on the reddening law from Fitzpatrick (1999).
The spectral measurements from Rakshit et al. (2020) have been adopted in this study to investigate the physical properties of AGNs. BH masses are calculated using a virial method (), where the size of the broad-line region () is inferred from the monochromatic luminosity at 5100 Å (; e.g., Bentz et al., 2013) and the FWHM of H is used as a surrogate for . In this paper, we employ the BH mass estimator based on the calibration of Ho & Kim (2015). The bolometric luminosity is converted from using a conversion factor of 9.26 (Richards et al., 2006). As a proxy for the accretion rate, we used Eddington ratio (), where erg s-1. Median values with median absolute deviations of various physical properties for each group are shown in Table 1.
3 SED Fitting for Torus classification
3.1 SED Templates
While the presence of the hot dust component in the torus can be determined in a variety of ways (e.g., Jiang et al., 2010; Hao et al., 2011; Mor & Netzer, 2012; Jun & Im, 2013; Lyu et al., 2017), SED fitting, which effectively accounts for the contributions from the host galaxy and/or the polar dust component, is used in this study. The semi-empirical templates from Lyu et al. (2017) are adopted for that purpose, in which the Palomar-Green QSOs (Boroson & Green, 1992) were classified into three subgroups based on the existence of hot and warm dust components in the NIR/MIR SED: normal, WDD, and HDD AGNs. WDD AGNs are defined as those that are deficient in warm dust traced by the thermal emission ranging from to , while HDD AGNs lack the thermal emission from the additional hot dust ( K) around as well as the warm dust emission. More specifically, the dust-deficient AGNs are defined as those that deviate by at least 0.3 dex from the standard QSO template adopted from Elvis et al. (1994); see Lyu et al. 2017 for more details on the classification. From this classification, Lyu et al. (2017) generated the representative SED in each subgroup. The stellar continuum from the host galaxy and thermal emission from the polar dust are also included.
For the stellar continuum, the SED template from Lyu & Rieke (2018) is initially adopted, which is modeled with three components: the 7 Gyr old single stellar population from Bruzual & Charlot (2003) at , MIR composite spectra generated from the Spitzer/IRS spectra of nearby elliptical galaxies without the sign of star formation at and a power-law SED () above 20 . In addition, to account for younger stellar populations commonly discovered in the AGN host galaxies (e.g., Kim et al., 2017; Kim & Ho, 2019; Zhao et al., 2021), we employ the spectral templates from the elliptical galaxy with 2 Gyr old stellar population, S0, Sa, Sb, Sc, and Sd from the SWIRE template library (Polletta et al., 2007). In total, seven templates are used to model the host galaxy. The reddening of the AGN continuum and reprocessed emission due to the polar dust component is taken into account for the SED fit (Lyu & Rieke, 2018). While the polar dust was modeled in detail in Lyu & Rieke (2018), it was assumed to follow the power-law density profile () and to be composed of large dust grains (). The radiative transfer calculation was performed using the code DUSTY (Ivezic & Elitzur 1997). Note that the only free parameter is the extinction in band (). Finally, the extinction due to the equatorial torus is also considered as some of the sample AGNs exhibit power-law SEDs throughout the optical to MIR region, suggesting non-negligible extinction. To account for this effect, we adopt the extinction law from Fitzpatrick (1999).
3.2 SED fitting
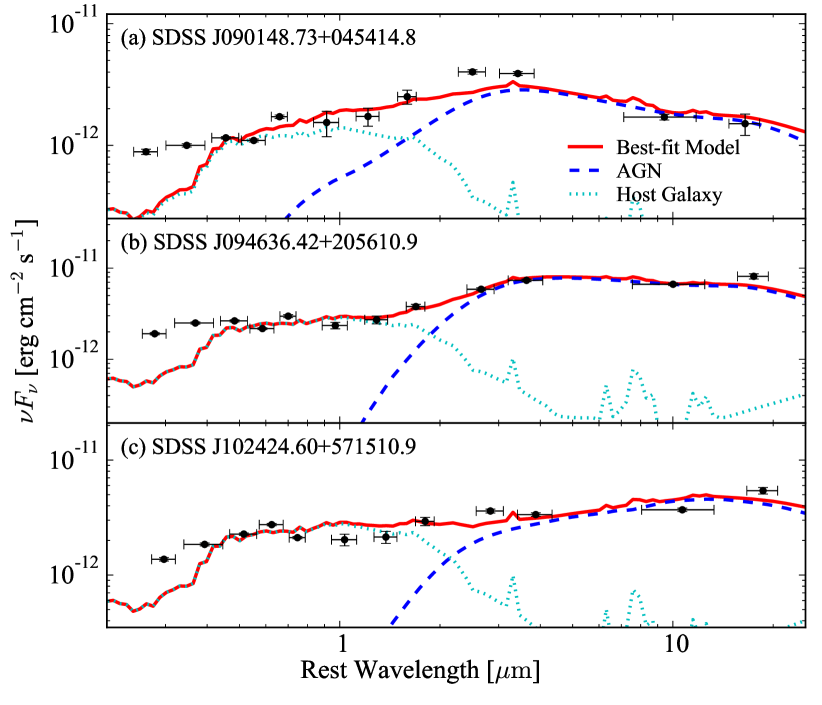
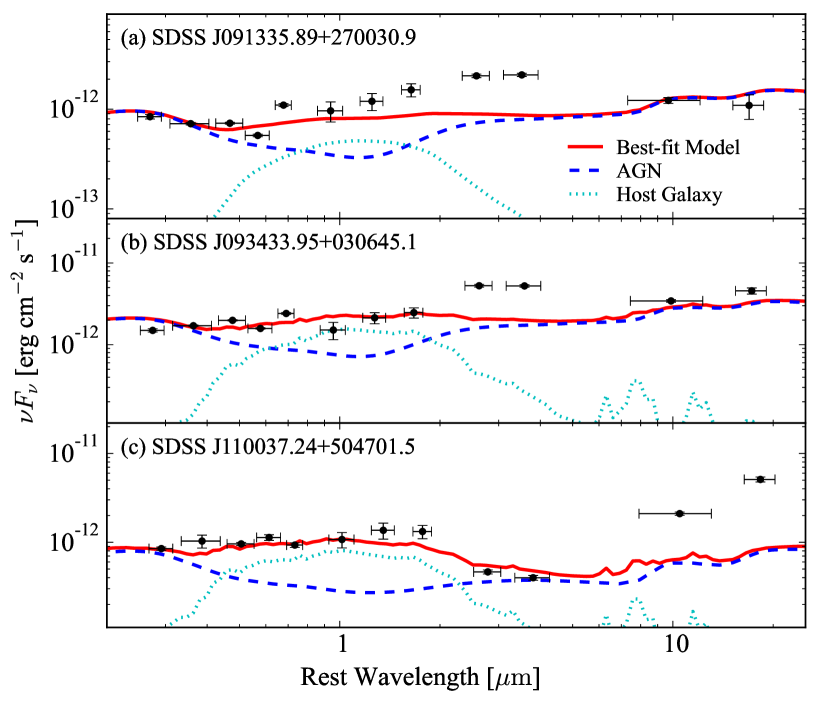
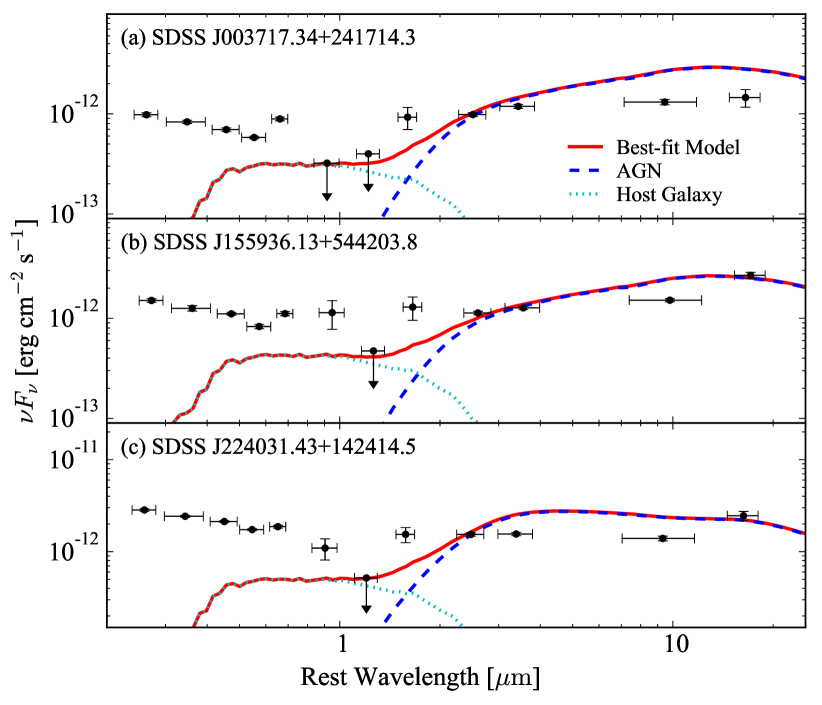
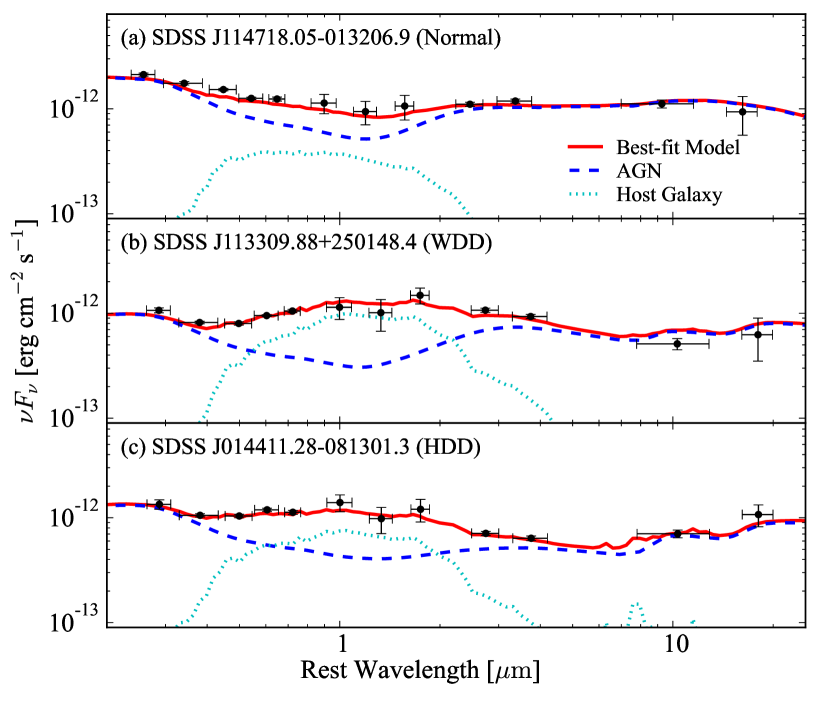
The code LePHARE (Arnouts et al., 1999; Ilbert et al., 2006) is utilized for the SED fit. The redshift is fixed to the spectroscopic one. During the fit, we utilize all photometric data from -band to W4, where it is available. However, for some objects, a part of NIR/MIR photometry is unavailable in 2MASS or WISE, where only upper limits were given. The relative flux contribution between the AGN SED templates from Lyu et al. (2017) and the stellar continuum is set at . We let the stellar contribution at 1.6 range from 1% to 95%. We allow the extinction of the stellar continuum to be , or mag. The extinction of the accretion disk due to the polar dust is forced to be , or to account for the IR contribution from the polar dust. Finally, we let the extinction due to the equatorial torus be , or mag. Examples of the SED fit are displayed in Figure 1.
3.3 Classification
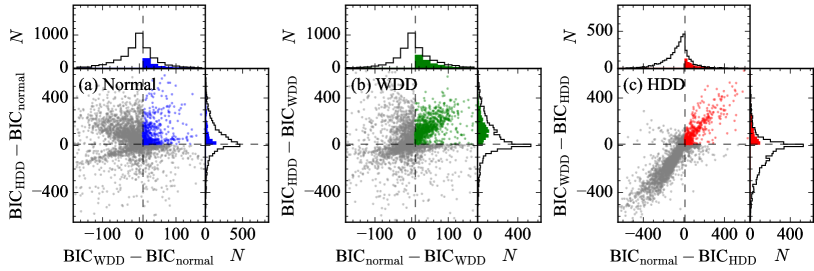
As described in §3, we apply the SED fit to each object to find which template out of normal, WDD, and HDD quasars best describe the SED and utilize Bayesian Information Criterion (BIC; Schwarz 1978). The BIC is defined as , where is the chi-square of the best-fitting model, is the number of free parameters, and is the number of observed data. If the difference in BIC between the two models () is higher than 10, the model with a smaller BIC can be regarded as the best model (Liddle, 2007). Finally, we only choose the objects with a reduced to eliminate the ones with poor SED fits. Figure. 2 displays the distributions of between the subgroups.
Using the criteria of , 550, 991, and 547 objects are classified as normal, WDD, and HDD AGNs, respectively. For the remaining 2267 objects, either we fail to construct a conclusive classification based on the BIC value (i.e., ) or their reduced is greater than 10 (see Appendix for examples of poor fits). Taken at face value, it is intriguing that the WDD fraction (%) is significantly higher than that from the previous studies (e.g., from PG quasars in Lyu et al. 2017). It is assumed that this is owing to the inclusion of the polar dust in the SED fit, which radiates the emission in the MIR. Note that Lyu et al. (2017) used the same templates for the classification but did not consider polar dust. As a result, the light contribution from the warm dust can be naturally reduced. To test this hypothesis, we carry out the SED fitting analysis without the polar dust and find that the WDD fraction dramatically decreased to %, increasing the normal fraction to %. It demonstrates that the normal and WDD AGNs can be misclassified from each other mainly due to the degeneracy between the polar dust and warm dust. This trend is also clearly seen in Figure 2, where the distribution between normal and WDD AGNs is centrally concentrated within . Therefore, throughout this study, we do not attempt to distinguish them, instead focusing on the physical difference between two types (i.e., normal and WDD AGNs) and HDD AGNs. On the other hand, the HDD fraction of 26% in our sample determined from the SED fitting with the polar dust is in good agreement with that of % from Lyu et al. (2017). Note that the HDD fraction based on the SED fit without the polar dust is in our sample. Throughout this study, we employ the classification based on the SED fitting analysis that includes the polar dust.
4 Discussions
4.1 Reliability of the SED Analysis
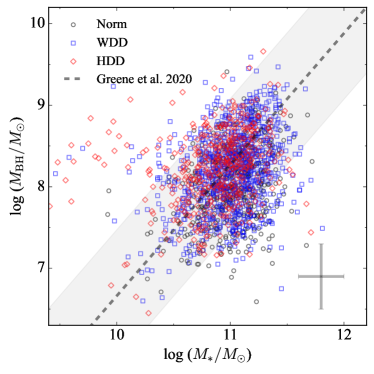
To test the reliability of the SED fitting analysis, we estimate the stellar mass of the host galaxies from the fitting results. The majority of SED templates for the host galaxy used in the analysis are empirically determined. Therefore, we estimate the stellar mass based on the mass-to-light ratio () in the band. As the host spectrum peaks around 1.6 m in , we first compute the -band magnitude from the host SED in the best-fit model. at the -band is inferred using the equation in Bell et al. (2003) associated with - color, which is determined by its host morphology from the best-fit model (Fukugita et al., 1995). Note that we also compute the stellar mass based on the SED fit without the polar dust and find that the stellar mass of the host galaxies agrees with that from the SED fit with the polar dust within 0.02 dex. The comparison between the BH mass and the total stellar mass of the host galaxy reveals that the relation between two quantities of our sample agrees well with that of normal galaxies (Greene et al., 2020), suggesting that our SED fitting analysis is reliable (Fig. 3). The BH mass estimate based on the virial method is known to have a typical uncertainty of dex (e.g., Vestergaard & Peterson 2006), whereas stellar mass inferred from the optical color can be estimated with an accuracy of dex (e.g., Bell et al. 2003).
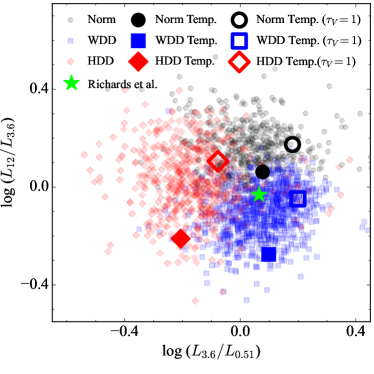
We additionally utilize the optical and MIR color information to examine whether our classification agrees well with the color-based selection. After some experiments, we find that three subsamples can be most distinctive in the plane of 3.6 to 0.51 flux ratio and 12 to 3.6 flux ratio (Fig. 4). However, there exist substantial overlaps among the subsamples, possibly due to the light contribution from the host galaxy as well as the effect of the polar dust. For example, as illustrated in Figure 4, the extinction with owing to the polar dust results in dramatic changes in the optical and MIR color. It implies that careful treatment of both components may be crucial for the torus classification.
4.2 Dependence on AGN Properties
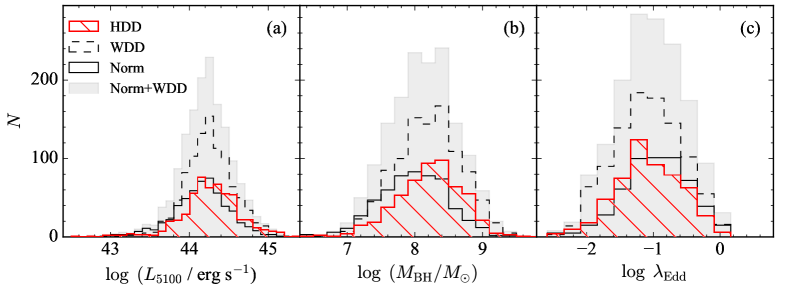
We analyze the AGN properties in the subgroups to determine the nature of the hot dust deficiency in nearby AGNs. Specifically, we perform Kolmogorov–Smirnov (K-S) test to examine whether HDD AGNs are distinguishable from normal or WDD AGNs. While numerous physical parameters are examined, we emphasize crucial physical parameters potentially responsible for the HDD phenomena. As summarized in Table 2 and Figure 5, and of HDD AGNs and those of normal and WDD AGNs appear not to be drawn from the same distribution with a significance level of (i.e., value ). In particular, HDD AGNs tend to have a larger than normal and WDD AGNs. However, the distributions of the other two parameters ( and ) are only distinguishable between normal and HDD AGNs. In contrast, such distinctions between WDD and HDD AGNs are not apparent with values , which implies that the null hypothesis that the two distributions are drawn from the same parent population cannot be rejected. Finally, the K-S test reveals that the distribution of for normal AGNs and both WDD and HDD AGNs may not be drawn from the same at a confidence level greater than 99.9%. As described in SS3.3, the distinction between normal and WDD AGNs is somewhat ambiguous due to the degeneracy between MIR emission from warm dust and polar dust, revealing that we caution against overinterpreting physical distinctions between normal and WDD AGNs.
| Normal vs. WDD | Normal vs. HDD | WDD vs. HDD | Normal vs. WDD+HDD | Normal+WDD vs. HDD | ||||||||||
|---|---|---|---|---|---|---|---|---|---|---|---|---|---|---|
| (1) | (2) | (3) | (4) | (5) | (6) | (7) | (8) | (9) | (10) | (11) | ||||
| 0.573 | 0.007 | 0.012 | 0.157 | 0.008 | ||||||||||
| 0.098 | ||||||||||||||
| 0.426 | ||||||||||||||
| 0.567 | 0.189 | |||||||||||||
Note. — Results of two-sample K–S tests. Col. (1): Properties of the subsamples. Same as Table 1. Col. (2): Difference in the median values for normal AGNs and WDD AGNs. , where and are the median values for normal AGNs and WDD AGNs, respectively. Col. (3): -value for normal AGNs against WDD AGNs. Col. (4): Difference in the median values for normal AGNs and HDD AGNs. Col. (5): -value for normal AGNs against HDD AGNs. Col. (6): Difference in the median values for WDD AGNs and HDD AGNs. Col. (7): -value for WDD AGNs against HDD AGNs. Col. (8): Difference in the median values for normal AGNs and WDD+HDD AGNs. Col. (9): -value for normal AGNs against WDD+HDD AGNs. Col. (10): Difference in the median values for normal+WDD AGNs and HDD AGNs. Col. (11): -value for normal+WDD AGNs against HDD AGNs.
4.3 What Makes Hot Dust Deficiency?
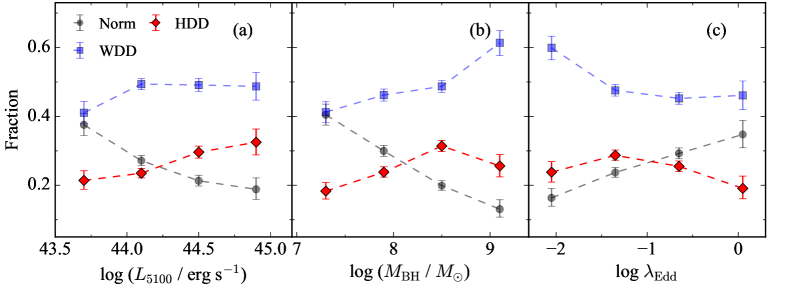
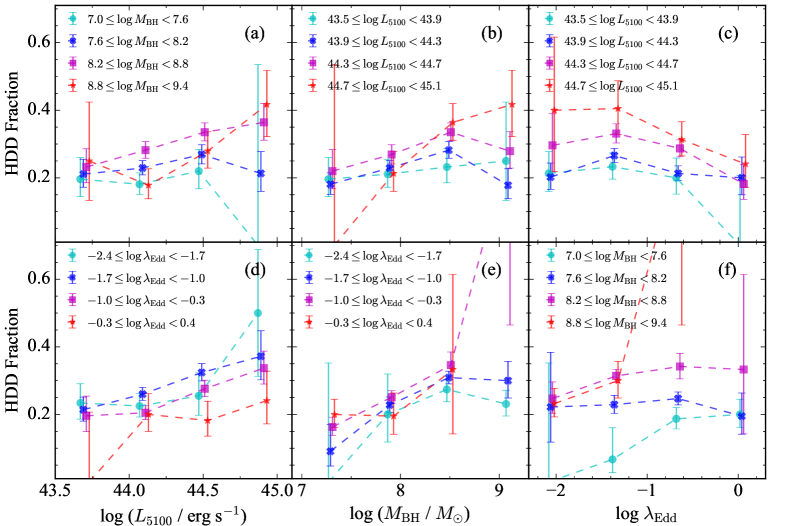
From the K-S tests, we argue that three physical parameters (, , and ) might be responsible for the hot dust deficiency. To quantify the correlations, we estimate the fraction of HDD as a function of those parameters (Fig. 6). The HDD fraction increases considerably as AGN luminosity increases. A Pearson correlation coefficient () of 0.98 with a value of between the HDD fraction and AGN luminosity implies that the correlation is significant. The results are not very sensitive to the exact choice of binning. However, its correlation with BH mass and Eddington ratio is more complicated in that HDD fraction peaks around and and slightly decreases with increasing and , respectively. Concerning the dependence on and , we suspect it mainly comes from the difference between normal and HDD AGNs; there is no significant difference in and distributions between WDD and HDD AGNs (Tables 1 and 2). Nevertheless, it is interesting to note that HDD fraction declines with Eddington ratio at a low Eddington ratio ( ), while it is only weakly dependent on Eddington ratio at . This will be further discussed later in this section. As a result, we conclude that could be a primary driver of the HDD phenomenon. To investigate this scenario further, we divide the sample into subgroups based on and (Fig. 7). This experiment reveals that the dependency on still persists even with fixing other parameters.
is known as a good tracer of AGN bolometric luminosity. Therefore, its correlation with HDD fraction reveals that the HDD fraction increases with increasing AGN luminosity. The dependence on the AGN luminosity can be interpreted as the covering factor of the hot dust component decreasing with increasing the AGN luminosity. The anti-correlation between the IR-to-optical flux ratio and the AGN luminosity was previously recognized (e.g., Maiolino et al., 2007; Treister et al., 2008). To explain this trend, the receding torus model has often been invoked, in which the inner radius of the torus grows with AGN luminosity, presumably due to the sublimation (e.g., Lawrence, 1991; Simpson, 2005; Hönig & Beckert, 2007). From the MIR variability investigations of nearby AGNs, Son et al. (2022) also argued that the covering factor of the hot dust potentially decreases as the AGN luminosity increases.
Alternatively, the bowl-shaped torus (Gaskell et al., 2007; Kawaguchi & Mori, 2010, 2011; Goad et al., 2012), driven by the anisotropic accretion disk emission, can also be attributed to this dependence. In this model, optically thick gas in the broad-line region (BLR) lies along the bowl-shaped sublimation rim, obstructing the accretion disk emission towards part of the torus close to the equatorial plane. Consequently, most of the hot dust emission comes from the top edge of the torus, and the covering factor of hot dust is dependent on how much BLR gas covers the sublimation rim (i.e., the height ratio of BLR gas to torus). As expected from this model, the hot dust covering factor ( on average; Landt et al., 2011; Mor & Trakhtenbrot, 2011) is known to be substantially smaller than that of the ordinary torus ( on average; e.g., Sanders et al., 1989). Previous studies demonstrated that the height of the torus depends on AGN luminosity as , where ranges from 0.23 to 0.4 (Cao, 2005; Simpson, 2005; Lusso et al., 2013). On the other hand, gas tends to puff up more easily than dust when the gravitational potential decreases with distance from the BH. For example, Ramolla et al. (2018) have inferred that the height of BLR gas depends on the equatorial radius () at a given turbulent velocity and viscosity parameter. From the size-luminosity relation of the BLR (), we can infer that the height of the BLR increases more rapidly with than that of the torus ( vs. ). Therefore, the thickening of the BLR due to the high AGN luminosity can decrease the covering factor of the hot dust component.
A similar trend was found in Mor & Trakhtenbrot (2011), in which they reported that the covering factor of hot dust is strongly correlated with but not with or . However, contrary to our result, previous studies about HDD quasars have shown that the HDD fraction is independent of AGN luminosity (e.g., Jiang et al., 2010; Hao et al., 2010, 2011; Mor & Trakhtenbrot, 2011; Lyu et al., 2017). This discrepancy is partly because some previous studies were conducted with luminous AGNs, which can be inadequate to identify the luminosity dependence of HDD fraction. For example, Jiang et al. (2010); Hao et al. (2011); Mor & Trakhtenbrot (2011) focused on the AGNs with erg s-1, which is times higher than AGN luminosity of our sample. In addition, studies with AGNs over a wide range of redshift found no evidence of dependence on AGN luminosity, possibly due to the difficulty of disentangling the luminosity dependence of HDD fraction from cosmological effects (e.g., Hao et al. 2010, 2011). Interestingly, nearby AGNs that cover a wide range of AGN luminosity exhibit an inverse correlation between the covering factor of the hot dust component and AGN luminosity (Mor & Netzer 2012), consistent with our finding.
On the contrary, recent studies suggested that the covering factor of the dust can be independent of the AGN luminosity but relatively sensitive to the Eddington ratio (e.g., Stalevski et al., 2016; Buchner & Bauer, 2017; Ezhikode et al., 2017; Ricci et al., 2017). For example, Lyu et al. (2017) argued that only the distribution was distinguished between HDD and normal AGN while the distributions of and for HDD and normal AGNs may be drawn from the same parent population. The dependence on the Eddington ratio can be explained by the relative strength of radiation pressure compared to the gravitational potential of SMBH (e.g., Fabian et al., 2009; Wada, 2015). According to Ricci et al. (2017), the obscuring material in the circumnuclear region around SMBHs can be easily blown away owing to the radiation pressure. Interestingly, the radiation pressure effectively clears the obscuring material only at , and the hot dust in the vicinity of the accretion disk with a smaller than 0.03 may persist due to the low radiation pressure (e.g., Fabian et al., 2009; Ricci et al., 2017; Venanzi et al., 2020). This prediction is in good agreement with our finding that HDD fraction declines at a low Eddington ratio ( ) and is weakly correlated with the Eddington ratio . On the other hand, we find the gradual decline of HDD fraction at a high Eddington ratio ( ), coincident with a critical Eddington ratio ( ) at which the standard thin disk (Shakura & Sunyaev, 1973) is known to turn into the slim disk (Abramowicz et al., 1988). This decline can be explained by reduced radiation pressure on the torus attributed to anisotropic radiation from the geometrically thick inner structure of the slim disk, thereby increasing the covering factor of the dusty torus. Similar to our result, Zhuang et al. (2018) reported that the torus half-opening angle first decreases and then increases with increasing and argued that it could be caused by the geometrical change of the accretion disk with Eddington ratio.
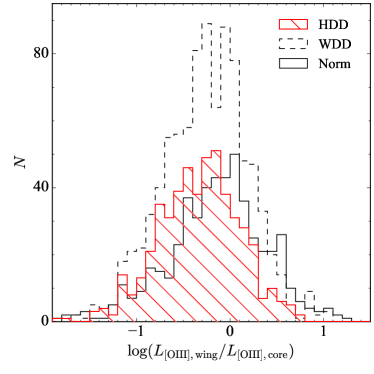
To examine whether the outflow is responsible for the hot-dust deficiency, we independently investigate the presence and strength of the outflow using the [O III] emission line. The [O III] line is commonly modeled with two components (e.g., Heckman et al., 1981; Nelson et al., 1996; Greene & Ho, 2005). In general, a core component of relatively narrow line width is governed by the gravitational potential of the host galaxy, while non-gravitational motions, such as those driven by an outflow (e.g., Crenshaw et al., 2010; Mullaney et al., 2013)), produce broader wings. From the spectral measurements of (Rakshit et al., 2020), we find that fractions of objects with an [O III] wing are , , and for normal, WDD, and HDD AGNs, respectively, tentatively suggesting that outflows may be marginally more common in normal AGNs. To estimate the relative strength of the outflow, we compute the luminosity ratio of the wing relative to the core (). The medians and their absolute deviations of are , , and for normal, WDD, and HDD AGNs, respectively. In addition, the K-S test between normal+WDD AGNs and HDD AGNs yields a value , which again suggests that the outflow in normal and WDD AGNs can be stronger than that in HDD AGNs (Figure 8). These findings appear to disagree with the notion that the outflow suppresses the hot dust component. Instead, the outflow may enhance the formation of hot and warm dust. This trend is consistent with the “radiation-driven fountain model”, where the dusty torus is formed and maintained by the outflow from the accretion disk (e.g., Elitzur & Shlosman, 2006; Wada, 2015).
The ratio () of equivalent width (EW) of Fe II measured within 4434–4684 Å to that of broad H correlates with eigenvector 1, which may be determined primarily by the Eddington ratio (e.g., Boroson, 2002; Shen & Ho, 2014). We find that tends to be marginally larger for normal AGNs than HDD AGNs (Tab. 1). Therefore, its correlation with HDD fraction indirectly reveals that the HDD fraction increases with decreasing the Eddington ratio, consistent with the finding in this study. Interestingly, a similar trend was found in other studies: Shen & Ho (2014) reported that W1 color, which is an approximate indicator of the relative strength of the hot dust emission (Fig. 4), is correlated with .
Finally, similar to the trend for , we also find that the HDD fraction increases with at and decreases with at , although the decrease in the high-mass end is statistically meaningful only at the confidence. As shown in Figure 7, even with fixing the other parameters, this trend still remains the same, contradicting previous studies which claimed HDD AGNs tend to have a lower (e.g., Jiang et al., 2010; Mor & Netzer, 2012; Jun & Im, 2013). This discrepancy may come from the fact that previous studies focused on the luminous and therefore massive AGNs than our study. The physical origin of the declines in the HDD fraction at low and high BH masses is unclear and may be addressed in future studies with the enlarged sample.
4.4 Comparison of Selection Method with Previous Studies
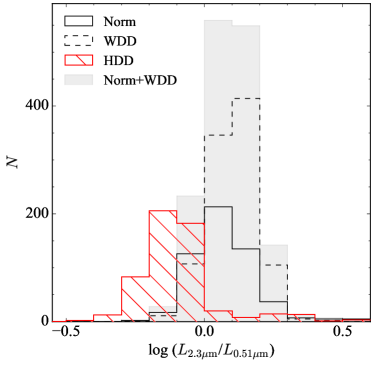
The dust-deficient AGNs were identified in various ways, which may induce bias in the sample selection between studies. Therefore, it is worthwhile to compare our selection method with previous studies. One of the most common approaches is to use the optical-IR color (e.g., Hao et al., 2010; Jiang et al., 2010; Jun & Im, 2013). For example, Jun & Im (2013) employed 2.3 m to 0.51 m flux ratio to identify the HDD QSOs, whereas 3.4 m flux density was instead used to trace the covering factor of the hot dust in Jiang et al. (2010). We adopt the selection method from Jun & Im (2013) for the comparison with our study.
The luminosities at 0.51 and 2.3 m ( and ) are calculated in the rest-frame, using the linear interpolation of the observed broadband SED. Note that no assumption about the best-fit model is made in this calculation. As expected, we find that HDD AGNs had reduced ratios (Fig. 9). However, its distribution partially overlaps with the other two populations (normal and WDD AGNs). Furthermore, of HDD AGNs is significantly greater than the criterion () for selecting the HDD in Jun & Im (2013). It should be noted that Jun & Im (2013) dealt with very luminous AGNs ignoring the flux contribution from the host galaxy. In contrast, the sample in our study is substantially fainter than that in Jun & Im (2013), indicating that our sample may suffer from the host contribution. Therefore, careful treatment of the host light is required for HDD selection, and the simplified color-cut selection may not be reliable, especially for low-luminosity AGNs.
5 Summary
To understand the physical origin of the hot dust deficiency in AGNs, we utilize the broadband spectral energy distribution of low- AGNs at selected from the SDSS quasar catalog. We adopt the SED templates generated from Palomar-Green quasars to classify the sample based on the hot dust in the SED. We perform the SED fitting analysis with careful treatments on the stellar continuum from the host galaxy and extinction and emission due to the polar dust. From these experiments, we find the following results:
-
•
26% of the sample is unlikely to exhibit hot and warm dust components (i.e., hot-dust-deficient AGNs), while 47% of the sample is classified as warm-dust-deficient (WDD) AGNs.
-
•
Hot-dust-deficient (HDD) AGNs tend to have larger than normal and WDD AGNs.
-
•
HDD fraction first increases in a low Eddington ratio and then decreases in a high Eddington ratio with Eddington ratio. A similar up-and-down trend with BH mass is also detected. However, as this trend is statistically significant only at the level of 2, it needs to be further tested with a larger sample.
-
•
Dependency on is consistent with the receding torus model, in which the covering factor of the hot dust is anti-correlated with AGN luminosity, possibly due to the sublimation of the innermost torus. In addition, this trend can also be explained by enlarging the height of the optically thick BLR based on the bowl-shaped torus model.
-
•
We investigate the physical properties of the outflow and find that the outflow may help to form and maintain the hot dust component. This finding is consistent with the “radiation-driven fountain model”, in which the wind and outflow from the accretion disk drive the dusty torus.
-
•
Our results are somewhat inconsistent with previous studies based on the luminous AGNs, revealing that the sample spanning a wide range of AGN properties is vital to minimize the selection bias.
References
- Abramowicz et al. (1988) Abramowicz, M. A., Czerny, B., Lasota, J. P., & Szuszkiewicz, E. 1988, ApJ, 332, 646
- Antonucci (1993) Antonucci, R. 1993, ARA&A, 31, 473
- Antonucci & Miller (1985) Antonucci, R. R. J., & Miller, J. S. 1985, ApJ, 297, 621
- Arnouts et al. (1999) Arnouts, S., Cristiani, S., Moscardini, L., et al. 1999, MNRAS, 310, 540
- Arnouts & Ilbert (2011) Arnouts, S., & Ilbert, O. 2011, LePHARE: Photometric Analysis for Redshift Estimate, Astrophysics Source Code Library, record ascl:1108.009, ascl:1108.009
- Astropy Collaboration et al. (2013) Astropy Collaboration, Robitaille, T. P., Tollerud, E. J., et al. 2013, A&A, 558, A33
- Astropy Collaboration et al. (2018) Astropy Collaboration, Price-Whelan, A. M., Sipőcz, B. M., et al. 2018, AJ, 156, 123
- Astropy Collaboration et al. (2022) Astropy Collaboration, Price-Whelan, A. M., Lim, P. L., et al. 2022, ApJ, 935, 167
- Bell et al. (2003) Bell, E. F., McIntosh, D. H., Katz, N., & Weinberg, M. D. 2003, ApJS, 149, 289
- Bentz et al. (2013) Bentz, M. C., Denney, K. D., Grier, C. J., et al. 2013, ApJ, 767, 149
- Boroson (2002) Boroson, T. A. 2002, ApJ, 565, 78
- Boroson & Green (1992) Boroson, T. A., & Green, R. F. 1992, ApJS, 80, 109
- Brown et al. (2001) Brown, L. D., Cai, T. T., & DasGupta, A. 2001, Statistical Science, 16, 101
- Bruzual & Charlot (2003) Bruzual, G., & Charlot, S. 2003, MNRAS, 344, 1000
- Buchner & Bauer (2017) Buchner, J., & Bauer, F. E. 2017, MNRAS, 465, 4348
- Cao (2005) Cao, X. 2005, ApJ, 619, 86
- Clavel et al. (1989) Clavel, J., Wamsteker, W., & Glass, I. S. 1989, ApJ, 337, 236
- Crenshaw et al. (2010) Crenshaw, D. M., Schmitt, H. R., Kraemer, S. B., Mushotzky, R. F., & Dunn, J. P. 2010, ApJ, 708, 419
- Elitzur & Shlosman (2006) Elitzur, M., & Shlosman, I. 2006, ApJL, 648, L101
- Elvis et al. (2002) Elvis, M., Marengo, M., & Karovska, M. 2002, ApJL, 567, L107
- Elvis et al. (1994) Elvis, M., Wilkes, B. J., McDowell, J. C., et al. 1994, ApJS, 95, 1
- Ezhikode et al. (2017) Ezhikode, S. H., Gandhi, P., Done, C., et al. 2017, MNRAS, 472, 3492
- Fabian et al. (2009) Fabian, A. C., Vasudevan, R. V., Mushotzky, R. F., Winter, L. M., & Reynolds, C. S. 2009, MNRAS, 394, L89
- Fitzpatrick (1999) Fitzpatrick, E. L. 1999, PASP, 111, 63
- Fukugita et al. (1995) Fukugita, M., Shimasaku, K., & Ichikawa, T. 1995, PASP, 107, 945
- Gaskell et al. (2007) Gaskell, C. M., Klimek, E. S., & Nazarova, L. S. 2007, arXiv e-prints, arXiv:0711.1025
- Goad et al. (2012) Goad, M. R., Korista, K. T., & Ruff, A. J. 2012, MNRAS, 426, 3086
- GRAVITY Collaboration et al. (2020a) GRAVITY Collaboration, Pfuhl, O., Davies, R., et al. 2020a, A&A, 634, A1
- GRAVITY Collaboration et al. (2020b) GRAVITY Collaboration, Dexter, J., Shangguan, J., et al. 2020b, A&A, 635, A92
- Greene & Ho (2005) Greene, J. E., & Ho, L. C. 2005, ApJ, 627, 721
- Greene et al. (2020) Greene, J. E., Strader, J., & Ho, L. C. 2020, ARA&A, 58, 257
- Hao et al. (2011) Hao, H., Elvis, M., Civano, F., & Lawrence, A. 2011, ApJ, 733, 108
- Hao et al. (2010) Hao, H., Elvis, M., Civano, F., et al. 2010, ApJL, 724, L59
- Heckman et al. (1981) Heckman, T. M., Miley, G. K., van Breugel, W. J. M., & Butcher, H. R. 1981, ApJ, 247, 403
- Ho & Kim (2015) Ho, L. C., & Kim, M. 2015, ApJ, 809, 123
- Hönig & Beckert (2007) Hönig, S. F., & Beckert, T. 2007, MNRAS, 380, 1172
- Ilbert et al. (2006) Ilbert, O., Arnouts, S., McCracken, H. J., et al. 2006, A&A, 457, 841
- Ivezic & Elitzur (1997) Ivezic, Z., & Elitzur, M. 1997, MNRAS, 287, 799
- Jiang et al. (2010) Jiang, L., Fan, X., Brandt, W. N., et al. 2010, Natur, 464, 380
- Jun & Im (2013) Jun, H. D., & Im, M. 2013, ApJ, 779, 104
- Kawaguchi & Mori (2010) Kawaguchi, T., & Mori, M. 2010, ApJL, 724, L183
- Kawaguchi & Mori (2011) —. 2011, ApJ, 737, 105
- Kim & Ho (2019) Kim, M., & Ho, L. C. 2019, ApJ, 876, 35
- Kim et al. (2017) Kim, M., Ho, L. C., Peng, C. Y., Barth, A. J., & Im, M. 2017, ApJS, 232, 21
- Kishimoto et al. (2007) Kishimoto, M., Hönig, S. F., Beckert, T., & Weigelt, G. 2007, A&A, 476, 713
- Koshida et al. (2009) Koshida, S., Yoshii, Y., Kobayashi, Y., et al. 2009, ApJL, 700, L109
- Koshida et al. (2014) Koshida, S., Minezaki, T., Yoshii, Y., et al. 2014, ApJ, 788, 159
- Krolik & Begelman (1988) Krolik, J. H., & Begelman, M. C. 1988, ApJ, 329, 702
- Landt et al. (2011) Landt, H., Elvis, M., Ward, M. J., et al. 2011, MNRAS, 414, 218
- Lawrence (1991) Lawrence, A. 1991, MNRAS, 252, 586
- Liddle (2007) Liddle, A. R. 2007, MNRAS, 377, L74
- Lusso et al. (2013) Lusso, E., Hennawi, J. F., Comastri, A., et al. 2013, ApJ, 777, 86
- Lyu & Rieke (2017) Lyu, J., & Rieke, G. H. 2017, ApJ, 841, 76
- Lyu & Rieke (2018) —. 2018, ApJ, 866, 92
- Lyu et al. (2017) Lyu, J., Rieke, G. H., & Shi, Y. 2017, ApJ, 835, 257
- Maiolino et al. (2007) Maiolino, R., Shemmer, O., Imanishi, M., et al. 2007, A&A, 468, 979
- Merloni & Heinz (2008) Merloni, A., & Heinz, S. 2008, MNRAS, 388, 1011
- Minezaki et al. (2004) Minezaki, T., Yoshii, Y., Kobayashi, Y., et al. 2004, ApJL, 600, L35
- Minezaki et al. (2019) —. 2019, ApJ, 886, 150
- Mor & Netzer (2012) Mor, R., & Netzer, H. 2012, MNRAS, 420, 526
- Mor & Trakhtenbrot (2011) Mor, R., & Trakhtenbrot, B. 2011, ApJL, 737, L36
- Mullaney et al. (2013) Mullaney, J. R., Alexander, D. M., Fine, S., et al. 2013, MNRAS, 433, 622
- Nelson et al. (1996) Nelson, C. H., MacKenty, J. W., Simkin, S. M., & Griffiths, R. E. 1996, ApJ, 466, 713
- Nenkova et al. (2002) Nenkova, M., Ivezić, Ž., & Elitzur, M. 2002, ApJL, 570, L9
- Ogawa et al. (2021) Ogawa, S., Ueda, Y., Tanimoto, A., & Yamada, S. 2021, ApJ, 906, 84
- Pâris et al. (2018) Pâris, I., Petitjean, P., Aubourg, É., et al. 2018, A&A, 613, A51
- Planck Collaboration et al. (2020) Planck Collaboration, Aghanim, N., Akrami, Y., et al. 2020, A&A, 641, A6
- Polletta et al. (2007) Polletta, M., Tajer, M., Maraschi, L., et al. 2007, ApJ, 663, 81
- Pott et al. (2010) Pott, J.-U., Malkan, M. A., Elitzur, M., et al. 2010, ApJ, 715, 736
- Rakshit et al. (2020) Rakshit, S., Stalin, C. S., & Kotilainen, J. 2020, ApJS, 249, 17
- Ramolla et al. (2018) Ramolla, M., Haas, M., Westhues, C., et al. 2018, A&A, 620, A137
- Rees et al. (1969) Rees, M. J., Silk, J. I., Werner, M. W., & Wickramasinghe, N. C. 1969, Natur, 223, 788
- Ricci et al. (2017) Ricci, C., Trakhtenbrot, B., Koss, M. J., et al. 2017, Natur, 549, 488
- Richards et al. (2006) Richards, G. T., Lacy, M., Storrie-Lombardi, L. J., et al. 2006, ApJS, 166, 470
- Sanders et al. (1989) Sanders, D. B., Phinney, E. S., Neugebauer, G., Soifer, B. T., & Matthews, K. 1989, ApJ, 347, 29
- Schlafly & Finkbeiner (2011) Schlafly, E. F., & Finkbeiner, D. P. 2011, ApJ, 737, 103
- Schwarz (1978) Schwarz, G. 1978, Annals of Statistics, 6, 461
- Shakura & Sunyaev (1973) Shakura, N. I., & Sunyaev, R. A. 1973, A&A, 24, 337
- Shen & Ho (2014) Shen, Y., & Ho, L. C. 2014, Natur, 513, 210
- Simpson (2005) Simpson, C. 2005, MNRAS, 360, 565
- Skrutskie et al. (2003) Skrutskie, M. F., Cutri, R. M., Stiening, R., et al. 2003, 2MASS All-Sky Point Source Catalog, doi:10.26131/IRSA2
- Skrutskie et al. (2006) —. 2006, AJ, 131, 1163
- Soltan (1982) Soltan, A. 1982, MNRAS, 200, 115
- Son et al. (2022) Son, S., Kim, M., & Ho, L. C. 2022, ApJ, 927, 107
- Stalevski et al. (2016) Stalevski, M., Ricci, C., Ueda, Y., et al. 2016, MNRAS, 458, 2288
- Suganuma et al. (2006) Suganuma, M., Yoshii, Y., Kobayashi, Y., et al. 2006, ApJ, 639, 46
- Swain et al. (2003) Swain, M., Vasisht, G., Akeson, R., et al. 2003, ApJL, 596, L163
- Treister et al. (2008) Treister, E., Krolik, J. H., & Dullemond, C. 2008, ApJ, 679, 140
- Urry & Padovani (1995) Urry, C. M., & Padovani, P. 1995, PASP, 107, 803
- Venanzi et al. (2020) Venanzi, M., Hönig, S., & Williamson, D. 2020, ApJ, 900, 174
- Vestergaard & Peterson (2006) Vestergaard, M., & Peterson, B. M. 2006, ApJ, 641, 689
- Virtanen et al. (2020) Virtanen, P., Gommers, R., Oliphant, T. E., et al. 2020, Nature Methods, 17, 261
- Wada (2015) Wada, K. 2015, ApJ, 812, 82
- Wright et al. (2010) Wright, E. L., Eisenhardt, P. R. M., Mainzer, A. K., et al. 2010, AJ, 140, 1868
- Wright et al. (2019) —. 2019, AllWISE Source Catalog, doi:10.26131/IRSA1
- Zhao et al. (2021) Zhao, Y., Ho, L. C., Shangguan, J., et al. 2021, ApJ, 911, 94
- Zhuang et al. (2018) Zhuang, M.-Y., Ho, L. C., & Shangguan, J. 2018, ApJ, 862, 118
Appendix A Examples of Poor Fits
Here, we present representative examples of poor fits with a reduced -value greater than 50. Note that the sample with poor fits can be categorized into three categories. First, disagreement at the shorter wavelengths (e.g., band) is occasionally detected, revealing that the featureless continuum from the accretion disk is not perfectly modeled (Fig. A1). Second, some of the AGNs with poor fits exhibit substantial excess in the MIR, possibly due to the enhancement of the hot dust component or the contribution from cold dust, which is not adequately modeled with the current templates (Fig. A2). Finally, the poor fits with the largest reduced () are mostly driven by sources that are undetected in 2MASS. 2MASS provides upper limits for the nondetections, which results in significant disagreement between the observations and best-fit model (Fig. A3). It suggests that the upper limits given by 2MASS may be substantially underestimated. Note that, in the LePHARE code, model SEDs are not allowed to exceed the upper limits.