Dynamic Versus Static Oxidation of Nb/Al-AlOx/Nb Trilayer
Abstract
High quality Nb-based superconductor-insulator-superconductor (SIS) junctions with Al oxide (AlOx) tunnel barriers grown from Al overlayers are widely reported in the literature. However, the thin barriers required for high critical current density (Jc) junctions exhibit defects that result in significant subgap leakage current that is detrimental for many applications. High quality, high-Jc junctions can be realized with AlNx barriers, but control of Jc is more difficult than with AlOx. It is therefore of interest to study the growth of thin AlOx barriers with the ultimate goal of achieving high quality, high-Jc AlOx junctions. In this work, 100% O2 and 2% O2 in Ar gas mixtures are used both statically and dynamically to grow AlOx tunnel barriers over a large range of oxygen exposures. In situ ellipsometry is used for the first time to extensively measure AlOx tunnel barrier growth in real time, revealing a number of unexpected patterns. Finally, a set of test junction wafers was fabricated that exhibited the well-known dependence of Jc on oxygen exposure (E) in order to further validate the experimental setup.
Index Terms:
superconductor-insulator-superconductor (SIS), aluminum oxide, dynamic oxidation, static oxidation, ellipsometry, superconduting qubitsI Introduction
Nb/Al-AlOx/Nb trilayer superconductor-insulator-superconductor (SIS) tunnel junctions are widely-used in the applications such as single flux quantum (SFQ), quantum bits (qubits), and millimeter and sub-millimeter wave heterodyne mixers [1][2][3][4][5]. Device performance is highly dependent on (Jc) and junction quality (e.g., the degree of subgap leakage), which in turn depends on the detailed nature of the 1 nm-thick insulating AlOx barrier material. The barrier thickness is controlled by the oxygen exposure E = Poxtox, where Pox is the oxygen partial pressure and tox is the oxidation time. Reducing the AlOx thickness to realize junctions with higher Jc results in more tunnel barrier defects (e.g., pinholes or quantum point contacts), which increasingly dominates current transport, resulting in Multiple Andreev Reflections (MAR) in the superconducting state, indicating high quantum-mechanical transparency [6][7][8][9]. High quality high-Jc junctions can be realized with AlN barriers grown by plasma nitridation of Al overlayers [10][11][12][13]; however, AlOx barriers exhibit better control of Jc. Therefore, it is desirable to better understand how to realize thinner oxide barriers with fewer defects. Historically, the formation of Gurvitch-style trilayer junctions [14] relies on static (no pumping of the oxidation gas) thermal oxidation of thin Al overlayers in pure oxygen for tunnel barrier formation. The fabrication processes have been extensively reported, [15][16][17][18], including distinct low and high Jc growth regimes [19]. There are fewer reports on dynamic oxidation (active flow of the oxidation gas due to pumping) and/or the use of diluted O2. However, recent work by Tolpygo et al. [20][21] indicates that high quality Nb-based trilayers with higher current densities can be realized using dynamic oxidation with diluted O2 gas mxtures, and hence longer growth times, under proper chamber and Nb deposition conditions.
Our work investigated four barrier growth modes for the first time: Both static (unpumped) and dynamic (pumped) oxidation using both 100% O2 and diluted oxygen gas (2% O2 in Ar, the largest dilution the gas manufacturer could provide) over a range of pressures, all in a single oxidation chamber. In situ ellipsometry was used for the first time to measure and compare AlOx tunnel barrier growth in real time for these four oxidation modes. As it will be described in section III-A, all of the ellipsometer data shown in this paper were obtained on bilayers with thick Al (100 nm) on Si/SiO2 wafers. In section III-D, we discuss the connection between tunnel barrier thickness obtained using our ellipsometric technique with thick Al layers and the Jc regimes characteristic of trilayer junctions based on thin Al layers.
II Experimental Setup
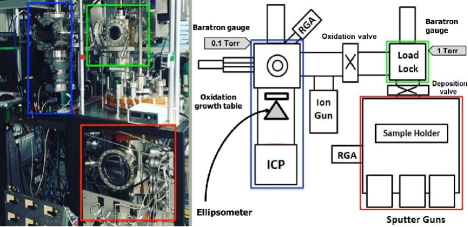
The University of Virginia (UVA) trilayer deposition system (Tri-3), modified for these experiments, is composed of three chambers separated by two gate valves as shown in Figure 1. Three individual turbo-molecular pumps are used to evacuate the load lock, main deposition chamber, and oxidation chamber (which is also used, in other experiments, for the nitridation of Al barriers). All three chambers are equipped with VAT vales. The load lock and oxidation chamber have MKS Baratron gauges with full scale pressure ranges of 1 Torr and 0.1 Torr, respectively. The system base pressure is monitored using a residual gas analyzer (RGA). It has been determined for the UVA trilayer system that the tunnel barrier growth process is not influenced (as measurable by ellipsometer) by background oxidation of the Al overlayer once the base pressure of system and the partial pressure of H2O reach below 10E-8 and 3E-9 Torr, respectively [22]. The oxidation chamber is outfitted with an A. J. A. Woollam Co. M-2000U® ellipsometer in order to record spectroscopic data, from 235-1000 nm at a fixed angle of 70∘, during tunnel barrier growth. The ellipsometer uses 470 individual charge-coupled device (CCD) detectors to capture all wavelengths simultaneously for real time spectroscopic ellipsometry (SE) analysis across the entire spectrum. The ellipsometry software Complete EASE (J. A. Woollam Co., Inc.) was used to fit experimental curves, therefore and no theoretical spectroscopy ellipsometry was studied, therefore the comparison of experimental data with fitted data is not applicable. With this software it is possible to select a physical model and fit with data acquired by means spectroscopic ellipsometry. For the data presented in this work an ellipsometric growth model, similar to that reported in [23] for Al-AlN tunnel barrier growth, was used to track the real-time oxide growth in situ. The optically thin Al overlaye was modeled using a sum of Lorentz and a single Drude Oscillator, the Al-oxide layer was modeled using a Cauchy-Urbach dispersion, and all optically thick Nb and Al films were modeled using pseudo optical constants obtained by directly inverting the ellipsometry equations from a single measurement. Small angular offsets from the substrate mounting can introduce appreciable measurement errors run-to-run. To correct for any angular offset in the system, the oxidized Si wafer was first measured before deposition and used as a calibration standard. More details of the UVA Tri-3 system can be found elsewhere [24].
For this work, in order to investigate the growth of AlOx tunnel barriers, all of the oxidation experiments were performed in the separate oxidation chamber. The system base pressure and H2O partial pressure for all the reported experiments were 7.7E-9 and 1.4E-9 (or lower), respectively. All experiments used 50.8 mm diameter, 450 m thick, double side polished Si substrates with 300 nm thermally grown SiO2. During oxidation, the wafer, which is heatsunk with Apiezon® L grease to a metal wafer holder block, is wedged into a tapered opening of the 17 ∘C water-cooled growth table where the growth can be monitored in situ by the ellipsometer. The ellipsometer’s light source module was aligned to just off the center of the wafer block during the initial system setup, and did not need to be further adjusted during this study. After positioning of the wafer-block on the oxidation growth table, and prior to introducing gas into the load lock and start of oxidation, the ellipsometer is triggered to start acquiring data where each data point was acquired at 4-second intervals and integrating measured results over the acquisition window. In the original setup, static oxidation of the AlOx tunnel barrier layer took place in the load lock. Therefore, the static oxidation line was connected to the load lock and consists of a 99.995% purity undiluted O2 source, a micrometer and a series of on-off valves to control the pressure. In order to conduct this new study’s diluted oxidation experiments, a second oxidation line (dynamic line) was added to the load lock. This line consists of a 2% O2 in Ar gas source and a mass flow controller. In both static and dynamic oxidation cases, the gate valve between the load lock and oxidation chamber in Figure 1, called ‘oxidation valve’, is left open and the gate valve between the load lock and main deposition chamber (called ‘deposition valve’) is left close.
In the case of static oxidation after growing Nb/Al (or just Al) layers on a Si/SiO2 substrate in the main chamber, the wafer is transferred to the growth table in the oxidation chamber without breaking the vacuum. Prior to introducing oxygen gas to the system, both the load lock and oxidation chamber VAT valves are closed. For dynamic oxidation, the load lock VAT valve is closed and the oxidation gas pressure is controlled by adjusting the oxidation chamber VAT valve. For gas pressures below and above 90 mTorr, the 0.1 Torr oxidation chamber Baratron and the 1 Torr load lock pressure gauges are used, respectively. To achieve the desired working gas pressure in the dynamic oxidation setup for pressures below 90 mTorr, the oxidation chamber VAT valve position is adjusted automatically with feedback from the 0.1 Torr sensor, but for pressures above 90 mTorr, the VAT valve is adjusted manually.The oxidation gas flow is set at 28 sccm in both cases. After completing the oxidation and turning off the gas flow in both growth modes, in order to quickly evacuate the chambers of oxygen, both the load lock and oxidation VAT valves are opened.
III Results and discussion
III-A Initial Study-AlOx Thickness Repeatability
In theory, the critical current density of a tunnel junction is exponentially dependent on the tunnel barrier thickness. Therefore, our experiments require a high degree of reproducibility in the ellipsometric measurement of barrier thickness. In an initial exploratory study, the repeatability of the ellipsometerically-measured AlOx growth was assessed. Similar to the approach UVA uses for realizing trilayers for SIS junctions, after a “modest” ion gun clean to remove 10 nm of SiO2 from the wafer surface, 165 nm of Nb and 5 nm Al overlayer were sputter deposited onto the wafer. Films were exposed to undiluted and diluted oxygen under both dynamic and static thermal oxidation settings for 8100 seconds and the thickness profile of each oxidation process was recorded in situ by the ellipsometer with a 25 m by 60 m spot size from just off the center of wafer. The optical constants of Al overlayer film were modeled using a sum of four Lorentz and a single Drude oscillators [23].
A typical plot of thickness versus time shows an initial period of rapid growth followed by a slower, decreasing growth rate. Thickness plots obtained through the ellipsometric model for this Nb/Al (7 nm) material stack reveals a thickness variation of 0.04 nm after the initial rapid growth regime. This variation in oxide thickness is significant when considered in terms of critical current density. The measured variation is believed to be due primarily to our ellipsometric growth model having to take both the thin Al overlayer and underlying Nb thickness into account before and during the growth. Therefore, we changed to the use of an optically opaque Al layer (100 nm thick) with the AlOx film growth modeled using Cauchy and Urbach dispersion for the real and imaginary parts of the refractive index, respectively. The growth experiments were repeated with the same oxidation conditions on the 100 nm layer of aluminum deposited directly on Si/SiO2 wafers, yielding a significantly more repeatable measured growth rate with only 5 pm run to run scatter. Henceforth, unless otherwise specified, the ellipsometric data reported in this study are based on samples with 100 nm of aluminum layer. While small local atomic variations in barrier thickness are expected across the oxidation front, it is evident that the 1500 sampling area effectively averages these local variations in barrier thickness. Given the very small 5 pm run to run thickness scatter, it is found that this ellipsometer measured average thickness is repeatable wafer to wafer for the same oxidation conditions. Since our measured ellipsometer thickness is very repeatable from run to run, if the Al-oxide layer is uniform and of high quality, it seems reasonable to hope that this thickness should also be a good predictor of Jc.
III-B Dynamic vs Static AlOx Growth
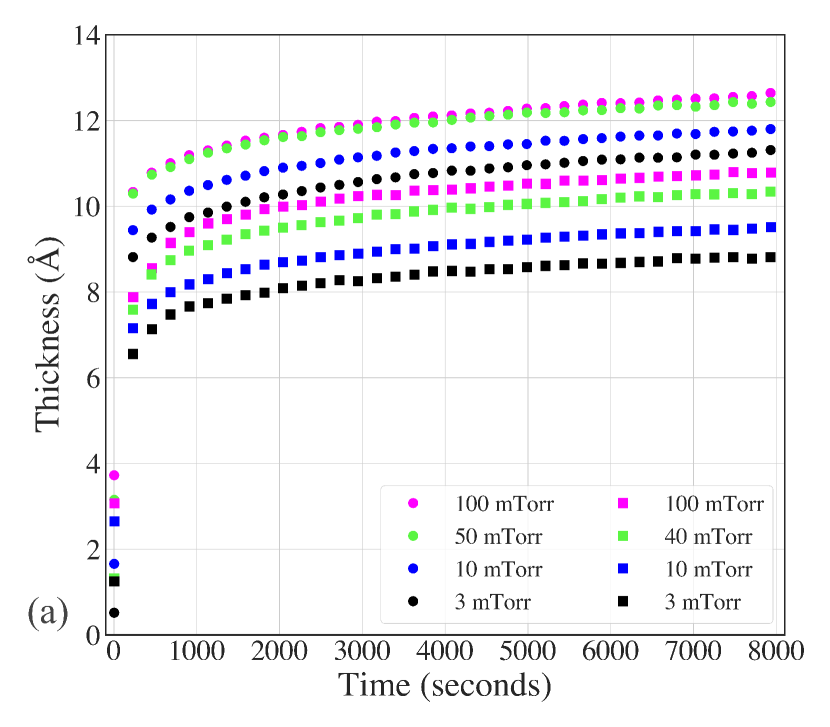
We first studied ellipsometric growth data at room temperature (RT), for several pressures in the 3-100 mTorr range, versus time. We compared statically grown AlOx in 100% O2, the most commonly-used mode of trilyer growth, with dynamically grown AlOx in 2% O2 because diluted O2 is commonly used for high-Jc junctions. The results are shown in Figure 2a. As expected, the oxide growth rate increases with increasing oxygen pressure in both cases. For a given pressure, the growth rate is much larger in the undiluted case. One would expect that, in order to achieve a given oxide thickness in a particular time, the O2 partial pressure would have to be 50 times higher in the diluted case (to achieve the same effective oxygen dose). Indeed, the 100 mTorr 2% O2 (2 mTorr O2 partial pressure) data in Figure 2a lie close to the 3 mTorr 100% O2 data (3 mTorr partial pressure).
The growth kinetics of oxides are described by Fromhold and Cook [25] based on the Mott-Cabrera [26] theory in which two regimes are defined for oxide thickness (L) as a function of time (t). This theory predicts that an initial thin layer of oxide film growth for which oxidation is extremely rapid. This behavior results from electrons tunnelling through the thin oxide (electron current is large), leading to the formation of an electronic potential on the film surface (the Mott potential). The oxide thickness in this first stage of growth is described by L(t) t1/2 (the Mott-Cabrera equation). In the second regime, oxide growth is limited by electron tunneling current through the thicker oxide without a potential on the surface of film. Growth in this stage is slow and logarithmic, described by L(t)/log(t) [26]. These two regimes are observed in our data as well as that of other groups [27][28]. A sharp jump of AlOx thickness with initial flux of oxygen to the chamber is followed by a slower and decreasing oxide growth rate.
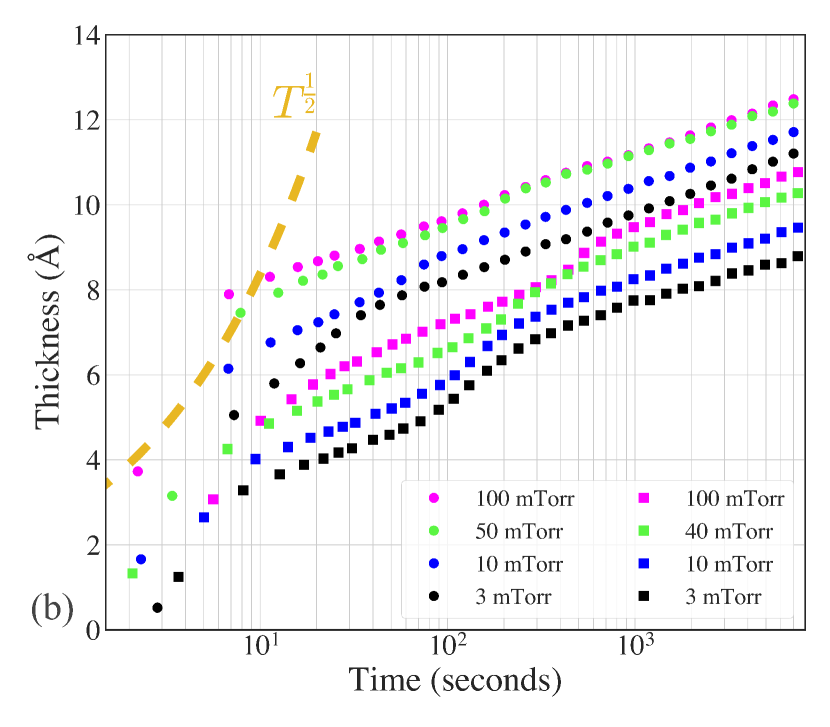
To further consider these data, we expanded and re-plotted the Figure 2a data on a logarithmic time scale as shown in Figure 2b. The sudden initial increase of thickness to several angstroms for all the curves presumably occurs in the first Mott regime where oxide forms on the metal surface through electron tunneling. The growth rate for times longer than 10 seconds is significantly less than the first stage growth and the growth curves become linear on this log(t) plot for considerably longer growth times. Note that for all growths, the first logged ellipsometer data point does not correspond exactly to the moment that oxidation gas starts to flow. As described above, the ellipsometer is manually started before the introduction of the oxidation gas, and the ellipsometer takes data every 4-5 seconds. In order to plot the data, we have taken the last ellipsometer data point with no growth as t = 0. The result is a small inaccuracy due to the time shift of the Figure 2b curves. This error is of little consequence beyond 10-20 seconds. A fit of the Mott theory to the first three data points of the 100 mTorr static data is also shown, further illustrating the expected form of initial growth.
It is interesting to note that all of the oxidation curves in Figure 2b exhibit what may be a third regime of growth, a modest, gradual step well above the initial 10 seconds of growth but below the eventual steady-state linear regime, which corresponds to much longer growth times. For example, the 100 mTorr dynamic data has such a step around 8-8.5 Å, while the 10 mTorr dynamic data has a step around 6-7 Å. Similar step features were also found for growth samples using Nb/Al ( 7 nm) layers. In fact, Lindmark et al. [27] reported a similar step in one of their data traces, but offered that it might have been due to a pressure fluctuation during growth. However, closer examination of their data reveals modest steps in more of their traces. It can be seen, within each of the two sets of our curves, (i) the inflection step occurs earlier the lower the pressure (and hence, lower exposure), and (ii) the step is wider in time and larger in height the lower the pressure used. Yet, for example, in comparing these two sets of curves, the step for the 100 mTorr undiluted static curve occurs before the 100 mTorr diluted O2 dynamic curve, even though this static curve has a much larger exposure for a given time. This suggests that these two growth modes may have different underlying growth mechanics.
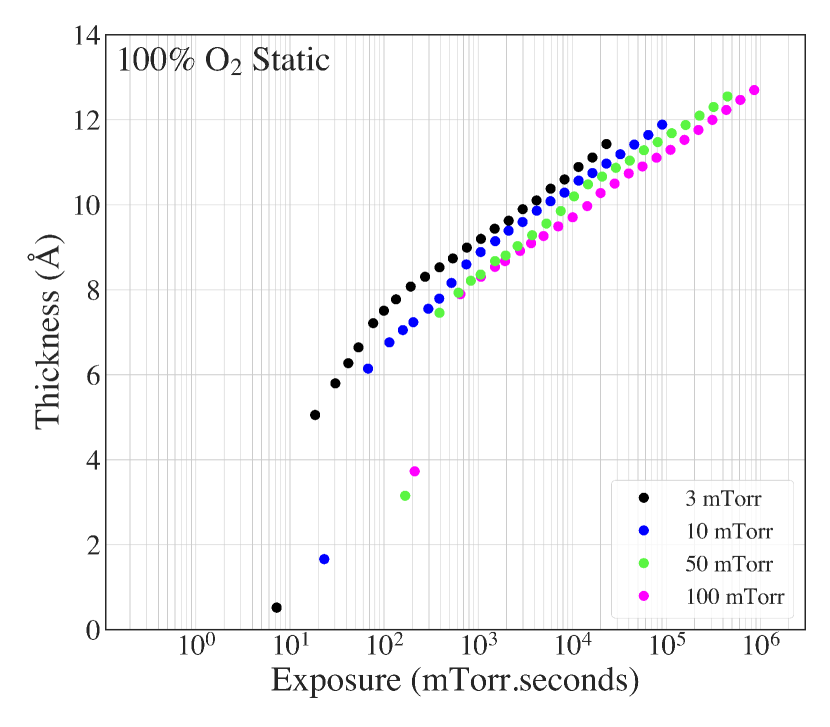
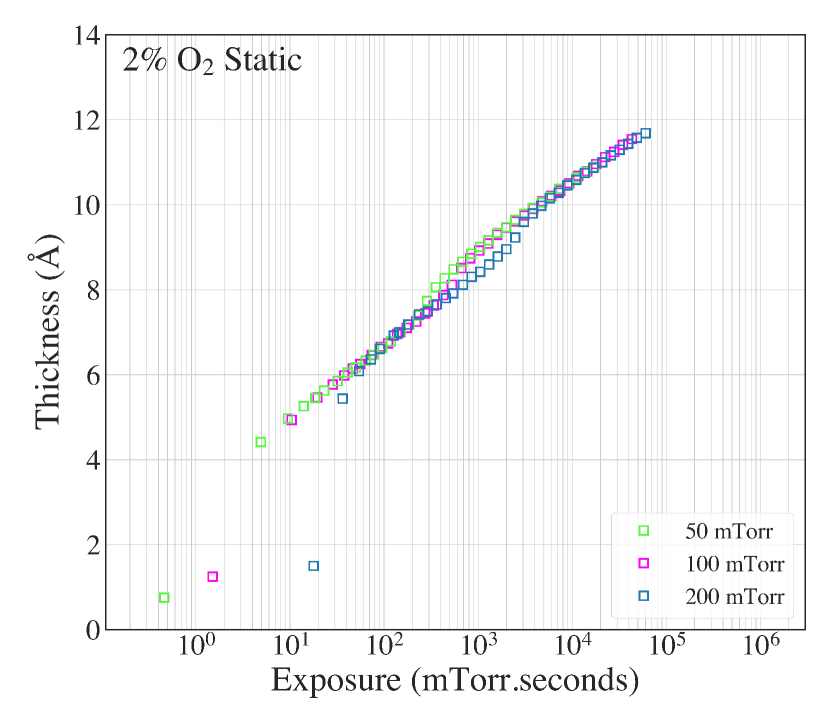
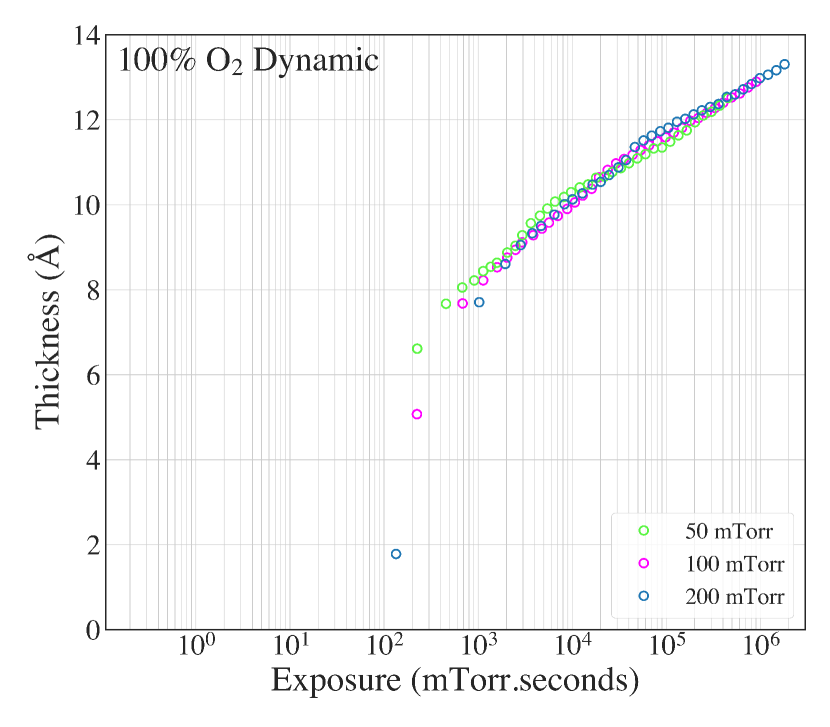
It is well known that the Jc of SIS junctions depends monotonically on oxygen exposure, E. In fact, until recently, the literature was consistent with Jc depending only on E (for a given temperature and no other reactive gases in the chamber). To explore the limits of this correlation, we examined oxide thickness as a function of oxygen exposure for all four growth modes. The results are shown in Figure 3. Since Jc depends exponentially on AlOx thickness, we expect the E-dependence of the oxide thickness (on a linear scale) to resemble the Jc dependence of Nb/Al-AlOx/Nb tunnel junctions (on a log scale). The middle step feature is exhibited in all four sub-figures of Figure 3, although the steps for undiluted dynamic growth are less pronounced (they are clearly visible if when the data are blown up). For low to medium exposure values in all four growth modes, distinct thickness traces are found. In addition, The growth curves for the diluted dynamic, undiluted dynamic, and diluted static growth modes, but not undiluted static mode, collapse into a single dependence.
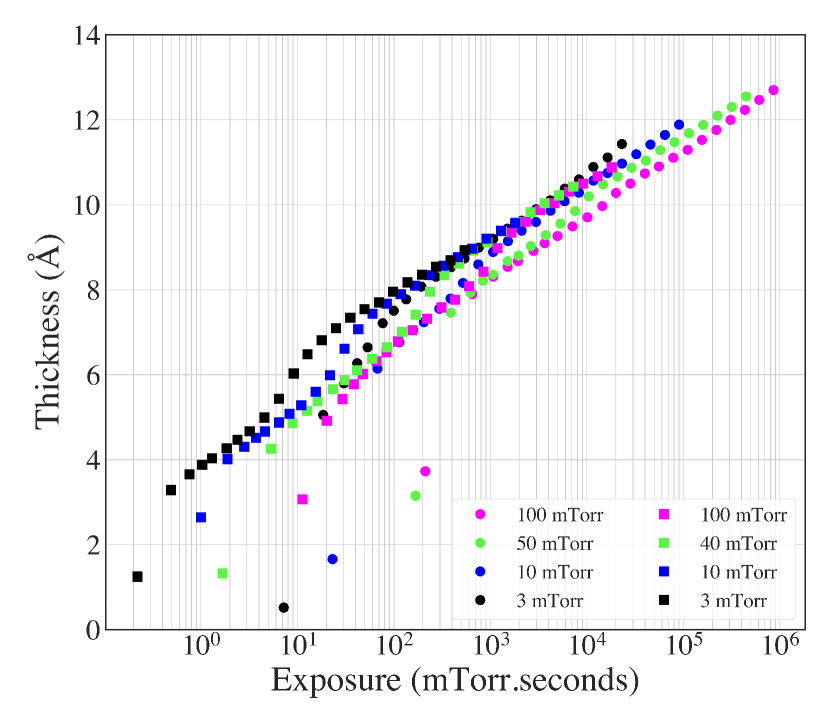
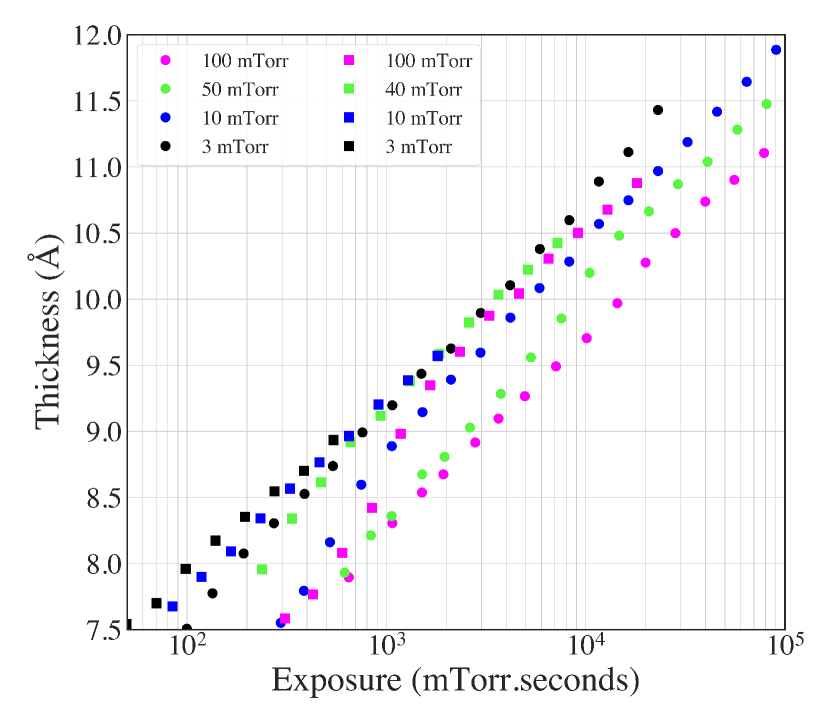
Figure 4a compares the behavior of the E-dependence of AlOx thickness for two growth modes: diluted dynamic growth, represented by solid squares and undiluted static growth, represented by solid circles in different colors. For low exposures, distinct thickness traces for each pressure can also be seen for both undiluted static and diluted dynamic growth. In this low exposure regime, oxide thickness is highly dependent on exposure for different pressures. This result was not expected. It could reflect the initial Mott-Cabrera mode of growth or an initial non-ideal oxide growth. In this low exposure regime, for a given growth mode and E, a lower pressure results in a thicker aluminum oxide. Additionally, in the low E regime and for the same E and pressure, dynamic oxide thickness is significantly larger than static oxide thickness. This might be an indication of more complete incorporation of oxygen in the Al at low E for the diluted growth because the oxidation is occurring more slowly. In this scenario, for higher E, and hence longer growth time, the affected Al layer has the opportunity to be oxidized more completely and all traces should tend to converge. Yet as shown in Figure 3b, this argument does not hold for undiluted static growth. In Figure 4b, an expanded view of Figure 4a, the full coalescing of the diluted dynamic traces is clearly seen, in contrast to the case of undiluted static growth. The contrast in the behavior of undiluted static growth as high E is striking where each pressure trace follows a different growth path, even for high exposure. For high exposures, the 10 mTorr undiluted static growth trace coincidentally falls on the coalesced data line for the other growth modes. However, for large E at an even lower pressure of 3 mTorr, the undiluted static growth curve yields a thicker oxide layer than the coalesced trace. Clearly, for a given pressure, undiluted growth occurs faster than diluted growth. However, it is not clear why the undiluted static growth mode gives such different results from the other growth modes.
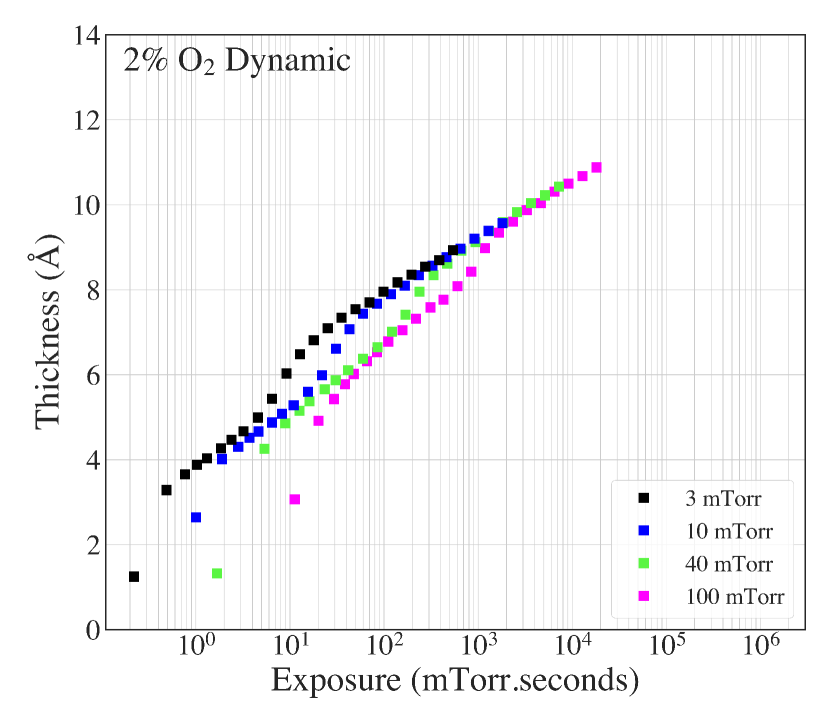
III-C Static vs Dynamic Growth in 2% O2
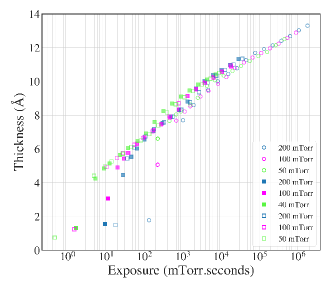
To further analyze growth in diluted oxygen, Al films were oxidized statically and dynamically at working pressures ranging from 40 mTorr to 200 mTorr. Ellipsometric data of these two experiments, along with the data of dynamically grown AlOx in undiluted oxygen are shown in Figure 5 (undiluted, static is not included). For high enough E, all traces coalesce to a single trace in the high O2 exposure regime. Moreover, as we found in Figure 2b for the low pessure regime, within each growth set for the same E, the lower the pressure the greater the oxide thickness.
III-D Jc(E) Regimes
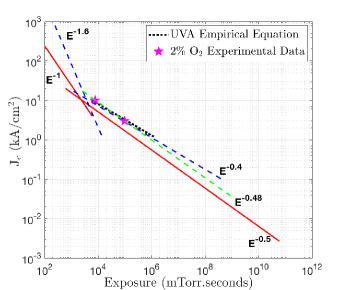
The second goal of our study was to examine the dependence of Jc for Nb/Al-AlOx/Nb tunnel junctions on E for both diluted and undiluted, and both dynamic and static, oxidation conditions and to compare the results with our thickness studies. The UVA SIS junction fabrication process has been extensively described elsewhere [29][30]. For any particular pressure and oxidation time, the AlOx thickness is unlikely to be precisely the same for growth on thick and thin Al. However, we make this assumption in order to choose reasonable parameters for initial diluted dynamic growth conditions. We first examined the well-established and characterized trilayer growth conditions from our previous work on 100% O2 static oxidation and chose two exposure values that corresponded to 4 and 7 . Next, the two corresponding oxide thicknesses were identified from our new ellipsometer results for undiluted static growth on thick Al. Finally, using the diluted dynamic ellipsometer data for thick Al, growth curves were chosen for these thickness values with relatively long growth times: 8180 seconds at 400 mTorr and 9450 seconds at 40 mTorr. We also ensured that the identified growth conditions were beyond the step of the second oxidation regime. For both of these conditions, we fabricated wafers and determined Jc. For this work, we calculated Jc by dividing IcRn = 1.8 mV (the typical 4.2 K value from our prior work) by RnA, where Rn is the junction resistance (the ratio of junction V and I at 5 mV) and A is the junction area. The resulting Jc values were 3 and 10.7 , respectively. These two experimental results are shown in the Figure 6, a log-log plot of Jc versus E.
The established UVA empirical AlOx formula for undiluted static growth with Jc in the range of 1 to 7 , is shown by a black dotted line of the form of Jc E-α, with = 0.4. The best fit for the early new UVA experimental data is shown as a green dashed line with = 0.48 in this low Jc regime. For reference, the dashed blue lines show the Kleinsasser et al.’s trend lines, based on averaged data of many groups, where , for low and high Jc regions (predominantly undiluted, static oxidations), is 0.4 and 1.6, respectively [17][18][19]. The red solid lines display the trends from the recent work of Tolpygo et al.’s, where for the high Jc region with diluted dynamic growth is 1.0 and for the undiluted static growth is 0.521 [21]. We note that our initial Jc versus exposure data for diluted dynamic as well as our previous undiluted static results appear reasonable for the low Jc regime. More fabrication runs will be needed in order to fully examine the behaviour of Jc dependencies for the UVA system at a variety of pressure and growth conditions.
IV Conclusion
In this work, we have studied AlOx growth with diluted (2% O2 in Ar) and undiluted (100% O2) oxygen under both dynamic and static oxidation processes using an in situ spectroscopic ellipsometry. Several interesting features were noted:
(i) For low to mid exposure values in all four growth modes, distinct thickness traces are found for each pressure, and therefore no simple correlation between oxide growth and exposure.
(ii) In addition to the expected two ‘standard’ regimes of growth, all traces exhibit a possible third growth regime appearing as an intermediate gradual step. For a given growth approach (e.g., diluted and dynamic) the step occurs earlier in time the lower the pressure (i.e., the lower the exposure). For a given growth approach, the step is also wider and taller the lower the pressure (i.e., the lower the exposure). However, comparing different growth approaches for a given pressure, the steps occur at different E values depending on the growth mode. For example, the undiluted static step occurs at higher E than the diluted dynamic step. This suggests that these growth modes may have different underlying growth mechanics.
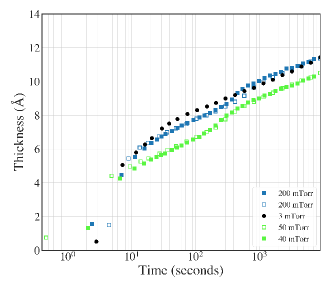
(iii) The growth curves for three of the growth modes (namely: diluted dynamic, undiluted dynamic, and diluted static) when plotted versus E on a log scale coalesce to essentially one growth trace at sufficiently high exposure. Individual growth traces for a given growth mode join the coalesce-line at lower exposure the lower the growth pressure (hence the longer the growth time for that growth mode). Choosing a 50 mTorr growth pressure for comparison, the undiluted dynamic trace joins the coalesce-line at 8000 mTorr-sec, while both the diluted static and diluted dynamic growth modes join the coalesce-line at 1000 mTorr-sec. Therefore, for a given pressure, the individual growth traces join the coalesce-line at lower E the slower the growth time, independent of the which of three growth modes is studied. One might therefore be tempted to conclude that there is fundamentally little difference between dynamic and static growth, with dilution perhaps perceived playing the most important role in the growth time. However, the behavior of the undiluted static growth mode is quite different, with the growth curves for each pressure following a distinct trace, even at high E. For undiluted static growth, the thickness is found to depend not only on exposure but also on pressure with, for the same E, thicker oxide layer growth at lower pressures (and hence longer growth time). It is also interesting to compare the undiluted static growth rate plotted versus t on a log scale for the lowest pressure against other growth mode traces at higher pressures, as is shown in Figure 7. The 3 mTorr undiluted static growth rate is comparable to the 200 mTorr diluted growth rates, yet from Figure 4b, the 3 mTorr static curve does not follow the coalesce-line, indicating that growth rate alone does not determine that a growth trace will join the coalesced curve. It is also interesting to note, for a given pressure, the growth rates for the diluted static and diluted dynamic are comparable. The data therefore suggests that (a) the undiluted static growth mode is strikingly different from the other three modes, and (b) both dilution and static versus dynamic choices play important roles in the oxide growth, along with the oxidation pressure. Test wafers with Al-oxide tunnel barriers grown in low-Jc regime using the diluted dynamic oxidation method produced Jc versus exposure curves that were in close agreement with our previous and longstanding undiluted static trilayer growth method. Additional work is needed to characterize a wider range of pressure and oxygen exposure modes.
V Acknowledgments
This work was supported by the National Radio Astronomy Observatory. The National Radio Astronomy Observatory is a facility of the National Science Foundation operated under cooperative agreement by Associated Universities, Inc. The research at the Jet Propulsion Laboratory, California Institute of Technology, was carried out under a contract with the National Aeronautics and Space Administration (80NM0018D0004). The authors have no conflicts to disclose.
References
- [1] S. K. Tolpygo, V. Bolkhovsky, T. J. Weir, L. M. Johnson, M. A. Gouker, and W. D. Oliver, “Fabrication Process and Properties of Fully-Planarized Deep-Submicron Nb/Al-AlOx/Nb Josephson Junctions for VLSI Circuits,” IEEE transactions on Applied Superconductivity, vol. 25, no. 3, pp. 1–12, 2014.
- [2] E. Ilichev, T. Wagner, L. Fritzsch, J. Kunert, V. Schultze, T. May, H. Hoenig, H. Meyer, M. Grajcar, D. Born et al., “Characterization of Superconducting Structures Designed for Qubit Realizations,” Applied physics letters, vol. 80, no. 22, pp. 4184–4186, 2002.
- [3] J. Meckbach, M. Merker, S. Buehler, K. Ilin, B. Neumeier, U. Kienzle, E. Goldobin, R. Kleiner, D. Koelle, and M. Siegel, “Sub-m Josephson Junctions for Superconducting Quantum Devices,” IEEE transactions on applied superconductivity, vol. 23, no. 3, pp. 1 100 504–1 100 504, 2012.
- [4] A. Lichtenberger, C. McClay, R. Mattauch, M. Feldman, S. Pan, and A. Kerr, “Fabrication of Nb/Al-Al/Nb Junctions with Extremely Low Leakage Currents,” IEEE Transactions on Magnetics, vol. 25, no. 2, pp. 1247–1250, 1989.
- [5] A. R. Kerr, S.-K. Pan, S. M. Claude, P. Dindo, A. W. Lichtenberger, J. E. Effland, and E. F. Lauria, “Development of the ALMA Band-3 and Band-6 Sideband-separating SIS Mixers,” IEEE Transactions on Terahertz Science and Technology, vol. 4, no. 2, pp. 201–212, 2014.
- [6] A. Kleinsasser, R. Miller, W. Mallison, and G. Arnold, “Observation of Multiple Andreev Reflections in Superconducting Tunnel Junctions,” Physical review letters, vol. 72, no. 11, p. 1738, 1994.
- [7] A. Kleinsasser, F. Rammo, and M. Bhushan, “Degradation of Superconducting Tunnel Junction Characteristics with Increasing Barrier Transparency,” Applied physics letters, vol. 62, no. 9, pp. 1017–1019, 1993.
- [8] T. Klapwijk, G. Blonder, and M. Tinkham, “Explanation of Subharmonic Energy Gap Structure in Superconducting Contacts,” Physica B+ C, vol. 109, pp. 1657–1664, 1982.
- [9] G. B. Arnold, “Superconducting Tunneling without the Tunneling Hamiltonian. II. Subgap Harmonic Structure,” Journal of low temperature physics, vol. 68, no. 1-2, pp. 1–27, 1987.
- [10] T. Farrahi, M. Cyberey, M. B. Eller, J. Z. Zhang, J. Wang, R. M. Weikle, and A. W. Lichtenberger, “Optical Spectroscopic Study of AlN-Based SIS Devices Grown by Inductively Coupled Plasma,” IEEE Transactions on Applied Superconductivity, vol. 29, no. 5, pp. 1–5, 2019.
- [11] M. Cyberey, T. Farrahi, J. Lu, A. Kerr, R. M. Weikle, and A. W. Lichtenberger, “Nbtin/aln/nbtin sis junctions realized by reactive bias target ion beam deposition,” IEEE Transactions on Applied Superconductivity, vol. 29, no. 6, pp. 1–6, 2018.
- [12] M. E. Cyberey, D. Oakland, J. Z. Zhang, A. R. Kerr, S.-K. Pan, and A. W. Lichtenberger, “Optical spectroscopic analysis of icp nitridation for sis junctions with aln barriers,” IEEE Transactions on Applied Superconductivity, vol. 25, no. 3, pp. 1–5, 2015.
- [13] T. W. Cecil, A. W. Lichtenberger, and A. R. Kerr, “Formation of High Quality AlN Tunnel Barriers via an Inductively Couple Plasma,” 2008, pp. 425–431.
- [14] M. Gurvitch, M. Washington, H. Huggins, and J. Rowell, “Preparation and Properties of Nb Josephson Junctions with Thin Al Layers,” IEEE Transactions on Magnetics, vol. 19, no. 3, pp. 791–794, 1983.
- [15] A. Kerr, S. Pan, E. Lauria, A. Lichtenberger, J. Zhang, M. Pospieszalski, N. Horner, G. Ediss, J. Effland, and R. Groves, “The ALMA Band 6 (211–275 GHz) Sideband-Separating SIS Mixer-Preamplifier,” in Proc. 15th Int. Symp. on Space THz Tech, 2004, pp. 55–61.
- [16] A. Lichtenberger, D. Lea, C. Li, F. Lloyd, M. Feldman, R. Mattauch, S.-K. Pan, and A. Kerr, “Fabrication of Micron size Nb/Al-Al/Nb Junctions with a Trilevel Resist Liftoff Process,” IEEE transactions on magnetics, vol. 27, no. 2, pp. 3168–3171, 1991.
- [17] R. Miller, W. Mallison, A. Kleinsasser, K. Delin, and E. Macedo, “Niobium Trilayer Josephson Tunnel Junctions with Ultrahigh Critical Current Densities,” Applied physics letters, vol. 63, no. 10, pp. 1423–1425, 1993.
- [18] W. Mallison, R. Miller, and A. Kleinsasser, “Effect of Growth Conditions on the Electrical Properties of Nb/Al-oxide/Nb Tunnel Junctions,” IEEE Transactions on Applied Superconductivity, vol. 5, no. 2, pp. 2330–2333, 1995.
- [19] A. W. Kleinsasser, R. E. Miller, and W. H. Mallison, “Dependence of Critical Current Density on Oxygen Exposure in Nb-AlOx-Nb Tunnel Junctions,” IEEE transactions on applied superconductivity, vol. 5, no. 1, pp. 26–30, 1995.
- [20] S. K. Tolpygo, D. Amparo, R. Hunt, J. Vivalda, and D. Yohannes, “Subgap leakage in Nb/Al/Nb Josephson Junctions and Run-to-Run Reproducibility: Effects of Oxidation Chamber and Film Stress,” IEEE transactions on applied superconductivity, vol. 23, no. 3, pp. 1 100 305–1 100 305, 2012.
- [21] S. K. Tolpygo, V. Bolkhovsky, S. Zarr, T. Weir, A. Wynn, A. L. Day, L. Johnson, and M. Gouker, “Properties of Unshunted and Resistively Shunted Nb/AlOx-Al/Nb Josephson Junctions with Critical Current Densities from 0.1 to 1 mA/m2,” IEEE Transactions on Applied Superconductivity, vol. 27, no. 4, pp. 1–15, 2017.
- [22] M. Cyberey, “Investigation of Material Growth and Fabrication Processes for THz Frequency SIS Mixers,” in PhD Dissertation, 2014.
- [23] M. E. Cyberey and A. W. Lichtenberger, “In Situ Spectroscopic Ellipsometry of SIS Barrier Formation,” in 2014 39th International Conference on Infrared, Millimeter, and Terahertz waves (IRMMW-THz). IEEE, 2014, pp. 1–2.
- [24] T. Farrahi, “Development of advanced technologies for high frequency radio astronomy detectors,” Ph.D. dissertation, University of Virginia, Jan. 2019.
- [25] A. Fromhold Jr and E. L. Cook, “Kinetics of Oxide Film Growth on Metal Crystals: Thermal Electron Emission and Ionic Diffusion,” Physical Review, vol. 163, no. 3, p. 650, 1967.
- [26] N. Cabrera and N. F. Mott, “Theory of the Oxidation of Metals,” Reports on progress in physics, vol. 12, no. 1, pp. 163–184, 1949.
- [27] E. K. Lindmark, J. J. Nowak, and M. T. Kief, “In-situ Ellipsometric Measurements of Thin Film Aluminum Oxidation,” in Optical Metrology Roadmap for the Semiconductor, Optical, and Data Storage Industries, vol. 4099. International Society for Optics and Photonics, 2000, pp. 218–227.
- [28] J. Vrba and S. Woods, “Glow-discharge Oxidation of Freshly Evaporated Aluminum Films,” Canadian Journal of Physics, vol. 50, no. 6, pp. 548–552, 1972.
- [29] R. B. Bass, L. T. Lichtenberger, and A. W. Lichtenberger, “Effects of Substrate Preparation on the Stress of Nb Thin Films,” IEEE transactions on applied superconductivity, vol. 13, no. 2, pp. 3298–3300, 2003.
- [30] “Pentalevel Resist Process for the Precise Fabrication of Small Area SIS Junctions,” IEEE transactions on applied superconductivity, vol. 19, no. 3, pp. 222–225, 2009.