CO survey of high-z radio galaxies, revisited with ALMA: Jet-cloud Alignments and Synchrotron Brightening by Molecular Gas in the Circumgalactic Environment
Abstract
Powerful radio sources associated with super-massive black holes are among the most luminous objects in the Universe, and are frequently recognized both as cosmological probes and active constituents in the evolution of galaxies. We present alignments between radio jets and cold molecular gas in the environment of distant radio galaxies, and show that the brightness of the radio synchrotron source can be enhanced by its interplay with the molecular gas. Our work is based on CO observations with the Atacama Large Millimeter/submillimeter Array (ALMA) of three radio galaxies with redshifts in the range 1.4 2.1, namely MRC 0114-211 ( = 1.41), MRC 0156-252 ( = 2.02), and MRC 2048-272 ( = 2.05). These ALMA observations support previous work that found molecular gas out to 50 kpc in the circumgalactic environment, based on a CO(1-0) survey performed with the Australia Telescope Compact Array (ATCA). The CO emission is found along the radio axes but beyond the main radio lobes. When compared to a large sample of high- radio galaxies from the literature, we find that the presence of this cold molecular medium correlates with an increased flux-density ratio of the main vs. counter lobe. This suggest that the radio lobe brightens when encountering cold molecular gas in the environment. While part of the molecular gas is likely related to the interstellar medium (ISM) from either the host or a companion galaxy, a significant fraction of the molecular gas in these systems shows very low excitation, with r2-1/1-0 and r3-2/1-0 values 0.2. This could be part of the circumgalactic medium (CGM).
1 Introduction
High- radio galaxies are among the most massive and active systems in the Early Universe (Miley & De Breuck, 2008). They are key objects for better understanding a range of astrophysical phenomena, from black-hole activity to galaxy and cluster formation (e.g., Vernet et al., 2001; Pentericci et al., 2001; Smail et al., 2003; Stevens et al., 2003; Kurk, 2003; Rocca-Volmerange et al., 2004; Overzier, 2006; Kodama et al., 2007; Seymour et al., 2007; Villar-Martín et al., 2007a; De Breuck et al., 2010; Barthel et al., 2012; Galametz et al., 2012; Wylezalek et al., 2013; Dannerbauer et al., 2014; Falkendal et al., 2019). High- radio galaxies at 1 are typically defined as having a radio luminosity at 500 MHz in the restframe of W Hz-1 (Miley & De Breuck, 2008). Their bright radio sources originate from the accretion-disk region around a supermassive black hole, where biconical magnetic fields accelerate charged particles that emit synchrotron radiation (see reviews by Miley 1980 and Blandford 2001). This process creates radio jets and lobes, which can propagate well beyond the host galaxy and are often hundreds of kpc in size (e.g., Carilli et al., 1997; Pentericci et al., 2000; Barthel et al., 2000).
Because their bright radio continuum is easily detectable, high- radio galaxies have long acted as beacons for tracing distant galaxies (e.g., Roettgering et al., 1994, 1997; De Breuck et al., 2000; Saxena et al., 2018; Broderick et al., 2022). Therefore, high- radio galaxies were among the first laboratories for studying galaxy formation in the Early Universe (e.g., Spinrad et al., 1981; McCarthy et al., 1987a, 1990; Chambers et al., 1990). Deep follow-up optical and infra-red imaging and spectroscopy showed that their hosts are massive galaxies at redshifts of 25 (see review by McCarthy 1993; also Djorgovski et al., 1988; Lehnert et al., 1992; McCarthy et al., 1995; Chambers et al., 1996a, b; Stern et al., 1999; De Breuck et al., 2001). In addition to being beacons for tracing distant galaxies, the powerful high- radio sources also play a key role in the formation and evolution of galaxies and galaxy clusters, for example by driving massive outflows of gas (Nesvadba et al., 2017). Intriguing ‘alignment effects’ have also been observed between the radio jets and various constituents of the radio host galaxy (Miley & De Breuck, 2008). This includes alignments with the ultra-violet (UV) rest-frame continuum and submillimeter emission, which has been interpreted as jet-triggered star formation (Chambers et al., 1987; McCarthy et al., 1987b; Begelman & Cioffi, 1989; De Young, 1989; Rees, 1989; Pentericci et al., 1999; Bicknell et al., 2000; Stevens et al., 2003; Ivison et al., 2012).
High- radio galaxies were also among the first objects observed to contain a rich circumgalactic medium (CGM), primarily detected in the form of giant Ly nebulae of ionized gas (McCarthy et al., 1987a; Chambers et al., 1990; Heckman et al., 1991; van Ojik et al., 1996; Villar-Martín et al., 2002, 2003, 2006, 2007b; Reuland et al., 2003, 2007; Miley et al., 2006; Humphrey et al., 2008; Swinbank et al., 2015; Vernet et al., 2017; Falkendal et al., 2021). These Ly nebulae often show kinematically perturbed gas along the radio axis, with more quiescent gaseous halos detected beyond the extent of radio source (Villar-Martín et al., 2003; Humphrey et al., 2006). Ionized gas nebulae associated with high- radio galaxies are also seen in H and are often enriched with heavy elements across tens of kpc (e.g., McCarthy et al., 1992; Carson et al., 2001; Kurk et al., 2002; Villar-Martín et al., 2003; Swinbank et al., 2015; Nesvadba et al., 2017; Falkendal et al., 2021). In some cases, cold molecular gas is found in the halo environment of high- radio galaxies (Klamer et al., 2004, 2005; Ivison et al., 2012; Emonts et al., 2014, 2015a, 2016; Gullberg et al., 2016a; Falkendal et al., 2021; Li et al., 2021; Wang et al., 2021; De Breuck et al., 2022).
Klamer et al. (2004) discovered that CO emission from cold molecular gas is often offset from the host galaxy and preferentially aligned along the radio axis. Other studies showed similar alignments between the radio source and cold molecular halo gas, including radio-loud quasars at 0.3 (Aravena et al., 2011; Papadopoulos et al., 2008; Elbaz et al., 2009) and 2.2 (Li et al., 2021), as well as the radio galaxies TXS 0828+193 at 2.6 (Nesvadba et al., 2009; Fogasy et al., 2021) and TN J0924-2201 at 5.2 (Lee et al., 2023). This alignment effect was also revealed by a CO(1-0) survey performed with the Australia Telescope Compact Array (ATCA) (Emonts et al., 2014, hereafter Paper I).
The ATCA survey from Paper I utilized the ultra-compact array configurations of the ATCA to obtain exquisite surface-brightness sensitivity for detecting CO(1-0) emission on scales of tens of kpc in a representative sample of high- radio galaxies from the flux-limited 408 MHz Molonglo Reference (MRC) Catalogue (Large et al., 1981). This ATCA survey revealed that five out of 13 high- radio galaxies in the sample (38) contain detectable amounts of CO(1-0) in the halo environment, preferentially aligned along the radio axis. One of these systems, MRC 0152-209 (Dragonfly galaxy), was observed with ALMA at high resolution in CO(6-5), which revealed that the radio jet aligns and interacts with molecular gas in the disk of a merging companion galaxy (Lebowitz et al., 2023). For three other systems observed as part of the ATCA survey, namely MRC 0114-211, MRC 0156-252, and MRC 2048-272, all the CO(1-0) emission was detected in a single molecular gas reservoir, located beyond the brightest edge of the radio source. As shown in Paper I, even though the CO(1-0) luminosity of this halo gas is similar to what is typically found in submillimeter galaxies (SMGs), the peaks of the CO(1-0) emission coincide with regions that are devoid of 4.5m infra-red emission down to margnitudes below , based on observations with the Infrared Array Camera (IRAC) Band 2 on the Spitzer Space Telescope (Galametz et al., 2012; Wylezalek et al., 2013).
This paper further investigates the molecular gas in the three high- radio galaxies MRC 0114-211, MRC 0156-252, and MRC 2048-272, through CO(2-1) and CO(3-2) observations performed with the Atacama Large Millimeter/submillimeter Array (ALMA). A comparison of the properties and spatial distributions between the CO-emitting gas and the radio synchrotron emission will be used to further study the observed alignments between radio sources and cold gas. The goal is to understand the nature of interaction between the radio source and molecular gas in the halos of high- radio galaxies.
Throughout this paper, we shall assume the same cosmological parameters as in Paper I, namely H0 = 71 km s-1 Mpc-1, = 0.27, and = 0.73 (Wright, 2006).
2 ALMA data
MRC 0114-211 ( = 1.41), MRC 0156-252 ( = 2.02), and MRC 2048-272 ( = 2.05) were observed with the 12m Atacama Large Millimeter Array (ALMA) and 7m Atacama Compact Array (ACA) as part of ALMA Cycle 3 (ID: 2015.1.00897.S). We targeted the lowest transition of CO that is observable with ALMA, which for MRC 0114-211 is CO(2-1) and for MRC 0156-252 and MRC 2048-272 is CO(3-2), all covered in Band 3 (Claude et al., 2005). The ALMA 12m array observed MRC 0114-211, MRC 0156-252, and MRC 2048-272 during 1219 Jan 2016 in C36-1 configuration for 56, 138, and 111 minutes, respectively, which included time for slewing and calibration. The 7m ACA observations were observing during JanSept 2016, with corresponding total observing times of 3.7, 9.4, and 7.6 hours, not including observations that failed ALMA’s quality assurance process. We used four spectral windows of 1.875 GHz with 2 MHz channels. For MRC 0114-211 and MRC 0156-211, one of the spectral windows was centred around the redshifted CO line, while the remaining three covered line-free continuum emission. For MRC 2048-272, which had a wider overall CO(1-0) signal (Paper I), two of the four spectral windows were stitched together to cover the CO line, while the other two observed only continuum emission. A standard strategy for bandpass, phase, and flux calibration was adopted as part of the ALMA calibration plan.
The ALMA data were reduced with the Common Astronomy Software Applications (CASA; CASA Team et al. 2022). Calibration was performed with the scriptForPI.py calibration scripts that were included with the archival data set, using CASA v.4.5.1 with pipeline v.r35932 for the 12m data of MRC 0114-211 and MRC 2048-272, CASA v.4.5.3 with pipeline r36115 for the 7m data of MRC 0114-211, CASA v.4.6.0 (without pipeline) for the 12m data of MRC 0156-252, and CASA v.4.7.0 with pipeline v.r38377 for the 7m data of MRC 0156-252 and MRC 2048-272.
Images were made using CASA v.5.6.0. First, we subtracted the continuum emission using CASA task uvcontsub by fitting a straight line to the line-free channels for each visibility. We then imaged the continuum-subtracted line emission using CASA task tclean, utilizing the mosaic gridder to combine the 12m and 7m data. We also performed a correction for the primary beam response. After binning the image cube to a channel width that best visualizes the line emission, we applied a Hanning smooth to optimize the CO signals. This Hanning smooth created an effective velocity resolution that is twice the channel width. Because of the faintness of the CO, no deconvolution was applied (but see Appendix A). Table 1 summarizes the spatial resolution (synthesized beam size), astrometric accuracy, spectral resolution, and root-mean-square (rms) noise level of the image products after combining the 12m and 7m data.
| Source | CO(,) | Beamsize (PA) | Astrometry† | Channel width | Spectral resolution | rms noise‡ |
|---|---|---|---|---|---|---|
| MRC | transition | (arcsec2) | (arcsec) | (km s-1) | (km s-1) | (mJy bm-1 chan-1) |
| 0114-211 | =2 | 3.47 2.43 (-86.8∘) | 0.4 | 100 | 200 | 0.11 |
| 0156-252 | =3 | 3.04 2.00 (74.1∘) | 0.3 | 60 | 120 | 0.21 |
| 2048-262 | =3 | 3.35 1.98 (87.0∘) | 0.4 | 100 | 200 | 0.14 |
Note. — † The astrometric uncertainty of the CO detections discussed in this paper is dominated by the limited signal-to-noise (S/N), which results in small positional errors with respect to the phase center. This astrometric error is calculated using = (S/N)-1 (Papadopoulos et al., 2008). For values in this table, Astrometry , and is the major axis of the beamsize. An additional uncertainty in the absolute astrometry, due to phase errors introduced by errors in the baseline length, is calculated using = (B k)/B (/2) (Papadopoulos et al., 2008), with (2/)( ), the distance to the phase calibrator, and the calibration error of the baseline length. For ALMA, 0.2 mm km-1 (Hunter et al., 2016), with maximum 12m baselines in our data of 350m, while for ATCA we assume 1 mm. This means that for the data presented in this paper.
Note. — ‡ rms noise before primary beam correction and after Hanning smoothing.
| MRC Source | Region | CO(,) | FWHMCO(J,J-1) | ∗ | r(J,J-1)/1-0† | ||
|---|---|---|---|---|---|---|---|
| transition | (km/s) | (K km s-1 pc2) | |||||
| 0114-211 (A)‡ | ISM/CGM | =2 | 1.414 0.001 | 520 120 | 0.23 0.04 | (6.1 1.1) 109 | 0.34 |
| 0156-252 (A/B1)§ | Companion | =3 | 2.024 0.001 | 655 80 | 0.51 0.07 | (1.2 0.2) 1010 | 0.30 0.08 |
| 0156-252 (C) | Host | =3 | 2.025 0.001 | 910 135 | 0.55 0.09 | (1.3 0.2) 1010 | 0.32 |
| 2048-262 (A) | CGM-1 | =3 | 2.050 0.001 | 540 95 | 0.29 0.05 | (6.8 1.1) 109 | 0.15 0.04 |
Note. — ∗ Units for are in Jy bm-1 km s-1. Uncertainties include the uncertainty in the Gaussian fitting, plus an assumed 5 uncertainty in absolute flux calibration of the ALMA data.
Note. — †The value of rJ,J-1/1-0 is the line ratio of the CO luminosities between the ALMA (=3/2) and ATCA (=1) data from Paper I. This value reflects the excitation conditions of the molecular gas.
Note. — ‡For MRC 0114-211, no CO(1-0) is detected in region A in the velocity range of the CO(2-1) detection. We assume a 3 upper limit across the FWHM of the CO(2-1) detection.
Note. — §For MRC 0156-252, the CO(3-2) in region A and CO(1-0) in region B1 occur at the same redshift. Because the spatial shift between the CO peaks in these regions is less than half the FWHM of the synthesized ATCA beam, we obtained the line ratio by comparing the peak CO(3-2) emission in region A with the peak CO(1-0) emission in region B1, despite the fact that they are not exactly co-spatial in Fig. 2. The values for the Gaussian fitting of the CO(1-0) component of region B1 [B2] are: FWHMCO(1-0) = 755 165 [555 110] km s-1 and = 0.19 0.04 [0.20 0.04] mJy bm-1 km s-1.
| Source | Region | rms (smoothed) | † | ‡ | r(J,J-1)/1-0 |
|---|---|---|---|---|---|
| MRC | (mJy bm-1 chan) | (Jy bm-1 km s-1) | (Jy bm-1 km s-1) | ||
| 0114-211 (B) | CGM | 0.32 | 0.23 | 0.43 0.08 | 0.13 |
| 0156-252 (B2) | ISM/CGM | 0.55 | 0.39 | 0.20 0.04 | 0.22 |
| 2048-262 (B) | CGM-2 | 0.35 | 0.26 | 0.19 0.05 | 0.16 |
Note. — ∗Rms noise level per 100 km s-1 channel, after tapering and smoothing the ALMA data to the same resolution as the ATCA CO(1-0) data from Paper I.
Note. — †For the ALMA non-detections in the CGM, we use conservative limits based on the tapered/smoothing ALMA data and assuming a 3 limit over the FWHM of the CO(1-0) emission.
Note. — ‡See Paper I and caption of Table 2 for details on the CO(1-0) detections, with assumption FWHM = 0.5 FWZI.
3 results
3.1 ALMA results
Figures 1 - 3 show the ALMA imaging of MRC 0114-211, MRC 0156-252, and MRC 2048-262. For all three sources, ALMA detects a 1 transition of CO along the radio axis but beyond the outer edge of the radio source, near the location of the previous ATCA detections of CO(1-0) (Paper I).
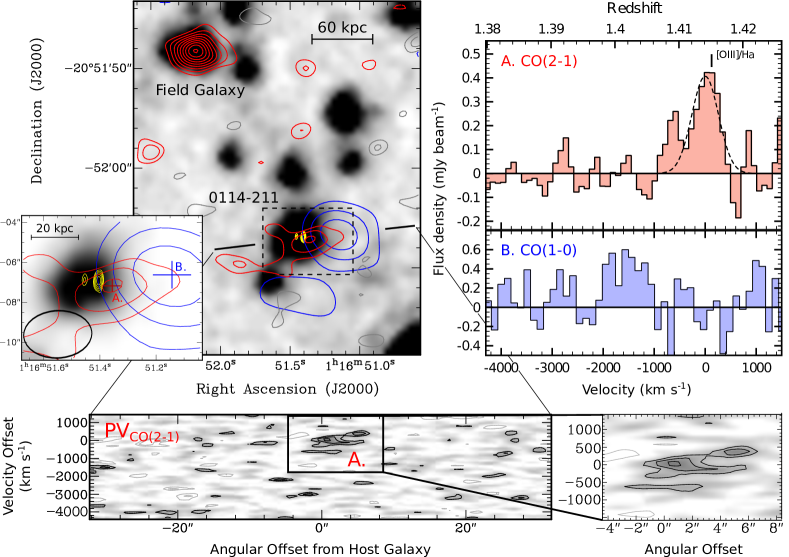
MRC 0114-211 (catalog ): This target contains a small, Compact Steep Spectrum (CSS) radio source with a length of 6 kpc (De Breuck et al., 2010; Randall et al., 2011). The reservoir of CO(1-0) was detected with the ATCA at 4.5 significance, and found along the radio jet at a distance of 34 kpc from the center of the galaxy (Paper I). The estimated molecular gas mass is = (4.5 0.9) 1010 , with = / the CO conversion factor that translates the CO luminosity () into (Bolatto et al., 2013), and which typically ranges from 0.8 for Ultra-Luminous Infrared Galaxies (Downes & Solomon, 1998) to 3.6 for high- starforming galaxies (Daddi et al., 2010; Genzel et al., 2010). Despite this large molecular gas mass, the region of the CO(1-0) emission is devoid of any emission in deep IRAC 4.5m imaging (Fig. 1).
Our ALMA data show a CO(2-1) detection roughly 0.8 arcsec beyond the radio source, in between the bright radio hot-spot and the previous CO(1-0) detection. The redshift of the CO(2-1) detection, = 1.414 0.001, is in good agreement with that derived from the optical [OIII] and H lines (Nesvadba et al., 2017), but shifted by 1500 km s-1 with respect to the peak of the CO(1-0) detection. The molecular gas mass associated with this CO(2-1) detection is 1.8 1010 (see Solomon & Vanden Bout, 2005), where is the CO-to-H2 conversion factor (Bolatto et al., 2013). This estimate is based on the limit of r2-1/1-0 given in Table 2.
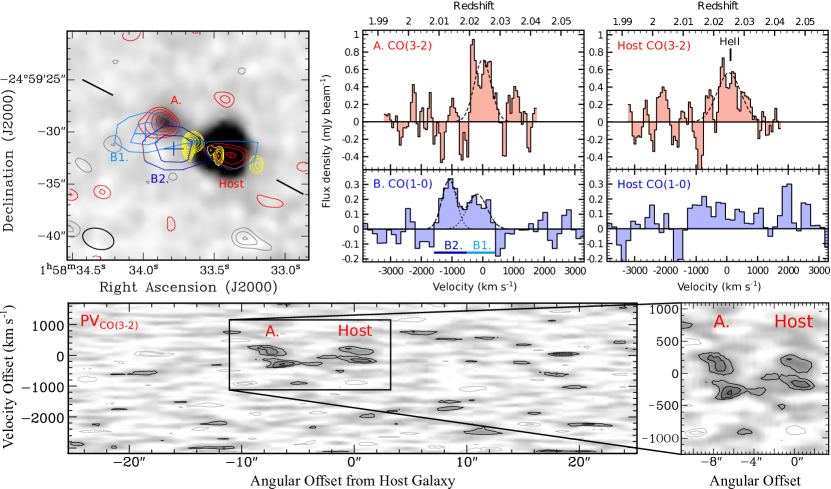
MRC 0156-252 (catalog ): This target is associated with an extended radio source having a total linear size of 70 kpc and a spectacular 90∘ bend at its bright outer edge (Carilli et al., 1997). Luminous Ly emission was found by Pentericci et al. (2001) to stretch along the radio axis, peaking at the location of the bright end of the radio source. The CO(1-0) emission observed with the ATCA at 5 significance is found beyond the radio source, while a region with diffuse X-ray emission is seen to the north of it (Overzier et al., 2005). The CO(1-0) emission has a total mass of (7.4 1.5) 1010 (Paper I) and is resolved into two components, which are separated by approximately 3 arcsec and 900 km s-1 (regions B1 and B2 in Fig. 2).
Our ALMA data show a clear CO(3-2) detection at a redshift of = 2.025 0.001 marked as region A in Fig. 2, which is located close to the CO(1-0) component in region B1. This ALMA detection is co-spatial with a faint infra-red source in deep IRAC 4.5m imaging (Fig. 2), and therefore likely represents the molecular interstellar medium (ISM) in a companion galaxy. This source was identified by Galametz et al. (2013) to be a red galaxy that is very faint in the optical, hence was not targeted by them for spectroscopic follow-up. Our ALMA data confirm that it is at about the same redshift as MRC 0156-252.
Component B2, which was detected only in CO(1-0), is located in the region between the radio host galaxy and the companion in region A. The CO(1-0) peaks south-west of another, much bluer companion galaxy, which is found at the approximate location of the radio hot-spot (Galametz et al., 2013). This companion galaxy is not visible in Fig. 2. The redshift of this second companion is = 2.0171 0.0004 as derived from He II, which differs by 300 km s-1 from the CO(1-0) velocity of the emission-line peak of component B2 (Fig. 2). The CO(1-0) emission in region B2 may originate from this companion, or be a CGM component.
We also detect the host galaxy of MRC 0156-252 in CO(3-2) at = 2.024 0.001, which is close to the redshift derived from He II of = 2.0256 0.0002 (Galametz et al., 2013). There is a slight offset between the radio core and the peak of the central CO(3-2) emission, which lies 1 arcsec to the east, along the direction of the counter-jet. However, we cannot confirm that this offset is real, due to the uncertainties in the astrometry of the ALMA and radio continuum images, in particular because self-calibration of the VLA data (Carilli et al., 1997) could have introduced an additional astrometric uncertainty of about a synthesized VLA beam.
The molecular gas masses associated with the CO(3-2) detections at the companion and the host galaxy are M (3.9 0.5) 1010 M⊙ and M 3.9 1010 M⊙, respectively (see Solomon & Vanden Bout, 2005), where is the CO-to-H2 conversion factor (Bolatto et al., 2013). These estimates are based on the values of r3-2/1-0 given in Table 2.
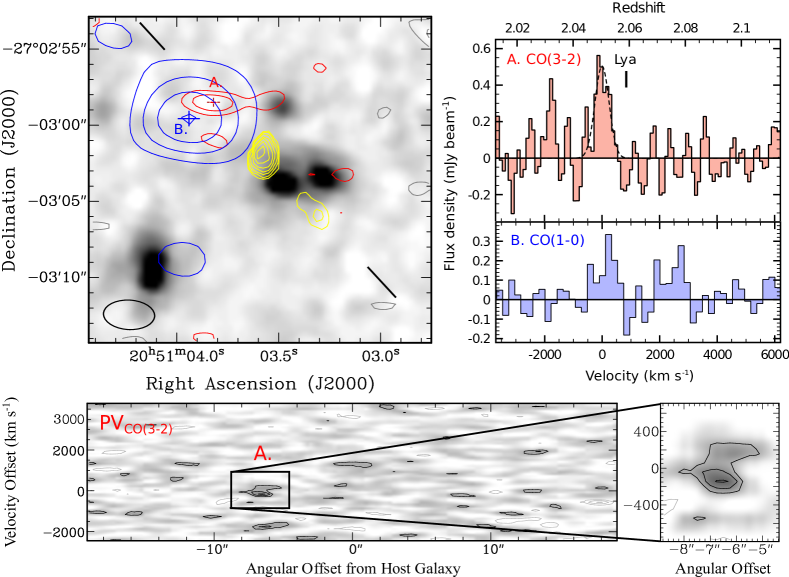
MRC 2048-272 (catalog ): The CO(1-0) emission detected with the ATCA shows a profile with two peaks, one centred around v = 0 km s-1 and the other around v = 2500 km s-1 in Fig. 3. The CO(1-0) emission covers a total velocity range of 3500 km s-1, centred on the redshift derived from Ly (Venemans et al., 2007). The two spectral components were each detected at 3.5 significance, resulting in a combined 5 CO(1-0) detection of (6.9 1.5) 1010 with ATCA (Paper I). The two components are co-spatial and located in the CGM, at a location that is devoid of any emission in IRAC 4.5m imaging (Fig. 3).
Our ALMA results show a CO(3-2) detection associated only with one of the two spectral components of CO(1-0), at = 2.050 0.001. The CO(3-2) signal is detected at a 4 level. The redshift and FWHM of the CO(3-2) emission match those of the blue spectral component of CO(1-0). This blue spectral CO(1-0) component contains (4.5 1.1) 1010 (Paper I).
Tables 2 and 3 further summarize the details of our ALMA results.
3.2 Results on jet-CO alignment
The main observational result from this paper is that the ALMA data reveal reservoirs of cold molecular gas beyond the bright radio jet in three high- radio galaxies. This supports the previous ATCA detections of CO(1-0) in the environments, even though there are spatial and kinematical differences between the ALMA and ATCA detections.
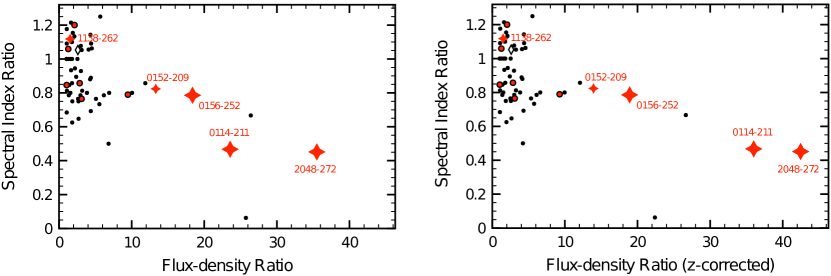
In Fig. 4 we investigate how the presence of cold molecular gas in the environment relates to the properties of the radio source. For this analysis, we do not differentiate whether the molecular gas originates from a galaxy or the CGM. Our analysis is based on large samples of previously published 4.7 and 8.2 GHz radio synchrotron data of high- radio galaxies, which together have a median redshift of = 2.4 (Carilli et al., 1997; Pentericci et al., 2000; De Breuck et al., 2010). We compare the main lobe with the fainter counter lobe, by plotting the ratios of their flux densities and spectral indices in Fig. 4. With the term ‘lobe’ we mean the dominant hot-spot region at the resolution of the VLA data, given that only these values are available for the literature samples.
Fig. 4 (left) shows the empirical result that MRC 0114-211, MRC 0156-252, and MRC 2048-262 have a bright main lobe relative to the counter-lobe, with flux-density ratios of / 24, 18, and 36 at 4.7 GHz, respectively. These values are high compared to other high- radio galaxies from the literature shown in Fig. 4, which show a median value of / 2.7. This suggests that the presence of cold molecular gas beyond the main lobe is directly related to the brightness of the synchrotron emission in these three systems.
One worry could be that the radio galaxies in Fig. 4 (left) have different redshifts, and therefore the measured 4.8 and 8.2 GHz flux densities correspond to a large range in rest frequencies. We can correct for this by adjusting the observed 4.7 GHz flux densities to values expected if the sources would all be at the median redshift of z = 2.4 measured for the literature sample. For this, we use the spectral index measured from the 4.8 and 8.2 GHz flux densities, where = (with the flux density). Using , we calculate the rest-frequency = 16 GHz, which corresponds to = 4.7 GHz at = 2.4. As shown in Fig. 4 (right), this results in an even stronger correlation.
To further investigate our results statistically, we consider that MRC 0114-211, MRC 0156-252, and MRC 2048-262 were part of a representative sample of 13 high- radio galaxies that were studied in CO(1-0) with ATCA (Paper I). Besides MRC 0114-211, MRC 0156-252, and MRC 2048-262, only two other high- radio galaxies from Paper I were detected in CO(1-0), namely MRC 0152-209 (a.k.a. Dragonfly galaxy) and MRC 1138-2623 (a.k.a. Spiderweb galaxy). Both the Dragonfly and Spiderweb radio galaxies also show extended CO(1-0) that stretches out to scales of 30-35 kpc distance from the host galaxy (Emonts et al., 2015a, b, 2016, 2018a). Here we briefly described these two sources:
-
•
MRC 0152-209 (catalog ) (Dragonfly galaxy): For the Dragonfly galaxy, Lebowitz et al. (2023) conclude in a recent paper that the radio source brightens as it interacts with the molecular gas in the disk of a merging companion galaxy (but see also Zhong et al., 2023). This means that the Dragonfly galaxy follows the trend seen in Fig. 4, with / 13 at 4.7 GHz. The CO(1-0) on large scales is likely tidal debris that stretches across a total extent of 60 kpc (Emonts et al., 2015a).
-
•
MRC 1138-262 (catalog ) (Spiderweb galaxy): The Spiderweb galaxy (Miley et al., 2006) shows no discrepancy in the 4.7 GHz brightness ratio of the main and counter lobe (/ 1.5), but in this case the large-scale CO(1-0) emission was found in all directions across the halo. Moreover, while indications for alignments between the molecular gas and the radio source are more subtle in the Spiderweb, they are present, as evident from an increased brightness of CO(1-0) along the main jet (Emonts et al., 2016), as well as the detection of water (H2O) emission along the jet axis (Gullberg et al., 2016b). The large-scale CO(1-0) emission is likely halo gas that fuels in-situ star formation across 70 kpc in the CGM (Hatch et al., 2008; Emonts et al., 2016).
By including the Dragonfly and Spiderweb in our analysis, as well as the eight CO(1-0) non-detections from Paper I, we can perform a statistical analysis, which we will describe below. The only other high- radio galaxy mentioned in Sect. 1 that has CO emission aligned with the radio source, and for which both 4.7 and 8.2 GHz observations of the radio source are available, is TXS 0828+193 (Carilli et al., 1997; Nesvadba et al., 2009; Fogasy et al., 2021). In the case of TXS 0828+193, the CO emission was detected just outside the bright hot-spot of the main radio lobe (Nesvadba et al., 2009), at the location of a companion galaxy (Fogasy et al., 2021). The main lobe on the side of this gas-rich companion is a factor 2.5 brighter than the counter-lobe (open diamond in Fig. 4). However, because TXS 0828+193 was not part of the representative MRC sample that was observed with ATCA in a uniform way, we do not take it into account in our statistical analysis.
Our statistical analysis is shown in Appendix C. We base our analysis on the conservative case where we do not correct the flux-density ratio values for redshift (i.e., left panel of Fig. 4). When comparing the brightness ratios of the five CO-detected radio sources from Paper I (which all show large-scale CO emission) with those of the much larger literature sample of high- radio galaxies, a Kolmogorov-Smirnov (KS) test reveals that the probability that both samples are drawn from the same distribution is only 0.5 (see Appendix C for details). Therefore, the correlation in Fig. 4 between the presence of circumgalactic molecular gas beyond the radio source and an increased brightness-ratio between main lobe and counter-lobe, is statistically inconsistent with random sampling.
The correlation shown in Fig. 4 indicates that the increased brightness in the radio flux density of the main lobe is a direct result of the presence of cold molecular gas at or near the location of the radio hot-spot. The lobe brightening cannot be explained by Doppler boosting, which is the effect where the approaching radio jet increases its apparent brightness due to relativistic effects, because this only depends on the inclination angle of the jet and not on environmental conditions. Moreover, the 4.7 and 8.2 GHz measurements of the ‘lobe’ predominantly reflect the hot-spot regions (Sect. 3.2), which are the working surface where the lobe interacts with the CGM at sub-relativistic speeds. Although some Doppler boosting likely still occurs for the main hot-spot region, this typically results in a brightening of the flux density by a factor of at most a few (Komissarov & Falle, 1996), i.e., less than what we observe for MRC 0114-211, MRC 0156-252, MRC 2048-272, and also MRC 0152-209 (Dragonfly galaxy; Lebowitz et al. 2023).
There is also a tentative indication from Fig. 4 that the 4.7-8.2 GHz spectral index is less steep within the bright main lobe among the three high- radio galaxies that we study in this paper. However, based on the same KS test as for the flux-density ratios, the difference in spectral-index values between the radio galaxies with detections of circumgalactic molecular gas and the large sample of high-z radio galaxies is not statistically significant.
In summary, our results suggest that in the presence of molecular gas beyond the radio source, the radio synchrotron emission brightens. We will further discuss this result in the next Section.
4 Discussion
The alignments that we observe between the radio sources and molecular gas reservoirs, as well as the increased flux density of the main lobe compare to the counter-lobe in the presence of these gas reservoirs, strongly suggest that jet-cloud interactions take place in the circumgalactic environment of our ALMA targets, even at distances out to 50 kpc from the radio host galaxy. Eales (1992) suggested that such alignments can be explained by radio sources expanding into asymmetric gas distributions, and experiencing an increase in synchrotron luminosity that is on average largest in the direction where the gas density is highest. In addition, West (1994) showed that radio sources tend to align with the major axis of the mass distribution on large scales. Therefore, these earlier theories agree with our observations. In this Section, we will explore the cause-and-effect that may lead to our observed alignments and lobe brightening.
4.1 Jet-cloud interactions: synchrotron brightening
The brightening of the radio lobe in the presence of cold molecular gas suggests that the radio lobe is confined as it propagates into the molecular gas reservoir. As energy and momentum are being exchanged between the gas and the lobes, the gas experiences an increased velocity dispersion (e.g., Mandal et al., 2021; Meenakshi et al., 2022). The fact that the CO(1-0) profiles of MRC 0114-211, MRC 0156-252, and MRC 2048-262 are fairly broad, with a full width at zero intensity (FWZI) ranging from 1100 3600 km s-1, agrees with this and suggests that the molecular gas is turbulent. It is likely that compression and possible tangling of the magnetic fields, combined with the increased density of particles, boosts the radio synchrotron luminosity (e.g., Gopal-Krishna & Wiita, 1991; Morganti et al., 2011), although Anderson et al. (2022) show that jet-gas interactions also occur along radio sources with well-ordered, coherent magnetic fields that magnetize their surrounding environment. Among our sample, there is also a tentative indication that the spectral index of the main lobe becomes less steep compared to the counter lobe. If confirmed, this may indicate that shocks re-accelerate electrons in the main lobe, or that particle replenishment is still ongoing and therefore synchrotron losses due to spectral ageing are less severe in the lobe that is confined by interaction with the molecular gas (e.g., Blundell & Rawlings, 2000).
The bulk of the molecular gas reservoirs, as identified by the peak of the CO emission, appear to be located well beyond the radio hot-spot. For MRC 0156-252 and MRC 2048-272, the distance between the hot-spot and the peak of the ALMA detected CO(3-2) emission appears to be 25 and 40 kpc, respectively. However, even though the working surface of the radio jet is thought to be the brightest there where it encounters the densest medium (e.g., Barthel & Arnaud, 1996), the molecular gas reservoirs likely cover a large (tens of kpc) scale, and the interaction between the radio source and the molecular gas occurs at the boundary of the gas reservoir. The gas density even at the edge of the molecular reservoirs is likely high enough for this, considering that jet-gas interactions are frequently observed to be associated with much less denser gas, such as warm gas traced in Ly, H, and [O iii] (e.g., Villar-Martín et al., 2003; Humphrey et al., 2006; Nesvadba et al., 2017).
Under this scenario that jet-cloud interactions brighten the radio synchrotron emission, our observed alignments between radio sources and CO-emitting gas reservoirs could in part be due to intrinsically fainter radio sources being pushes into the flux-selected samples of high- radio galaxies (see also Eales, 1992). This scenario was also suggested in the recent study of the Dragonfly galaxy (MRC 0152-209) by Lebowitz et al. (2023). The scenario where jet-cloud interactions convert jet power into radio luminosity also agrees with studies of mostly ionized and neutral gas around low- radio sources (e.g., van Breugel et al., 1985; Fosbury et al., 1998; Villar-Martín et al., 1999, 2017; Tadhunter et al., 2000; Morganti et al., 2002, 2011; Murthy et al., 2020) and has been proposed to explain the relatively large fraction of young and compact radio sources seen among starbursting radio galaxies at low- (Tadhunter et al., 2011).
4.1.1 Jet-induced enrichment and cooling?
Fig. 4 would be more difficult to explain if the molecular gas reservoirs would be merely a manifestation of the effects of the radio source, such as jet-induced enrichment and cooling, because this would likely be related to the total radio power rather than the flux-density ratio of the lobe and counter-lobe. Nevertheless, in general, the most robust detections of large-scale (10s-100 kpc) molecular gas in circumgalactic environments are predominantly found to be associated with radio galaxies and radio-loud quasi-stellar objects (QSOs), while radio-quiet QSOs show less extended molecular gas reservoirs (Li et al., 2023; Jones et al., 2023). Therefore, it is worth exploring the effect that the radio jets may have on surrounding gas reservoirs. Radio-AGN activity is a recurrent phenomenon, so previous jet activity may also have contributed to creating the CO-emitting reservoirs.
Paper I described in detail that the effect of the radio jet on the circumgalactic medium may include chemical enrichment and gas cooling (see also Klamer et al., 2004). For nearby brightest clusters galaxies, Kirkpatrick et al. (2009) and Kirkpatrick, McNamara, & Cavagnolo (2011) found that the radio source can drive chemical enrichment along the radio axis, typically over multiple episodes of radio-source activity. At high redshifts, such enrichment processes likely contribute to the near-solar metallicities observed across extended emission-line regions of high- radio galaxies and quasars (e.g., Vernet et al., 2001; Humphrey et al., 2008; Prochaska & Hennawi, 2009). These processes could deposit the carbon and oxygen elements needed to form the large reservoirs of CO-emitting gas.
In addition, the propagating radio jet likely compresses and cools the enriched CGM through shocks (e.g., Mellema, Kurk, & Röttgering, 2002; Sutherland, Bicknell, & Dopita, 2003; Fragile et al., 2004; Gaibler et al., 2012; Fragile et al., 2017; Mandal et al., 2021). This process was suggested to occur in the Spiderweb radio galaxy (MRC 1138-262), where both enhancements in CO(1-0) and H2O emission were found along the radio jet, likely as a result of gas cooling behind slow shocks that propagate through the dense, multiphase gas (Gullberg et al., 2016b; Emonts et al., 2016). Such gas cooling may result in jet-triggered star formation; see, for example, the case of Minkowski’s Object (Croft et al., 2006; Salomé, Salomé, & Combes, 2015) 4C 41.17 (Dey et al., 1997; Nesvadba et al., 2020), and possible other high- radio galaxies (Klamer et al., 2004). This could explain alignments found between high- radio jets and large-scale UV rest-frame continuum and submillimeter emission (Chambers et al., 1987; McCarthy et al., 1987b; Begelman & Cioffi, 1989; De Young, 1989; Rees, 1989; Bicknell et al., 2000; Stevens et al., 2003; Ivison et al., 2012), or the enhanced rates of star formation associated with radio-loud active galactic nuclei (AGN) (Zinn et al., 2013).
In summary, while our CO results are in agreement with literature work indicating that radio sources may enrich or cool gas in their environment, our work (Fig. 4) predominantly shows that the cold gas directly affects the radio source, enhancing its brightness due to jet-cloud interactions.
4.2 Gas excitation: ISM or CGM?
A detailed analysis of the physical properties of the molecular gas in the circumgalactic environment of MRC 0114-211, MRC 0156-252, and MRC 2048-262 is difficult, given the low signal-to-noise and limited resolution of our ALMA and ATCA detections. Nevertheless, we here provide a first-order analysis of the properties of the molecular gas reservoirs, to obtain some insight into their nature.
For MRC 0114-211, the ALMA detection of CO(2-1) (region A) peaks at roughly 10 kpc from the center of the radio galaxy and very close to the radio hot-spot. For MRC 0156-252, the ALMA detection (region A) coincides with a detection in the IRAC Band 2 image, and is thus likely associated with a companion galaxy. For both cases, the line ratios of r2-1/1-0 0.34 and r3-2/1-0 0.30 (Table 2) are consistent with excitation conditions found in the ISM of high-z galaxies (e.g., Dannerbauer et al., 2009; Ivison et al., 2011; Bothwell et al., 2013; Aravena et al., 2014; Daddi et al., 2015). On the other hand, the line ratios are significantly lower for the CO(1-0) detections further out from the host or any companion galaxy, with r2-1/1-0 0.13 for region B in MRC 0114-211, r3-2/1-0 0.22 for region B2 in MRC 0156-252, and r3-2/1-0 0.16 in MRC 2048-262 (Table 3). Despite the uncertainty associated with this analysis, our results suggests that while part of the CO emission in MRC 0114-211 and MRC 0156-252 is likely associated with the ISM of either the host or a companion galaxy, at least some fraction of the CO(1-0) emission in these two systems, and possibly all of the CO emission in the third system MRC 2048-272, appears to be part of the CGM. This molecular gas in the CGM has a low excitation, but it is not clear from our data whether it is diffuse or clumpy.
For future work, our results on the gas excitation strongly suggest that observations of the CO ground-transition that are sensitive to detecting low surface-brightness emission are critical for recovering widespread cold molecular gas reservoirs. ALMA Band 1 will soon allow observations of CO(1-0) out to redshifts of 2.3 ( 35 GHz). In terms of surface-brightness sensitivity, ALMA’s extremely compact array configurations are an improvement over the VLA in D-configuration, whose Ka and Q band receivers operate in the same frequency regime. On longer time-scales, the Next-Generation VLA (ngVLA) will be able to target CO(1-0) at almost any redshift (Murphy, 2018; Decarli et al., 2018). In particular when optimized for surface-brightness sensitivity with a densely packed configuration of antennas in the central km-scale region (Carilli et al., 2021), the core of the ngVLA will be a critical complement to ALMA for tracing low- CO in the CGM at the highest redshifts (Emonts et al., 2018b). Complementary ALMA observations of the high- CO transitions at higher frequencies can easily over-resolve or resolve out emission from widespread gas reservoirs. A large millimeter single-dish telescope, such as the Atacama Large Aperture Submillimeter Telescope (AtLAST; Bertoldi 2018; Cicone et al. 2019; Klaassen et al. 2020), can recover all the flux of the high- CO lines.
5 Conclusions
We presented the detection of CO(2-1) or CO(3-2) emission in the environments of three high- radio galaxies, MRC 0114-211 ( =1.41), MRC 0156-252 ( =2.02), and MRC 2048-272 ( =2.05). Our ALMA data support previous results from a CO(1-0) survey performed with ATCA, which detected CO(1-0) emission from cold molecular gas in the halo environments of these sources. We derive the following conclusions:
-
•
The CO is found along the radio axis but beyond the main radio lobe. This confirms that the ‘alignment effect’, which is often observed for different constituents of high- radio galaxies, also applies to cold molecular gas on large scales in these sources.
-
•
For MRC 0114-211 and MRC 0156-252, part of the observed molecular gas is likely ISM from the host or a companion galaxy, respectively. However, in other parts of the molecular reservoirs of these two sources, as well as for the case of MRC 2048-272, the CO(2-1) or CO(3-2) emission does not appear to be associated with any galaxy and is faint compared to CO(1-0), with r3-2/1-0 and r2-1/1-0 values 0.2. This suggests that we may also be tracing molecular gas with low excitation in the CGM.
-
•
The presence of cold molecular gas in the environment of our sources (whether from the ISM or CGM) correlates with an increase in brightness of the main radio lobe. This is derived from high ratios in the 4.7 GHz flux density of the main lobe compared to the counter-lobe, with / 1836 for our three sources, compared to a median value of / 2.7 for a large sample of high- radio galaxies from the literature. Based on a Kolmogorov-Smirnov test, we show that, at a statistical significance of 99.5, there is a difference in this ratio of the lobe brightness between high- radio galaxies with CO detected in the environment and the larger population of high- radio galaxies. This suggests that the cold gas affects the properties of the radio source, and that the alignment effect may in part be caused by intrinsically fainter radio sources which brightness is enhanced enough to enter the flux-selected samples of high- radio galaxies (see also Lebowitz et al., 2023). The radio source may also affect the molecular gas reservoir though enrichment and cooling, but this is more speculative from our data.
Our work confirms the importance of studying the interplay between radio sources and cold gas in the circumgalactic environments of high- galaxies. To understand how these results compare to the general population of galaxies in the Early Universe, future millimeter observations with compact interferometric arrays that are sensitive to recovering low-surface-brightness emission of low- CO are critical for studying the total budget of cold gas across the Universe.
Appendix A CO-bright galaxy in the field of MRC 0114-211
.
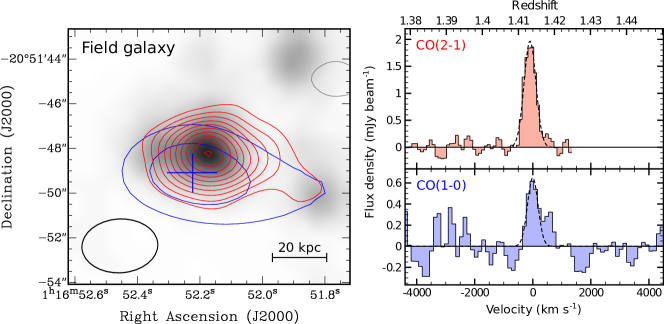
A bright line-emitter was found in the field of MRC 0114-211 at R.A. = 01h 16m 52.17s; dec = -20∘ 51′ 48.2′′, which is a distance of 20′′ (170 kpc) north-west of the radio galaxy. The line-emitter is detected in both CO(2-1) and CO(1-0), and has the same redshift as MRC 0114-211 ( = 1.414). This galaxy has a counterpart in the IRAC 4.5m image of Fig. 1.
The integrated CO(2-1) emission of this field galaxy is the strongest signal found among the ALMA data sets used in this paper, and is detected at an integrated signal-to-noise level of S/N 10. This means that the CO(2-1) emission in the ALMA data is bright enough to attempt a meaningful deconvolution and restoration (“cleaning”) of the signal. We cleaned the signal in a circular aperture with a radius of 2′′ centered on the peak of the CO(2-1) emission, down to a threshold of 2.5 in each channel. When processing and imaging the cleaned data in the same way as the data described in Sect. 2, the CO(2-1) peak flux-density of this field galaxy decreased by only 1.6 compared to the case of no deconvolution, while the peak flux-density of the CO(2-1) emission around MRC 0114-211 decreased by only 2.4. These values are lower than the assumed 5 uncertainty in absolute flux calibration. Also, no signficant difference in the morphology of the signal is seen down to the 2 level shown in Fig. 1 when taking the same channel ranges for the integrated emission. Therefore, deconvolution does not affect the results presented in this paper, and at the low clean threshold that we had to adopt could include components that are dominated by noise. We therefore use the cleaned data cube only for the analysis of the field galaxy in this Appendix.
Figure 5 shows the CO(2-1) and CO(1-0) detection of this field galaxy. The data properties as the same as in Table 1, with the difference that we applied a primary beam correction to recover accurate flux values this far from the center of the image. To derive CO intensities, we fit a Gaussian model to the CO lines. The resulting line properties for the ALMA CO(2-1) [ATCA (CO(1-0)) data] are: = -100 10 [0 60] km s-1; FWHMCO = 480 30 [430 130] km s-1; = 1.01 0.08 [0.30 0.08] mJy bm-1 km s-1. The total H2 mass of the field galaxy derived from CO(1-0) is M = (3.0 0.8) 1010 (Solomon & Vanden Bout, 2005), and the ratio of the CO luminosities is r2-1/1-0 = 0.84 0.23. This is consistent with values found for other high- galaxies (e.g., Dannerbauer et al., 2009; Ivison et al., 2011; Bothwell et al., 2013; Aravena et al., 2014; Daddi et al., 2015). There is a tentative indication that the CO emission may be extended towards the east, but this needs to be confirmed.
Appendix B Radio continuum properties of three ATCA sources
In this Appendix, we provide the continuum properties of three sources that are part of our ATCA sample, MRC 0114-211, MRC 0324-228, and MRC 0350-279, which were all three imaged at 4.7 GHz and 8.2 GHz by De Breuck et al. (2010). The flux densities and spectral indices are measured from the continuum images of De Breuck et al. (2010) and results are summarized in Table 4.
| Source | Brightest hot-spot | Faintest hot-spot | ||
|---|---|---|---|---|
| † | † | |||
| MRC 0114-211 | 1.06 | -1.1 | 0.045 | -2.3 |
| MRC 0324-228 | 0.041 | -1.8 | 0.019 | -1.5 |
| MRC 0350-279 | 0.033 | -1.8 | 0.026 | -1.7 |
Note. — ∗ Units for are in Jy beam-1.
Appendix C Statistical analysis
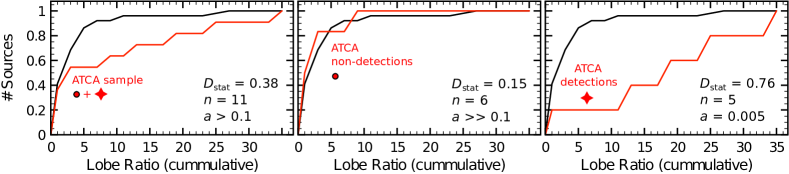
In this Appendix, we investigate whether there is a statistical significance to the observed correlation that the high- radio sources with extended CO emission also have a relatively bright main lobe compared to the counter lobe (Fig. 4 - left). For this, we use a one-tailed Kolmogorov-Smirnov (KS) test for two samples of unequal size. The first sample is our ATCA sample from Paper I. Out of the 13 MRC sources observed by ATCA, only 11 have information regarding their radio continuum properties available in Carilli et al. (1997), Pentericci et al. (2000), or De Breuck et al. (2010). We divide these 11 MRC sources into a sub-sample of five detections and a sub-sample of 6 non-detection in CO(1-0). The non-detections from the ATCA sample have a 3 upper limit of that is equal to or smaller than of the five ATCA detections (Emonts et al., 2014). Therefore, we do not expect a bias regarding the CO(1-0) sensitivity across the sample observed with ATCA. The second sample is the literature sample of high- radio galaxies shown in Fig. 4, but excluding the MRC sources that we observed with ATCA. Fig. 6 shows the results from our KS analysis.
Panel A of Fig. 6 shows that when comparing the literature sample with the full ATCA sample (detections and non-detections), the probability that both samples are drawn from the same distribution is just above 10. This means that there is no statistical difference between the two samples, which in turn means that there were no significant biases that influenced the selection of the ATCA sample in terms of the lobe-ratio values shown in Fig. 4. Panel B shows that the same conclusion can be drawn when considering just the non-detections in the ATCA sample (red dots in Fig. 4), with an even better correspondence with the literature sample. However, panel C shows that when considering only the CO detections in the ATCA sample (stars in Fig. 4 - left), the probability that this sample of 5 sources is drawn from the same distribution as the literature sample is only 0.5. This means that there is a statistical difference in the ratio of the lobe brightness between our sample of radio galaxies with CO detected in the environment and the larger population of high- radio galaxies. We note that this result is obtained by including MRC 1138-262, which shows extended CO(1-0) emission in all directions across the halo (Emonts et al., 2016). If we would only consider the four ATCA sources of interest for this paper, namely those sources with extended CO detected along the radio axis, then this would even further decrease the probability that their high ratio in lobe brightness is the result of random sampling.
References
- Anderson et al. (2022) Anderson, C. S., Carilli, C. L., Tozzi, P., et al. 2022, ApJ, 937, 45. doi:10.3847/1538-4357/ac7ec0
- Aravena et al. (2011) Aravena M., Wagg J., Papadopoulos P. P., Feain I. J., 2011, ApJ, 737, 64. doi:10.1088/0004-637X/737/2/64
- Aravena et al. (2014) Aravena, M., Hodge, J. A., Wagg, J., et al. 2014, MNRAS, 442, 558
- Barthel & Arnaud (1996) Barthel P. D., Arnaud K. A., 1996, MNRAS, 283, L45. doi:10.1093/mnras/283.2.L45
- Barthel et al. (2012) Barthel, P., Haas, M., Leipski, C., et al. 2012, ApJ, 757, L26
- Barthel et al. (2000) Barthel, P. D., Vestergaard, M., & Lonsdale, C. J. 2000, AA, 354, 7
- Begelman & Cioffi (1989) Begelman M. C., Cioffi D. F., 1989, ApJL, 345, L21. doi:10.1086/185542
- Bertoldi (2018) Bertoldi, F. 2018, Atacama Large-Aperture Submm/mm Telescope (AtLAST), 3. doi:10.5281/zenodo.1158842
- Bicknell et al. (2000) Bicknell, G. V., Sutherland, R. S., van Breugel, W. J. M., et al. 2000, ApJ, 540, 678. doi:10.1086/309343
- Blandford (2001) Blandford, R. D. 2001, Progress of Theoretical Physics Supplement, 143, 182 (arXiv:astro-ph/0110394)
- Blundell & Rawlings (2000) Blundell, K. M. & Rawlings, S. 2000, AJ, 119, 1111. doi:10.1086/301254
- Bolatto et al. (2013) Bolatto, A. D., Wolfire, M., & Leroy, A. K. 2013, ARA&A, 51, 207. doi:10.1146/annurev-astro-082812-140944
- Bothwell et al. (2013) Bothwell, M. S., Smail, I., Chapman, S. C., et al. 2013, MNRAS, 429, 3047
- Broderick et al. (2022) Broderick, J. W., Drouart, G., Seymour, N., et al. 2022, PASA, 39, e061. doi:10.1017/pasa.2022.42
- Carilli et al. (1997) Carilli, C. L., Röttgering, H. J. A., van Ojik, R., Miley, G. K., & van Breugel, W. J. M. 1997, ApJS, 109, 1
- Carilli et al. (2021) Carilli, C. L., Mason, B., Rosero, V., Butler, B., Carilli, J., Mujrphy, E., Walker, R. C., 2021, Next Generation VLA Memo Series, 92
- Carson et al. (2001) Carson, J. E., Larkin, J. E., McLean, I. S., et al. 2001, ApH, 563, 63
- CASA Team et al. (2022) CASA Team, Bean, B., Bhatnagar, S., et al. 2022, PASP, 134, 114501. doi:10.1088/1538-3873/ac9642
- Chambers et al. (1987) Chambers, K. C., Miley, G. K., & van Breugel, W. 1987, Nature, 329, 604
- Chambers et al. (1990) Chambers, K. C., Miley, G. K., & van Breugel, W. J. M. 1990, ApJ, 363, 21
- Chambers et al. (1996a) Chambers, K. C., Miley, G. K., van Breugel, W. J. M., et al. 1996, ApJS, 106, 215
- Chambers et al. (1996b) Chambers, K. C., Miley, G. K., van Breugel, W. J. M., et al. 1996, ApJS, 106, 247
- Cicone et al. (2019) Cicone, C., De Breuck, C., Chen, C.-C., et al. 2019, BAAS, 51, 82. doi:10.48550/arXiv.1903.04531
- Claude et al. (2005) Claude, S., Dindo, P., Erickson, D., et al. 2005, The Joint 30th International Conference on Infrared and Millimeter Waves and 13th International Conference on Terahertz Electronics, 407. doi:10.1109/ICIMW.2005.1572585
- Croft et al. (2006) Croft S., van Breugel W., de Vries W., Dopita M., Martin C., Morganti R., Neff S., et al., 2006, ApJ, 647, 1040. doi:10.1086/505526
- Daddi et al. (2010) Daddi, E., Bournaud, F., Walter, F., et al. 2010, ApJ, 713, 686. doi:10.1088/0004-637X/713/1/686
- Daddi et al. (2015) Daddi, E., Dannerbauer, H., Liu, D., et al. 2015, AA, 577, A46
- Dannerbauer et al. (2009) Dannerbauer, H., Daddi, E., Riechers, D. A., et al. 2009, ApJL, 698, L178
- Dannerbauer et al. (2014) Dannerbauer, H., Kurk, J. D., De Breuck, C., et al. 2014, AA, 570, A55
- Dannerbauer et al. (2017) Dannerbauer, H., Lehnert, M. D., Emonts, B., et al. 2017, AA, 608, A48
- Downes & Solomon (1998) Downes, D. & Solomon, P. M. 1998, ApJ, 507, 615. doi:10.1086/306339
- De Breuck et al. (2000) De Breuck, C., van Breugel, W., Röttgering, H. J. A., et al. 2000, AAS, 143, 303
- De Breuck et al. (2001) De Breuck, C., van Breugel, W., Röttgering, H., et al. 2001, AJ, 121, 1241
- De Breuck et al. (2010) De Breuck, C., Seymour, N., Stern, D., et al. 2010, ApJ, 725, 36
- De Breuck et al. (2022) De Breuck, C., Lundgren, A., Emonts, B., et al. 2022, A&A, 658, L2
- Decarli et al. (2018) Decarli, R., Carilli, C., Casey, C., et al. 2018, Science with a Next Generation Very Large Array, ASPC, 517, 565
- Dey et al. (1997) Dey, A., van Breugel, W., Vacca, W. D., et al. 1997, ApJ, 490, 698
- De Young (1989) De Young D. S., 1989, ApJL, 342, L59. doi:10.1086/185484
- Djorgovski et al. (1988) Djorgovski, S., Spinrad, H., McCarthy, P., et al. 1988, AJ, 96, 836
- Eales (1992) Eales, S. A. 1992, ApJ, 397, 49. doi:10.1086/171765
- Elbaz et al. (2009) Elbaz D., Jahnke K., Pantin E., Le Borgne D., Letawe G., 2009, A&A, 507, 1359. doi:10.1051/0004-6361/200912848
- Emonts et al. (2014) Emonts, B. H. C., Norris, R. P., Feain, I., et al. 2014, MNRAS, 438, 2898
- Emonts et al. (2015a) Emonts, B. H. C., Mao, M. Y., Stroe, A., et al. 2015a, MNRAS, 451, 1025
- Emonts et al. (2015b) Emonts, B. H. C., De Breuck, C., Lehnert, M. D., et al. 2015b, AA, 584, A99
- Emonts et al. (2016) Emonts, B. H. C., Lehnert, M. D., Villar-Martín, M., et al. 2016, Science, 354, 1128
- Emonts et al. (2018a) Emonts, B. H. C., Lehnert, M. D., Dannerbauer, H., et al. 2018a, MNRAS, 477, L60
- Emonts et al. (2018b) Emonts, B., Carilli, C., Narayanan, D., et al. 2018b, Science with a Next Generation Very Large Array, ASPC, 517, 587
- Falkendal et al. (2019) Falkendal, T., De Breuck, C., Lehnert, M. D., et al. 2019, AA, 621, A27
- Falkendal et al. (2021) Falkendal, T., Lehnert, M. D., Vernet, J., et al. 2021, AA, 645, A120
- Fogasy et al. (2021) Fogasy J., Knudsen K. K., Drouart G., Gullberg B., 2021, MNRAS, 501, 5973. doi:10.1093/mnras/staa3998
- Fosbury et al. (1998) Fosbury, R. A. E., Morganti, R., Wilson, W., et al. 1998, MNRAS, 296, 701
- Fragile et al. (2004) Fragile P. C., Murray S. D., Anninos P., van Breugel W., 2004, ApJ, 604, 74. doi:10.1086/381726
- Fragile et al. (2017) Fragile, P. C., Anninos, P., Croft, S., et al. 2017, ApJ, 850, 171. doi:10.3847/1538-4357/aa95c6
- Gaibler et al. (2012) Gaibler V., Khochfar S., Krause M., Silk J., 2012, MNRAS, 425, 438. doi:10.1111/j.1365-2966.2012.21479.x
- Galametz et al. (2012) Galametz, A., Stern, D., De Breuck, C., et al. 2012, ApJ, 749, 169
- Galametz et al. (2013) Galametz, A., Stern, D., Pentericci, L., et al. 2013, A&A, 559, A2
- Genzel et al. (2010) Genzel, R., Tacconi, L. J., Gracia-Carpio, J., et al. 2010, MNRAS, 407, 2091. doi:10.1111/j.1365-2966.2010.16969.x
- Gopal-Krishna & Wiita (1991) Gopal-Krishna & Wiita, P. J. 1991, ApJ, 373, 325
- Gullberg et al. (2016a) Gullberg, B., De Breuck, C., Lehnert, M. D., et al. 2016, AA, 586, A124
- Gullberg et al. (2016b) Gullberg, B., Lehnert, M. D., De Breuck, C., et al. 2016, AA, 591, A73
- Hatch et al. (2008) Hatch, N. A., Overzier, R. A., Röttgering, H. J. A., et al. 2008, MNRAS, 383, 931
- Heckman et al. (1991) Heckman, T. M., Lehnert, M. D., Miley, G. K., & van Breugel, W. 1991, ApJ, 381, 373
- Humphrey et al. (2006) Humphrey, A., Villar-Martín, M., Fosbury, R., et al. 2006, MNRAS, 369, 1103
- Humphrey et al. (2008) Humphrey, A., Villar-Martín, M., Sánchez, S. F., et al. 2008, MNRAS, 390, 1505
- Hunter et al. (2016) Hunter, T. R., Lucas, R., Broguière, D., et al. 2016, Proc. SPIE, 9914, 99142L. doi:10.1117/12.2232585
- Ivison et al. (2011) Ivison, R. J., Papadopoulos, P. P., Smail, I., et al. 2011, MNRAS, 412, 1913
- Ivison et al. (2012) Ivison, R. J., Smail, I., Amblard, A., et al. 2012, MNRAS, 425, 1320
- Jones et al. (2023) Jones, G. C., Maiolino, R., Carniani, S., et al. 2023, MNRAS, 522, 275. doi:10.1093/mnras/stad985
- Kirkpatrick et al. (2009) Kirkpatrick C. C., Gitti M., Cavagnolo K. W., McNamara B. R., David L. P., Nulsen P. E. J., Wise M. W., 2009, ApJL, 707, L69. doi:10.1088/0004-637X/707/1/L69
- Kirkpatrick, McNamara, & Cavagnolo (2011) Kirkpatrick C. C., McNamara B. R., Cavagnolo K. W., 2011, ApJL, 731, L23. doi:10.1088/2041-8205/731/2/L23
- Klaassen et al. (2020) Klaassen, P. D., Mroczkowski, T. K., Cicone, C., et al. 2020, Proc. SPIE, 11445, 114452F. doi:10.1117/12.2561315
- Klamer et al. (2004) Klamer, I. J., Ekers, R. D., Sadler, E. M., et al. 2004, ApJL, 612, L97. doi:10.1086/424843
- Klamer et al. (2005) Klamer, I. J., Ekers, R. D., Sadler, E. M., et al. 2005, ApJ, 621, L1
- Kodama et al. (2007) Kodama, T., Tanaka, I., Kajisawa, M., et al. 2007, MNRAS, 377, 1717
- Komissarov & Falle (1996) Komissarov, S. S. & Falle, S. A. E. G. 1996, Energy Transport in Radio Galaxies and Quasars, 100, 327
- Kurk et al. (2002) Kurk, J. D., Pentericci, L., Röttgering, H. J. A., et al. 2002, Revista Mexicana de Astronomia y Astrofisica Conference Series, 13, 191 (arXiv.astro-ph/0102337)
- Kurk (2003) Kurk, J. D. 2003, Ph.D. Thesis, Leiden University
- Large et al. (1981) Large, M. I., Mills, B. Y., Little, A. G., et al. 1981, MNRAS, 194, 693
- Lebowitz et al. (2023) Lebowitz, S., Emonts, B., Terndrup, D., et al. 2023, submitted to ApJ.
- Lee et al. (2023) Lee, K., Kohno, K., Hatsukade, B., et al. 2023, ApJ, 944, 35
- Lehnert et al. (1992) Lehnert, M. D., Heckman, T. M., Chambers, K. C., et al. 1992, ApJ, 393, 68
- Li et al. (2021) Li, J., Emonts, B. H. C., Cai, Z., et al. 2021, ApJL, 922, L29. doi:10.3847/2041-8213/ac390d
- Li et al. (2023) Li, J., Emonts, B. H. C., Cai, Z., et al. 2023, ApJ, in press. (arXiv:2304.02041)
- Mandal et al. (2021) Mandal, A., Mukherjee, D., Federrath, C., et al. 2021, MNRAS, 508, 4738. doi:10.1093/mnras/stab2822
- McCarthy et al. (1987a) McCarthy, P. J., Spinrad, H., Djorgovski, S., et al. 1987a, ApJL, 319, L39
- McCarthy et al. (1987b) McCarthy P. J., van Breugel W., Spinrad H., Djorgovski S., 1987b, ApJL, 321, L29
- McCarthy et al. (1990) McCarthy, P. J., Spinrad, H., van Breugel, W., et al. 1990, ApJ, 365, 487
- McCarthy et al. (1992) McCarthy, P. J., Elston, R., & Eisenhardt, P. 1992, ApJL, 387, L29
- McCarthy (1993) McCarthy, P. J. 1993, ARAA, 31, 639
- McCarthy et al. (1995) McCarthy, P. J., Spinrad, H., & van Breugel, W. 1995, ApJS, 99, 27
- Mellema, Kurk, & Röttgering (2002) Mellema G., Kurk J. D., Röttgering H. J. A., 2002, A&A, 395, L13. doi:10.1051/0004-6361:20021408
- Meenakshi et al. (2022) Meenakshi, M., Mukherjee, D., Wagner, A. Y., et al. 2022, MNRAS, 516, 766. doi:10.1093/mnras/stac2251
- Miley (1980) Miley, G. 1980, ARAA, 18, 165
- Miley et al. (2006) Miley, G. K., Overzier, R. A., Zirm, A. W., et al. 2006, ApJL, 650, L29
- Miley & De Breuck (2008) Miley, G., & De Breuck, C. 2008, AARv, 15, 67
- Morganti et al. (2002) Morganti, R., Oosterloo, T. A., Tinti, S., et al. 2002, AA, 387, 830
- Morganti et al. (2011) Morganti, R., Holt, J., Tadhunter, C., et al. 2011, A&A, 535, A97
- Murphy (2018) Murphy, E. 2018, Science with a Next Generation Very Large Array, ASPC, 517
- Murthy et al. (2020) Murthy, S., Morganti, R., Emonts, B., et al. 2020, AA, 643, A74
- Nesvadba et al. (2009) Nesvadba N. P. H., Neri R., De Breuck C., Lehnert M. D., Downes D., Walter F., Omont A., et al., 2009, MNRAS, 395, L16. doi:10.1111/j.1745-3933.2009.00631.x
- Nesvadba et al. (2017) Nesvadba, N. P. H., De Breuck, C., Lehnert, M. D., et al. 2017, AA, 599, A123
- Nesvadba et al. (2020) Nesvadba, N. P. H., Bicknell, G. V., Mukherjee, D., et al. 2020, AA, 639, L13
- Overzier et al. (2005) Overzier, R. A., Harris, D. E., Carilli, C. L., et al. 2005, A&A, 433, 87
- Overzier (2006) Overzier, R. A. 2006, Ph.D. Thesis, Leiden University
- Papadopoulos et al. (2008) Papadopoulos P. P., Feain I. J., Wagg J., Wilner D. J., 2008, ApJ, 684, 845. doi:10.1086/590233
- Pentericci et al. (1999) Pentericci, L., Röttgering, H. J. A., Miley, G. K., et al. 1999, A&A, 341, 329. doi:10.48550/arXiv.astro-ph/9809056
- Pentericci et al. (2000) Pentericci, L., Van Reeven, W., Carilli, C. L., et al. 2000, AAS, 145, 121
- Pentericci et al. (2001) Pentericci, L., McCarthy, P. J., Röttgering, H. J. A., et al. 2001, ApJS, 135, 63
- Prochaska & Hennawi (2009) Prochaska J. X., Hennawi J. F., 2009, ApJ, 690, 1558. doi:10.1088/0004-637X/690/2/1558
- Randall et al. (2011) Randall, K. E., Hopkins, A. M., Norris, R. P., et al. 2011, MNRAS, 416, 1135
- Rees (1989) Rees M. J., 1989, MNRAS, 239, 1P. doi:10.1093/mnras/239.1.1P
- Reuland et al. (2003) Reuland, M., van Breugel, W., Röttgering, H., et al. 2003, ApJ, 592, 755
- Reuland et al. (2007) Reuland, M., van Breugel, W., de Vries, W., et al. 2007, AJ, 133, 2607
- Roettgering et al. (1994) Roettgering, H. J. A., Lacy, M., Miley, G. K., et al. 1994, AAS, 108, 79
- Roettgering et al. (1997) Roettgering, H. J. A., van Ojik, R., Miley, G. K., et al. 1997, AA, 326, 505
- Rocca-Volmerange et al. (2004) Rocca-Volmerange, B., Le Borgne, D., De Breuck, C., et al. 2004, AA, 415, 931
- Salomé, Salomé, & Combes (2015) Salomé Q., Salomé P., Combes F., 2015, A&A, 574, A34. doi:10.1051/0004-6361/201424932
- Saxena et al. (2018) Saxena, A., Jagannathan, P., Röttgering, H. J. A., et al. 2018, MNRAS, 475, 5041. doi:10.1093/mnras/sty152
- Seymour et al. (2007) Seymour, N., Stern, D., De Breuck, C., et al. 2007, ApJS, 171, 353
- Solomon & Vanden Bout (2005) Solomon, P. M. & Vanden Bout, P. A. 2005, ARA&A, 43, 677. doi:10.1146/annurev.astro.43.051804.102221
- Smail et al. (2003) Smail, I., Scharf, C. A., Ivison, R. J., et al. 2003, ApJ, 599, 86
- Spinrad et al. (1981) Spinrad, H., Stauffer, J., & Butcher, H. 1981, ApJ, 244, 382. doi:10.1086/158715
- Stern et al. (1999) Stern, D., Dey, A., Spinrad, H., et al. 1999, AJ, 117, 1122
- Stevens et al. (2003) Stevens, J. A., Ivison, R. J., Dunlop, J. S., et al. 2003, Nature, 425, 264
- Sutherland, Bicknell, & Dopita (2003) Sutherland R. S., Bicknell G. V., Dopita M. A., 2003, ApJ, 591, 238. doi:10.1086/375294
- Swinbank et al. (2015) Swinbank, A. M., Vernet, J. D. R., Smail, I., et al. 2015, MNRAS, 449, 1298
- Tadhunter et al. (2000) Tadhunter, C. N., Villar-Martin, M., Morganti, R., et al. 2000, MNRAS, 314, 849
- Tadhunter et al. (2011) Tadhunter, C., Holt, J., González Delgado, R., et al. 2011, MNRAS, 412, 960
- van Breugel et al. (1985) van Breugel, W., Miley, G., Heckman, T., et al. 1985, ApJ, 290, 496
- van Ojik et al. (1996) van Ojik, R., Roettgering, H. J. A., Carilli, C. L., et al. 1996, AA, 313, 25
- Venemans et al. (2007) Venemans, B. P., Röttgering, H. J. A., Miley, G. K., et al. 2007, A&A, 461, 823
- Vernet et al. (2001) Vernet, J., Fosbury, R. A. E., Villar-Martín, M., et al. 2001, AA, 366, 7
- Vernet et al. (2017) Vernet, J., Lehnert, M. D., De Breuck, C., et al. 2017, AA, 602, L6
- Villar-Martín et al. (1999) Villar-Martín, M., Tadhunter, C., Morganti, R., et al. 1999, MNRAS, 307, 24
- Villar-Martín et al. (2002) Villar-Martín, M., Vernet, J., di Serego Alighieri, S., et al. 2002, MNRAS, 336, 436
- Villar-Martín et al. (2003) Villar-Martín, M., Vernet, J., di Serego Alighieri, S., et al. 2003, MNRAS, 346, 273
- Villar-Martín et al. (2006) Villar-Martín, M., Sánchez, S. F., De Breuck, C., et al. 2006, MNRAS, 366, L1
- Villar-Martín et al. (2007a) Villar-Martín, M., Humphrey, A., De Breuck, C., et al. 2007a, MNRAS, 375, 1299
- Villar-Martín et al. (2007b) Villar-Martín, M., Sánchez, S. F., Humphrey, A., et al. 2007b, MNRAS, 378, 416
- Villar-Martín et al. (2017) Villar-Martín, M., Emonts, B., Cabrera Lavers, A., et al. 2017, MNRAS, 472, 4659
- Wright (2006) Wright, E. L. 2006, PASP, 118, 1711
- Wang et al. (2021) Wang, W., Wylezalek, D., De Breuck, C., et al. 2021, A&A, 654, A88. doi:10.1051/0004-6361/202141558
- West (1994) West, M. J. 1994, MNRAS, 268, 79. doi:10.1093/mnras/268.1.79
- Wylezalek et al. (2013) Wylezalek, D., Galametz, A., Stern, D., et al. 2013, ApJ, 769, 79
- Zhong et al. (2023) Zhong, Y., Inoue, A. K., Sugahara, Y., et al. 2023, MNRAS, 522, 6123. doi:10.1093/mnras/stad1428
- Zinn et al. (2013) Zinn P.-C., Middelberg E., Norris R. P., Dettmar R.-J., 2013, ApJ, 774, 66. doi:10.1088/0004-637X/774/1/66