These authors contributed equally to this work.
These authors contributed equally to this work.
1]\orgdivStern School of Business, \orgnameNew York University, \orgaddress\cityNew York, \postcode10003, \stateNY
Using Internal Bar Strength as a Key Indicator for Trading Country ETFs
Abstract
In this report, we aim to investigate the effectiveness of using internal bar strength (IBS) as a key indicator for trading country exchange-traded funds (ETFs). The study uses a quantitative approach to analyze historical price data for a bucket of country ETFs over a period of 10 years and use the idea of Mean Reversion to create a profitable trading strategy. Our findings suggest that IBS can be a useful technical indicator for predicting short-term price movements in this basket of ETFs.
keywords:
Systematic Trading, Internal Bar Strength, Exchange Traded Funds (ETFs), Quantitative Analysis, Country Selection Strategies, Mean Reversion1 Introduction
The Internal Bar Strength Indicator measures the position current trading session’s close relative to the session’s high-low range. It is generally used as an indicator of mean-reversion.
Pagonidis [1] proposed that stocks that close with an IBS below 0.2, will rise in price the next day, while stocks that close with an IBS above 0.8, will often decline in value in the following session.
These findings were on daily data of various ETFs covering the period from the inception for each ETF to 5/12/2013. We tested this on more recent data to find similar results. Our approach is similar to the above mentioned one in which if the IBS of a country ETF is low, it suggests that the price has closed near the low of its daily range, which may indicate that the market is oversold and due for a bounce back up. This could be an opportunity to enter a long position with the expectation that the price will rise.
Conversely, if the IBS of a country ETF is high, it suggests that the price has closed near the high of its daily range, which may indicate that the market is overbought and due for a correction or pullback. This could be an opportunity to enter a short position with the expectation that the price will fall.
We present a strategy based on this that aims to be always in and hedge across multiple ETFs. We also present modifications to this strategy that show how changes in holding periods and number of ETFs invested in affects the performance of the strategy.
2 Data and Methodology
2.1 Data
Our analysis uses ETF data from 2009/1/1 to 2019/12/31. ETF data is sourced from Yahoo Finance [2]. The descriptions are in Table 1.
| Country | Ticker | ETF |
|---|---|---|
| India | PIN | Invesco India ETF |
| China | FXI | iShares MSCI China Large-Cap ETF |
| South Korea | EWI | iShares MSCI Italy ETF |
| Mexico | EWW | iShares MSCI Mexico ETF |
| South Africa | EZA | iShares MSCI South Africa ETF |
| Taiwan | EWT | iShares MSCI Taiwan ETF |
| Japan | EWJ | iShares MSCI Japan ETF |
| USA | IVV | iShares Core S&P 500 ETF |
| UK | EWU | iShares MSCI United Kingdom ETF |
| EU | EZU | iShares MSCI Eurozone ETF |
| Australia | EWA | iShares MSCI Australia ETF |
| Singapore | EWS | iShares MSCI Singapore ETF |
| Canada | EWC | iShares MSCI Canada ETF |
| Israel | EIS | iShares MSCI Israel ETF |
| Brazil | EWZ | iShares MSCI Brazil ETF |
2.2 Methodology
IBS over days is calculated as:
| (1) |
where the and could be calculated over -days ( being the default)
takes values from 0 (close is lowest) to 1 (close is highest).
We analysed our data in Python using Numpy and Pandas. Charts were created using Seaborn.
3 The Strategy
The threshold strategy is used on individual ETFs and has varying performance. We show this performance in Table 2.
| Strategy/ETF | Sharpe Ratio | Time In |
|---|---|---|
| IBS Min-Max | 2.907858 | 100% |
| PIN | 2.166918 | 54.463% |
| EWJ | 1.585597 | 41.489% |
| EWI | 1.475513 | 46.91% |
| EIS | 1.259877 | 47.488% |
| EZA | 1.080578 | 45.573% |
| FXI | 1.051496 | 39.357% |
| EWA | 0.974023 | 45.356% |
| EWT | 0.956515 | 42.031% |
| EZU | 0.708747 | 48.103% |
| EWS | 0.665158 | 43.188% |
| EWZ | 0.482336 | 44.958% |
| EWU | 0.288471 | 43.802% |
| IVV | 0.200902 | 48.066% |
| EWW | -0.192655 | 46.765% |
| EWC | -0.451279 | 44.814% |
However, the time in for these strategies is low which hurts the Sharpe Ratio. Our strategy takes a basket of multiple ETFs and considers daily IBS values for all.
We also include a the probabilities of getting a positive return on following a threshold bases strategy in Table 3. These probabilities are similar to the ones seen in [1] for the probability of an Up day split by IBS quintiles.
| Ticker | Long on IBS <0.2 | Short on IBS >0.8 |
|---|---|---|
| EWJ | 0.606061 | 0.514364 |
| EIS | 0.587719 | 0.513981 |
| PIN | 0.580692 | 0.578240 |
| EWT | 0.572383 | 0.502770 |
| FXI | 0.567686 | 0.523052 |
| IVV | 0.565502 | 0.460481 |
| EZU | 0.552209 | 0.476647 |
| EWS | 0.550308 | 0.514563 |
| EWI | 0.548000 | 0.511222 |
| EWZ | 0.543672 | 0.508006 |
| EZA | 0.540835 | 0.509859 |
We see that the distribution of minimum and maximum IBS values is heavy-tailed. The minimum values skew towards 0 and the maximum values skew towards 1.
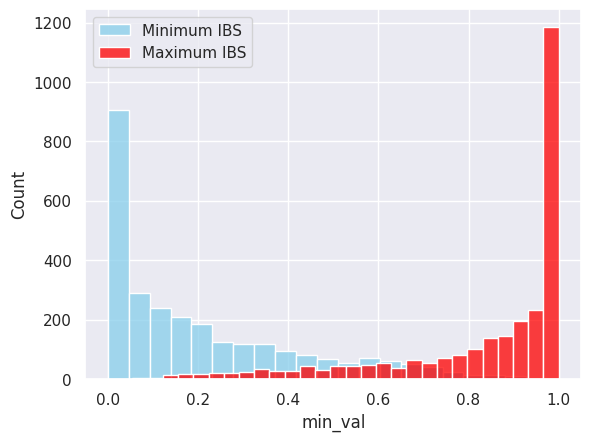
We then implement a min-max strategy which goes long on the ETF which has the minimum IBS of that day and goes short on the ETF which has the maximum IBS of that day.
We enter at close of the current day and exit at the close of the next day. This gives us much better results overall. We have included a snippet of our strategy performance when we randomize the basket size and choice of ETFs in the basket.
| ETF Basket | SR | Long Only SR | Short Only SR | N (No. of ETFs) |
|---|---|---|---|---|
| india, tw, can, israel, uk, spore, aus | 3.904 | 1.705 | 0.839 | 2 |
| india, tw, can, israel, uk, spore, aus | 3.733 | 1.997 | 1.246 | 1 |
| israel, tw, japan, spore, sk, india | 3.424 | 1.541 | 0.968 | 2 |
| spore, india, usa, aus, israel, uk | 3.354 | 1.562 | 0.621 | 2 |
| uk, india, sk, spore, china, eu | 3.311 | 1.475 | 1.200 | 1 |
| china, uk, india, sk, spore, can | 3.279 | 1.472 | 1.234 | 1 |
| china, uk, india, sk, spore, can | 3.201 | 1.310 | 0.772 | 2 |
| uk, india, sk, spore, china, eu | 3.184 | 1.257 | 0.791 | 2 |
| spore, india, usa, aus, israel, uk | 3.153 | 1.742 | 1.015 | 1 |
| brazil, aus, tw, china, uk, sa, india | 3.089 | 1.338 | 0.724 | 2 |
In our opinion, choosing from a basket of country ETFs based on their IBS offers advantages compared to just using a single pair of ETFs.
Using a basket of ETFs can provide diversification benefits by spreading the risk across multiple countries, rather than constantly re-using the same pair. This helps reduce the overall risk.
Using a basket of ETFs also allows for more opportunities for trading. With multiple countries in the basket, there are more frequent opportunities for trades based on IBS signals as there is a much higher probability of having the and of the ETFs in the desired thresholds or having these values sufficiently low/high.
4 Results
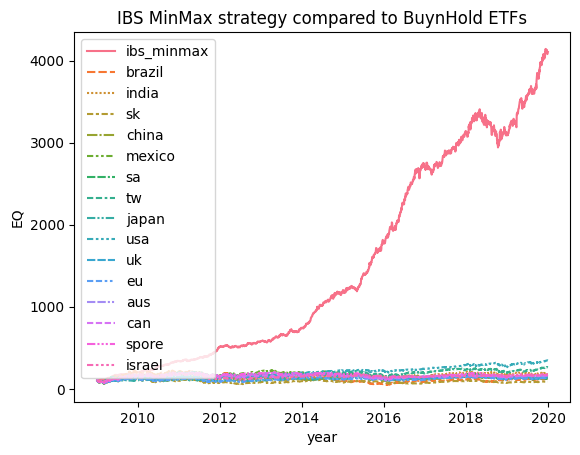
4.1 Comparing the performance to buy and hold strategy
The strategy significantly outperforms a buy and hold strategy for all ETFs that we considered.
4.2 Comparing the performance across basket sizes
We ran our strategy on random combinations ranging from size 2 to size 14 of the ETFs in Table 1. We see a trend of increasing Sharpe ratios with an increase in basket size.
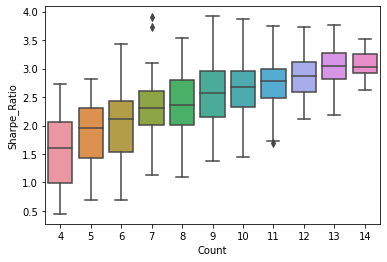
This can be alluded to a higher likelihood of the minimum and maximum IBS values being closer to 0 and 1 respectively (i.e. if .
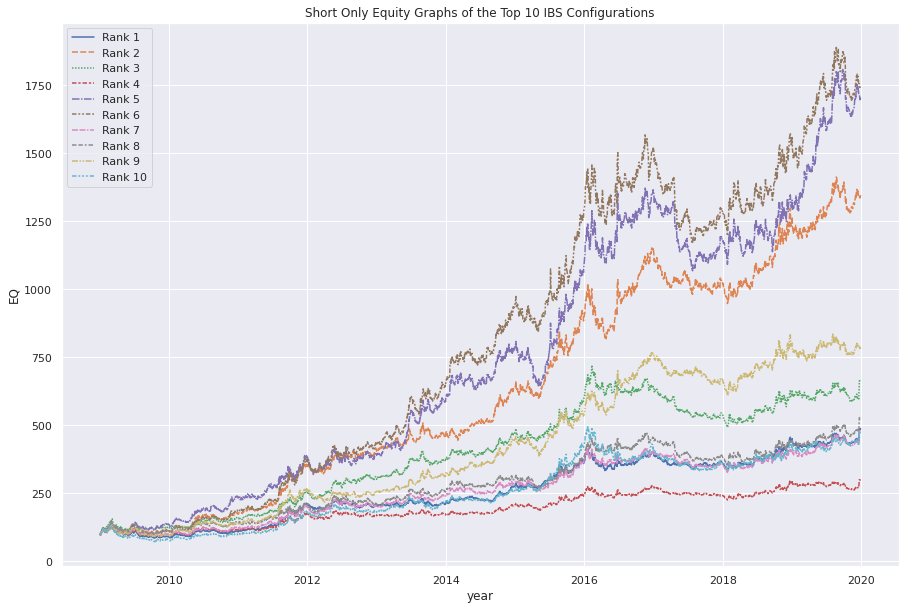
4.3 Comparing the performance between long only and short only strategies
We see that long only strategies have a relatively higher Sharpe Ratio than short only strategies (see Table 4) and generally tend to perform better equity graphs.
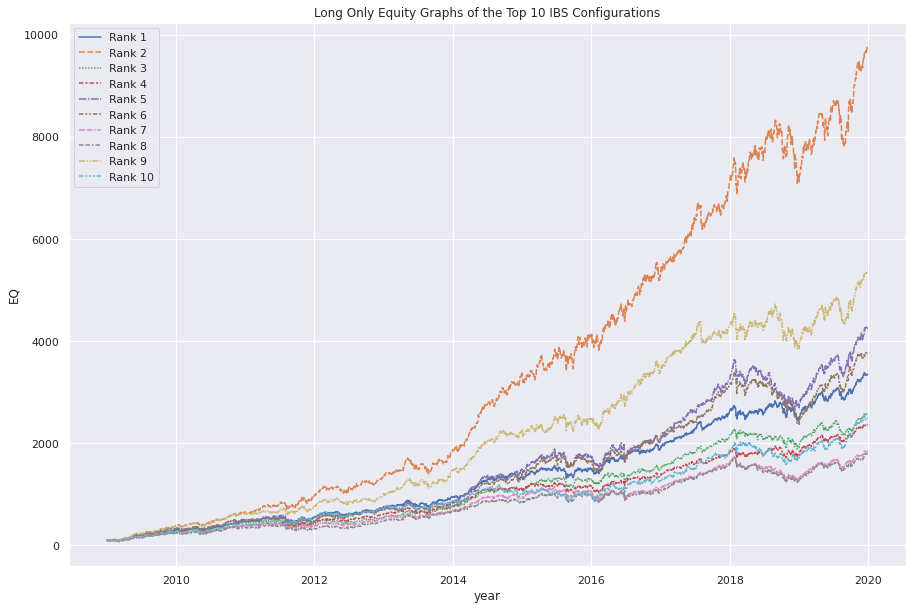
4.4 Comparing the performance across multi-ETF trades
We modify our strategy slightly by sorting the IBS values and pick the top-N and bottom-N ETFs to go short and long on respectively.
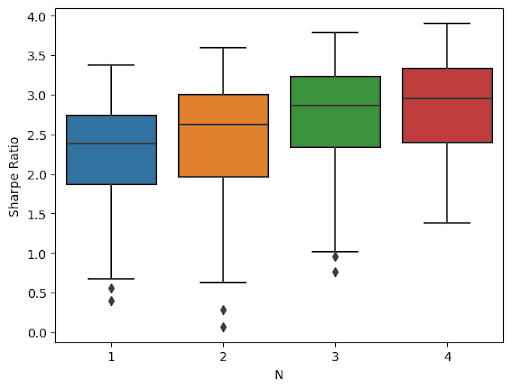
An increase in N, increases the Sharpe ratio. As we go long (or short) on multiple ETFs we hedge against an ETF that performs against expectations.
4.5 Comparing the performance across multi-day holding periods
All the previous strategies were over a 1-day holding period. The strategy below varies the holding period between 1 and 4 days.
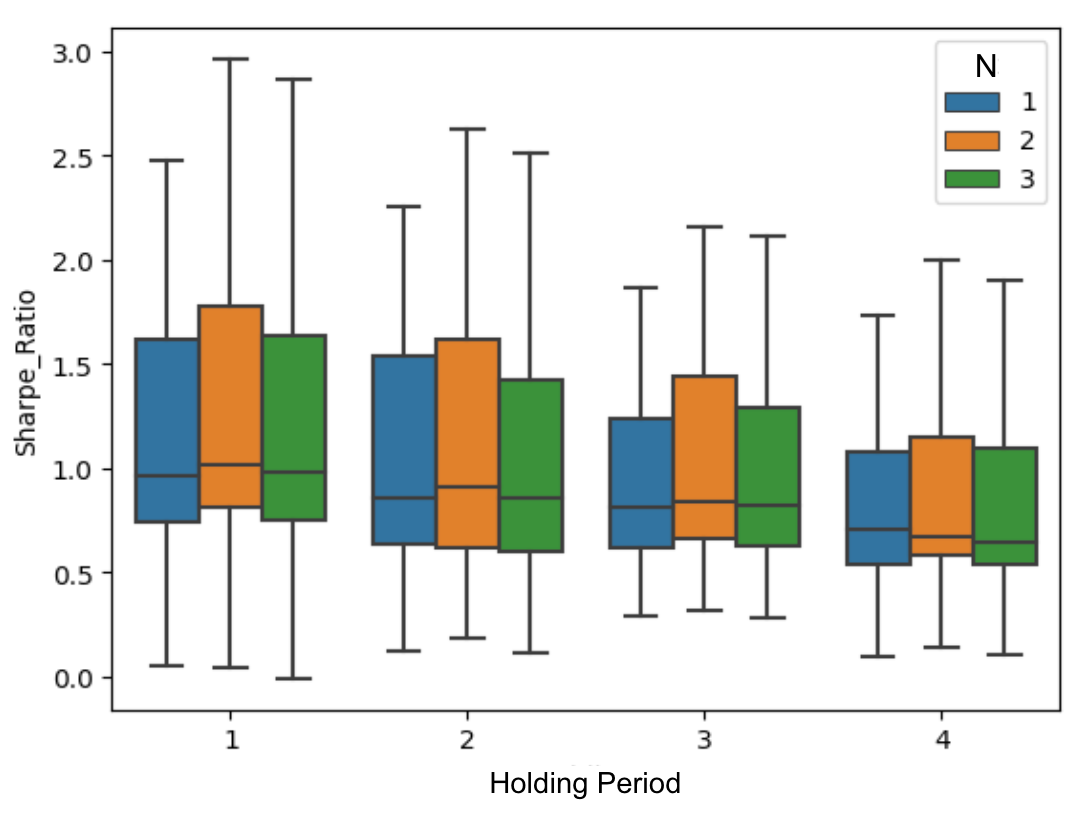
We see a general drop in performance as holding period increases. The 1 day IBS indicator does not seem to have an effect beyond horizons of one day.
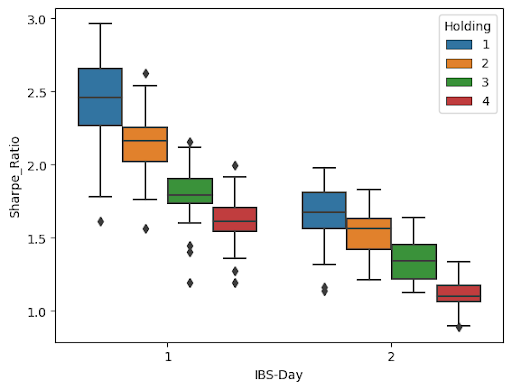
4.6 Comparing the performance across multi-day IBS calculations
We tried to calculated IBS over a 2-day period. This strategy also sees a drop in performance compared to a 1-day IBS metric.
4.7 Comparing Close-to-Close MinMax with Open-to-Open MinMax
All the strategies so far have been Close-to-Close trades. We compare this with an Open-to-Open strategy to see the importance of getting in at Close.
| ETF_Basket | Close to Close | Open To Open |
|---|---|---|
| india, tw, can, israel, uk, spore, aus | 3.733541 | -0.250662 |
| uk, india, sk, spore, china, eu | 3.311943 | -0.011744 |
| china, uk, india, sk, spore, can | 3.279045 | 0.286050 |
| spore, india, usa, aus, israel, uk | 3.153894 | -0.269298 |
| brazil, india, sa, japan, tw, spore | 2.873541 | 0.262017 |
| aus, brazil, sa, india, eu, tw, spore | 2.869931 | 0.181264 |
| sa, can, china, uk, india | 2.822592 | 0.251654 |
| brazil, aus, tw, china, uk, sa, india | 2.789485 | 0.142810 |
| israel, tw, japan, spore, sk, india | 2.735891 | -0.124966 |
| brazil, spore, can, sa, china, india, mexico | 2.733041 | 0.362022 |
As seen from Table 5 the Sharpe Ratios for a Close-to-Close strategy are not good underlying the importance of getting in at close.
4.8 Comparing MinMax strategy to a Threshold based strategy over ETF baskets
We go back to the threshold strategy. Instead of implementing it on a single ETF, we implement it over our ETF baskets. It goes long and short on ETFs if their respective IBS values exceed predefined thresholds.
Note: The strategy does not enter a trade unless both long and short thresholds are crossed.
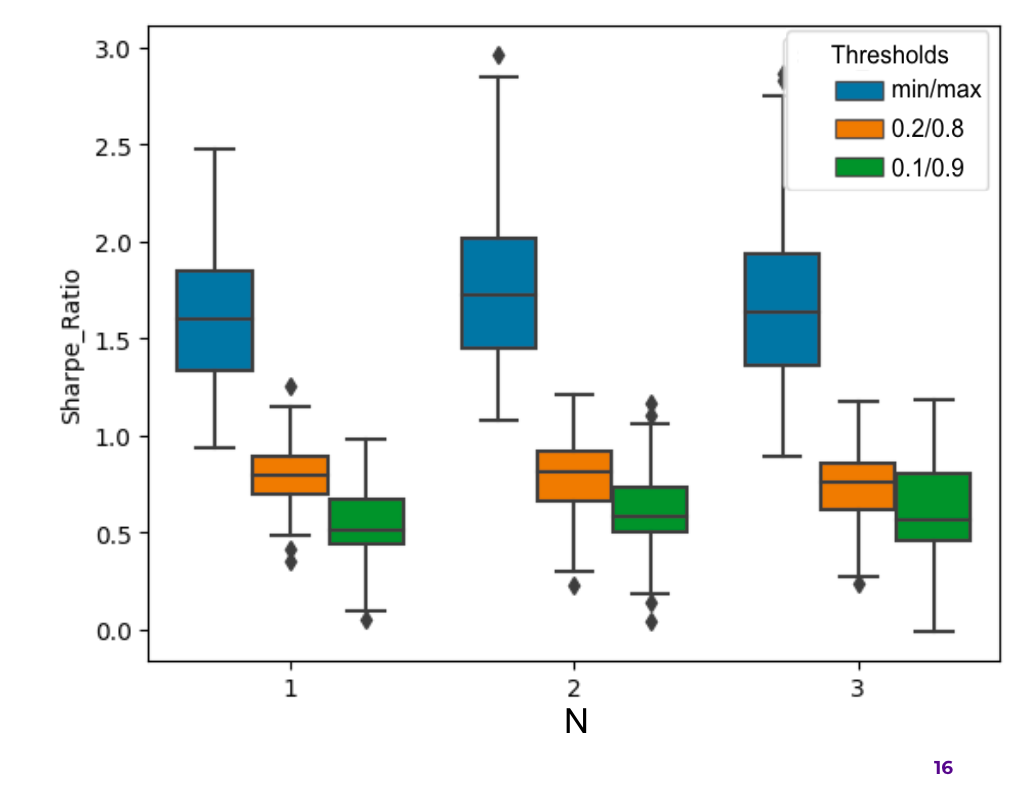
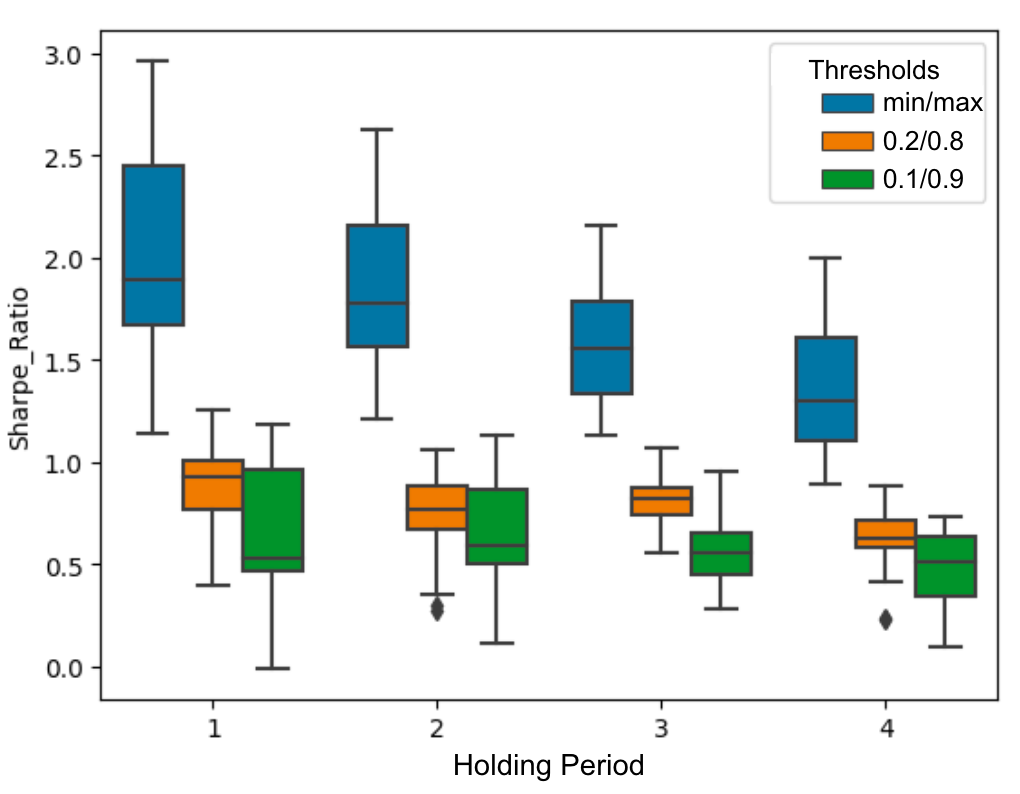
We compare the above strategy with our MinMax strategy across holding periods as well as multi-ETF trades. The threshold strategies universally have a worse performance than the MinMax strategies.
5 Effect of Trading Costs and Slippage
IBS is calculated at the Close. Our strategy also enters at the Close price. In practice, this is difficult to setup. Realistically, we can calculate the IBS taking the price just before close and then entering (or not) right after. This will result in slippage and may affect performance
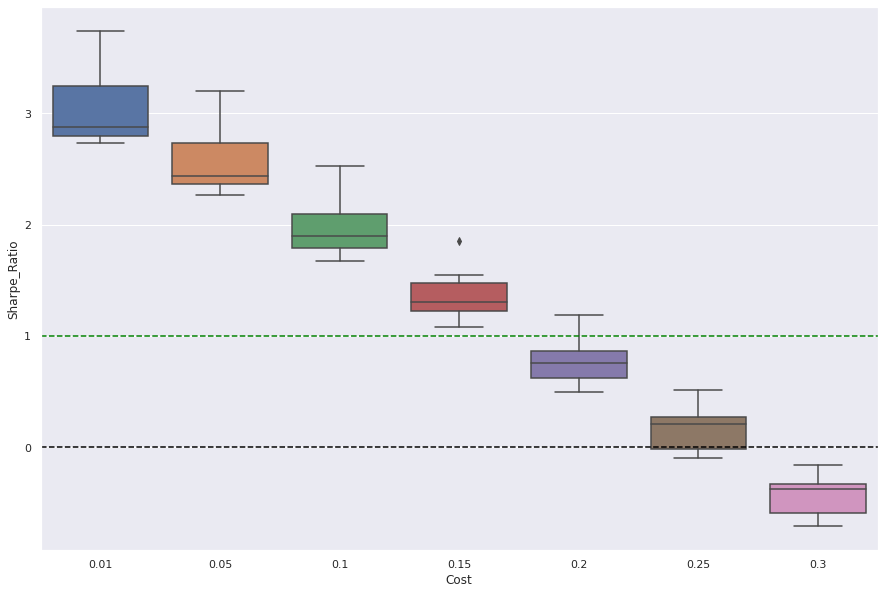
Shorting ETFs also has an additional borrow cost. We have assumed a borrow rate of 0.01% daily. However, this rate is not constant and varies across ETFs. We performed an analysis which compares strategy performs across a range of interest rates which can be seen in Table 6. The strategy performs reasonably well till a borrow rate of around 0.15% daily (approx. 55.75% annual) after which borrow costs negate performance.
In situations where borrow rates are high, a long-only strategy would still perform well (See Table 4).
| ETF Basket vs Daily Borrowing Costs | 0.01% | 0.05% | 0.1% | 0.15% | 0.2% | 0.25% | 0.3% |
| india, tw, can, israel, uk, spore, aus | 3.733 | 3.197 | 2.526 | 1.856 | 1.185 | 0.515 | -0.155 |
| uk, india, sk, spore, china, eu | 3.311 | 2.808 | 2.178 | 1.548 | 0.919 | 0.289 | -0.339 |
| china, uk, india, sk, spore, can | 3.279 | 2.770 | 2.134 | 1.499 | 0.863 | 0.227 | -0.408 |
| spore, india, usa, aus, israel, uk | 3.153 | 2.622 | 1.957 | 1.292 | 0.627 | -0.037 | -0.702 |
| brazil, india, sa, japan, tw, spore | 2.873 | 2.451 | 1.924 | 1.397 | 0.870 | 0.342 | -0.184 |
| aus, brazil, sa, india, eu, tw, spore | 2.869 | 2.426 | 1.872 | 1.317 | 0.763 | 0.209 | -0.345 |
| sa, can, china, uk, india | 2.822 | 2.360 | 1.782 | 1.203 | 0.625 | 0.047 | -0.530 |
| brazil, aus, tw, china, uk, sa, india | 2.789 | 2.360 | 1.824 | 1.288 | 0.752 | 0.216 | -0.319 |
| israel, tw, japan, spore, sk, india | 2.735 | 2.263 | 1.673 | 1.083 | 0.493 | -0.097 | -0.687 |
| brazil, spore, can, sa, china, india, mex | 2.733 | 2.271 | 1.695 | 1.119 | 0.542 | -0.033 | -0.610 |
ETFs trades are subject to commissions depending on the trading platform used. Interactive Brokers [3] for example charges $0 commissions for trade volumes under 300,000 shares. However, commissions apply in a tiered manner for volumes higher than that. We have not factored in costs of commissions in our analysis.
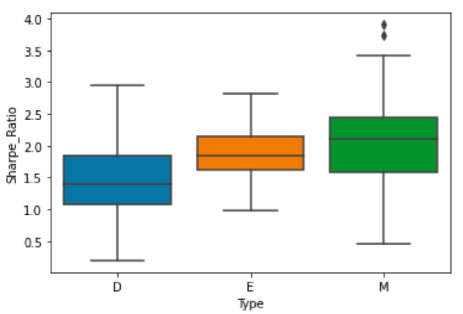
6 Performance of Emerging vs Developed Economies ETFs
As the ETFs we picked are all country specific, we applied our strategy by splitting our ”master” basket into an emerging economies basket and developed economies basket.
We used MSCI’s market classification [4] to split these ETFs as follows -
Emerging Economies - Brazil, India, South Korea, China, Mexico, South Africa and Taiwan
Developed Economies - Japan, USA, UK, EU, Australia, Canada, Singapore and Israel.
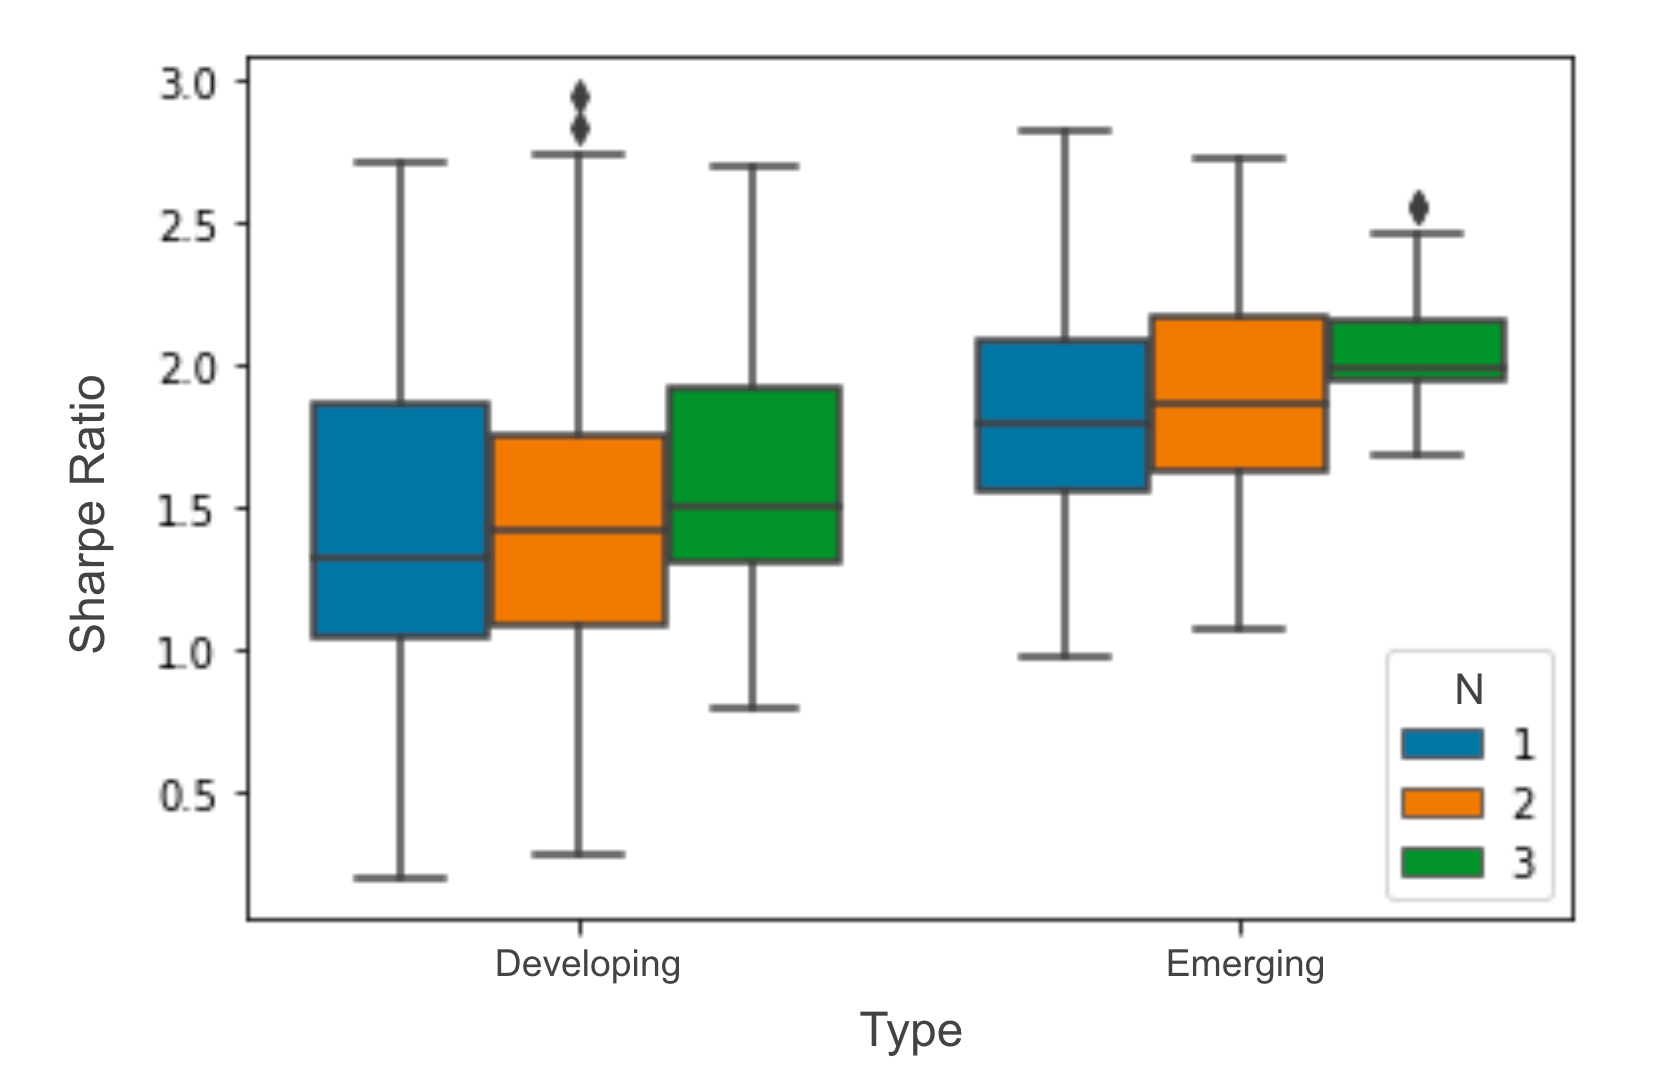
We see that while emerging market ETFs had a higher mean and median Sharpe ratio for single and multi-ETF strategies, developed market ETFs had the best performing bucket (EU, Australia, Japan, Singapore, Israel, UK at 2.9).
(From Emerging + Developed Buckets Only)
| ETF_Basket | Sharpe_Ratio | Type |
|---|---|---|
| eu, aus, japan, spore, israel, uk | 2.942 | Developed |
| spore, uk, israel, eu, can, aus | 2.830 | Developed |
| tw, sa, china, india | 2.819 | Emerging |
| spore, uk, usa, israel, japan, aus | 2.733 | Developed |
| india, tw, sa, china, sk | 2.724 | Emerging |
(From Emerging + Developed + Mixed Buckets)
| ETF Basket | Sharpe Ratio | Type |
|---|---|---|
| india, tw, can, israel, uk, spore, aus | 3.904 | Mixed |
| india, tw, can, israel, uk, spore, aus | 3.733 | Mixed |
| israel, tw, japan, spore, sk, india | 3.424 | Mixed |
| spore, india, usa, aus, israel, uk | 3.354 | Mixed |
| uk, india, sk, spore, china, eu | 3.311 | Mixed |
7 Conclusion
We attempt to build on the Pagonidis’ findings [1]. Initially, we corroborate their findings on likelihood of mean reversion based on IBS thresholds in Table 3 on recent data.
The analysis reiterates that IBS is a strong predictor of close-to-close returns on equity ETFs. We present a new strategy that aims to maximise the IBS effect by combining ETFs in a basket and going long and short on ETFs with maximum and minimum IBS values.
The analysis includes modifications of the above strategy where aspects such as - holding period, number of held ETFs, IBS calculation periods - among others are varied.
The presented strategy also outperforms the threshold-based strategy on multiple metrics largely due to having a 100% time-in. Our approach to use a bucket of ETFs also reduces the risk of being over-reliant on any one ETF as the signal is calculated daily and by picking more than one ETF per day, the returns are averaged between them.
We must note that while our proposed strategy does well by going long and short on various ETFs, any trading costs including Commissions, Borrow Rate and Slippage could reduce the performance of the strategy - especially on the Short Side [5]. While we have tried to include some of these costs while calculating and presenting our results, real world costs might vary.
References
- [1] A. S. Pagonidis, “The ibs effect: Mean reversion in equity etfs,” 2013.
- [2] Yahoo, “Yahoo finance.” https://finance.yahoo.com/, 2023.
- [3] I. Brokers, “Commissions.” https://www.interactivebrokers.com/en/pricing/commissions-home.php, year = ”2023”.
- [4] MSCI, “Msci market classification.” https://www.msci.com/our-solutions/indexes/market-classification, 2022.
- [5] IHS-Markit, “Why it pays to lend etfs.” https://cdn.ihs.com/www/pdf/Why-it-pays-to-lend-ETFs-brochure.pdf, 2017.