The OH Megamaser Emission in Arp 220: the rest of the story
Abstract
The OH Megamaser emission in the merging galaxy Arp 220 has been re-observed with the Multi-Element Radio Linked Interferometer Network (MERLIN) and the European VLBI Network (EVN). Imaging results of the OH line emission at the two nuclei are found to be consistent with earlier observations and confirm additional extended emission structures surrounding the nuclei. Detailed information about the distributed emission components around the two nuclei has been obtained using a concatenated MERLIN and EVN database with intermediate (40 mas) spatial resolution. Continuum imaging shows a relatively compact West nucleus and a more extended East nucleus in addition to an extended continuum ridge stretching below and beyond the two nuclei. Spectral line imaging show extended emission regions at both nuclei together with compact components and additional weaker components north and south of the West nucleus. Spectral line analysis indicates that the dominant OH line emission originates in foreground molecular material that is part of a large-scale molecular structure that engulfs the whole nuclear region. Compact OH components are representative of star formation regions within the two nearly edge-on nuclei and define the systemic velocities of East and West as 5425 km s-1 and 5360 km s-1. The foreground material at East and West has a 100 km s-1 lower velocity at 5314 and 5254 km s-1. These emission results confirm a maser amplification scenario where the background continuum and the line emission of the star formation regions are amplified by foreground masering material that is excited by the FIR radiation field originating in the two nuclear regions.
keywords:
masers ISM: molecules radio lines: ISM galaxies:ISM galaxies: nuclei radio lines: galaxies1 Introduction
The interacting system IC 4553/4, also known as Arp 220, is the host galaxy system of the first known hydroxyl (OH) MegaMaser (OHMM; Baan et al., 1982). The OH emission in Arp 220 was discovered at the Arecibo Observatory during a search for OH absorption in sources with strong HI absorption (Mirabel, 1982). The extraordinary properties of Arp 220 were later confirmed by the far-infrared (FIR) prominence in the Infrared Astronomical Satellite (IRAS) data (Soifer et al., 1984; Sanders et al., 1988), and the source became the prototype of the Ultra-Luminous InfraRed Galaxy (ULIRG) population (Sanders & Mirabel, 1996). Subsequent searches for OHMM emission have resulted in about 120 systems among the ULIRG population (Baan, 1989; Darling & Giovanelli, 2002; Klöckner, 2004; Zhang et al., 2014).
Arp 220 is a merger system with two radio nuclei (Baan & Haschick, 1995) embedded in a chaotic optical structure (Lockhart et al., 2015). The ongoing merger has triggered a powerful burst of star formation at each of the nuclei (Scoville et al., 1997), which results in the FIR prominence and multiple radio supernova remnants (SNRs) at each of the nuclei (Smith et al., 1998; Lonsdale et al., 2006; Varenius et al., 2019), as well as starburst (SB)-related hard X-ray emission (Clements et al., 2002; Iwasawa et al., 2005). Arp 220 is a (nearby) template for high redshift active galaxies with short-lived bursts of assembly and nuclear activity that appear to be common at redshifts of 2.5 and define the characteristics of massive galaxies in the nearby Universe.
The radio positions of the two nuclei in Arp 220 are separated by 0.97″ (371 pc) on the plane of the sky (Baan & Haschick, 1995; Downes & Solomon, 1998; Sakamoto et al., 1999), while the optical images show a dust-enshrouded structure (Wilson et al., 2006; Lockhart et al., 2015). A radio continuum bridge between and below the two nuclei is the only evidence for the interactive nature of the system. However, because of the puzzling nature of the system, the systemic velocities of the two underlying nuclei remain to be determined. A reinterpretation of the early Very Large Array (VLA) A-array observations of the 1667 and 1665 MHz OH emission in Arp 220 would suggest that the features of the East and West nuclei are merged within the observed spectral signatures and that the velocities of West and East are close to 5350 km s-1 and somewhat higher than 5390 km s-1, respectively (Baan & Haschick, 1984). Early Multi-Element Radio-Linked Interferometer Network (MERLIN) observations confirm that the 1667 MHz emission at the velocity of the Western nucleus appears close to the Eastern nucleus and that the velocity fields of the two nuclei may be mixed (Rovilos et al., 2003). The distribution of the CO emission also indicates that the velocities at the West and East nuclei are approximately at 5370 and 5400 km s-1 (Wheeler et al., 2020; Sakamoto et al., 2008; Rangwala et al., 2015). A study of the dynamics of Arp 220 based on early detection of formaldehyde and the corresponding OH emission employed similar velocities of 5346 and 5418 km s-1 at the West and East nuclei for understanding the nuclear antics of the system (Baan & Haschick, 1995). The formaldehyde emission in Arp 220 is found to extend across the central molecular zone of each of the nuclei and covers the systemic velocities of both nuclei (Baan et al., 2017). Arp 220 also exhibits an OH outflow feature that extends to 1000 km s-1 below the OH 1667 MHz feature (Baan et al., 1989).
The observed OH MM emission has been interpreted with an amplification scenario where foreground excited and masering material amplifies the background radio continuum (Baan, 1989). The OH emission would thus be superimposed on the radio structure of the source and the FIR emission regions generated by dust emission resulting from ongoing star formation, which has been suggested to serve as a pumping agent for the OH molecules in the foreground. Both compact high-brightness and extended low-brightness maser components could ensue in this manner.
The re-observations of the Arp 220 system of the complete 1667 and 1665 MHz emission spectrum presented in this paper have been taken with MERLIN and with the European VLBI Network (EVN) . Previous interferometric MERLIN and EVN observations only covered the prominent 1667 MHz OH emission originating at both nuclei. The lower resolution images from the MERLIN observations provide an integrated view of the OH emission in Arp 220 without fully detailing the structural components of Arp 220. The global Very Long Baseline Interferometry observations with the EVN provide a highly resolved view of the nuclear regions and only found compact emission components. In order to identify and image the two nuclei in more detail, the two data sets will be concatenated, which will give a data base with intermediate resolution and allows mapping the spatial structure of both the 1667 and 1665 MHz OH emission regions. And this new database reveals some of the hidden secrets of the Arp 220 system.

2 Observations and Data Reduction
Throughout this paper a Hubble constant = 70 km s-1 Mpc-1 has been assumed, which indicates that for the Arp 220 system, the angular-spatial size conversion results in 1 arcsecond corresponding to 382 pc. All results are presented using the optical helio-centric definition of velocity. For Arp 220, velocities are about 96 km s-1 lower using the radio definition.
2.1 MERLIN Observations and Data Reduction
The MERLIN observations of Arp 220 were carried out on 2003 June 24th and 25th with all seven MERLIN antennas, including the 76-metre Lovell telescope in left-hand circular polarisation mode. The data of the observing project MN/03B/22 were recorded in 128 channels covering a total bandwidth of 8 MHz, each with a channel width of 62.5 kHz, giving a velocity resolution of 11.66 km s-1 at 18 cm wavelength. The sources 3C 84, 3C 286, and J 1516+1932 were used as bandpass, flux density scale, and phase referencing calibrators, respectively. The whole observation of two sessions lasted 18 hours, two third of which was spent on Arp 220.
The preliminary amplitude calibration, bandpass and antenna-based phase calibration were made in the Astronomical Image Processing System (AIPS) using the calibrator sources. The gain solutions derived from the calibrators were applied to the Arp 220 data by interpolation. Then the Arp 220 data were exported out of the multi-source dataset and were imported into MIRIAD for self-calibration and imaging.
The data were first averaged in channels to produce a single-channel dataset, a so-called pseudo-continuum dataset. An image of Arp 220 was created using the pseudo-continuum data. After flagging some discrete bad data points induced by radio frequency interference (RFI) and other observational problems, this pseudo-continuum data was used for a few iterations of phase-only self-calibration with the time intervals starting from 5 minutes to 0.5 minutes until the dynamic range of the CLEANed image did not improve any more. A final image was produced with natural weighting (see Figure 1).
The antenna gains as a function of time determined in the self-cal procedure were applied to the line data. The Miriad task UVLIN was used to subtract the continuum emission from the visibility data by fitting a polynomial to the real and imaginary parts of the selected line-free channels across the line cube. The continuum and line data are employed separately to make the resulting maps.
2.2 EVN Observations and Data Reduction
Arp 220 was observed with the EVN from 2003 June 24th UT18:00 to June 25th UT03:30 with observing program EB022C. Twelve telescopes participated in the observations: Jodrell Bank, Effelsberg, Cambridge, Noto, Torun, Shanghai, Westerbork, Onsala, Medicina, Urumqi, Hartebeesthoek and Robledo. The observations were made in dual circular polarisation mode and the data were recorded in 256 channels. The total bandwidth is 8 MHz; therefore, each channel has a width of 31.25 kHz (corresponding to a velocity resolution of 5.83 km s-1 at 18 cm wavelength). OQ 208 was used as the bandpass calibrator and J 1613+3412 and J 1516+1932 were used as phase referencing calibrators. The whole observation lasted for 9.5 hours, during which Arp 220 was observed for 6 hours.
The calibration of the multiple-source dataset was made in AIPS. The data were first sorted in time-baseline sequence. The amplitude calibration was done using the system temperatures of the observations and the gain curves provided by each station. The phase errors induced by the ionospheric effects are corrected using the AIPS task TECOR. Fringe fitting was carried out with the compact and strong calibrators, and the derived solutions were then applied to the whole dataset to calibrate the delays, delay rates, and phases. Complex bandpass solutions were determined using the OQ 208 data. RFI was identified in the total power spectra and the affected channels were flagged. The phase, gain, and bandpass solutions derived from the calibrators were applied to Arp 220 data by interpolation. The source-rest-frame frequency was set to the line data and AIPS task CVEL was used to determine the Doppler shift correction on each baseline. The visibility amplitudes of the EVN calibrator data J 1516+1932 and OQ 208 were compared with those of the MERLIN data on common baselines, and they show consistency within 2 per cent. Considering the scattering of the EVN visibility amplitude and the variation of the telescope performance, we conservatively adopt an amplitude uncertainty of 5 per cent.
The calibrated data were exported from AIPS and imported into Miriad for further analysis. The line data were separated from the original data by using the task UVLIN, which fits the continuum emission with a linear function using line-free channel data and subtracts the fitted baseline from the line channels. Next, an iteration of self-calibration was applied to the line data on the line peak channels assuming a point source model. The line cubes were all mapped with natural weighting.
2.3 Combining the MERLIN and EVN data
A combination of MERLIN data with 280 x 260 mas with the EVN data set with resolution 10 x 10 mas would result in a data set with an intermediate resolution such that both the extended and the compact components in Arp 220 are both identifiable in a single image.
In order to further optimise the available data, the residual phase errors on the short (and most sensitive) EVN baselines and the alignment of the EVN and MERLIN phase centres were corrected by using an EVN continuum calibration iteration employing a reference model formed by the CLEAN models derived from the MERLIN continuum data.
The images resulting from the combined MERLIN and EVN (ME) data have a restoring beam of mas that will appropriately reveal the more extended emission regions at the nuclei as well as the very compact VLBI components.
3 MERLIN and EVN Imaging Results
Throughout this paper a Hubble constant = 70 km s-1 Mpc-1 has been assumed for interpreting the imaging results. For the Arp 220 system with a systemic velocity of about 5400 km s-1, the angular-spatial size conversion results in 1 arcsecond corresponding to 375 pc. All results are presented using the optical heliocentric definition of velocity. Other publications may use velocities using a radio definition, which for Arp 220 are about 96 km s-1 lower.
Throughout the paper the continuum and spectral line images show two crosses representing the dust emission peak positions of the two nuclei at 230 GHz (Sakamoto et al., 1999), which are in agreement with the continuum peaks from the current data sets.
3.1 MERLIN Imaging of the Continuum Emission
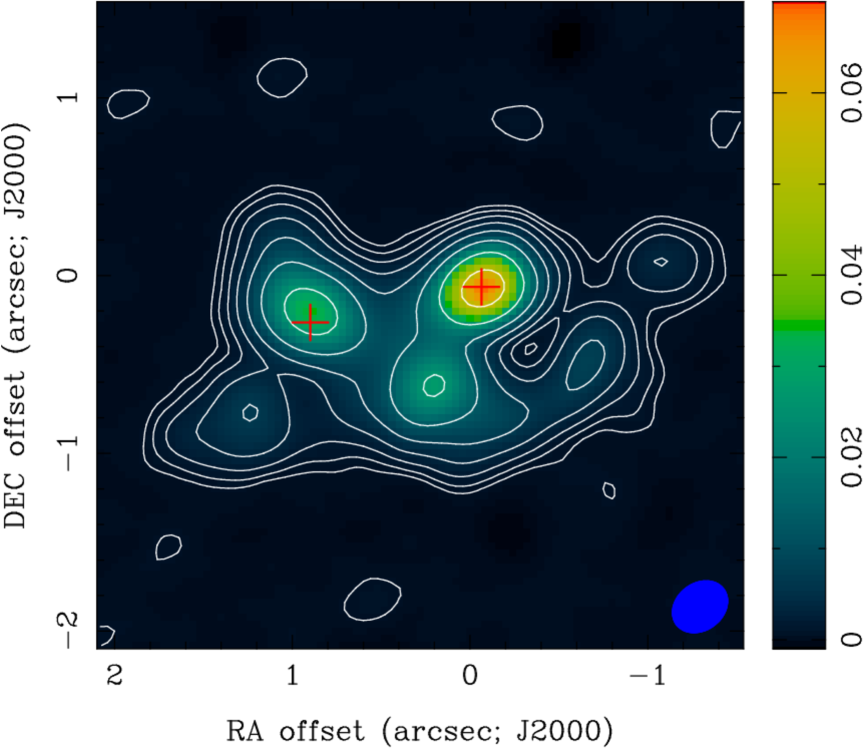
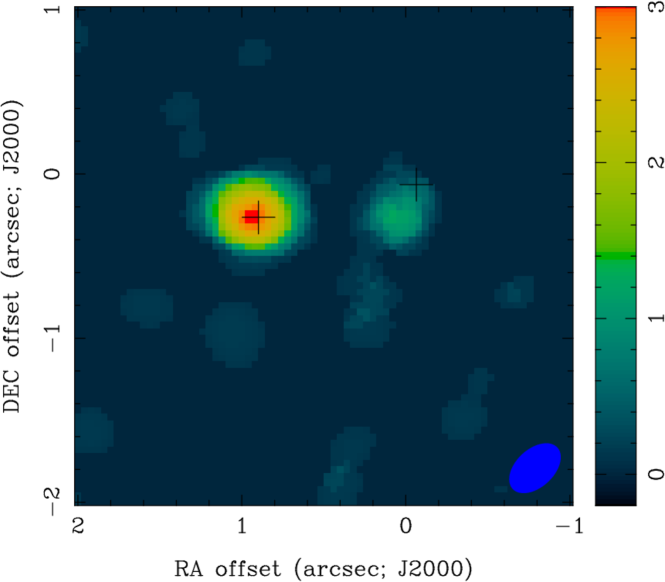
The MERLIN continuum emission displays a double-component structure embedded within a larger envelope (Fig. 1). While the two prominent nuclear emission regions are found to be similar to those seen in the earlier less-sensitive MERLIN map (Rovilos et al., 2003), the surrounding structures are much more detailed. The two main peaks, separated by about 097 (365 pc), are in agreement with other published high-resolution images (e.g. Sakamoto et al., 1999; Rovilos et al., 2003; Baan et al., 2017). The total flux density is estimated to be 27415.2 mJy, in agreement with previous measurements at the same frequency (Rovilos et al., 2003). The West nucleus is brighter and relatively more compact than the East nucleus. Gaussian fitting with a zero baseline gives an integrated flux density of 124.25.4 mJy and 99.43.4 mJy for the West and East components, respectively (Table 1).
However, the new MERLIN continuum map of Arp 220 also shows prominent extensions to the south, the southeast, and particularly to the west. The southern bridge below the two nuclei observed in previous data (Baan & Haschick, 1995; Rovilos et al., 2003) now appears as a continuous structure extending from southeast of Arp 220E all the way to west of Arp 220W. With a peak intensity of 13.5 mJy beam-1 this accounts for 45 times the off-source noise. This (arm-like) continuum bridge as well as other extensions may represent trails of star formation regions and debris resulting from the galaxy merger. This may be confirmed by the detection of a large kpc-scale structure, interpreted as a star forming disk, observed at low radio frequencies (150 MHz) with the international Low-Frequency Array (LOFAR) telescope (Varenius et al., 2016).
| Label | maj, min, PA | ||
|---|---|---|---|
| (mJy/b) | (mJy) | ||
| Arp 220W | 75.13.4 | 124.25.4 | 0.24" 0.17"108.2o |
| Arp 220E | 38.01.3 | 99.43.4 | 0.43" 0.23" 48.7o |

3.2 The MERLIN OH 1667 Line Emission
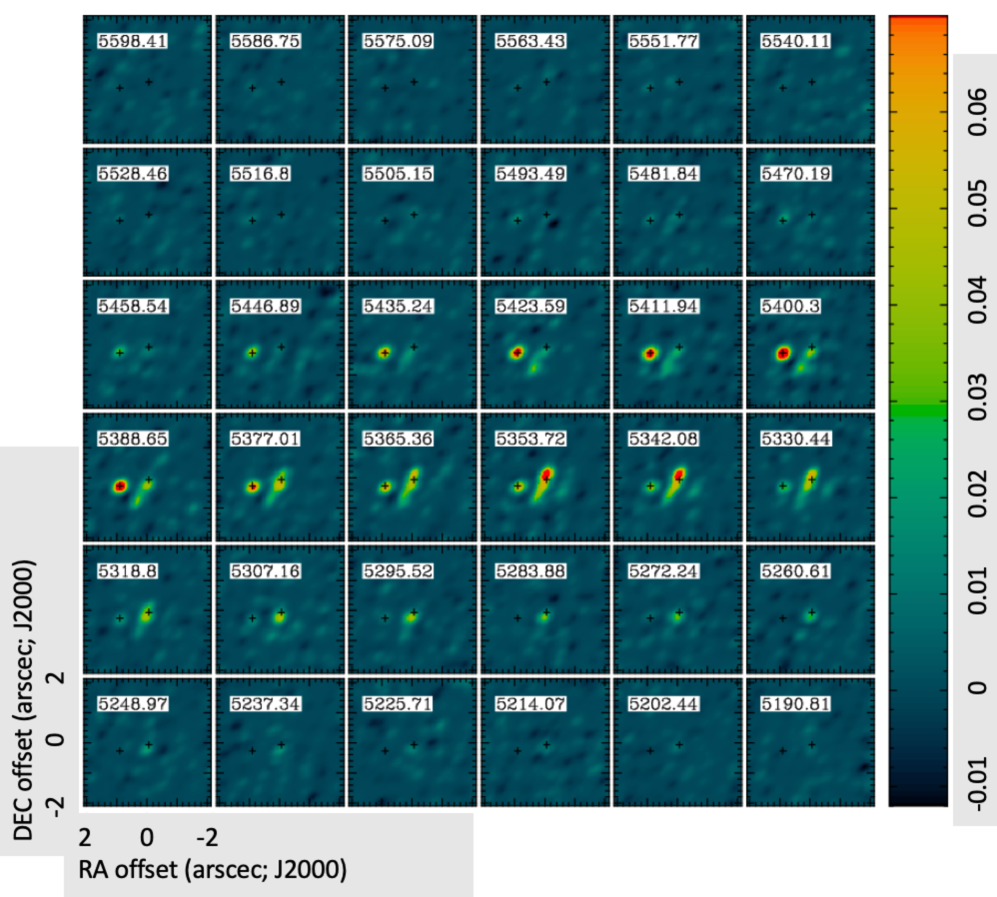
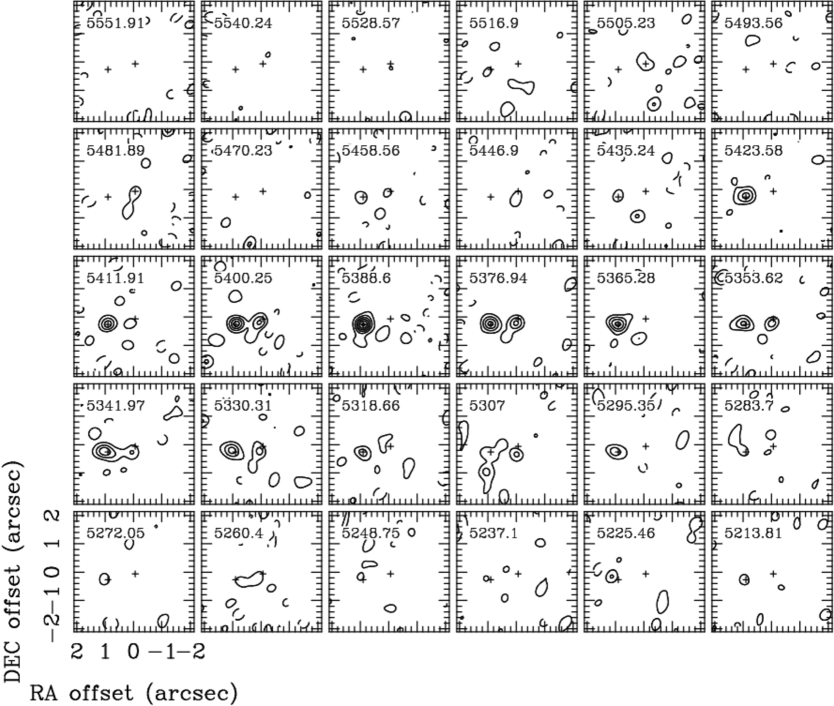
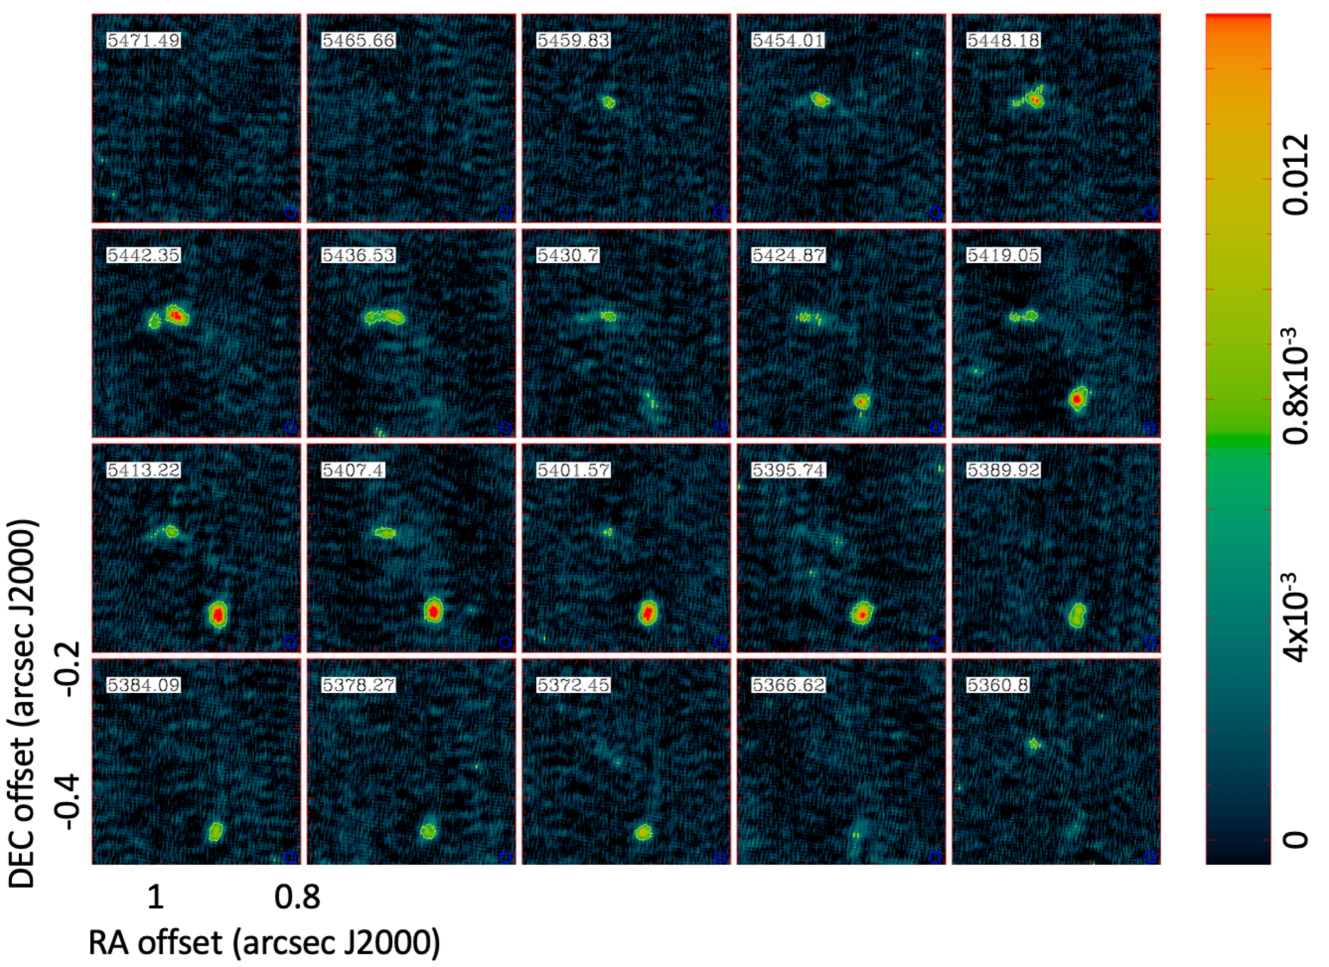
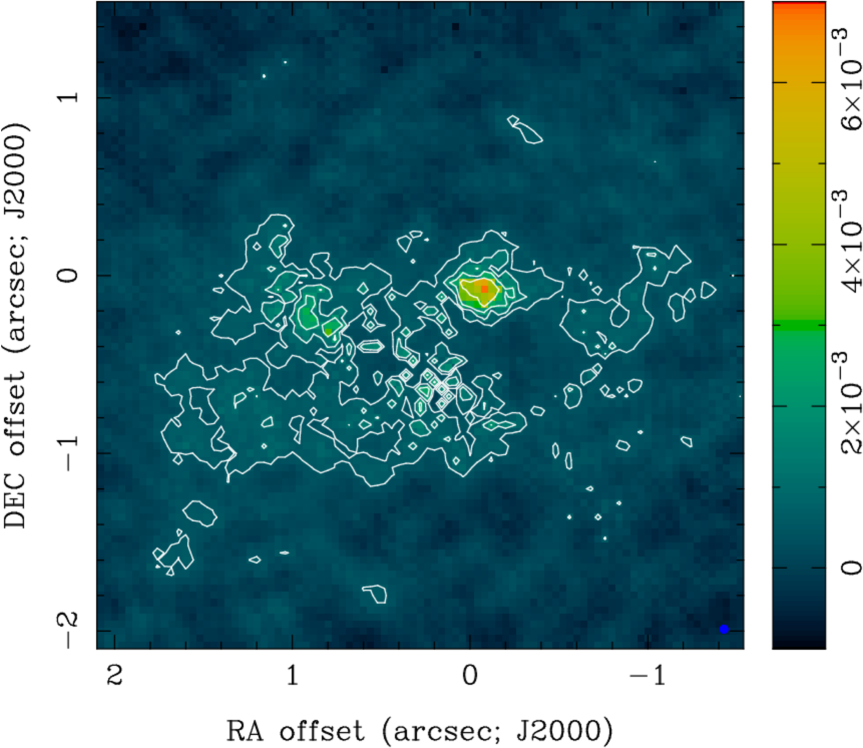
The MERLIN 1667 MHz OH emission line data cube of Arp 220 covers a velocity range of 49006200 km s-1 with a velocity resolution of 11.7 km s-1. The 1667 MHz OH channel maps cover a range 5237 - 5447 km s-1 in Figure 2 and show five distinct emission regions: the two nuclear regions, regions south and west of the West nucleus, and a region southeast of the East nucleus. These structures are clearly seen in the velocity-integrated 1667 MHz intensity map (grey scale and contours) together with the integrated 1665/1667 MHz spectra of six selected regions in the side panels (Figure 3). The current data provide more details of the emission structures at the two Arp 220 nuclei than found in earlier MERLIN data, as those data did not incorporate the 1665 MHz line emission (Rovilos et al., 2003).
Similar to the early data, the two OH components of Arp 220W straddle the continuum peak, except that now the North component appears much less prominent than the South component, which has a peak intensity of 157 mJy beam-1 in the 5363.6 km s-1 velocity channel. The spectrum of the Arp 220W-N region shows a narrow component at velocity 5353 km s-1 and is associated with a very compact masering region that also appears in the EVN data (see Section 3.5). A third prominent component south of Arp 220W is co-located with a continuum component and appears more prominent than in the earlier data. This third component highlights the SE-NW orientation of both the continuum and line emission at Arp 220W and suggests the orientation of the nuclear disk of the source in agreement with later findings (see Section 4).
The peak in Arp 220E of 152 mJy beam-1 is found in the 5410.2 km s-1 velocity channel at a position close to the Eastern continuum peak with the second peak in the 5375 km s-1 channel. The weaker components west and south of Arp 220W and southeast of Arp 220E seen in these high sensitivity data all lie within the confines of the continuum structure in Figure 1.
The 1667 MHz emission features in the lower resolution MERLIN data cover a broad velocity range of 52005600 km s-1 and encompasses the suspected optical velocities of the West nucleus of about 5360 km s-1 and of the East nucleus of 5425 km s-1 (Fig. 3). These broad profiles also suggest that the bulk of the 1667 MHz OH emission in Arp 220 originates in more extended regions at both nuclei and shows little detail about the underlying nuclei themselves.
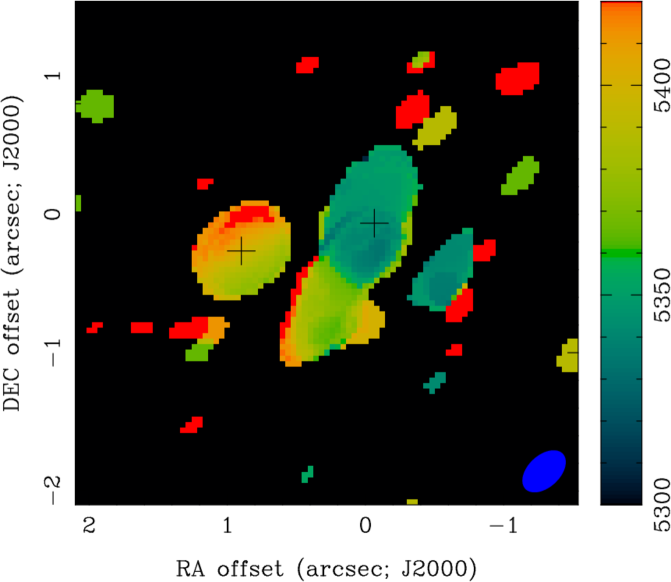
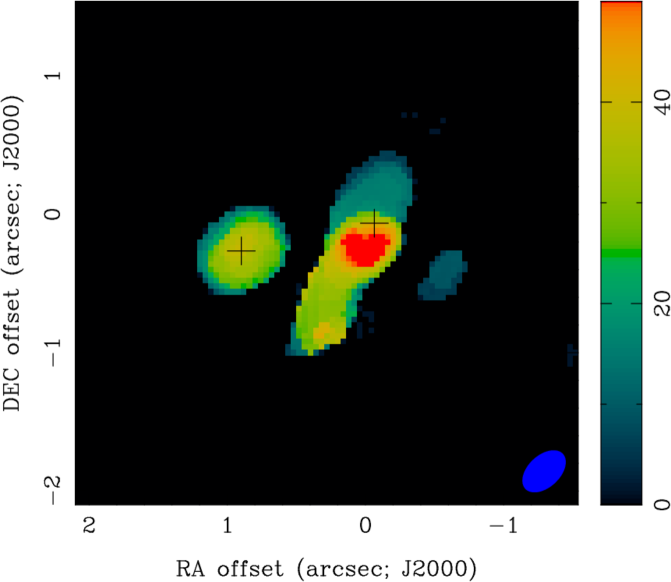
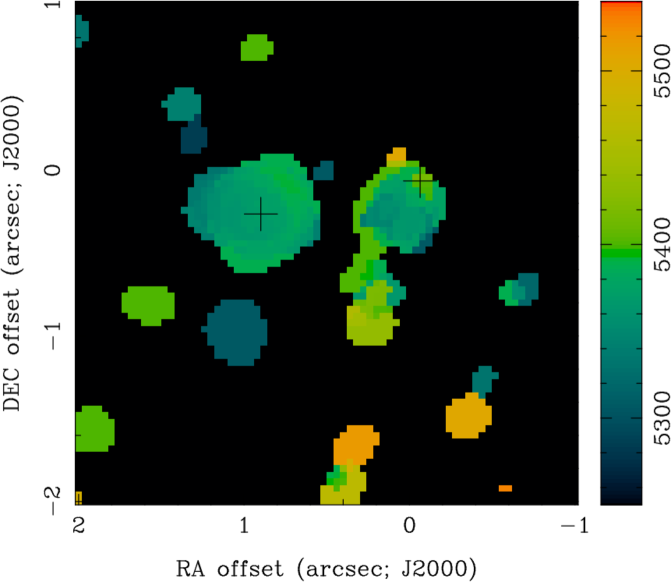
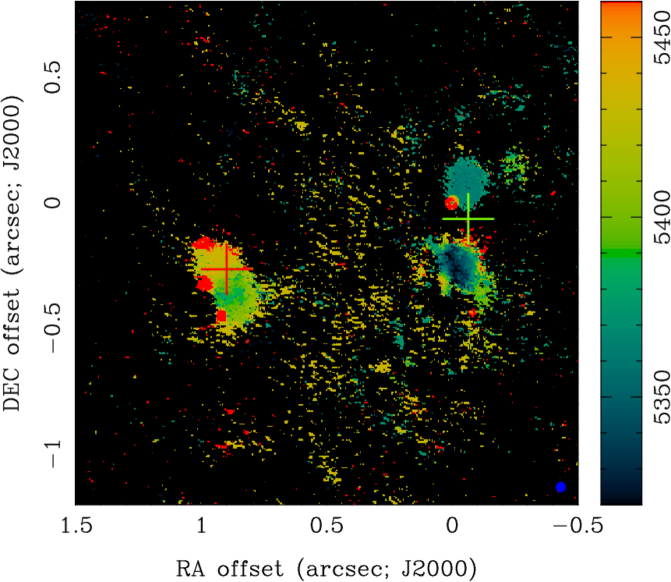
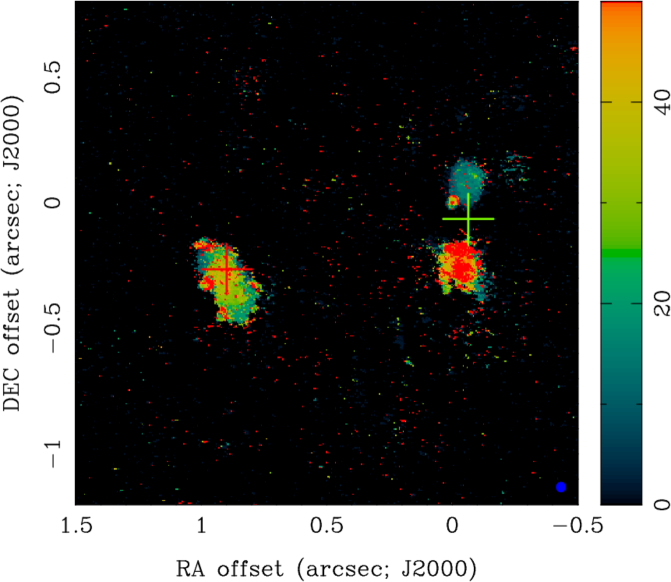
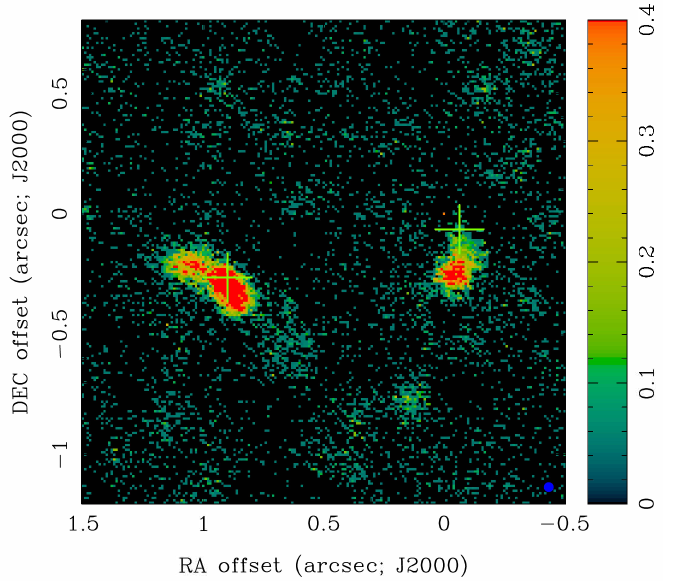
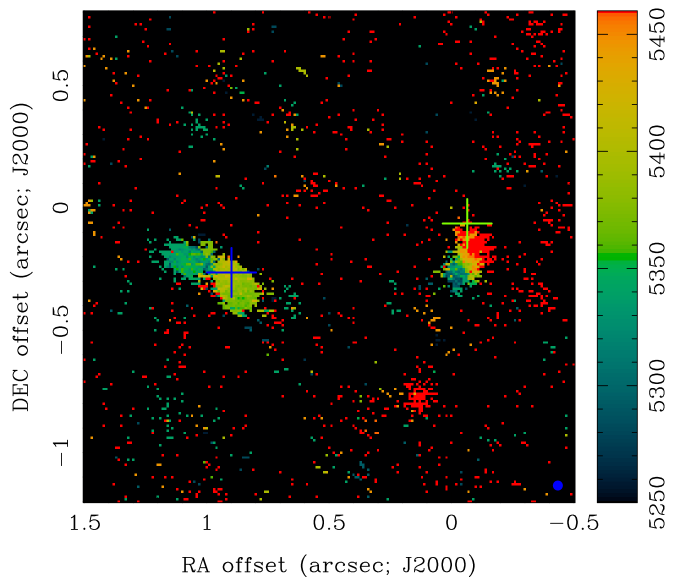
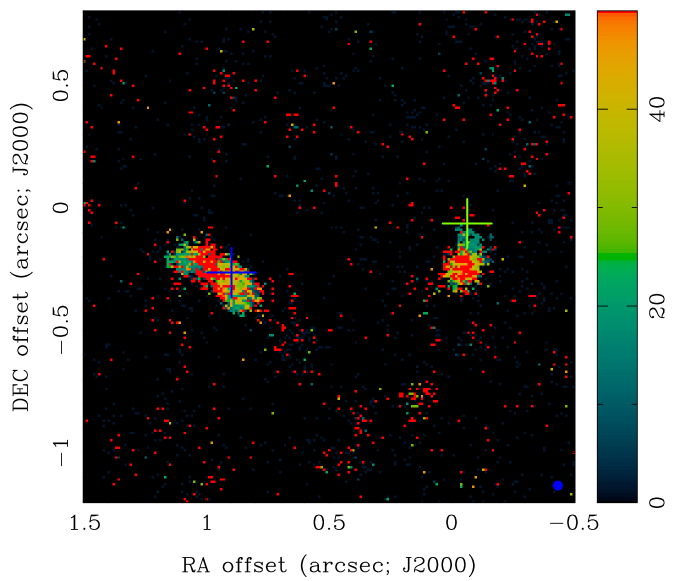
The velocity gradient (1Moment) map and the velocity width (2Moment) map of the 1667 MHz line emission at both nuclei are presented in Figure 4 using a 3 flux cutoff. Arp 220 E shows a positive velocity gradient in a northeast direction, which suggests rotation within the nuclear regions. The Arp 220 W nuclear region and the west extension component suggest a very weak but continuous gradient towards the north. The linewidth distribution of the East component depicted in Figure 4 appears rather uniform, while those of the West component are dramatically different with linewidths up 80 km s-1 in the South component below the core and as low as 20 km s-1 in the North component.
3.3 The MERLIN 1665 MHz OH line emission
The new 1665 MHz OH line cube also covers a velocity range of 56005900 km s-1 with a velocity resolution of 11.7 km s-1. The 1665 MHz channel maps and the 0Moment and 1Moment maps are presented in Figures 5 and 6. Contrary to the observed emission structure of the 1667 MHz line, the observable/prominent 1665 MHz emission appears only at the components Arp 220E and Arp 220W-South, as may also be deduced from the spectra of Figure 3. Any difference between the 1667 and 1665 MHz emission structures may result from a different dynamic range in Figure 5 and 6.
The west-east elongated 1665 MHz emission component in Arp 220E shows a continuous velocity gradient, which consistent with the 1667 MHz line findings (Fig. 3). An overall hyperfine line ratio = 3.6 would correspond to an amplifying optical depth = 2.4 (see Sect. 5).
Arp 220W-South shows a broad 1665 MHz spectrum possibly made up of multiple velocity components (Fig. 3). The line ratio = 5.0 suggests a higher amplifying optical depth = 3.3 but there is no clear 1665 MHz velocity gradient. Surprisingly, Arp 220W-North shows no clear 1665 MHz emission and its narrow 1667 MHz emission component appears to have a large amplifying optical depth and a possible small gradient visible in the 1Moment map (Fig. 6). This narrow feature is associated with the compact source found in the EVN data (see Fig. 9 and Sect. 3.5 below).
3.4 EVN imaging of the continuum emission
The continuum structure of Arp 220 at high-resolution is known to contain a number of identifiable supernova remnants (SNRs) at the two nuclei (Smith et al., 1998; Lonsdale et al., 2006; Parra et al., 2007; Varenius et al., 2019). The new EVN image shows two groups of point sources covering the East and West nuclear regions consistent with the continuum peaks (the crosses) in the MERLIN data in Figure 1. Although some side-lobe artefacts, phase errors, and RFI-related stripes may still be present in the map, the general configuration of the point sources is consistent with earlier detections even if their flux densities and positions appear not fully consistent with earlier experiments (Smith et al., 1998; Lonsdale et al., 2006; Parra et al., 2007). Our sources are found to be brighter than earlier detections but variations in flux and position are to be expected in an evolving starburst environment. The presence of the point sources in the map of Figure 7 accounts for about 90 mJy beam-1, which is about 40% of the integrated flux of the East and West radio nuclei. A thorough analysis still needs to be made of the power spectra and locations of these point sources and their (re-)appearance in comparison with earlier experiments.
The configuration of the SNR point sources confirms the star formation nature of the nuclear regions. The slightly elliptical N-S source configuration appears centred in between the two OH emission regions and coincides with the H2CO emission regions (Baan et al., 2017). The West configuration appears to have a N-S absorption lane possibly related to the edge-on torus at this nucleus (see Section 4.3) It should be noted that the point sources at the Eastern nucleus appear less dense and elongated in the SW-NE direction forming a connection with the continuum bridge below and between the two nuclei.
3.5 EVN Imaging of the OH Line Emission
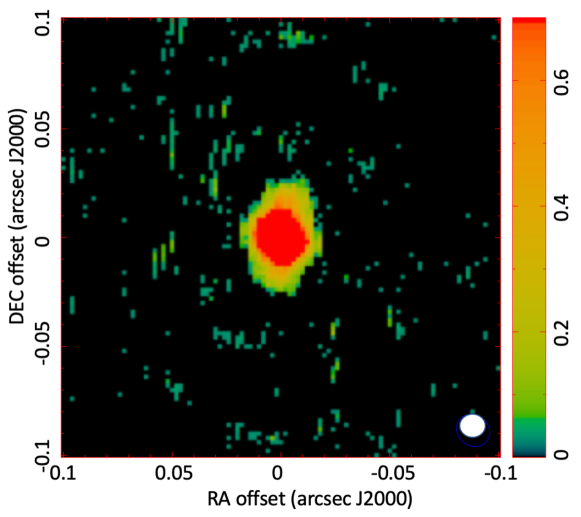
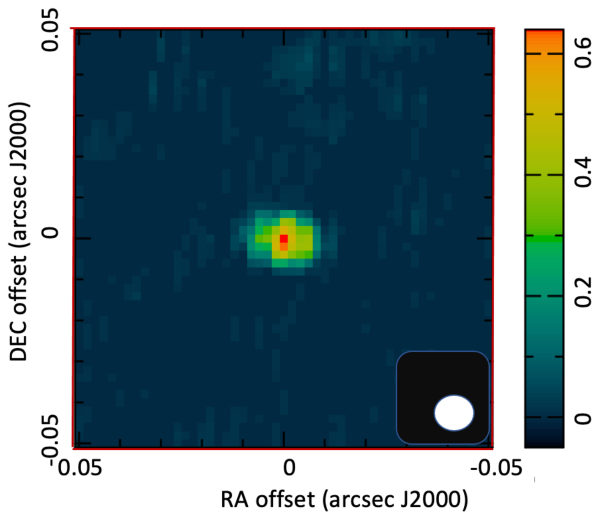
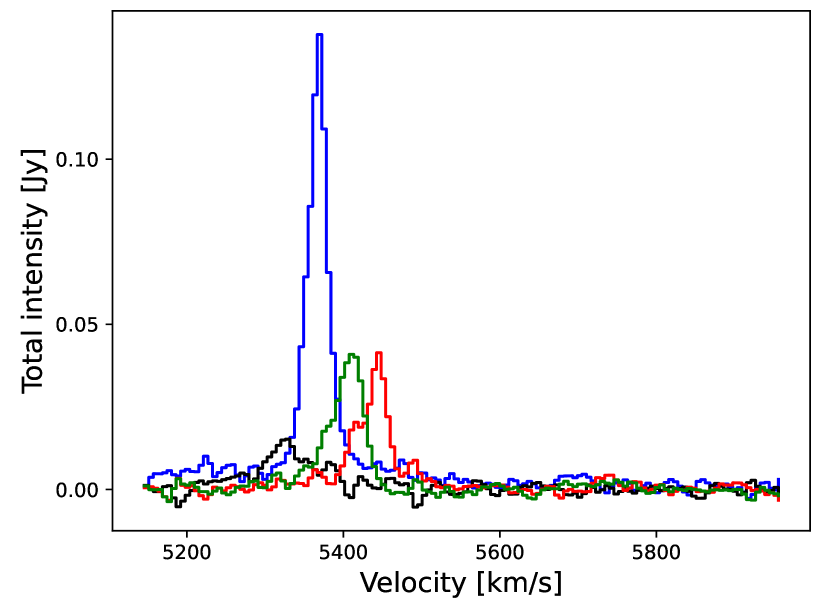
The new high-resolution EVN observations provides more details about and confirm the existence of four compact high-brightness VLBI maser components in Arp 220, two associated with each of the nuclear regions (Lonsdale et al., 1998; Rovilos et al., 2003). Following the nomenclature based on earlier VLBI detections, they have been named W1 (north), W2 (south), E1 (east) and E2 (south). The velocity-integrated maps of these four features are presented in Figure 8 and the integrated spectra are shown in Figure 9. Together they account for about 15% of the total line emission in Arp 220.
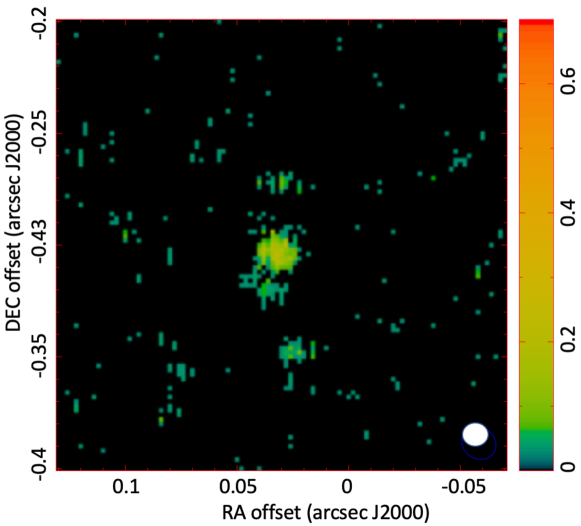
The most prominent emission feature W1 is located at the southeastern edge of the Arp 220W-North and appears as a point source in channel maps across an optical velocity range 54165498 km s-1 with a peak at about 5364 km s-1. W1 also shows compact emission at a much lower velocity of 5360 km s-1 , which may result from foreground emission (see Sect. 4.3). The newly detected 1665 MHz counterpart of W1 (Fig. 8(top right) shows a point-like centre and a mysterious E-W (halo or scattering) extension and peaks at the velocity of 5586 km s-1. The less compact W2 feature is only detected at 1667 MHz and appears with two weak companions at the southern edge of the South region at about 115 pc (03) south of W1.
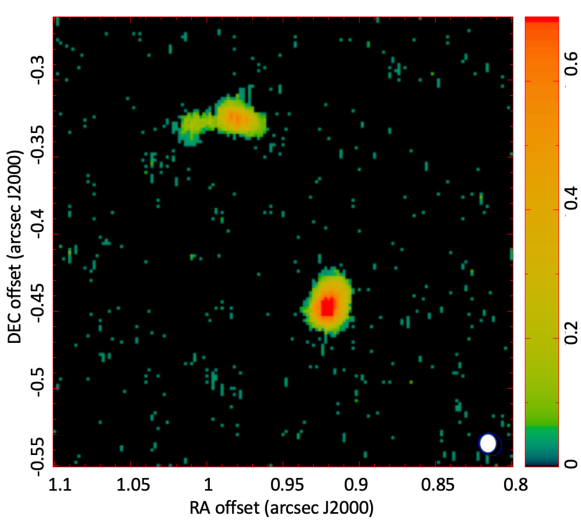
The compact components E1 (east) and E2 (south) at the Eastern nucleus are shown in the channel maps of Figure 10. Compared with W1, the elongated E1 component is redshifted in the range 54015461 km s-1 with a primary peak at 5443 km s-1 at the brighter head and a secondary peak at 5399 km s-1 at the (slightly redshifted) eastern tail. The compact component E2 is located (014) 49 pc southwest of E1 and is also redshifted relative to W1 with a peak at 5409 km s-1. E2 shows a northwest extension resulting from a possible double structure and is more prominent than was found in earlier experiments (Lonsdale et al., 1998). The peaks of the two E features confrim a large-scale northeast velocity gradient along the structure of the East nucleus. In addition to E1 and E2, several other compact weak point sources may be identified in the field.
The relative positions of the four components has been preserved during self-calibration (see Section 2.2), their actual locations within the East and West nuclei will be evident as they re-appear in the combined EVN - MERLIN emission maps presented below (see Section 4). The spectral characteristics of the EVN-detected features are also presented in Table 3.
The intensity colour scale is in units of mJy beam-1.

4 Combining MERLIN and EVN data
4.1 The MERLIN-EVN imaging of Arp 220
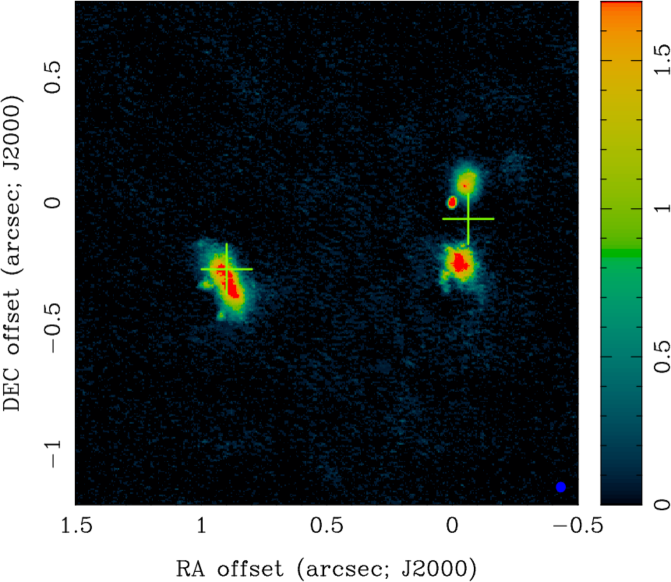
The continuum structure with the two nuclear components obtained from the combined ME data shows again that the Western nucleus is more compact than the Eastern nucleus and shows the extended structure below the nuclei found in the MERLIN data alone (Fig. 11).
The extended and compact OH emission components have been presented in the images of Figures 12, 13 and 14. The extended 1667 MHz and 1665 MHz emission regions cover the two nuclear regions and have a linear extent of 80 and 106 pc for Arp 220W North and South and 154 pc for Arp 220E. While the OH emission region at the East nucleus falls slightly below the continuum peak, the two regions at the West nucleus straddle the continuum peak, except that the North 1665 MHz emission in Arp2̇20W appears much weaker. Any further apparent structural differences in the 1667 and 1665 MHz images between North and South in West nucleus the eastern part of the East nucleus in Figs. 13 and 14 result from a difference in dynamic range of the two 0Moment maps.
Adopting a line-of-sight maser amplification scenario for the OH maser emission, the OH emitting regions and the far-infrared pumping source and the amplified continuum must indeed be on the line-of-sight. As a result, any amplified OH emission regions are always superposed on the continuum structure and the FIR radiation fields of the source.
The relative locations of the OH emission regions may follow from the line-of-sight velocity information at the two nuclei and the velocity fields of other molecular constituents of the Arp 220 system as seen in the recent 12CO (3 - 2) and 13CO (4 - 3) observations (Wheeler et al., 2020) and earlier observations of 12CO (3 - 2) (Sakamoto et al., 1999, 2008) and 12CO (6 - 5) emission (Rangwala et al., 2015). The 12CO (3 - 2) emission structure in Arp 220 shows that the two nuclei are embedded in (or covered by) a diffuse and drifting molecular structure encompassing a region comparable to the extended kpc-sized radio continuum structure shown in Figure 1. Therefore, excited OH molecules within the drifting molecular foreground may contribute to the amplification of the background continuum and re-amplification of the systemic emissions originating in the merging galaxies.
4.2 Extended and compact OH emission in East
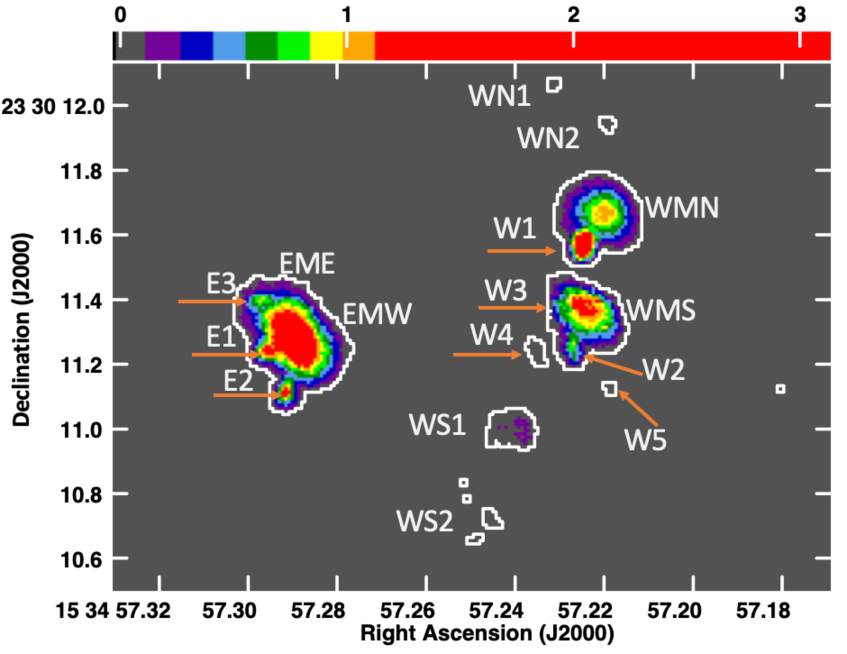
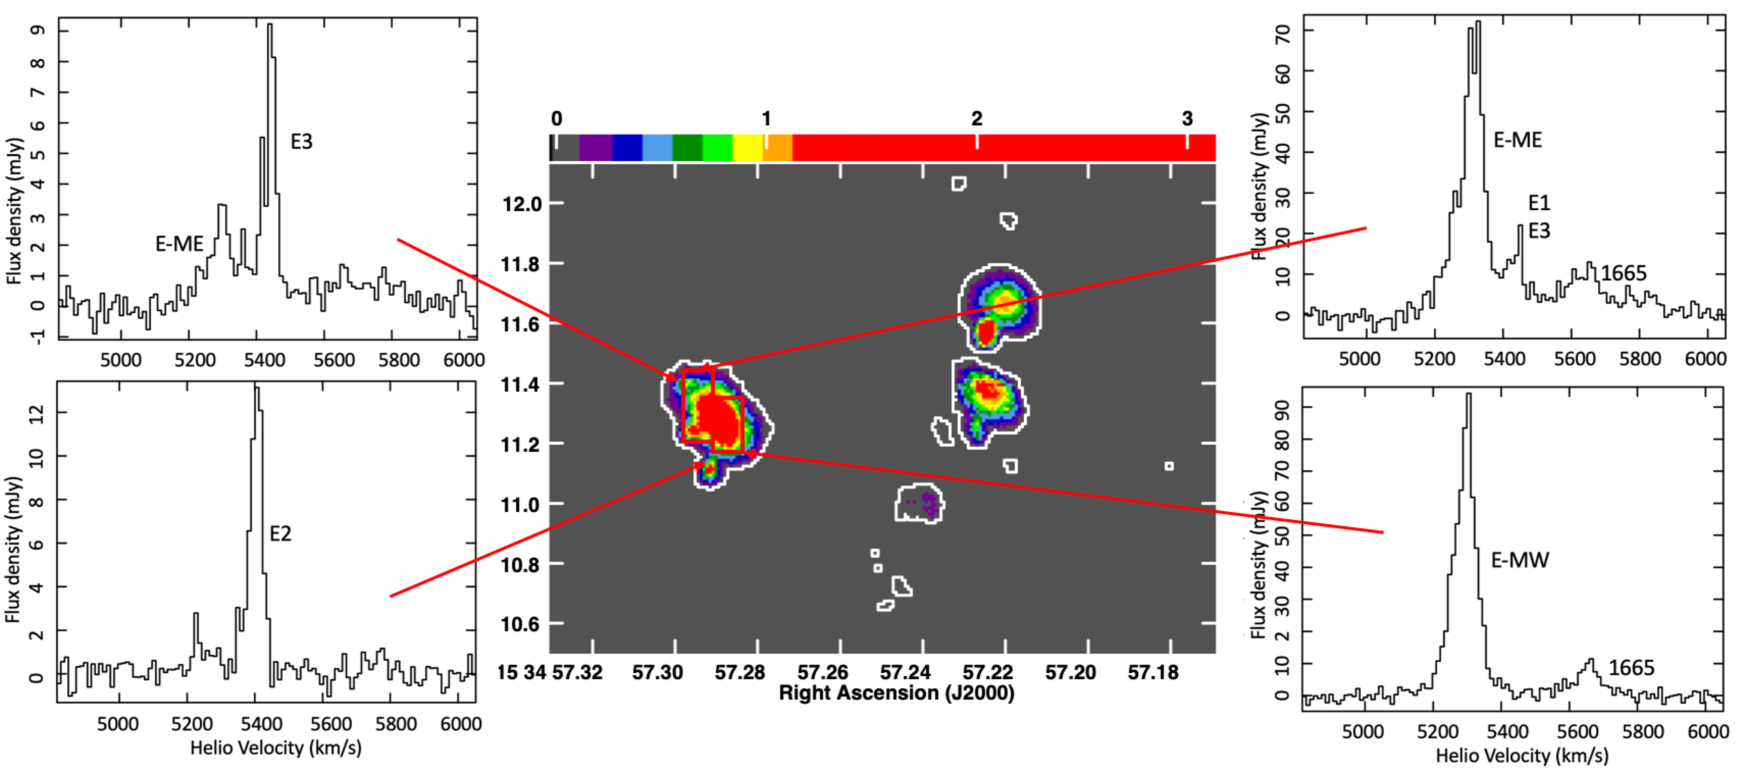
A deep 0Moment map of the 1667 MHz emission in Arp 220 shows the dominant emission regions at both the East and West nuclei, in addition to compact emission regions surrounding the two nuclei (Fig. 15). Three compact emission regions in Arp 220E appear at the eastern edge of the extended emission regions Arp 220E, of which two have a counterpart in the EVN data (Fig. 8 and 10). These compact regions are clearly visible in Figures 13 and 14 and are identified in Figure 15 as E1 - E3.
The spectral velocity components at all identified emission regions are displayed in Figures 16. The three regions E1-E3 at the East nucleus are found to have a velocity close to 5425 km s-1, which is about 110 km s-1 higher than the velocity of 5314 km s-1 of the E-MainE and E-MainW extended OH emission regions that appear to be in the foreground. The observed strength of these regions would result from re-amplification of the maser signature by the extended foreground gas (see Section 5).
Composite diagrams with the spectra at all locations in the 0Moment map clearly show evidence for a superposition of structural components with distinct velocity systems at each nucleus in Figures 16. A position-velocity diagram in Figure 18 depicts these velocity systems using the velocity values obtained from the spectra at various locations (see Table 2). Assuming that the higher velocities of the compact and surrounding emission components at both nuclei represent the systemic velocities of the two nuclei (or what is left over of them), the lower velocity components must represent foreground gas structures in the system. This would suggest that the compact components identify a systemic velocity of 5425 km s-1 for the East nucleus (see Fig. 18 and Table 3). The compact OH emissions would then be systemic emission regions that are re-amplified by excited gas within the dominant foreground structures at velocity 5314 km s-1 for Arp 220E.
The curious aspect regarding the compact emission regions is that they appear as identifiable features only on the east and southeast sides of the main emission regions. As discussed further in Section 6 below, this may be related to variation in velocity-coherent amplifying column density related to a velocity gradient in the foreground material.
The position-velocity diagram in Figure 18 that the systemic components E1 - E3 show a gradient of 19 km s-1 over 107 pc (0.18 km s-1pc-1). Similarly, the gradient in the foreground screen is on the order of 18 km s-1 over a distance of 38 pc (0.47 km s-1pc-1). A difference exists in Arp 220E where the 1667 MHz line width is almost uniform across the region, while the 1665 MHz extension emission shows a wide section towards the East followed by a narrower eastern edge (Figs. 13 and 14)
| Location1 | Velocity | FWHM | S1667 | S1665 | 1667/1665 | Opt.Depth | Comment |
|---|---|---|---|---|---|---|---|
| (km s-1) | (km s-1) | (mJy b-1) | (mJy b-1) | ratio | |||
| West North1 | 5258 | 29 | 2.9 | 0.3 | 9.7 | -5.0 | foreground |
| West North2 | 5268 | 34 | -1.5 | – | – | fg absorption | |
| 5375 | 34 | 2.5 | 25 | 7.3 | W systemic | ||
| W-Main North | 5255 | 24 | 83 | 1.5 | 55 | -9.0 | foreground |
| W-Main South | 5245 | 1652 | 27 | 6.0 | 4.5 | -3.0 | foreground; double peak |
| W1 – North | 5361 | 39 | 31 | 1.0 | 31 | 7.6 | W systemic |
| W1 – North EVN | 5366 | 26 | 155 | (5) | (31) | (7.6) | compact3 |
| W2 – SouthEast | 5317 | 682 | 7 | 0.8 | 8.7 | -4.7 | W systemic |
| W2 – SouthEast EVN | 5325 | 65 | 12 | – | – | – | compact3 |
| W3 – East | 5366 | 392 | 12 | 4.0 | 3.0 | -1.9 | W systemic |
| W3 – East | 5366 | 392 | 12 | 4.0 | 3.0 | -1.9 | W systemic |
| W4 – South | 5246 | 19 | 4.2 | 0.6 | 7.0 | -4.2 | foreground |
| 5346 | 87 | 1.2 | 0.2 | 6.0 | -3.8 | W systemic | |
| W5 – SouthWest | 5212 | 22 | 7.8 | 0.5/1.5 | 15.6 | -6.1 | foreground |
| 5296 | 32 | 5.0 | 1.5 | 3.3 | -2.1 | W systemic | |
| WS1 | 5255 | 24 | 14.0 | 0.7 | 20.0 | -6.8 | foreground |
| WS2 | 5255 | 124 | 4.0 | 1.1 | 3.6 | -2.7 | foreground |
| 5438 | 120 | 2.0 | 2.0 | 1.0 | small | E systemic | |
| East -Main West | 5304 | 78 | 93 | 11.5 | 8.1 | -4.5 | foreground |
| East -Main East | 5322 | 68 | 72 | 12.1 | 5.9 | -3.7 | foreground |
| E1 – East | 5429 | 48 | 9 | 1.1 | 8.2 | -4.5 | E systemic |
| E1 – East EVN | 5444 | 18 | 50 | – | – | – | compact double3 |
| 5411 | 23 | 20 | – | – | – | ||
| E2 – South | 5410 | 39 | 13 | 1.0 | 13.0 | -5.7 | E systemic |
| E2 – South EVN | 5410 | 35 | 42 | – | – | – | compact3 |
| E3 – NorthEast | 5429 | 53 | 4.5 | 0.3 | 15.0 | -6.0 | E systemic |
A comparison of the observed OH emission with the large-scale CO emission shows that the optical velocity of Arp 220E is in agreement with the CO emission spectra (Figure 1 in Wheeler et al., 2020). This spectrum shows two 12CO (3 - 2) emission components at optical-defined velocities of 5297 and 5603 km s-1 separated by a strong absorption at 5440 km s-1. The systemic (optical) velocity of 5425 km s-1 for the OH emission coincides with the strong absorption feature at the central continuum source, while the velocity of the foreground material of 5314 km s-1 indicates an association with a low-velocity CO component. The high-velocity CO component at 5603 km s-1 has no OH counterpart and appears to be located behind the nucleus.
The most recent 0Moment maps of the 12CO (3 - 2) and the optically thin 13CO (4 - 3) emission data show an enhanced emission region at the location of Arp 220E within a large scale emission structure drifting in northeast direction (Wheeler et al., 2020). The 13CO (4 - 3) emission at the Eastern nucleus shows a SW-NE inclined and slightly warped disk structure extending to 366 pc and covering a radio velocity range from 5160 to 5680 km s-1 (Wheeler et al., 2020). The systemic OH emission features at the East nucleus are consistent with these larger scale molecular structures, although they only highlight the central region of this disc that provides the FIR pumping emission.
For comparison, the formaldehyde maser emissions at the Eastern nucleus occur at the SW side of the nuclear centre and indeed show emission at velocities close to 5400 km s-1 (Baan et al., 2017). However, the western H2CO emission spectrum shows a profile that also encompasses the velocity range of the foreground component reaching down to below 5100 km s-1, which is in agreement with the foreground CO data. This would suggest that at Arp 220E, the foreground component may also re-amplify the SF regions at the systemic velocity.
4.3 Extended and compact OH emission at West
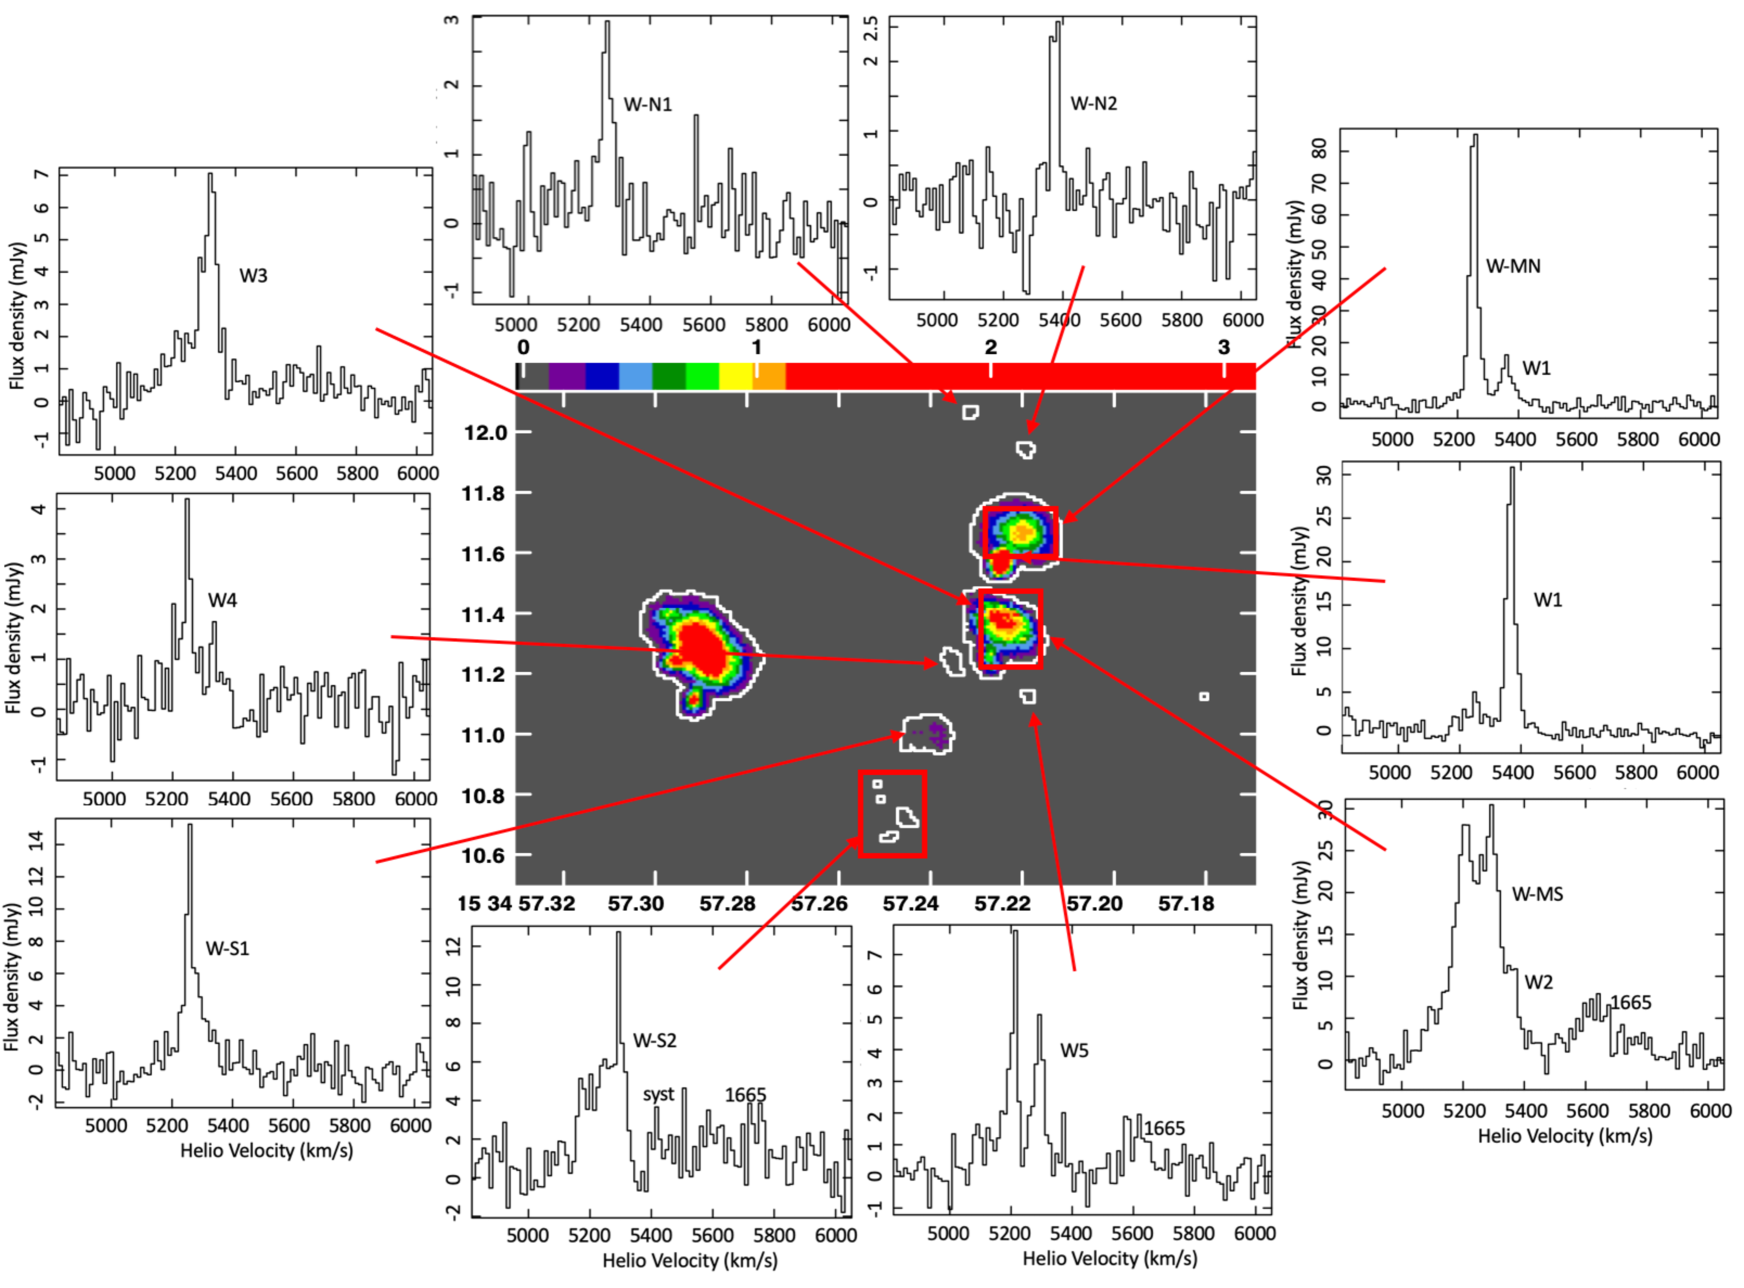
A deep 0Moment map of the 1667 MHz emission in Arp 220 also shows the dominant emission region at the West nucleus, in addition to three compact region on its eastern side (Fig. 15). Two of these regions have counterpart in the EVN data (Fig. 8) and are clearly visible in Figures 13 and 14 and are identified in Figure 15 as W1 - W3. In addition to these, a number of additional emission regions may be identified to the north and south of Arp 220W.
The spectral velocity components at all identified emission regions are displayed in Figures 16 and 17. The compact components W1-W3 at the Western nucleus have a systemic velocity of about 5360 km s-1, which is 75 -140 km s-1 higher than the extended West OH components with an approximate velocity of 5254 km s-1. Similar to the situation at the East nucleus, the W1-W3 regions are also located on the east–southeast side of the extended emission regions (see Sect. 5). In addition, the nearby components W4 and W5 both show a low-velocity component in agreement with that of the extended main regions, and a high-velocity component in agreement with those of the W1-W3 regions. Similarly, the W-S1 and W-S2 regions show emission at the foreground velocity, except that the W-S2 region shows an emission pair (with = 1667/1665 1) at a velocity of 5438 km s-1, which corresponds to the systemic velocity of the East nucleus. The relative sizes, locations, and velocity offsets with the more extended OH emission regions suggest that any of these compact regions correspond to star formation regions belonging to the nuclear region of the underlying galaxy.
| Arp 220 | Systemic | Foreground | Position | Comment |
| Nucleus | Velocity | Velocity | Angle | |
| (km s-1) | (km s-1) | (degree) | ||
| West | 5360 | 5354 | 168 | nearly edge-on |
| East | 5425 | 5314 | 45 | edge-on |

The spectra in the composite diagram of the West nucleus again shows the superposition of two structural components with distinct velocity systems in Figures 17. The position-velocity diagram in Figure 18 depicts these velocity systems using the estimated velocity values obtained from the spectra at various locations (see Table 2). The higher velocity compact components and surrounding emission components represent the systemic velocity of West, while the lower velocity components represent foreground gas structures. The compact components at West identify a systemic velocity of 5360 km s-1 (see Fig. 18), while the dominant foreground structures would be at 5254 km s-1 (see Table 3.
The position-velocity diagram in Figure 18 shows a clear velocity gradient for the systemic velocity components at the West nucleus. Also taking into account the outlying components WN2 and W5, the small South to North gradient at the West nucleus has a velocity range of approximately 78 km s-1, and covering a distance of 324 pc (grad = 0.24 km s-1pc-1). This gradient would confirm that the systemic components at the West nucleus are representative of rotation in a nearly edge-on disc. A weak gradient is also seen for the foreground screen when considering the data points WS3 to WN1, which covers only 28 km s-1 over a distance of 800 pc (grad = 0.03 km s-1pc-1). The foreground screen is drifting slowly in front of the nuclei in a NE direction. The corresponding 1665 MHz emission in Arp 220W-South shows an apparent gradient in the opposite direction.
A comparison with the existing large-scale CO observations shows that the optical velocities are in agreement with the emission spectrum at Arp 220W (Figure 1 of Wheeler et al., 2020). This spectrum shows two 12CO (3 - 2) emission components at optical-defined velocities of 5245 and 5558 km s-1 separated by a strong absorption at 5424 km s-1. The systemic velocity of the OH emission at the West nucleus 5360 km s-1 would coincide with this strong absorption feature associated with the central continuum source, while the velocity of the foreground material of 5254 km s-1 is associated with the low-velocity CO component. Again the high-velocity CO component at the nucleus Arp 220W has no OH counterpart and appears to be located behind the nucleus.
The most recent 12CO (3 - 2) and optically thin 13CO (4 - 3) 0Moment maps show strongly enhanced emission at the central location of Arp 220W within a large scale emission structure drifting at about 2.4 km s-1pc-1in NE direction (Wheeler et al., 2020). This emission region appears as a torus structure centred on the continuum emission and consistent with the large 2Moment velocity width seen at the West nucleus (Fig. 13). The 2Moment image of this elongated and tilted S-N torus structure suggests clockwise (East blue and West red) rotation with a width of about 480 km s-1 and an estimated orbital velocity of 240 km s-1. The extended 1667 MHz OH emission regions have an almost South-North orientation and are separated by about 130 pc as they straddle the absorption gap centred on the peak of the radio continuum at Arp 220W. This suggests that these regions represent the tangential sections of the nuclear torus with an estimated outer diameter of 240 pc. Similarly, the velocities of the OH SF components identified for Arp 220W are consistent with the clockwise rotation of the inner CO structure and appear consistent with the N-S oriented SF regions being on the front side of a central torus.
The presence of a tilted N-S molecular torus in the nuclear region of Arp 220W with a clockwise orbital motion and a central absorption component would also be consistent with the position-velocity behaviour of the HCN emission in the nuclear region without invoking an outflow and an E-W nuclear region (see Barcos-Muñoz et al., 2018).
For comparison, the formaldehyde maser emissions at the West nucleus are thought to be associated with the disk component but the emission spectra also show multiple components at the velocity of the foreground (Baan et al., 2017). This suggests that the emission of the systemic regions is also re-amplified by the foreground structure. A comparison of the spectrum of Centre and West H2CO components at Arp 220W shows that the Centre profile has a 130 km s-1 lower velocity and could also be associated with the front side of the torus.
4.4 Outflows in Arp 220
Extended blue wings have been detected in single dish OH emission spectra in Arp 220 and other OHMM that have been interpreted as outflows (Baan et al., 1989). In Arp 220 this blue wing may extend about 1000 km s-1 below the systemic velocity and some evidence for such an extension may even be found in the current EVN spectrum of W1 in Figure 9. Similarly, recent CO observations of Arp 220 show the broad (1300 km s-1) emission profiles at the two nuclei, where the outer blue and red parts of these profiles have also been designated as outflows (Wheeler et al., 2020). However, considering that Arp 220 is a strongly interacting system showing multiple CO emission regions along the line of sight, one may reconsider the nature of these outflows. Are these really outflows from the nuclear regions or do they represent disk material flung away from the system at a larger relative velocity during this merger interaction ? Maybe indeed the more likely explanation for these high velocity components is that they result from the interactive nature of the system. The velocity in the CO data does not reveal the distance to the nuclear cores and with the right line-of-sight conditions any low-velocity foreground component can also amplify the radio background and produce a low-level blue wing in the OH profile.
5 Two masering scenarios
The detailed interpretation of the Arp 220 OHMM system shows a variety of emission properties and line ratios at the different regions within this interacting system, suggesting differences of the masering environments in the emission regions. However, the basic scenario for the OH amplification is having an alignment of: 1) a radio background serving as seed radiation, 2) an FIR pumping agent with the right spectral shape to create a population inversion, and 3) and an embedded or foreground column density with a line-of-sight velocity-coherent column density. If all such conditions are fulfilled, the foreground molecular structures can amplify both an extended radio continuum background at its own radial velocity and re-amplify any maser emission originating in the underlying star-formation regions at their own radial velocity.
In a controlled environment under LTE circumstances, the optical depth of the 1667 and 1665 MHz OH transitions would vary as = , which suggests that the line flux ratio varies as:
| (1) |
While this ratio will be independent of the background (or seed) continuum radiation field behind the emission region, the variation of the amplifying optical depth across any masering region should always give a clear correlation between the two emission lines.
The lower resolution MERLIN data show an 4.5 for both main East and West components suggesting relatively lower (integrated) optical depths (see Fig. 3). However, the 1667/1665 OH line ratios of components in the MERLIN-EVN data show a large range of values ranging from 3 to 20, which indicates distinct differences in the masering conditions in the foreground gas and the systemic environments.
The OH emission from the foreground gas varies with the varying amplifying gain across the face of the foreground structure convolved with that of the background radio structure. As a result of these variable parameters, the amplifying optical depth of the foreground material is found to vary significantly with values between = -2.7 and -6.8 with one apparent value -9.0 in Arp 220W-North. Similarly, the emission of the systemic SF regions will result from the intrinsic gain in the SF region and the gain provided by a foreground column with a similar velocity. The available data of SF-related features at the systemic velocity of the two nuclei shows an optical depth range of -1.9 to -6.0 with an extreme value of -7.6 for the W1 region in Arp 220W-North. Based on these values, the foreground regions contribute a small addition to the gain for the systemic SF regions.
RADEX simulations (van der Tak et al., 2007) show that the range of optical depths in the OH main lines required in the foreground masering regions at each of the nuclei can be achieved when the molecular gas is relatively cold at = 20 K and is exposed to an FIR radiation field emitted by warm dust with = 50 K. The required OH column densities are on the order of 1017 cm-3. The masering conditions provide some diagnostics of the foreground material.
The systemic star-formation regions are curiously located at the east-southeast edges of the main emission regions at each of the two nuclear regions. The reason for this may relate to a velocity gradient in the 12CO(1-0) foreground appears to run globally from southwest to northeast (Wheeler et al., 2020; Sakamoto et al., 2008). Since foreground re-amplification requires an sufficient inverted column density at the exact velocity of the systemic SF regions, the foreground velocity gradient and the density distribution in the foreground appear to provide a certain optical depth for the regions at the eastern edge of the main emissions and not for the distinct SF regions at the western side of the nuclei.
6 Discussion
The OH MegaMaser activity in Arp 220 appears to be more complex than was anticipated on the basis of earlier observations. While the lower resolution MERLIN data showed the larger scale foreground emission regions and did not distinguish emission components at the galactic cores, the high-resolution EVN data resolved the extended emission and detected a few of the high-brightness star-formation components at each of the galactic cores. However, the combined MERLIN - EVN data with intermediate resolution provides a much clearer view of the structural components in Arp 220. In particular, the combined data provides a consistent masering scenario, where the FIR-pumped foreground material amplifies the background continuum from within the galaxy core regions and independently re-amplifies the galactic SF-related components.
For the case of the OH emission in Arp 220 a clear velocity distinction can be made between the compact star-formation regions at the systemic velocity of the East and West nuclei and a foreground screen covering the nuclear regions at velocities about 100 km s-1 below that of the nuclei. Other higher-velocity molecular CO components do not have a counterpart in the OH data and appear to be located behind the nuclei (see Wheeler et al., 2020). Assuming that the velocity of the various compact emission regions in the EVN and combined MERLIN-EVN data are part of the underlying galactic nuclei, these components accurately determine the systemic velocities of the nuclei of 5425 km s-1 for the East nucleus and 5360 km s-1 for the West. As expected, these systematic velocities of the two nuclei correspond closely with those of the apparent absorption regions in the large-scale molecular structures (Wheeler et al., 2020). Subsequently, the velocities of the amplifying foreground regions that produce the bulk of the OH emission are at about 5312 km s-1 for the East region and at 5260 km s-1 for the West region, which is 100 km s-1 below the systemic velocities of the two nuclei.
Because the OH emission from the foreground dominates, very little of the systemic structures of Arp 220 can be detected except for the evidence that large scale star-formation related FIR emission serves as a pumping agent for the foreground material. The East nucleus of Arp 220 appears to have a SW-NE orientation at a position angle of about 45∘ and shows a small velocity gradient in that direction. The systemic components at the West nucleus suggest an edge-on S-N orientation with a position angle of -12∘, which is consistent with the apparent presence of a nuclear torus structure seen at the nucleus within the large scale 12CO (3 - 2) emission data. No evidence can be found in the OH data for an E-W orientation of the West nuclear region. This nearly edge-on torus appears to have a clockwise rotation with an estimated orbital velocity of about 100 km s-1, which would be consistent with the presence of compact SF-related emission regions on the eastern edge of the OH emission region.
The maser amplification scenario proposed early for the OH MegaMaser emission is found to be clearly applicable for Arp 220 (Baan, 1985, 1989). This scenario represents a line-of-sight convolution of the variable amplifying optical depth in the foreground gas with the distributed source of molecular pumping and the radio emission in the background. Prominent MegaMaser emission lines of other molecules in extragalactic sources are likely to be generated in a similar manner. The H2COMM emission components in Arp 220 are similarly superposed on the core regions of the galaxies and show the velocity range of both the systemic and the foreground regions (Baan et al., 2017). Similarly, for prominent H2OMM sources, such as NGC 4258 and NGC 1068, the collisionally excited gas is also superposed on the continuum structures (Herrnstein et al., 1999; Gallimore et al., 2004; Baan et al., 2022). However, this type of amplified emission always depends on a geometry where the amplifying column density is aligned with a background continuum. For extragalactic sources, the probability of this happening may be low and may vary significantly for different molecules. For Galactic sources, this geometry requirement may account for the (non-)occurrence of maser action in certain environments but it may also explain the variability and dynamic behaviour observed in sources.
The dominance of the OH emission from the foreground material highlights the complex nature of the nuclear regions of Arp 220 with large amounts of molecular material at velocities below and above the systemic velocity of the system. The large line-of-sight velocity width of the CO emission in Arp 220 of some 800 km s-1 (Wheeler et al., 2020) appears to be a characteristic for violent galaxy mergers as has been found in higher redshift OHMMs with OH line widths as high as 2400 km s-1 (Baan et al., 1992; Darling & Giovanelli, 2002; Pihlström et al., 2005). Incidentally, the presence of blueshifted foreground gas may also explain the blue tails in the OH emission profiles (interpreted as outflows) reaching some 800 km s-1 as in the case of Arp 220 (Baan et al., 1989).
7 acknowledgement
WAB acknowledges the support from the National Natural Science Foundation of China under grant No.11433008 and the Chinese Academy of Sciences Presidents International Fellowship Initiative under grants No. 2021VMA0008 and 2022VMA0019. TA acknowledges the support of the National SKA Program of China (grant 2022SKA0120102).
The European VLBI Network is a joint facility of independent European, African, Asian, and North American radio astronomy institutes. MERLIN is a National Facility operated by the University of Manchester at Jodrell Bank Observatory on behalf of STFC.
8 Data availability
The data for the experiments of Arp 220 may be obtained from the MERLIN Data Archive under project code MN-03B-22 and the EVN Data Archive under project code EB022C. Calibration of the data has been done using the NRAO Astronomical Image Processing System (AIPS) and with the ATNF MIRIAD Data Reduction Software for self-calibration and imaging.
References
- Baan (1985) Baan, W.A., 1985, Nature, 315, 26
- Baan (1989) Baan, W.A., 1989, ApJ, 338, 804
- Baan et al. (2017) Baan, W.A., An, T., Klöckner, H-R., Thomasson, P., 2017, MNRAS, 469, 916
- Baan et al. (2022) Baan, W.A., An, T., Henkel, C. et al. 2022, Nat. Astron., 6, 976, https://doi.org/10.1038/s41550-022-01706-y.
- Baan & Haschick (1984) Baan, W.A. & Haschick, A.D., 1984, ApJ, 279, 541
- Baan & Haschick (1995) Baan, W.A. & Haschick, A.D., 1995, ApJ, 454, 745
- Baan et al. (1989) Baan, W.A., Haschick, A.D. & Henkel, C., 1989, ApJ 346, 680
- Baan et al. (1992) Baan, W.A., Rhoads, J, Fisher, K., et al., 1992, ApJ, 396, L99
- Baan et al. (1982) Baan, W.A., Wood, P., and Haschick, A.D.,1982, ApJ, 260, L49
- Barcos-Muñoz et al. (2018) Barcos-Muñoz, L, Aalto, S., Thompson, T., et al., 2018, ApJ, 853, L28
- Clements et al. (2002) Clements D. L., McDowell J. C., Shaked S., et al., 2002, ApJ, 581, 974. doi:10.1086/344439
- Darling & Giovanelli (2002) Darling, J. & Giovanelli, R. 2002, AJ, 124, 100
- Downes & Solomon (1998) Downes D., Solomon P. M., 1998, ApJ, 507, 615. doi:10.1086/306339
- Gallimore et al. (2004) Gallimore, J., Baum, S.A, O’Dea, C.P., 2004, ApJ, 613, 794
- Herrnstein et al. (1999) Herrnstein, J.R., Moran, J.M., Greenhill, L.J., et al., 1999, Nature, 400, 539
- Iwasawa et al. (2005) Iwasawa, K., Sanders, D.B., Evans, A.S., et al ., 2005, MNRAS, 357, 565
- Klöckner (2004) Klöckner, H.-R., 2004, Extragalactic Hydroxyl, thesis, Univ. Groningen
- Lockhart et al. (2015) Lockhart, K.E., Kewley, L.J., Lu, J.R., et al. 2015,ApJ, 810, 149
- Lonsdale et al. (1998) Lonsdale C.J., Lonsdale C.J., Diamond P.J., et al., 1998, ApJ, 493, L13
- Lonsdale et al. (2006) Lonsdale, C.J., Diamond, P.J, Thrall, H., et al., 2006, ApJ, 647, 185L
- Mirabel (1982) Mirabel, I.F., 1982, ApJ, 260, 75
- Parra et al. (2007) Parra, R., Conway, J.E., Diamond, P.J., et al., 2007, ApJ, 659, 314
- Pihlström et al. (2005) Pihlström, Y.M., Baan, W.A., Darling, J., et al., 2005, ApJ, 618,7 05
- Rangwala et al. (2015) Rangwala, N., Maloney, P., Wilson, C., et al, 2015, ApJ., 806, 17
- Rovilos et al. (2003) Rovilos E., Diamond P.J., Lonsdale C.J., et al., 2003, MNRAS, 342, 373
- Sakamoto et al. (1999) Sakamoto, T., Scoville N.Z., Yun M.S., et al., 1999, ApJ, 514, 68
- Sakamoto et al. (2008) Sakamoto, T. Wang, J., Wiedner, M., et al., 2008, ApJ, 684, 957
- Sanders et al. (1988) Sanders, D., Soifer, B.T., Elias, J.H., et al., 1988, ApJ, 325, 74
- Sanders & Mirabel (1996) Sanders D. B., Mirabel I. F., 1996, ARA&A, 34, 749. doi:10.1146/annurev.astro.34.1.749
- Scoville et al. (1997) Scoville N. Z., Yun M. S., Bryant P. M., 1997, ApJ, 484, 702. doi:10.1086/304368
- Smith et al. (1998) Smith, H., Lonsdale, C.J., Diamond, P.J., et al., 1998, ApJ, 493, 17
- Soifer et al. (1984) Soifer B. T., Helou G., Lonsdale C. J., et al., 1984, ApJL, 283, L1. doi:10.1086/184319
- van der Tak et al. (2007) van der Tak, F.F.S., Black, J.H., Schöier, F.L., et al., 2007, A&A 468, 627 (arXiv:0704.0155v1).
- Varenius et al. (2016) Varenius, E., Conway, J.E., Martí-Vidal, I., et al. 2016, A&A, 593, A86
- Varenius et al. (2019) Varenius E., Conway J. E., Batejat F., et al., 2019, A&A, 623, A173. doi:10.1051/0004-6361/201730631
- Wheeler et al. (2020) Wheeler, J., Glenn, J, Rangwala, N., et al., 2020, ApJ, 896, 43
- Wilson et al. (2006) Wilson C. D., Harris W. E., Longden R., et al., 2006, ApJ, 641, 763. doi:10.1086/500577
- Zhang et al. (2014) Zhang, J.C., Wang, J.Z., Di, X.Z., et al., 2014, A&A, 570, A110