STAN: Stage-Adaptive Network for Multi-Task Recommendation by Learning
User Lifecycle-Based Representation
Abstract.
Recommendation systems play a vital role in many online platforms, with their primary objective being to satisfy and retain users. As directly optimizing user retention is challenging, multiple evaluation metrics are often employed. Existing methods generally formulate the optimization of these evaluation metrics as a multi-task learning problem, but often overlook the fact that user preferences for different tasks are personalized and change over time. Identifying and tracking the evolution of user preferences can lead to better user retention. To address this issue, we introduce the concept of “user lifecycle,” consisting of multiple stages characterized by users’ varying preferences for different tasks. We propose a novel Stage-Adaptive Network (STAN) framework for modeling user lifecycle stages. STAN first identifies latent user lifecycle stages based on learned user preferences, and then employs the stage representation to enhance multi-task learning performance. Our experimental results using both public and industrial datasets demonstrate that the proposed model significantly improves multi-task prediction performance compared to state-of-the-art methods, highlighting the importance of considering user lifecycle stages in recommendation systems. Furthermore, online A/B testing reveals that our model outperforms the existing model, achieving a significant improvement of 3.05% in staytime per user and 0.88% in CVR. These results indicate that our approach effectively improves the overall efficiency of the multi-task recommendation system.
1. Introduction
In recent years, online recommendation systems (RS) have become increasingly popular, assisting users in discovering their preferred items from a vast array of choices on platforms such as e-commerce and social media. The primary objective of RS is to attract, satisfy, and retain users. Researchers have proposed various techniques to achieve these objectives, including multi-task learning methods.
Due to the high dimensionality of RS (Tang et al., 2020), modeling its objectives is challenging. Many works represent the objectives through multiple directly learnable metrics, such as the likelihood of clicking, forwarding, and staying. Consequently, there has been a growing trend to apply multi-task learning methods to model the various aspects of user interests. Some studies (Wen et al., 2020; Ma et al., 2018a; Tang et al., 2020; Qin et al., 2020; Wang et al., 2022) suggest that click-through rate (CTR) and post-click conversion rate (CVR) are the best indicators of user satisfaction, proposing that clicking and purchasing actions are the primary drivers of user retention. Other works (Ma et al., 2018b; Xie et al., 2021; Wu et al., 2022b) consider user feedback (e.g., interactions like forward, comment, stay) as evaluation metrics, assuming that more interactions represent stronger user engagement and aiming to improve all interaction metrics simultaneously.
Nonetheless, these prior works do not fully consider the user lifecycle (Danescu-Niculescu-Mizil et al., 2013; Kwon et al., 2019; Li et al., 2021) and its impact on user satisfaction and retention. The user lifecycle consists of several stages, each characterized by user preferences towards different tasks. These preferences change over time as users evolve, and users may transition between stages with varying probabilities.
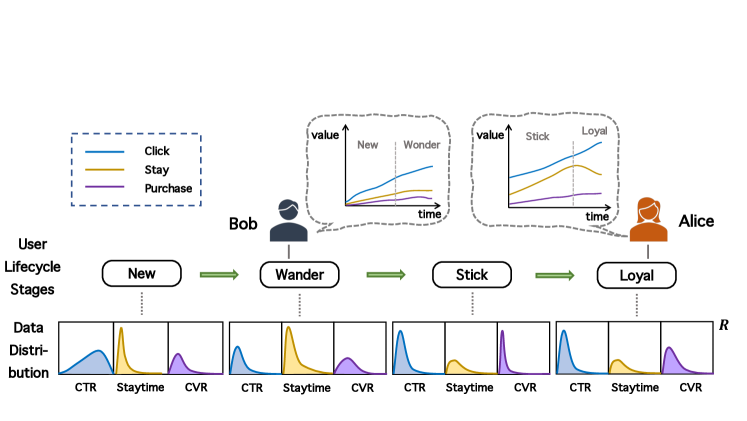
To emphasize the importance of incorporating user lifecycle stages into RS, consider the experiences of two users, Bob and Alice, as illustrated in Fig. 1. Typically, a user progresses through a series of stages since registering on the platform. Note that the four discrete stages in Fig. 1 are merely examples for visualization purposes, and the actual stages in our model are represented by continuous vectors. Bob exhibits wandering behavior, browsing quickly without intending to purchase items. Traditional multi-task RS might try to persuade him to buy by presenting top-selling products. However, this approach could result in his dissatisfaction, causing him to leave without making a purchase. Conversely, Alice has recently transitioned to a more committed stage. She previously preferred browsing to placing orders, but in her current stage, she is more likely to purchase without hesitation if the recommendation suits her preferences. Traditional multi-task RS might persist in recommending items aimed at prolonging her usage time, but these attempts may no longer capture her interest. By taking user lifecycle and stages into account, which can be customized to specific contexts, the recommendation system can more effectively address the diverse needs of users at different stages of their interactions with the platform.
We propose a user lifecycle stage-adaptive framework to address these issues. It dynamically adjusts its focus on tasks according to the user’s stage, which is modeled by the representation of their preferences. As user behavior may exhibit volatility, it is crucial to account for such instability when modeling preferences. For tasks not aligned with the user’s preferences, the user behaviors will be sparse, resulting in actions like clicks and purchases having large randomness and not accurately reflecting users’ true preferences. Identifying users’ preferences helps the model prioritize reliable targets to learn from, leading to improved performance. By incorporating user stages in the multi-task learning process, the model can focus on users’ highest-priority tasks. Our main contributions can be summarized as follows:
-
•
To the best of our knowledge, this is the first work to integrate the user lifecycle concept into multi-task recommendation systems. By considering the various stages in the user lifecycle, we can more effectively capture users’ changing interests.
-
•
We propose a user stage detection network that represents user stages using continuous user preferences, enabling the model to focus dynamically on each user’s preferred tasks.
-
•
We present comprehensive experimental results on both public and industrial datasets to substantiate our claims. Additionally, we applied our method to an online system, achieving significant improvements in online metrics. Visualization results further emphasize the importance of user lifecycle stages in multi-task recommendation systems.
The rest of the paper is organized as follows: Sec. 2 presents a preliminary analysis on the importance of user stages; Sec. 3 details our proposed Stage-Adaptive Network (STAN); Sec. 4 showcases experiments demonstrating STAN’s effectiveness; Sec. 5 discusses the model’s expandability and potential; Sec. 6 reviews related work, and Sec. 7 concludes the paper.
2. Preliminary Analysis
In this section, we first conduct a preliminary analysis of real-world datasets to show why considering user stage information is important for RS. We then formally define the notations and give the problem definition of our work.
2.1. Insights from Real-world Data
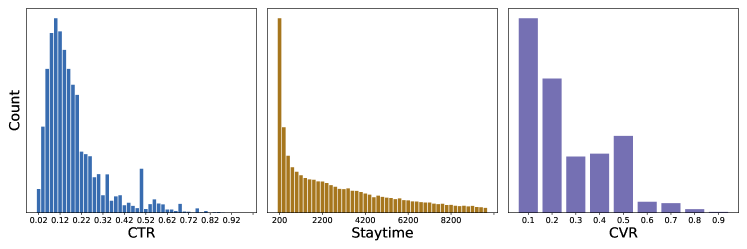
In this section, we discuss the e-commerce data used for analysis throughout this paper. We collected one month of user behavior data from an e-commerce platform, which records users’ clicks, staytime, and purchase actions. The behavior data is organized by user sessions, each of which is defined as a tuple of actions related to one impressed item. We randomly selected 50,000 users’ actions over three days for data analysis. Fig. 2 depicts the user distribution of the three metrics, i.e., CTR, Staytime, and CVR.
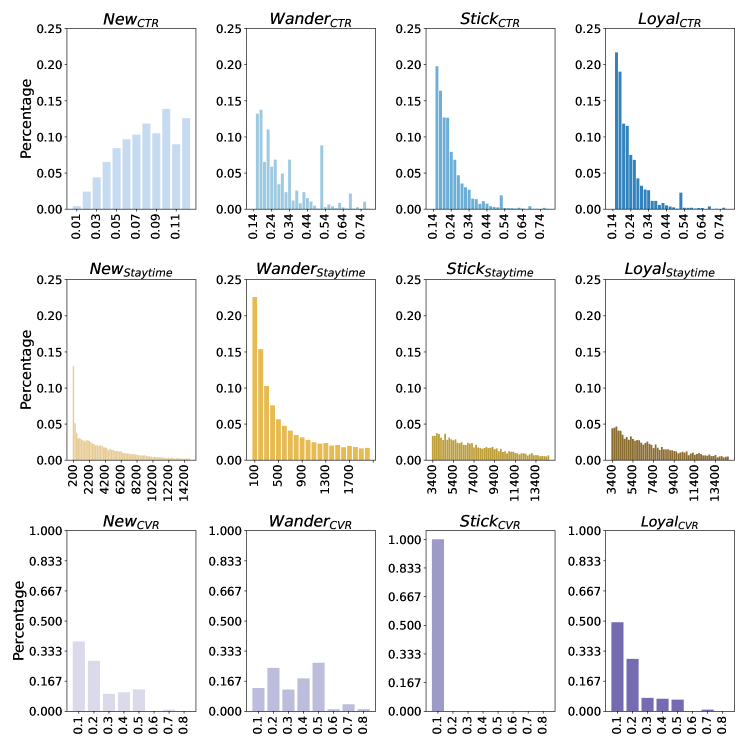
Inspired by previous works (Li et al., 2021; Kwon et al., 2019), we roughly separate users into four stages by the median of different metrics for a better illustration and explanation. The stages are named New, Wander, Stick and Loyal, as shown in Fig. 3. Note that one user could not belong to multiple stages. Each user at stage New are spotted by a low CTR rate, while their staytime and CVR distribution are the most similar to the overall distribution of all users. Their CTR value conforms to a Gaussian-like distribution but in a low-value range. Users at stage Wander have low staytime length. Their CTR and CVR rates are relatively high, but their staytime stick to a lower range. Users at stage Stick could be quickly found by their relatively low CVR value along with high CTR and staytime, which indicates that they only dwell on the platform but rarely contribute to purchasing. Users at stage Loyal show a custom of steadily clicking, staying, and purchasing on the platform, implying their satisfaction with the recommendation outcomes and the platform.
According to the stage patterns, we notice that users at different stages put their focus on specific things that could be manifested by statistical metrics. If we could discover and suit the user stage in the multi-task recommendation, we are more likely to improve model performance.
2.2. Notations and Problem Definition
Our preliminary analysis verifies that users at different stages conform to various data distributions. Thus, it would be of great help to consider adaptive stage information while conducting multiple recommendation tasks.
In our cases, we have a dataset consisting of users, each user exposed to items. The represents the user feature matrix, represents the item feature matrix. Here, , denote the number of user and item features, respectively, while and represent the dimensions of user and item features, respectively. Note that in the preprocessing phase, each user attribute is embedded into a -dimensional vector. A similar preprocessing is conducted for items. The label collection includes measurements for concerned tasks, where corresponds to CTR, staytime, and so on. For the overall preference of user , we compute . Note that some user features change over time. In the dataset, the behavior sequence is organized chronologically for each user, but there is no specific order for behavior sequences across different users.
Considering recommendation prediction tasks, our goal is to develop a framework that can recommend items while taking user stage information into account to enhance the prediction performance for each task.
3. Proposed Method
In this section, we propose a framework to extract the latent user stage information for enhancing multi-task recommendation.
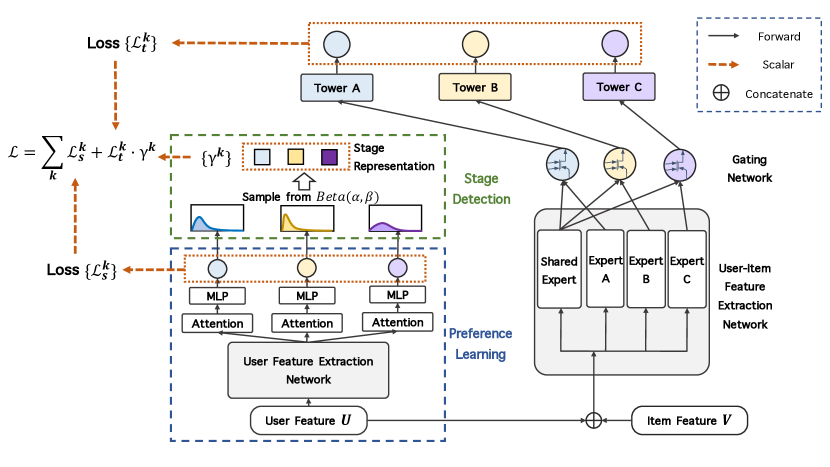
To be more specific, the framework is composed of two parts, as shown in Fig. 4: (i) a multi-task prediction part that learns the representation of the input data for different tasks, and (ii) a latent stage detection part that first grasps user preference. The preference is then applied to depict the latent user stage. Finally, a loss function adaptively adjusts the attention paid to tasks based on the learned user stage. The detailed building blocks and functional meanings are illustrated in the following subsections.
3.1. Multi-task Prediction Networks
In this subsection, we illustrate the components of the multi-task prediction module, which aims to learn the embedding from user and item features by training the backbone network. This network evaluates the difference between the ground truth and the predicted value for each task measurement, as shown on the right-hand side of Fig. 4.
In the literature, many multi-task learning models employ one or more shared networks, often referred to as "experts," as the foundation for learning common knowledge among different tasks. While these experts can capture the joint hidden information across tasks, they may suffer from dependencies among tasks and differences in data distribution for various tasks.
To address this issue, we follow the approach of (Tang et al., 2020) and limit the usage of shared experts in the first step. By doing so, we aim to alleviate harmful parameter interference, allowing for more robust learning and better performance in capturing the nuances of different tasks within our multi-task prediction module. We use to represent matrix vectorizaion333For a matrix , its vectorization can be written as .. With input , the features are extracted by
| (1) | ||||
| (2) | ||||
| (3) |
where is the weighting function in the backbone network which obtains the weighted vector of task by a linear layer with the Softmax activation function, is the trainable parameter matrix for task in the backbone, is the combination of the task-specific experts and shared experts . The is the gating network of task , which acts as the selector to calculate the weighted sum of the input. The represents the Hadamard (element-wise) product.
We could obtain the prediction value of each task as:
| (4) |
where denotes the tower network of task .
Conventionally, the loss function for multi-task learning can be represented as:
| (5) |
where is a hyperparameter and denotes the task-specific loss function. Typically, is determined by heuristic rules. However, using a fixed may not be suitable for every user, as their preferences for tasks can vary significantly. Furthermore, even for users whose preferences align with , the fixed might lead to performance degradation when their preferences change over time. To address these issues, we propose the user preference learning module and latent user stage representation module, which dynamically adapt to users’ preferences and stages.
3.2. User Preference Learning
In this subsection, we introduce the method for extracting user preferences to represent latent user stages. Since there are no explicit criteria to distinguish user stages, we can only infer users’ stage information from their behaviors. As the user stage can be described by a set of user preferences for all concerned tasks, we first propose a user preference learning module to represent a user’s preference.
The module consists of three building blocks: (i) a user feature extraction network that extracts more representative features from the input user features , (ii) a task-specific user representation learning unit that generates the corresponding embedding containing the hidden user preference for each task, and (iii) a task measurement prediction unit that utilizes the task-specific embedding to predict the value for each task.
First, the user feature extraction network uses a transformation that generates the user representation ,
| (6) |
where . To capture the relationships between different user features, we employ a self-attention unit (Vaswani et al., 2017) as function . The self-attention mechanism excels in modeling long-range dependencies and recognizing important features in the input data, which makes it a suitable choice for extracting user preferences. Specifically, let , , and be the query, key, and value matrices, where , and are all by weight matrices. Then, the self-attention mechanism can be written as
| (7) |
where is the softmax function444For vector , the -th entry of the softmax function is ..
Next, another attention unit generates a task-specific user representation according to the importance of different features, inspired by (Zhang et al., 2021). The attention mechanism effectively captures and emphasizes the importance of various features within the user representation. It allows the model to focus on the most relevant features for each specific task, ultimately leading to more accurate and tailored task-specific user representations. For task , the corresponding embeddings , are computed as follows,
| (8) |
where the weight matrix for task is learned during training.
Finally, the task measurement prediction unit takes in the task-specific user embedding to produce predicted values for each task. The prediction unit learns to represent the general user preference irrespective of individual items by training with user interactions across all items the user has encountered.
Single-layer feed-forward networks are used to predict the probability for the user to conduct the corresponding actions. Based on the learned embedding, the output user preference is defined as:
| (9) |
To account for the volatility in user behavior, we create a pseudo-label by considering the average behavior value over time for . This approach helps the network learn more information while maintaining greater stability:
| (10) |
where is the subset of containing only the first instances. This method incorporates the user’s preferences from the past few days, ensuring a more accurate representation of their recent interests.
Subsequently, the loss can be defined as:
| (11) |
One advantage of our user preference learning module is that it can capture user preferences without explicit supervision. Moreover, the learned preference representation could be adjusted dynamically as user behaviors change. Thus, the preference modeling process is of great adaptation to user preferences.
3.3. Latent User Stage Detection
In this subsection, we develop a latent user stage representation module, drawing inspiration from prior successful RS applications (Tang et al., 2014; Wang et al., 2011). We regard the output of the user preference module, , as the user’s inclination towards task . However, when the number of training samples for a user is limited, the predicted may be less informative. Therefore, we introduce the latent user stage representation module to adjust and generate a reliable preference, , for tasks during subsequent training.
More specifically, based on the initial data analysis in Sec. 2, the value is assumed to follow a Beta distribution, , i.e.,
| (12) |
where represents the number of trials in which user performs the concerned action in task , and represents the number of trials in which user does not perform the action. For example, when considering the task of predicting CTR, corresponds to the number of clicks, while represents the number of times the user did not click on the item.
The parameters and can be learned during training. As shown in Algorithm 1, the learned user preference toward different tasks will be more reliable as more samples are fed into the latent user stage representation module. With the refined behavior preference distribution , the output will be improved owing to a more robust and reliable preference .
Then, the preference measurement is used to control loss importance corresponding to user attention at the current stage. For the task in which the user is less interested, the corresponding loss will be given less attention in the back-propagation process. It could reduce the risk of negative transfer or seesaw phenomenon (Tang et al., 2020) in the extraction backbone network . Thus, the representation could be learned across tasks with a concentration on the valuable information about the user for the tasks.
3.4. Loss Function of STAN
There are two parts of losses in our framework: (i) loss for multi-task prediction network, and (ii) loss for stage detection network. Both of them are with respect to task . Thus, we give the overall objective to minimize as a linear combination of the losses with task-specific preference :
| (13) |
where is defined in Eq. 11. Let be the label in dataset, the is defined as:
| (14) |
Note that the losses for user stage detection and multi-task prediction are optimized simultaneously during training. In this way, the assessment of the user lifecycle stage can be optimized as the loss decreases. Improved stage representation can aid in enhancing the multi-task recommendation.
4. Experiments
In this section, we conduct comprehensive offline and online experiments on both large-scale recommendation systems and public benchmark datasets to evaluate the effectiveness of our proposed framework. Our experiments aim to address the following research questions:
RQ1: What is the performance of our proposed method compared with other state-of-art methods?
RQ2: What effect does detecting the user’s stage have on prediction results?
RQ3: Is the proposed framework able to effectively detect user lifecycle stages?
4.1. Experimental Settings
In this part, we provide an overview of the dataset descriptions, the baseline methods used for comparison, hyperparameters, and evaluation metrics employed in our experiments.
4.1.1. Datasets
| Dataset | # User | # Train | # Valid | # Test |
|---|---|---|---|---|
| Wechat-Video | 0.02M | 6.71M | 0.61M | 0.43M |
| Industrial | 75.42M | 612.88M | 82.47M | 407.95M |
-
•
Public dataset555https://algo.weixin.qq.com/2021/problem-description: The Wechat-Video dataset is a publicly available dataset containing 7.3 million user interaction samples from the Wechat Channels’ Recommendation System, involving a total of 20,000 users. Since no existing dataset provides a comprehensive set of tasks, including CVR, staytime, and CVR prediction, we utilize the most common user interactions in the Wechat-Video dataset, such as like, click avatar, and forward.
-
•
Industrial dataset: This dataset was collected from an e-commerce platform over a month in 2022. It consists of offline logs from one scenario in the livestreaming recommendation system and is chronologically divided into training, validation, and test sets. Since the staytime of users is a continuous value, we apply equal-frequency binning to the staytime in the dataset for convenience. Further analysis of the dataset can be found in Sec. 2.1.
4.1.2. Baseline Methods
We compare our methods with the following competitive baselines:
-
•
(Goodfellow et al., 2016): A single-task learning model using a basic MLP (multi-layer perceptron) for each task.
-
•
(Caruana, 1997): A shared-bottom model that shares the bottom layer in multi-task learning, implemented by MLP.
-
•
MMOE (Ma et al., 2018c): Uses a shared Expert module to extract underlying feature embeddings and applies different gates for each task to obtain varying fusing weights in multi-task learning.
-
•
(Tang et al., 2020): PLE (Progressive Layered Extraction) explicitly separates task-common and task-specific parameters to avoid parameter conflicts in multi-task learning using Customized Gate Control (CGC) layers. A PLE model consists of multiple CGC layers.
-
•
AITM (Xi et al., 2021): AITM (Adaptive Information Transfer Multi-task) models the sequential dependence among audience multi-step conversions using an information transfer module, focusing on different conversion stages of various audiences.
-
•
: Enhances the vanilla PLE structure by adding pre-knowledge of stage information. Stage information is combined with existing features. PLE is a widely applied baseline in the multi-task recommendation field, and we use it to evaluate the effect of incorporating stage information.
To examine the impact of adopting the Beta distribution, we conduct experiments on STAN without the latent stage representation module in Sec. 3.3, named STAN w/o Beta.
4.1.3. Hyper-Parameter
For a fair comparison, we search for optimal parameters on the validation data and evaluate these models on the test data. To ensure a level playing field, we constrain the maximum model size for all methods by setting the same upper bound for the number of hidden units per layer at 1024. For computational efficiency, we assign an embedding dimension of 128 to all methods. We employ ReLU (Glorot et al., 2011) as the activation function for all models. During training, we set the batch size to 2048. The Adam optimizer (Kingma and Ba, 2014) is used with settings = 0.9, = 0.999, and . We set the learning rate at 0.001.
For the user feature learning function , we adopt a deep neural network (DNN) structure due to its promising ability to extract hidden information from embeddings. Our approach and all baseline methods are implemented using TensorFlow666https://www.tensorflow.org/.
4.1.4. Evaluation Metrics
Specifically, we aim to evaluate the proposed work on two fronts: prediction and ranking. For offline experiments, existing works primarily use AUC (Area Under ROC) as the main ranking metric to gauge model performance. However, AUC only evaluates the average ranking performance of the model at all thresholds, disregarding the true user interest for each recommendation feed. Therefore, we apply Normalized Discounted Cumulative Gain (NDCG), which is suitable for evaluating whether users are generally interested in the top recommended items. Due to the specificity of the industrial dataset, the impression history of users is relatively short. In many cases, only a minimal number of impressions are collected. As a result, we use NDCG@1 as the evaluation metric for the industrial dataset. For the public dataset, we use NDCG@5 instead.
For comparison, we follow (Zhou et al., 2018) to introduce RelaImpr metric to measure the relative improvement of a measured model over the base model. For a random guesser, the value of AUC is 0.5. Hence RelaImpr for AUC is defined as:
| (15) |
For NDCG@ ( in our experiments), the RelaImpr is defined as:
| (16) |
In our experiments, we choose as the base model.
\ul
| Label | Metric | Method | |||||||
|---|---|---|---|---|---|---|---|---|---|
| MMOE | AITM | STAN w/o Beta | STAN | ||||||
| Like | AUC | 0.82330.0003 | 0.82410.0007 | 0.82600.0019 | \ul0.83170.0011 | 0.83120.0009 | 0.83130.0011 | 0.8413±0.0023 | 0.84190.0006* |
| RelaImpr | - | 0.24% | 0.83% | 2.59% | 2.44% | 2.47% | 5.58% | 5.76% | |
| NDCG@5 | 0.5652±0.0037 | 0.5793±0.0062 | 0.6042±0.0055 | 0.6049±0.0065 | \ul0.6437±0.0032 | 0.6418±0.0071 | 0.6645±0.0083 | 0.6737±0.0053* | |
| RelaImpr | - | 1.42% | 3.90% | 3.98% | 7.86% | 7.67% | 9.93% | 10.85% | |
| Click_avatar | AUC | 0.8230±0.0022 | 0.8279±0.0020 | 0.8286±0.0018 | 0.8317±0.0015 | 0.8442±0.0019 | \ul0.8471±0.0023 | 0.8496±0.0074 | 0.8530±0.0021* |
| RelaImpr | - | 1.52% | 1.73% | 2.69% | 6.57% | 7.47% | 8.22% | 9.30% | |
| NDCG@5 | 0.2129±0.0051 | 0.2261±0.0036 | 0.2295±0.0047 | \ul0.2371±0.0053 | 0.1993±0.0084 | 0.2371±0.0060 | 0.2474±0.0089 | 0.2499±0.0044* | |
| RelaImpr | - | 1.32% | 1.67% | 2.42% | -1.36% | 2.42% | 3.45% | 3.70% | |
| forward | AUC | 0.8692±0.0005 | 0.8751±0.0011 | 0.8803±0.0010 | 0.8805±0.0003 | 0.86978±0.0019 | \ul0.8837±0.0006 | 0.8846±0.0040 | 0.8856±0.0009 |
| RelaImpr | - | 1.58% | 2.99% | 3.03% | 0.14% | 3.90% | 4.25% | 4.42% | |
| NDCG@5 | 0.1317±0.0011 | \ul0.1536±0.0017 | 0.1515±0.0014 | 0.1405±0.0006 | 0.1392±0.0015 | 0.1483±0.0016 | 0.1570±0.0039 | 0.1581±0.0013* | |
| RelaImpr | - | 2.20% | 1.99% | 0.88% | 0.75% | 1.67% | 2.53% | 2.64% | |
| Label | Metric | Method | |||||||
|---|---|---|---|---|---|---|---|---|---|
| MMOE | AITM | STAN w/o Beta | STAN | ||||||
| CTR | AUC | 0.78910.0015 | 0.79380.0019 | 0.80660.0016 | 0.80560.0014 | 0.80710.0011 | \ul0.80890.0013 | 0.8140±0.0038 | 0.81410.0010* |
| RelaImpr | - | 1.63% | 6.05% | 5.71% | 6.23% | 6.85% | 8.61% | 8.65% | |
| NDCG@1 | 0.5727±0.0132 | 0.5945±0.0140 | 0.5895±0.0129 | 0.5825±0.0122 | \ul0.6440±0.0137 | 0.6421±0.0124 | 0.6739±0.0159 | 0.6737±0.0128* | |
| RelaImpr | - | 2.19% | 1.68% | 0.98% | 7.12% | 6.94% | 10.12% | 10.10% | |
| Staytime | AUC | 0.6635±0.0021 | 0.6721±0.0041 | 0.6770±0.0024 | 0.6835±0.0025 | 0.6801±0.0023 | \ul0.6879±0.0028 | 0.6925±0.0043 | 0.6937±0.0025* |
| RelaImpr | - | 5.27% | 8.26% | 12.29% | 10.15% | 14.92% | 17.74% | 18.47% | |
| NDCG@1 | 0.8029±0.0018 | 0.8186±0.0010 | 0.8270±0.0039 | 0.8170±0.0023 | 0.7993±0.0021 | \ul0.8273±0.0016 | 0.8381±0.0029 | 0.8399±0.0028* | |
| RelaImpr | - | 1.58% | 2.41% | 1.41% | -0.36% | 2.44% | 3.52% | 3.70% | |
| CVR | AUC | 0.7934±0.0057 | 0.7998±0.0063 | 0.8090±0.0069 | \ul0.8217±0.0073 | 0.8131±0.0081 | 0.8192±0.0052 | 0.8267±0.0090 | 0.8304±0.0075 |
| RelaImpr | - | 2.19% | 5.32% | 9.65% | 6.71% | 8.79% | 11.35% | 12.62% | |
| NDCG@1 | 0.5617±0.0023 | 0.6125±0.0035 | 0.6198±0.0025 | \ul0.6284±0.0027 | 0.6026±0.0032 | 0.6250±0.0028 | 0.6578±0.0041 | 0.6601±0.0021* | |
| RelaImpr | - | 5.08% | 5.81% | 6.67% | 4.09% | 6.33% | 9.61% | 9.84% | |
4.2. Performance Evaluation
To answer RQ1, we conduct experiments to compare the proposed model with the baseline methods. For the public dataset, we consider common actions, including like, click avatar (of the content creator), and forward. For the industrial dataset, we focus on classical RS prediction tasks: CTR, staytime, and CVR. The corresponding results are shown in Table 2 and Table 3, respectively.
Firstly, STAN achieves the most effective results on all tasks in both metrics and outperforms all the competitive baselines in the industrial and public datasets. Secondly, the performance of lags behind all of the multi-task methods, indicating the benefit of joint optimization for multi-task learning. Thirdly, by comparing different multi-task learning methods, we observe that the difficulty of optimizing different tasks can vary significantly. The MMOE method only controls knowledge learned by shared-expert layers. Although it improves the methods for some tasks, it suffers from a seesaw phenomenon (Tang et al., 2020) not only in different tasks but also in different metrics for the same task. Thanks to the exploitation of specific-expert layers’ learned knowledge, the vanilla PLE model outperforms the former models in most cases. The performance of the AITM method is not consistent across all datasets, which may result from the characteristics of the dataset. It can be seen that previous methods may decrease the NDCG score but increase the AUC score, which would require users to scroll down more times to discover their favorite items. This drawback may result from ignoring user stage information, which overlooks the real needs of the user. Overall, our proposed STAN model achieves significant improvement compared to several state-of-the-art methods, demonstrating the efficiency of introducing adaptively-learned stage information into the recommendation system.
In particular, we evaluate the effect of the latent user stage representation module. As shown in the result of STAN w/o Beta, if we apply the predicted instead of the preference to the overall loss update, the performance experiences greater fluctuation. The reason could be the small number of action histories for the majority of users, as modeling the user’s preference based solely on a few actions will lead to unstable results.
4.3. In-depth Stage Analysis
To answer RQ2, we conduct an in-depth analysis to uncover the real impact of incorporating user lifecycle adaptive stage information into the recommendation process.
4.3.1. Benefits of Considering Stages
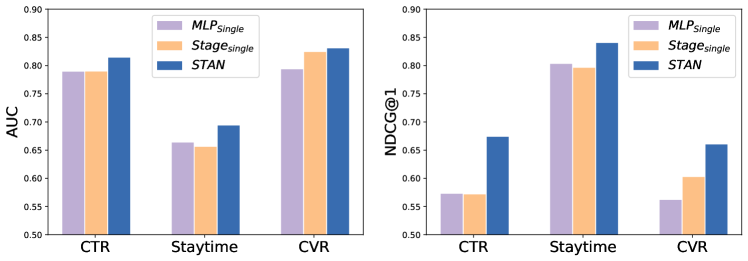
To assess the benefits of incorporating stage information during training, we first divide the training dataset into three subsets based on user stage information and then perform separate prediction tasks on each of these subsets. We refer to this as . The results are presented in Fig. 5. Surprisingly, even though the subsets are significantly smaller than the original training dataset, the performance is nearly the same, and sometimes even better. In this case, each subset is approximately 1/3 of the training dataset. This can be attributed to the fact that stage information helps reduce the number of noisy samples in the entire dataset. In multi-task learning problems, not every sample is useful for all tasks. However, conventional multi-task learning methods train all samples for each task simultaneously, which inevitably introduces noise for specific tasks. By leveraging stage information, multi-task learning methods can reduce the noise caused by instances from other stages during training. Consequently, they can learn more accurate representations, leading to improved performance.
4.3.2. Benefits of Considering Adaptive Stages
Although expert knowledge can be helpful in creating rule-based stage discrimination strategies, these designed rules may not be adaptive to various scenarios in applications, let alone different datasets. Therefore, we compare the performance of and STAN in Table 2 and Table 3, representing our framework under conditions of fixed user stage and adaptive user stage, respectively. Generally, utilizing rule-based stage information results in inferior model performance compared to the model that employs adaptive stage information. This can be attributed to the differences in stage sensitivity between the models. As STAN represents the user stage using a learned vector instead of a predefined stage number, it can capture subtle variations in user stages more effectively.
4.4. Case Study
To address RQ3, we visualize the embedding vectors of users at different stages for both public and industrial datasets. For a clearer illustration, we create discrete stage labels by clustering the stage representation vectors.
4.4.1. User Stage Visualization
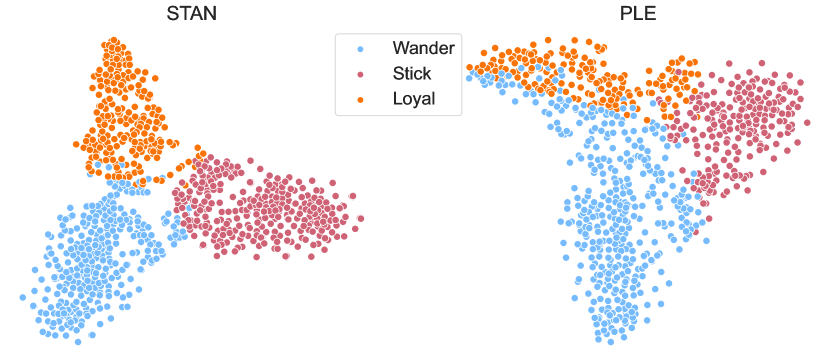
For each dataset, we randomly select 1,000 user embeddings from the stages divided by the method in Sec. 2.1. Each point in Fig. 6 represents a user with embeddings learned by STAN and PLE, respectively. Each color denotes a type of user stage; since the public dataset is pre-processed by its issuer, there are no users at Stage New. According to Fig. 6, the user embeddings learned by STAN can be more clearly separated from each other compared to those learned by PLE. This demonstrates the effectiveness of STAN in detecting user stages.
4.4.2. User Stage in Change
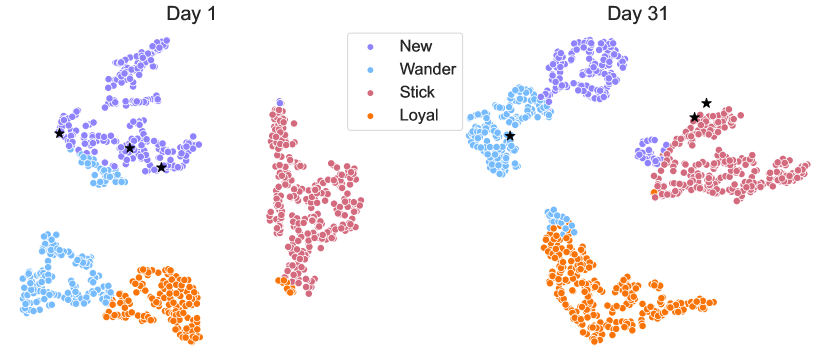
A user’s stage may change as he/she dwells on the platform. The user lifecycle stage detection method should be adaptive to the shift of user stages as their features change. To evaluate this ability, we visualize the detected user stages of the same group of users on the first and last day of our industrial dataset in Fig. 7. The concerned users are highlighted as stars. We find that the same user may exhibit very different behaviors at different times, which indicates different user stages. Take the users in Fig. 7 as an example. At the start, all of them are at stage New. However, one month later, one of them transitions to stage Wander, and the other two transition to stage Stick. The observed user stage changes indeed highlight the dynamic nature of users’ preferences and emphasize the importance of tracking these preferences in multi-task recommendation systems.
4.5. Online A/B Testing and Deployment
We carried out rigorous online A/B testing in our e-commerce live streaming scenario from 2023-03-15 to 2023-04-04, with a daily average of millions of users. Our proposed STAN model demonstrated significant improvements compared to its predecessor, with a CTR increase of 3.94%, staytime increase of 3.05%, and a CVR increase of 0.88%. Based on these promising results, our model has been fully deployed and now serves the main traffic.
It is important to highlight that during the nearly month-long A/B testing, the e-commerce system underwent large-scale promotions, substantially impacting users’ decision-making processes and potentially influencing their lifecycle stages. Despite these challenges, STAN’s performance improvements remained consistent, further accentuating its effectiveness in managing user preferences in recommendation systems.
5. Discussion
In practical applications, it is a widespread industry approach to develop separate models for active and non-active users, often referred to as "cold-start users" (Rajapakse and Leith, 2022; Son, 2016). The model for non-active users typically aims to boost engagement, while the model for active users concentrates on improving their CVR or Staytime. However, users in the same class can exhibit diverse characteristics. For instance, Alice and Bob, both active on the platform, might have significantly different CVRs, such as 0.7 and 0.2.
Thus, we propose a more nuanced approach to capture their preferences, better distinguishing between such users. This approach could benefit other recommendation structures, such as session-based user modeling techniques. Session-based recommendation approaches often assume that all labels are correct. However, since the user’s preference is uncertain at some stages, user-generated labels at these stages should not be used as deterministic for modeling. In this scenario, incorporating our method could help session-based methods learn from more convincing labels, resulting in a more accurate representation of users’ preferences and improved recommendations.
The former observation also leads us to another critical aspect largely overlooked in existing research: the trade-off between multiple task objectives. As these objectives are optimized globally for various goals, this approach can result in potential conflicts in gradient optimization. We argue that reducing the conflicts can be achieved by identifying the specific tasks that different users prioritize, allowing for a more tailored recommendation system that adapts to individual user preferences.
Building upon these insights, we have designed our experiments to capture the user’s recent preference effectively. In our method’s overall design, all samples preceding the current sample are used for calculating the average, which is applied to both public and industrial datasets. However, in a real online system, considering a too-long period would lead to higher overhead in storage computation, and behaviors with extended intervals may create perturbations to the current behavior and introduce instability, which is beyond the scope of this paper. Therefore, our online system focuses on behaviors within a 30-day window to calculate the average, ensuring a more accurate and manageable representation of users’ recent preferences.
6. Related Works
In this section, we review related work in two main areas: (i) multi-task learning for recommendation systems and (ii) user representation modeling.
6.1. Interested Tasks on Recommendation Systems
Existing research on multi-task recommendation systems can be broadly classified into two categories. The first category focuses on user conversion rates (Ma et al., 2018b; Wen et al., 2020; Xi et al., 2021; Wang et al., 2022; Bai et al., 2022), which yield significant profits for e-commerce platforms. The most representative user conversion tasks are the Click-Through Rate (CTR) and Click Conversion Rate (CVR). Some studies, such as (Ma et al., 2018b; Wang et al., 2022; Wu et al., 2022a), propose optimizing these tasks concurrently in a multi-task learning model, aiming to leverage valuable knowledge learned across tasks. However, the inherent divergence between prediction tasks can lead to reduced overall performance when optimizing them simultaneously. To address this issue, recent work (Zhang et al., 2022; Wu et al., 2022a) has achieved notable success by incorporating scenario knowledge into task prediction. For example, Zhang et al. (Zhang et al., 2022) employed a meta-learning approach to predict tasks across multiple advertising scenarios. However, scenario information alone is insufficient for providing user-specific recommendations.
The second category of research aims to engage users on online platforms. Common metrics include user feedback, such as clicks, finishes, and dwell time (Yi et al., 2014; Zou et al., 2019; Tang et al., 2020; Wu et al., 2021). Among these, user clicks and dwell time, or staytime, are the most descriptive metrics (Wu et al., 2022b), but they are often overlooked in the context of the first category of work and rarely considered alongside CVR, which is essential for user conversion on online platforms.
6.2. User Modeling and Representation in Lifecycle
User modeling is another critical aspect of related work. It has received significant attention as user behavior variations offer valuable insights into user interests, particularly in the context of shifting trends. Some research models users based on their behavior sequences, using either Markov-chain methodologies (Rendle et al., 2010) or deep neural networks (Hidasi et al., 2016; Tang and Wang, 2018) to implicitly model user state dynamics and predict resulting behaviors. These methods primarily focus on short-term user modeling constrained by recent behaviors. To identify long-term behavior dependencies works such as (Ren et al., 2019; Pi et al., 2020; Yuan et al., 2021) have proposed recommendation system models with "lifelong" learning capacity. However, these models tend to learn long-term user behaviors coarsely, overlooking differences between various lifecycle stages.
Some studies have considered cold-start as a stage of the lifecycle for recommendation system users (Cao et al., 2022). While these cold-start frameworks excel in serving new users, their performance diminishes as users mature. Unfortunately, model alteration often leads to user churn and instability in industrial applications.
7. Conclusion
In this paper, we innovatively introduce the concept of user lifecycle stages to enhance multi-task learning in recommendation systems. We propose STAN, a user lifecycle stage-adaptive framework that models latent stage information. STAN first learns user preferences for various tasks by utilizing user behaviors and then represents latent user stages based on these learned preferences. By incorporating latent user stage information into multi-task recommendations, STAN can identify the most critical task for each user and adjust accordingly as users’ interests evolve. Experimental results on public and industrial datasets and online recommendation services demonstrate the effectiveness of our proposed framework.
For future work, we plan to explore the application of adaptive stage information in a broader range of contexts, including online social networks, advertising, and search systems.
References
- (1)
- Bai et al. (2022) Ting Bai, Yudong Xiao, Bin Wu, Guojun Yang, Hongyong Yu, and Jian-Yun Nie. 2022. A Contrastive Sharing Model for Multi-Task Recommendation. In Proceedings of the 31st international conference on World Wide Web. 3239–3247.
- Cao et al. (2022) Jiangxia Cao, Jiawei Sheng, Xin Cong, Tingwen Liu, and Bin Wang. 2022. Cross-Domain Recommendation to Cold-Start Users via Variational Information Bottleneck. In IEEE International Conference on Data Engineering.
- Caruana (1997) Rich Caruana. 1997. Multitask learning. Machine learning 28, 1 (1997), 41–75.
- Danescu-Niculescu-Mizil et al. (2013) Cristian Danescu-Niculescu-Mizil, Robert West, Dan Jurafsky, Jure Leskovec, and Christopher Potts. 2013. No country for old members: User lifecycle and linguistic change in online communities. In Proceedings of the 22nd international conference on World Wide Web. 307–318.
- Glorot et al. (2011) Xavier Glorot, Antoine Bordes, and Yoshua Bengio. 2011. Deep sparse rectifier neural networks. In Proceedings of the 14th international conference on artificial intelligence and statistics. JMLR Workshop and Conference Proceedings, 315–323.
- Goodfellow et al. (2016) Ian Goodfellow, Yoshua Bengio, and Aaron Courville. 2016. Deep learning. MIT press.
- Hidasi et al. (2016) Balázs Hidasi, Alexandros Karatzoglou, Linas Baltrunas, and Domonkos Tikk. 2016. Session-based recommendations with recurrent neural networks. ICLR (2016).
- Kingma and Ba (2014) Diederik P Kingma and Jimmy Ba. 2014. Adam: A method for stochastic optimization. arXiv preprint arXiv:1412.6980 (2014).
- Kwon et al. (2019) Young D Kwon, Dimitris Chatzopoulos, Ehsan ul Haq, Raymond Chi-Wing Wong, and Pan Hui. 2019. GeoLifecycle: User engagement of geographical exploration and churn prediction in LBSNs. Proceedings of the ACM on Interactive, Mobile, Wearable and Ubiquitous Technologies 3, 3 (2019), 1–29.
- Li et al. (2021) Wanda Li, Zhiwei Xu, Yi Sun, Qingyuan Gong, Yang Chen, Aaron Yi Ding, Xin Wang, and Pan Hui. 2021. DeepPick: A Deep Learning Approach to Unveil Outstanding Users Ranking with Public Attainable Features. IEEE Transactions on Knowledge and Data Engineering (2021).
- Ma et al. (2018c) Jiaqi Ma, Zhe Zhao, Xinyang Yi, Jilin Chen, Lichan Hong, and Ed H Chi. 2018c. Modeling task relationships in multi-task learning with multi-gate mixture-of-experts. In Proceedings of the 24th ACM SIGKDD international conference on knowledge discovery & data mining. 1930–1939.
- Ma et al. (2018a) Xiao Ma, Liqin Zhao, Guan Huang, Zhi Wang, Zelin Hu, Xiaoqiang Zhu, and Kun Gai. 2018a. Entire space multi-task model: An effective approach for estimating post-click conversion rate. In Proceedings of the 41st International ACM SIGIR Conference on Research & Development in Information Retrieval. 1137–1140.
- Ma et al. (2018b) Xiao Ma, Liqin Zhao, Guan Huang, Zhi Wang, Zelin Hu, Xiaoqiang Zhu, and Kun Gai. 2018b. Entire space multi-task model: An effective approach for estimating post-click conversion rate. In Proceedings of the 41st International ACM SIGIR Conference on Research & Development in Information Retrieval. 1137–1140.
- Pi et al. (2020) Qi Pi, Guorui Zhou, Yujing Zhang, Zhe Wang, Lejian Ren, Ying Fan, Xiaoqiang Zhu, and Kun Gai. 2020. Search-based user interest modeling with lifelong sequential behavior data for click-through rate prediction. In Proceedings of the 29th ACM International Conference on Information & Knowledge Management. 2685–2692.
- Qin et al. (2020) Zhen Qin, Yicheng Cheng, Zhe Zhao, Zhe Chen, Donald Metzler, and Jingzheng Qin. 2020. Multitask mixture of sequential experts for user activity streams. In Proceedings of the 26th ACM SIGKDD International Conference on Knowledge Discovery & Data Mining. 3083–3091.
- Rajapakse and Leith (2022) Dilina Chandika Rajapakse and Douglas Leith. 2022. Fast and Accurate User Cold-Start Learning Using Monte Carlo Tree Search. In Proceedings of the 16th ACM Conference on Recommender Systems. 350–359.
- Ren et al. (2019) Kan Ren, Jiarui Qin, Yuchen Fang, Weinan Zhang, Lei Zheng, Weijie Bian, Guorui Zhou, Jian Xu, Yong Yu, Xiaoqiang Zhu, et al. 2019. Lifelong sequential modeling with personalized memorization for user response prediction. In Proceedings of the 42nd International ACM SIGIR Conference on Research and Development in Information Retrieval. 565–574.
- Rendle et al. (2010) Steffen Rendle, Christoph Freudenthaler, and Lars Schmidt-Thieme. 2010. Factorizing personalized markov chains for next-basket recommendation. In Proceedings of the 19th international conference on World wide web. 811–820.
- Son (2016) Le Hoang Son. 2016. Dealing with the new user cold-start problem in recommender systems: A comparative review. Information Systems 58 (2016), 87–104.
- Tang et al. (2020) Hongyan Tang, Junning Liu, Ming Zhao, and Xudong Gong. 2020. Progressive layered extraction (ple): A novel multi-task learning (mtl) model for personalized recommendations. In Proceedings of the 14th ACM Conference on Recommender Systems. 269–278.
- Tang and Wang (2018) Jiaxi Tang and Ke Wang. 2018. Personalized top-n sequential recommendation via convolutional sequence embedding. In Proceedings of the 11th ACM international conference on web search and data mining. 565–573.
- Tang et al. (2014) Liang Tang, Yexi Jiang, Lei Li, and Tao Li. 2014. Ensemble contextual bandits for personalized recommendation. In Proceedings of the 8th ACM Conference on Recommender Systems. 73–80.
- Van der Maaten and Hinton (2008) Laurens Van der Maaten and Geoffrey Hinton. 2008. Visualizing data using t-SNE. Journal of machine learning research 9, 11 (2008).
- Vaswani et al. (2017) Ashish Vaswani, Noam Shazeer, Niki Parmar, Jakob Uszkoreit, Llion Jones, Aidan N Gomez, Łukasz Kaiser, and Illia Polosukhin. 2017. Attention is all you need. Advances in neural information processing systems 30 (2017).
- Wang et al. (2022) Hao Wang, Tai-Wei Chang, Tianqiao Liu, Jianmin Huang, Zhichao Chen, Chao Yu, Ruopeng Li, and Wei Chu. 2022. ESCM 2: Entire Space Counterfactual Multi-Task Model for Post-Click Conversion Rate Estimation. Proceedings of the 45th International ACM SIGIR Conference on Research and Development in Information Retrieval.
- Wang et al. (2011) Xuerui Wang, Wei Li, Ying Cui, Ruofei Zhang, and Jianchang Mao. 2011. Click-through rate estimation for rare events in online advertising. In Online multimedia advertising: Techniques and technologies. IGI Global, 1–12.
- Wen et al. (2020) Hong Wen, Jing Zhang, Yuan Wang, Fuyu Lv, Wentian Bao, Quan Lin, and Keping Yang. 2020. Entire space multi-task modeling via post-click behavior decomposition for conversion rate prediction. In Proceedings of the 43rd International ACM SIGIR conference on research and development in Information Retrieval. 2377–2386.
- Wu et al. (2022b) Chuhan Wu, Fangzhao Wu, Tao Qi, Qi Liu, Xuan Tian, Jie Li, Wei He, Yongfeng Huang, and Xing Xie. 2022b. Feedrec: News feed recommendation with various user feedbacks. In Proceedings of the 31st international conference on World Wide Web. 2088–2097.
- Wu et al. (2021) Chuhan Wu, Fangzhao Wu, Xiting Wang, Yongfeng Huang, and Xing Xie. 2021. Fairness-aware news recommendation with decomposed adversarial learning. In Proceedings of the 35th AAAI Conference on Artificial Intelligence, Vol. 35. 4462–4469.
- Wu et al. (2022a) Xuyang Wu, Alessandro Magnani, Suthee Chaidaroon, Ajit Puthenputhussery, Ciya Liao, and Yi Fang. 2022a. A Multi-task Learning Framework for Product Ranking with BERT. In Proceedings of the 31st international conference on World Wide Web. 493–501.
- Xi et al. (2021) Dongbo Xi, Zhen Chen, Peng Yan, Yinger Zhang, Yongchun Zhu, Fuzhen Zhuang, and Yu Chen. 2021. Modeling the sequential dependence among audience multi-step conversions with multi-task learning in targeted display advertising. In Proceedings of the 27th ACM SIGKDD Conference on Knowledge Discovery & Data Mining. 3745–3755.
- Xie et al. (2021) Ruobing Xie, Cheng Ling, Yalong Wang, Rui Wang, Feng Xia, and Leyu Lin. 2021. Deep feedback network for recommendation. In Proceedings of the 29th International Conference on International Joint Conferences on Artificial Intelligence. 2519–2525.
- Yi et al. (2014) Xing Yi, Liangjie Hong, Erheng Zhong, Nanthan Nan Liu, and Suju Rajan. 2014. Beyond clicks: dwell time for personalization. In Proceedings of the 8th ACM Conference on Recommender systems. 113–120.
- Yuan et al. (2021) Fajie Yuan, Guoxiao Zhang, Alexandros Karatzoglou, Joemon Jose, Beibei Kong, and Yudong Li. 2021. One person, one model, one world: Learning continual user representation without forgetting. In Proceedings of the 44th International ACM SIGIR Conference on Research and Development in Information Retrieval. 696–705.
- Zhang et al. (2022) Qianqian Zhang, Xinru Liao, Quan Liu, Jian Xu, and Bo Zheng. 2022. Leaving No One Behind: A Multi-Scenario Multi-Task Meta Learning Approach for Advertiser Modeling. In Proceedings of the 15th ACM International Conference on Web Search and Data Mining. 1368–1376.
- Zhang et al. (2021) Zhuosheng Zhang, Junjie Yang, and Hai Zhao. 2021. Retrospective reader for machine reading comprehension. In Proceedings of the 35th AAAI Conference on Artificial Intelligence, Vol. 35. 14506–14514.
- Zhou et al. (2018) Guorui Zhou, Xiaoqiang Zhu, Chenru Song, Ying Fan, Han Zhu, Xiao Ma, Yanghui Yan, Junqi Jin, Han Li, and Kun Gai. 2018. Deep interest network for click-through rate prediction. In Proceedings of the 24th ACM SIGKDD international conference on knowledge discovery & data mining. 1059–1068.
- Zou et al. (2019) Lixin Zou, Long Xia, Zhuoye Ding, Jiaxing Song, Weidong Liu, and Dawei Yin. 2019. Reinforcement learning to optimize long-term user engagement in recommender systems. In Proceedings of the 25th ACM SIGKDD International Conference on Knowledge Discovery & Data Mining. 2810–2818.