Which Spurious Correlations Impact Reasoning in NLI Models?
A Visual Interactive Diagnosis through Data-Constrained Counterfactuals
Abstract
We present a human-in-the-loop dashboard tailored to diagnosing potential spurious features that NLI models rely on for predictions. The dashboard enables users to generate diverse and challenging examples by drawing inspiration from GPT-3 suggestions. Additionally, users can receive feedback from a trained NLI model on how challenging the newly created example is and make refinements based on the feedback. Through our investigation, we discover several categories of spurious correlations that impact the reasoning of NLI models, which we group into three categories: Semantic Relevance, Logical Fallacies, and Bias. Based on our findings, we identify and describe various research opportunities, including diversifying training data and assessing NLI models’ robustness by creating adversarial test suites.
1 Introduction
The availability of crowdsourced large-scale datasets has been influential in the field of natural language processing. These datasets have empowered advancements in a wide range of downstream tasks, including the natural language inference (NLI) task (SNLI; Bowman et al., 2015). While being influential, crowdsourcing frameworks can introduce artifacts, biases, and spurious correlations that can negatively impact the robustness and out-of-domain generalization of the models that are trained on such datasets (Jia and Liang, 2017; McCoy et al., 2019).
A spurious correlation exists when a feature correlates with the target label while there is no causal relationship between the feature and the label. For example, the fact that a sentence includes the word “amazing” (as a feature) might correlate with a positive sentiment but does not cause the sentiment label to be positive, as one can imagine crafting a sentence like “the amazing concert was ruined by the terrible acoustics in the venue”, which has a negative sentiment. It has been shown that such spurious correlations exist in crowdsourced datasets (Gardner et al., 2021), and this will prevent models that are trained on these datasets from performing on adversarial or out-of-domain test sets (McCoy et al., 2019).
One approach to prevent a model from relying on spurious correlations between a feature and the label is to break such correlations by providing counterfactuals during training. In this context, counterfactuals are data points that contain the feature but have a different label. Following our previous example, “the amazing concert was ruined by the terrible acoustics in the venue” is a counterfactual sentence since it contains the word “amazing” but has a negative sentiment. Augmenting datasets with counterfactuals can break the spurious correlations and help the model to generalize to out-of-domain examples. However, generating counterfactuals is challenging; it involves first identifying noncausal features that correlate with the label, i.e., spurious correlations, and then generating the counterfactuals for a given feature.
One simple approach to generate counterfactuals is through minimal edits. In this approach, the first step—identifying spurious correlations—is bypassed. Therefore, counterfactuals are generated without targeting any specific feature. To generate a counterfactual, existing data points in the dataset are edited minimally such that they have a different label compared to their original one. While such an approach is scalable and can be effective in certain scenarios (Khashabi et al., 2020), creating counterfactuals through minimal edits does not necessarily improve the generalization of models and might even hurt the performance (Huang et al., 2020). Therefore, there is a need for a more nuanced and innovative approach to counterfactual generation.
In this paper, we propose a data-centric approach to counterfactual generation. First, we identify existing counterfactuals in datasets, which we term data-constrained counterfactuals (DCC). Second, using our interactive dashboard, we diagnose features that spuriously correlate with their label by comparing and contrasting the DCC with other data points in the dataset. Lastly, we generate a diverse set of counterfactual examples with the help of GPT-3 (davinci-003; Brown et al., 2020).
Overall, our dashboard offers a human-in-the-loop, or more generally, a mixed-initiative approach. A user can diagnose spurious correlations and common patterns that result in NLI models’ inability to predict the labels correctly. Finding such weak spots can provide ways to improve the NLI model. Furthermore, after the user has generated a set of new counterfactuals, the NLI model can give feedback on how valuable each counterfactual is by expressing its uncertainty in predicting the sample’s annotated label. This can help the user to revise the counterfactual and improve the usefulness of the generated set.
While our dashboard can be extended to various tasks in natural language processing, we focus on the NLI task in this work. Using our dashboard, we find a variety of features that correlate spuriously with labels. We categorize these features into three categories, which we name: Semantic Relevance, Logical Fallacies, and Biases. We further find a category of samples that are annotation artifacts. Based on these findings, and with the help of our dashboard, one can create novel counterfactuals to assess the robustness of NLI models or use them to augment training sets.
2 Preliminaries
Before introducing our approach, we first go through some preliminaries. We briefly describe the NLI task and a tool called Data Maps.
Natural Language Inference (NLI).
We employ our dashboard for the NLI task. The task is to determine whether a premise entails, contradicts, or is neutral to a hypothesis (Condoravdi et al., 2003; Dagan et al., 2006; Bowman et al., 2015). As with many other NLP tasks, neural NLI models have been shown to rely on spurious correlations (Gardner et al., 2021). For example, they often predict contradiction when the hypothesis contains the word “not”. To obtain some hints on whether a model is relying on spurious correlations, we use data maps, which we describe next.
Data Maps.
Swayamdipta et al. (2020) propose a tool called Data Maps to diagnose the characteristics of datasets with respect to a model’s behavior during training. They propose two axes to locate each training data point in two dimensions. First, the confidence is defined as the average probability that the model assigns to the true label throughout training checkpoints, and second, the variability of its confidence across the checkpoints. They identify three different regions in data maps: i) a region consisting of data points where the model has high confidence with low variability, i.e., easy to learn data points, ii) a region consisting of data points where the model’s confidence on the true label fluctuates a lot (high variability), i.e., ambiguous data points, and iii) a region where the model has low confidence on the true label with low variability, i.e., hard to learn data points.
In this paper, we employ data maps at two stages. First, in § 3 we discuss how to use data maps to locate DCCs. Second, we incorporate data maps in our interactive dashboard and further provide estimates of the location of newly created data points in the data map. Such an estimate gives early feedback to the user on how challenging it could be for the model to predict the label of the generated counterfactual. The user can then act on this feedback by revising the counterfactual.
3 Data-Constrained Counterfactuals
In this work, we propose to start with finding existing counterfactuals in datasets. We will later use these counterfactuals in our dashboard § 4 to find spurious features and generate new data points.
A data-constrained counterfactual is a data point that shares some features with other data points in the dataset but has a different label. Further, we want to make sure that the model is sensitive to the spurious correlation. Therefore, it should not be easy for the model to label a DCC correctly. We provide the following formal definition of data-constrained counterfactuals.
Definition 1.
A data point is a data-constrained counterfactual (DCC) when it satisfies two conditions: i) there exists other data points in the training set that are similar to this data point but have a different label, and ii) it is not easy for the model to label it correctly, i.e., it falls into either the hard-to-learn or the ambiguous region in the data map.
This definition relies on a notion of similarity; thus, to identify DCCs we need to provide a similarity metric between data points. Following Liu et al. (2022), we define the similarity between data points as the cosine similarity between the [cls] embedding of data points given by the underlying model. This will give us a tractable measure to find similar data points in large datasets without any manual inspection of the data.
A caveat to Def. 1 is that many data points in the hard-to-learn region have been found to be mislabeled (Swayamdipta et al., 2020). To filter out samples that are likely to be mislabeled, we only select samples that have multiple annotations, where a large111, as most multiple-annotated SNLI samples have four label annotations. majority of annotators agree on the label.
4 Visual Interactive Dashboard
In this section, we describe the tasks that users can perform during the interactive counterfactual generation process. We categorize these tasks using the explAIner framework SpinnerEtAl2020.
4.1 Understanding
First, the user is provided with enough information and supporting visuals to understand the DCC that is being selected. This involves two tasks, explained below.
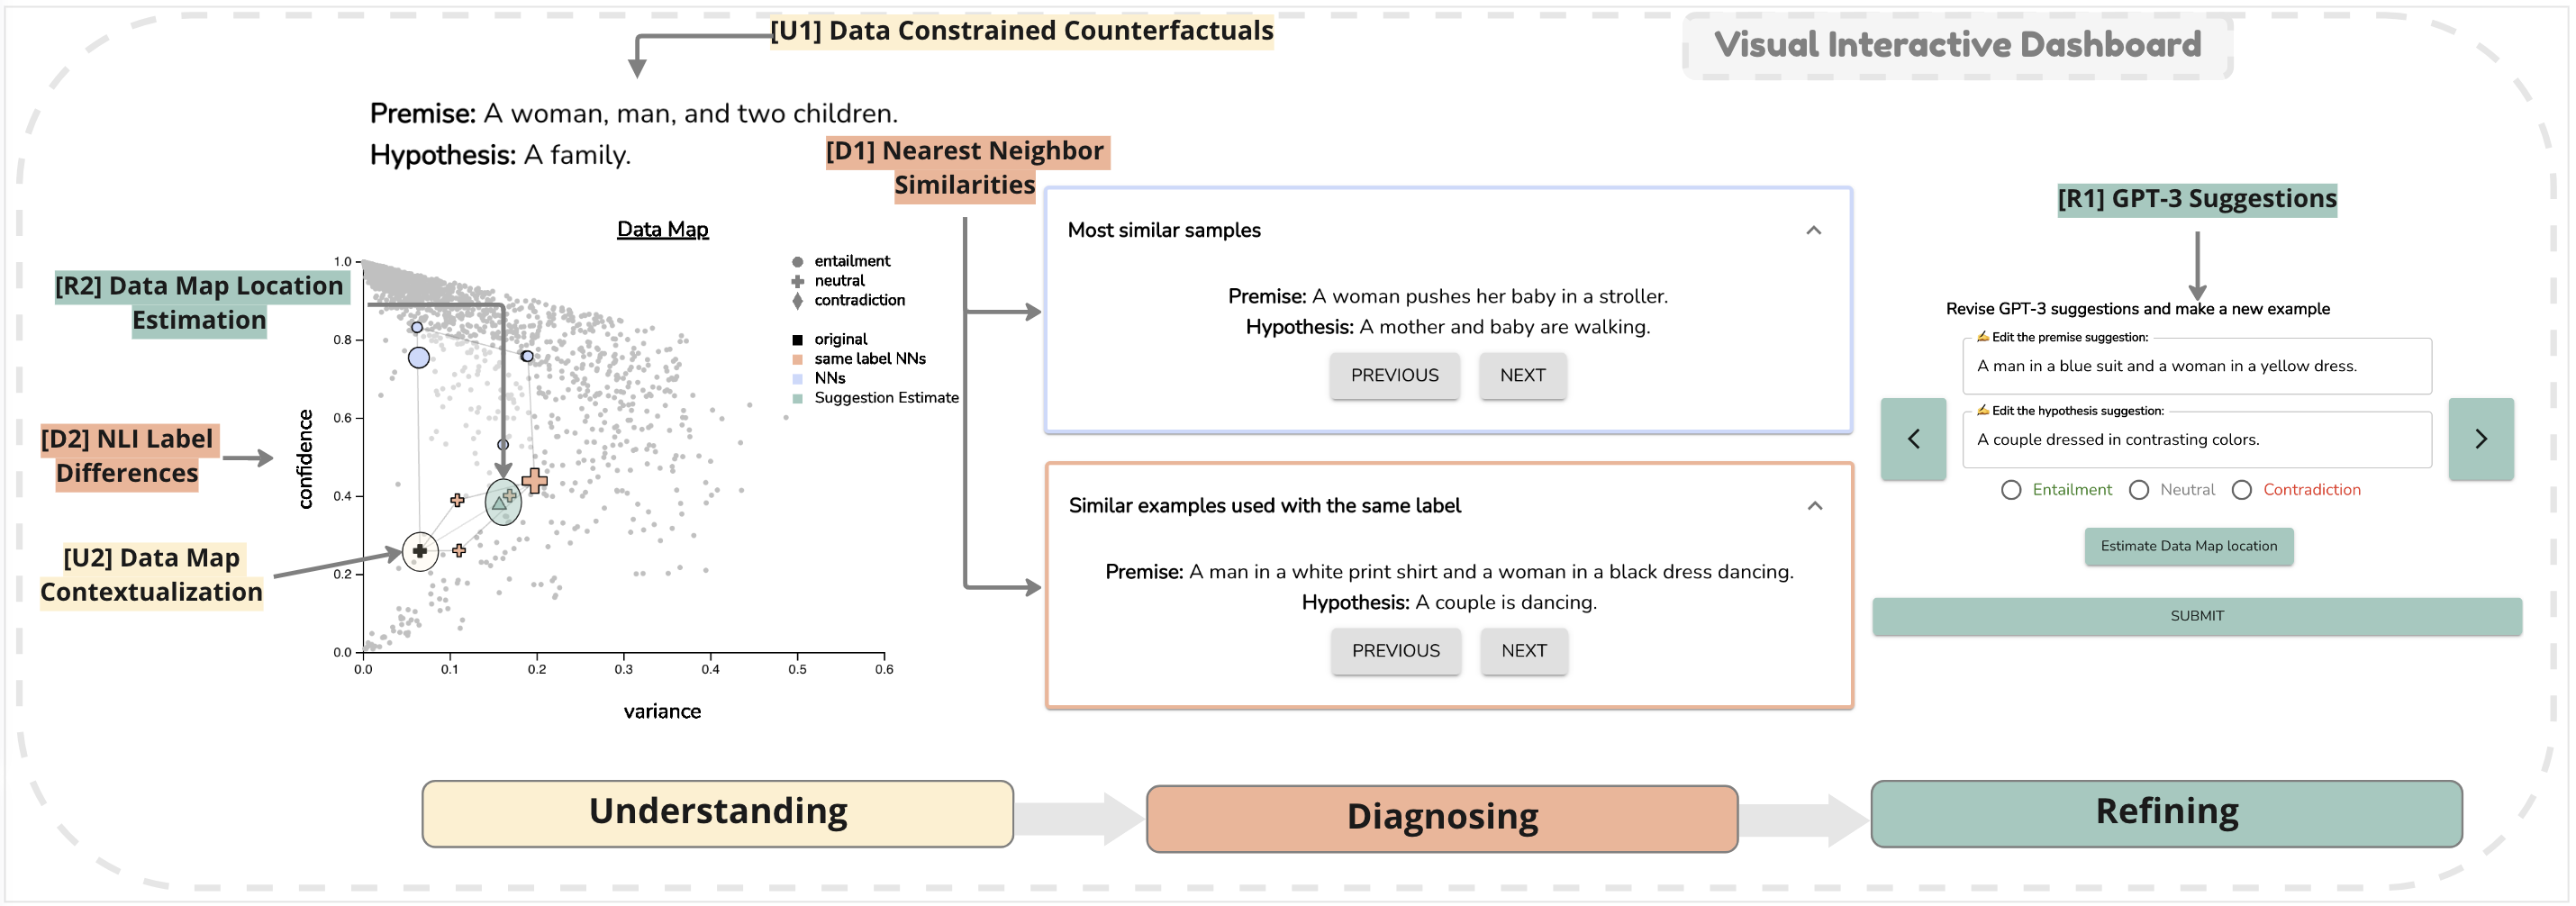
[U1] Data-Constrained Counterfactuals.
The premise, hypothesis, and label of the DCC are shown to the user. This ensures that the user can get an initial understanding of the example and the annotators’ reasoning.
[U2] Data Map Contextualization.
The ground truth labels of the selected DCCs are inherently hard for the model to predict (see Def. 1). Therefore, it is helpful for the user to understand how the model reasons about the data point, i.e., how likely it is that the model predicts the correct label (confidence) and how often its prediction varies across different checkpoints (variance). To this end, we locate the selected data point in the data map (see Fig. 1 black data point) and visualize the data map in our dashboard.
4.2 Diagnosing
Next, we aim to diagnose the reason that the DCC ends up being a counterfactual. As mentioned earlier, we aim to find features that correlate spuriously with the label. To find common features between the DCC and other data points in the sentence, we visualize similarities and differences between the DCC and other data points in the dataset. This involves performing two tasks explained below.
[D1] Nearest Neighbor Similarities.
We show two different sets of sentences in separate boxes and locate both sets in the data map. First, the set of sentences that are most similar to the DCC (in the blue box in Fig. 1). By definition (Def. 1), the most similar data points will have a different label compared to the selected data point. By comparing the DCC with the most similar data points, one might be able to find structures or patterns that are shared between the two. Those can be features that spuriously correlate with the label. Second, we depict the set of most similar data points with the same label as the data point (orange box in Fig. 1). There might be more than one DCC breaking the spurious correlation in the dataset, and visualizing similar data points with the same label can help the user discover such examples and their similarities to the DCC. In sum, investigating the similarities and differences between these two sets will help the user to diagnose potential spurious features that are shared between the sets and correlate with the label.
[D2] NLI Label Differences.
We are interested to determine which sentences in the training dataset may have influenced the DCC being mislabeled. For very similar samples, the labels of the nearest [cls] neighbors are a strong indication of what the model would predict for the seed sample. Therefore, we visualize the label of nearest neighbors in the data map using three distinct shapes.
4.3 Refining
We will assist the user to create counterfactuals similar to the DCC, by pulling suggestions from GPT-3. The user can then refine the suggestion based on the feedback from the model.
[R1] GPT-3 Suggestions.
Following (liu-etal-2022-wanli), we use similar sentences with the same label to prompt GPT-3 and create suggestions. Ideally, GPT-3 would find the reasoning pattern and generate a valid counterfactual sentence. However, as one can imagine GPT-3 might fail to generate a valuable sample for several different reasons, e.g., it might generate an example that is semantically close to the DCC but the reasoning is not aligned with the DCC. Another reason would be to generate an example that is easy for the model to learn. Therefore, we ask the user to refine this new example before adding it to the dataset.
[R2] Data Map Location Estimation.
One of the common errors with GPT-3 suggestions is that the suggestion might be easy for the model to learn. To filter those suggestions, after labeling the example, the user can request an estimate of the data map location. To ensure low latency for estimating the data map location of new examples, we do not retrain the model. Instead, we receive the label from the user and use the saved checkpoints to measure the confidence of the model on the true label and its variance across the checkpoints. The user can then iteratively refine the example if it ends up in the easy-to-learn region.
5 Experimental Setup
The components of the dashboard are shown in Fig. 1. The filtering of potential DCCs described in section § 3 was performed on the SNLI dataset (bowman-etal-2015-large).222DCC definition relies on having a large set of samples with multiple annotations, which is available in SNLI dataset. We compute the nearest neighbors of the DCCs according to the cosine similarity between the [cls] embeddings extracted from a RoBERTa-large model (https://doi.org/10.48550/arxiv.1907.11692) trained on SNLI. The data map was generated following (swayamdipta-etal-2020-dataset), where six end-of-epoch checkpoints of the SNLI RoBERTa-large model were used to estimate the data map location.
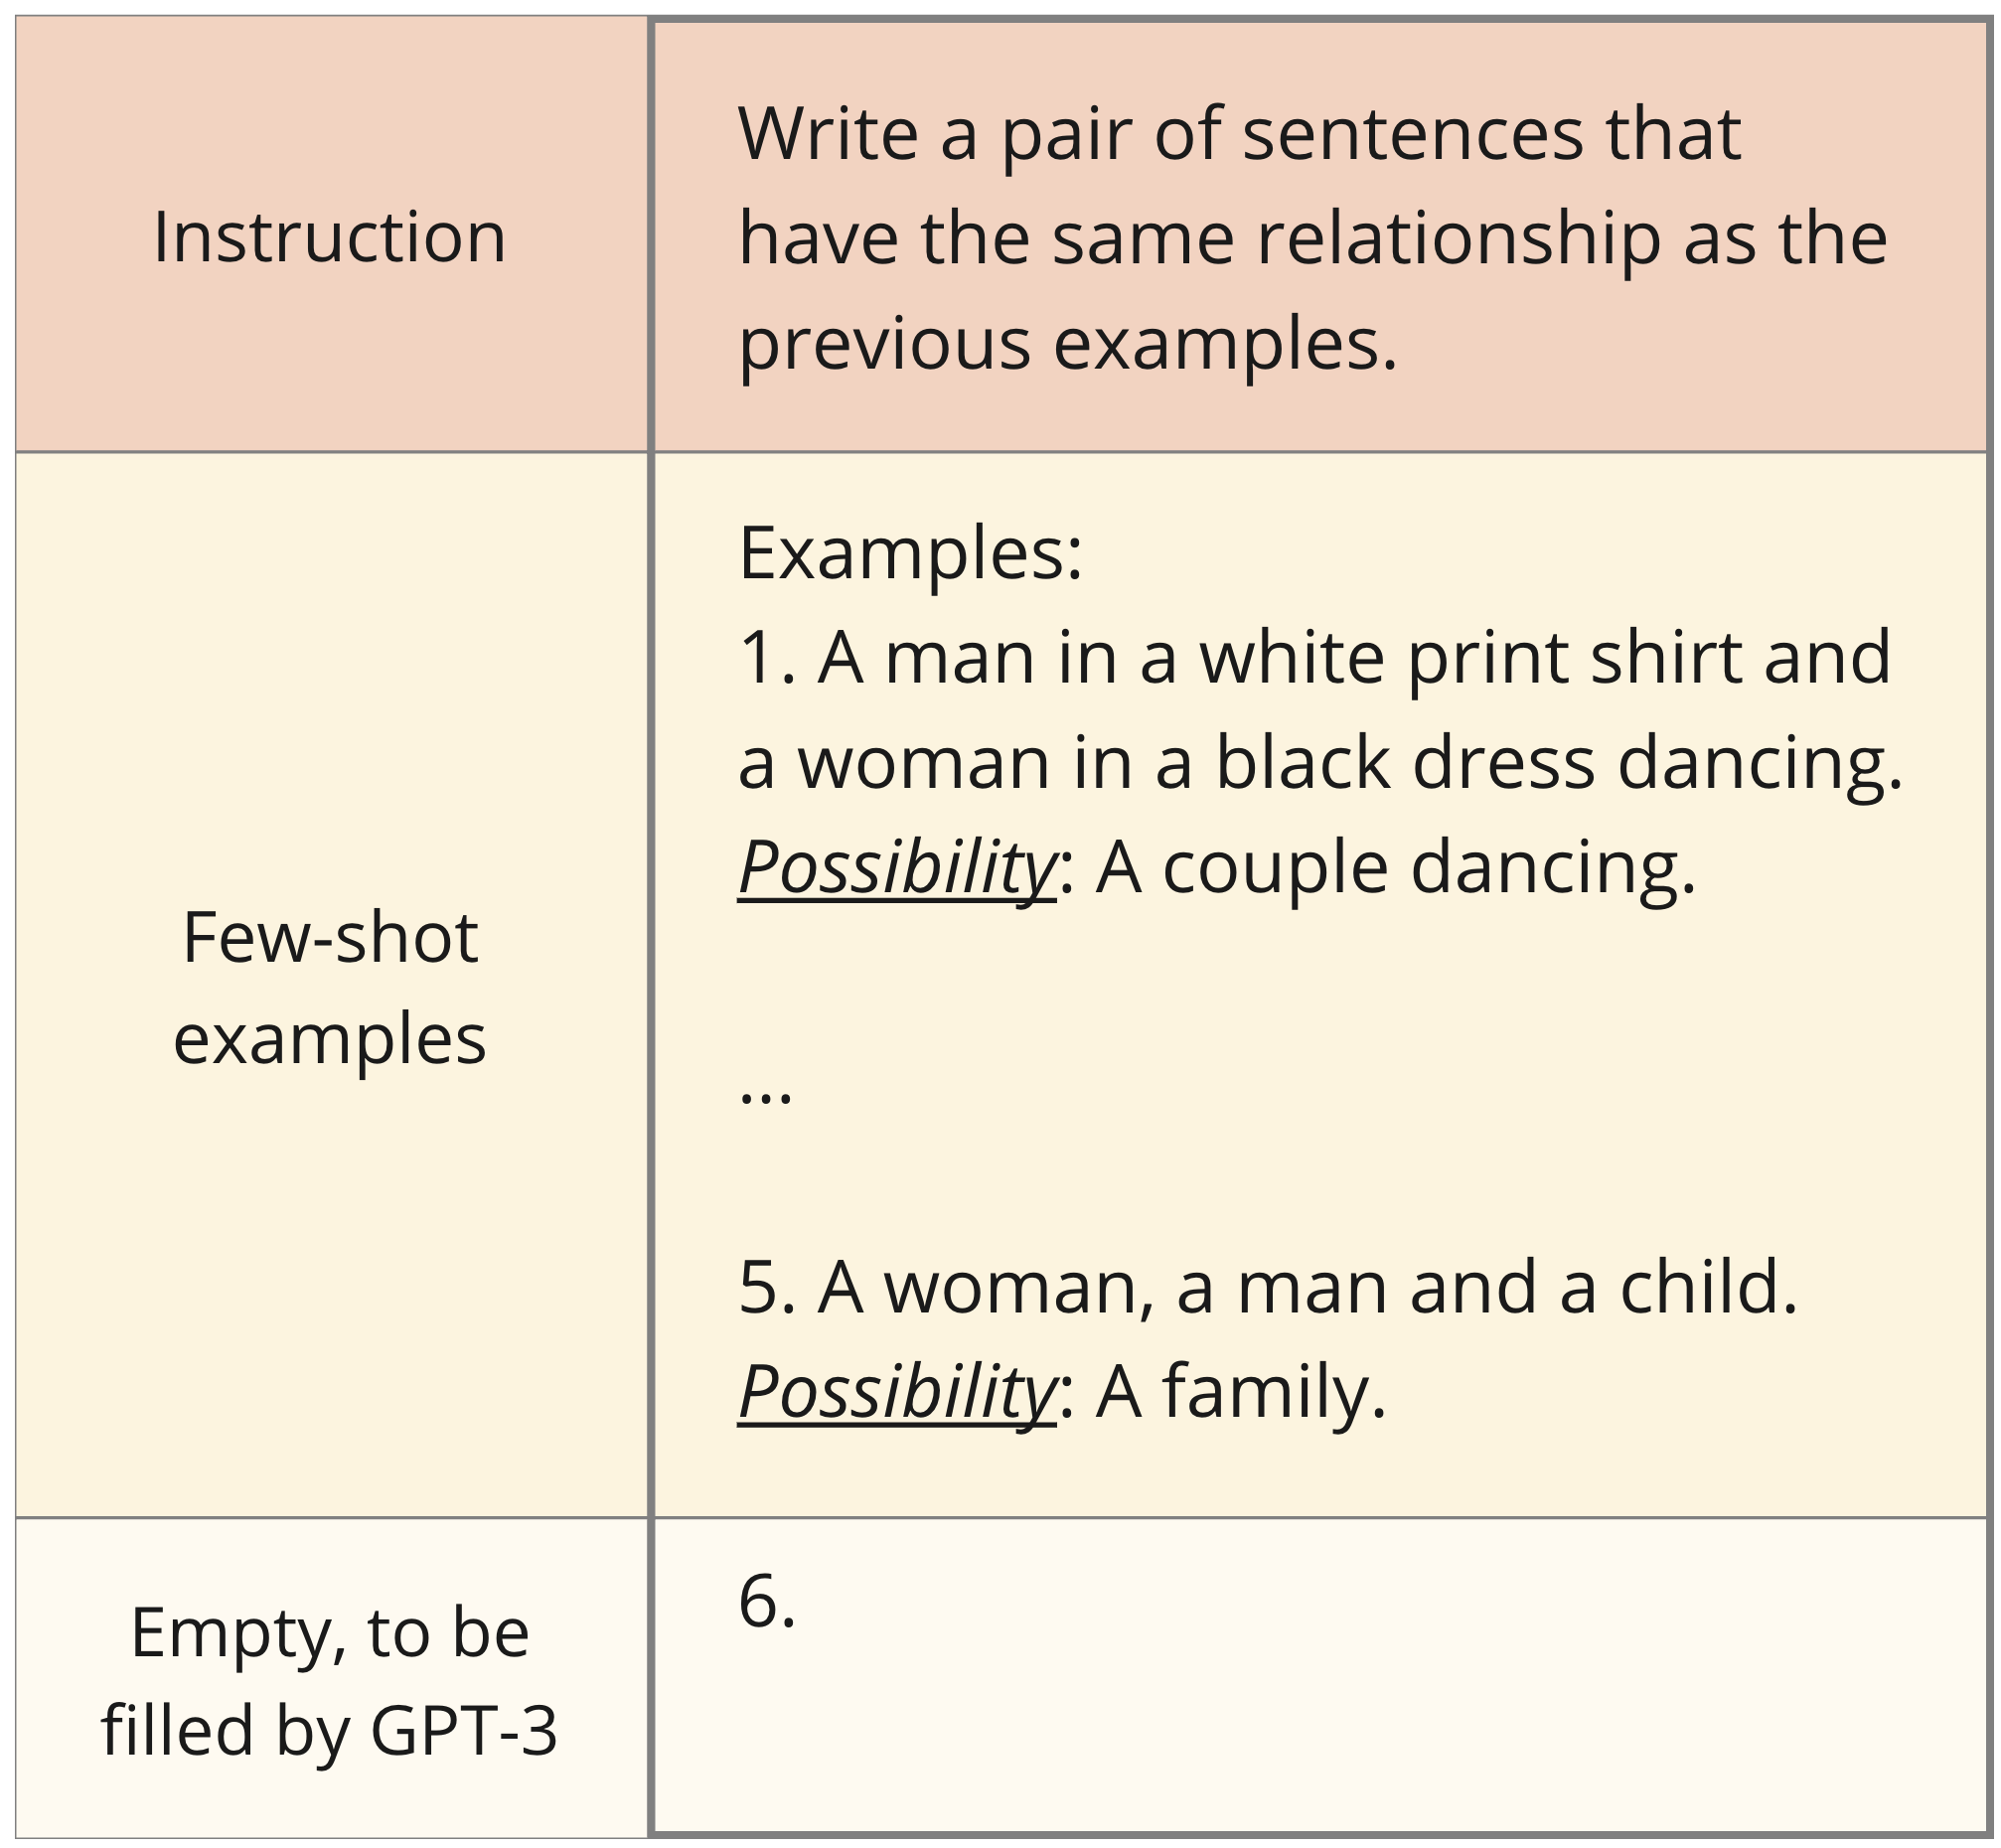
Suggestions are generated by few-shot prompting the GPT-3 davinci-003 model (gpt3) using four nearest neighbors to the DCC with the same label, exactly following (liu-etal-2022-wanli), as they argue that the model may employ similar reasoning for such nearest neighbors. An example of such a prompt is shown and described in Fig. 2.
6 Findings
By interacting with the dashboard ourselves in multiple sessions, we find interesting patterns and many DCC instances following those patterns. In this section, we provide a categorization of our findings.
We find three high-level features that correlate spuriously with the label, which we name: Semantic Relevance, Logical Fallacies, and Bias. Furthermore, we discovered another category that surfaces artifacts in the data collection procedure. Next, we will go through and explain each category, and further, provide some examples.
6.1 Semantic Relevance
We find many instances in the dataset where the hypothesis is the rephrased version of the premise. Clearly, in those cases, the gold label is entailment, e.g., 6.1.
\ex. Premise: A man in blue shorts and a t-shirt is slicing tomatoes on a dining table. entails
Hypothesis: A man prepares tomatoes by slicing them at the table.
However, if such examples dominate the dataset, a trained model might associate the entailment label to any premise and hypothesis that are semantically relevant to each other. The semantic relevance is a spurious feature, as one can imagine counterfactual examples where the premise and hypothesis are semantically related but the premise does not entail the hypothesis. One DCC that contains this feature is 6.1.
\ex. Premise: A large group of people are walking towards something, and most of them have backpacks. is neutral to
Hypothesis: A group of people move toward something that requires the use of a backpack.
In this example, while premise and hypothesis are semantically related, the word “requires” in the hypothesis makes the hypothesis to neutral to the premise, while the NLI model predicts the entailment label.
6.2 Logical Fallacies
Another common pattern we find in the dataset is hypotheses that become neutral to the premise by mentioning extra details.
\ex. Premise: A woman in a black dress and flat shoes holds her head as she waits to cross the street. is neutral to
Hypothesis: The woman is carrying a purse.
For example, in 6.2 the premise describes the appearance of a woman but does not mention anything about whether she is carrying a purse. Therefore, the hypothesis is referring to an extra piece of information that was not mentioned in the premise and thus, is neutral to it. If such examples dominate the dataset, a trained model might associate any extra information in the hypothesis with a neutral label. However, in some scenarios, the presence of logical clues in the premise will result in a different label. Such a DCC in the data is shown in 6.2.
\ex. Premise: A man wearing only red pants does a trick on a ladder. contradicts
Hypothesis: The man is wearing a black shirt.
In this example, while the premise does not directly talk about whether the man is wearing a black shirt or not, the word “only” indicates that the hypothesis is in fact, false. However, the NLI model predicts the neutral label.
6.3 Biases
As with many other datasets, NLI datasets contain instances of different sorts of biases. Gender stereotypes in professions are one example.
\ex. Premise: A wrestler is jumping off of the ring to hit his competitor. is neutral to
Hypothesis: Two men are competing in a wrestling match.
In the above example 6.3, while there is no mention of the gender of wrestlers in the premise, the model predicts that the hypothesis entails the premise. This could be due to the fact that wrestling is stereotypically associated with men.
\ex. Premise: A woman, man, and two children. is neutral to
Hypothesis: A family.
Another example is 6.3, where we do not know the woman, man, and two children that the premise is describing are in fact a family. However, the model predicts entailment as the label for this example.
6.4 Artifacts
The last category of examples is the existing artifacts in the dataset that surfaces in our dashboard. We find several examples where the hypothesis is completely irrelevant to the hypothesis, but their labels are inconsistent and often wrong.
. Premise: A child and woman exchange glances. contradicts
Hypothesis: a bird was on rocks.
. Premise: A little child playing in water with a hose. entails
Hypothesis: a bird was on rocks.
7 Discussion
The visual interactive dashboard for diagnosing spurious correlations and counterfactual generation can open up research opportunities in the following domains:
Bi-Directional Explanation of Reasoning Patterns.
Our dashboard opens up a possibility for efficient collaboration between humans and AI. AI can help humans to find and group similar structures. As can be seen in our dashboard, similarities in the representation space of NLI models often capture similar structures. On the other hand, humans can explain the reasoning to AI. This can happen by generating new examples that follow a particular line of reasoning that is challenging for the AI model to learn, which can result in improving AI models.
Diversifying Training Data based on DCC.
Receiving an estimate of model confidence during refinement ([R2]) enables the user to understand and pinpoint the patterns that pose a challenge to the model. Given the user has established such an understanding, they can produce samples that target a specific reasoning pattern. Further, GPT-3 suggestions assist the user by providing a diverse set of examples that follow the desired reasoning pattern. Therefore, the process allows us to augment potentially biased training datasets with a large, diverse set of counterfactuals. Conducting a thorough investigation, including large-scale expert annotation, model-retraining, and benchmarking is still required and will be part of future work.
Towards more Robust NLI Models.
The counterfactual samples generated using our dashboard can be used as adversarial test suites for evaluating existing models. As a proof-of-concept, we generate a small set of such samples through our dashboard to evaluate a model trained on WaNLI data (liu-etal-2022-wanli),333We used the roberta-large-wanli model released on huggingface (wolf-etal-2020-transformers). which itself was trained to be more robust and results in state-of-the-art results on various NLI test suites. The WaNLI model only achieves an accuracy of around 30% on our generations. This hints at the potential of our proposed annotation workflow for generating test suites to evaluate the robustness of NLI models.
8 Related Work
Other tools have been proposed for counterfactual generation. For example, Polyjuice (wu-etal-2021-polyjuice) introduces an automated counterfactual generation based on minimal edits. Counterfactuals are created using a fixed set of control codes to edit the existing sentences in the dataset.
Further, systems have been developed for mixed-initiative adversarial sample generation. ANLI (nie-etal-2020-adversarial) introduces an adversarial sample generation framework, where annotators are tasked to write hypotheses that may fool the model for a given context (i.e., a premise and label). Following a similar framework, Dynabench kiela-etal-2021-dynabench presents a more general-purpose dashboard for adversarial generation using model predictions and explanations as feedback to the user.
Compared to the methods described above, our proposed approach aims to first diagnose potential spurious correlations through DCCs, and then generate counterfactuals based on the found spurious correlations via prompting large language models. Furthermore, our dashboard gives feedback to users during the refinement stage by providing them with data map estimates for newly generated counterfactuals.
9 Conclusion
We present a dashboard to diagnose spurious correlations and artifacts that an NLI model may have acquired during training. We first provide a systematic approach to find data-constrained counterfactuals, i.e., existing counterfactuals in the dataset. We then feed the DCCs to our dashboard, where we contextualize them in the data map and also highlight the most similar data points in the dataset. By investigating similarities and differences between the data points, we were able to diagnose several spurious correlations, which we categorize into three different groups and a category of artifacts. Furthermore, we incorporate GPT-3 suggestions to allow for effective and diverse model-in-the-loop adversarial data generation. Therefore, our dashboard opens up future work on adversarial test suite generation and counterfactual augmentation.
Acknowledgements
We would like to thank the anonymous reviewers for their constructive and thorough feedback as well as Frederic Boesel and Steven H. Wang for their contributions in the early stages of the project. We would also like to thank Anej Svete for his helpful comments on the final version of the paper. This work was funded by the ETH AI Center.
Ethics Statement
The authors foresee no ethical concerns with the research presented in this paper.
References
- Bowman et al. (2015) Samuel R. Bowman, Gabor Angeli, Christopher Potts, and Christopher D. Manning. 2015. A large annotated corpus for learning natural language inference. In Proceedings of the 2015 Conference on Empirical Methods in Natural Language Processing, pages 632–642, Lisbon, Portugal. Association for Computational Linguistics.
- Brown et al. (2020) Tom Brown, Benjamin Mann, Nick Ryder, Melanie Subbiah, Jared D Kaplan, Prafulla Dhariwal, Arvind Neelakantan, Pranav Shyam, Girish Sastry, Amanda Askell, Sandhini Agarwal, Ariel Herbert-Voss, Gretchen Krueger, Tom Henighan, Rewon Child, Aditya Ramesh, Daniel Ziegler, Jeffrey Wu, Clemens Winter, Chris Hesse, Mark Chen, Eric Sigler, Mateusz Litwin, Scott Gray, Benjamin Chess, Jack Clark, Christopher Berner, Sam McCandlish, Alec Radford, Ilya Sutskever, and Dario Amodei. 2020. Language models are few-shot learners. In Advances in Neural Information Processing Systems, volume 33, pages 1877–1901. Curran Associates, Inc.
- Condoravdi et al. (2003) Cleo Condoravdi, Dick Crouch, Valeria de Paiva, Reinhard Stolle, and Daniel G. Bobrow. 2003. Entailment, intensionality and text understanding. In Proceedings of the HLT-NAACL 2003 Workshop on Text Meaning, pages 38–45.
- Dagan et al. (2006) Ido Dagan, Oren Glickman, and Bernardo Magnini. 2006. The PASCAL recognising textual entailment challenge. In Machine Learning Challenges. Evaluating Predictive Uncertainty, Visual Object Classification, and Recognising Tectual Entailment, pages 177–190, Berlin, Heidelberg. Springer Berlin Heidelberg.
- Gardner et al. (2021) Matt Gardner, William Merrill, Jesse Dodge, Matthew Peters, Alexis Ross, Sameer Singh, and Noah A. Smith. 2021. Competency problems: On finding and removing artifacts in language data. In Proceedings of the 2021 Conference on Empirical Methods in Natural Language Processing, pages 1801–1813, Online and Punta Cana, Dominican Republic. Association for Computational Linguistics.
- Huang et al. (2020) William Huang, Haokun Liu, and Samuel R. Bowman. 2020. Counterfactually-augmented SNLI training data does not yield better generalization than unaugmented data. In Proceedings of the First Workshop on Insights from Negative Results in NLP, pages 82–87, Online. Association for Computational Linguistics.
- Jia and Liang (2017) Robin Jia and Percy Liang. 2017. Adversarial examples for evaluating reading comprehension systems. In Proceedings of the 2017 Conference on Empirical Methods in Natural Language Processing, pages 2021–2031, Copenhagen, Denmark. Association for Computational Linguistics.
- Khashabi et al. (2020) Daniel Khashabi, Tushar Khot, and Ashish Sabharwal. 2020. More bang for your buck: Natural perturbation for robust question answering. In Proceedings of the 2020 Conference on Empirical Methods in Natural Language Processing (EMNLP), pages 163–170, Online. Association for Computational Linguistics.
- Kiela et al. (2021) Douwe Kiela, Max Bartolo, Yixin Nie, Divyansh Kaushik, Atticus Geiger, Zhengxuan Wu, Bertie Vidgen, Grusha Prasad, Amanpreet Singh, Pratik Ringshia, Zhiyi Ma, Tristan Thrush, Sebastian Riedel, Zeerak Waseem, Pontus Stenetorp, Robin Jia, Mohit Bansal, Christopher Potts, and Adina Williams. 2021. Dynabench: Rethinking benchmarking in NLP. In Proceedings of the 2021 Conference of the North American Chapter of the Association for Computational Linguistics: Human Language Technologies, pages 4110–4124, Online. Association for Computational Linguistics.
- Liu et al. (2022) Alisa Liu, Swabha Swayamdipta, Noah A. Smith, and Yejin Choi. 2022. WANLI: Worker and AI collaboration for natural language inference dataset creation. In Findings of the Association for Computational Linguistics: EMNLP 2022, pages 6826–6847, Abu Dhabi, United Arab Emirates. Association for Computational Linguistics.
- Liu et al. (2019) Yinhan Liu, Myle Ott, Naman Goyal, Jingfei Du, Mandar Joshi, Danqi Chen, Omer Levy, Mike Lewis, Luke Zettlemoyer, and Veselin Stoyanov. 2019. RoBERTa: A robustly optimized BERT pretraining approach.
- McCoy et al. (2019) Tom McCoy, Ellie Pavlick, and Tal Linzen. 2019. Right for the wrong reasons: Diagnosing syntactic heuristics in natural language inference. In Proceedings of the 57th Annual Meeting of the Association for Computational Linguistics, pages 3428–3448, Florence, Italy. Association for Computational Linguistics.
- Nie et al. (2020) Yixin Nie, Adina Williams, Emily Dinan, Mohit Bansal, Jason Weston, and Douwe Kiela. 2020. Adversarial NLI: A new benchmark for natural language understanding. In Proceedings of the 58th Annual Meeting of the Association for Computational Linguistics, pages 4885–4901, Online. Association for Computational Linguistics.
- Spinner et al. (2020) Thilo Spinner, Udo Schlegel, Hanna Schäfer, and Mennatallah El-Assady. 2020. explAIner: A visual analytics framework for interactive and explainable machine learning. IEEE Transactions on Visualization and Computer Graphics, 26(1):1064–1074.
- Swayamdipta et al. (2020) Swabha Swayamdipta, Roy Schwartz, Nicholas Lourie, Yizhong Wang, Hannaneh Hajishirzi, Noah A. Smith, and Yejin Choi. 2020. Dataset cartography: Mapping and diagnosing datasets with training dynamics. In Proceedings of the 2020 Conference on Empirical Methods in Natural Language Processing (EMNLP), pages 9275–9293, Online. Association for Computational Linguistics.
- Wolf et al. (2020) Thomas Wolf, Lysandre Debut, Victor Sanh, Julien Chaumond, Clement Delangue, Anthony Moi, Pierric Cistac, Tim Rault, Rémi Louf, Morgan Funtowicz, Joe Davison, Sam Shleifer, Patrick von Platen, Clara Ma, Yacine Jernite, Julien Plu, Canwen Xu, Teven Le Scao, Sylvain Gugger, Mariama Drame, Quentin Lhoest, and Alexander M. Rush. 2020. Transformers: State-of-the-Art natural language processing. In Proceedings of the 2020 Conference on Empirical Methods in Natural Language Processing: System Demonstrations, pages 38–45, Online. Association for Computational Linguistics.
- Wu et al. (2021) Tongshuang Wu, Marco Tulio Ribeiro, Jeffrey Heer, and Daniel Weld. 2021. Polyjuice: Generating counterfactuals for explaining, evaluating, and improving models. In Proceedings of the 59th Annual Meeting of the Association for Computational Linguistics and the 11th International Joint Conference on Natural Language Processing (Volume 1: Long Papers), pages 6707–6723, Online. Association for Computational Linguistics.