IRAS 00450+7401 and the mid-infrared fade/burst cycle of R Coronae Borealis-type stars
Abstract
We present optical and infrared imaging and spectroscopy of the R Coronae Borealis-type (R Cor Bor) star IRAS 00450+7401. Optical spectra further confirm its classification as a cool R Cor Bor system, having a hydrogen-deficient carbon star spectral sub-class of HdC5 or later. Mid-infrared spectroscopy reveals the typical 8 m “hump” seen in other R Cor Bor stars and no other features. A modern-epoch spectral energy distribution shows bright emission from hot dust having Tdust600 K. Historical infrared data reveal generally cooler dust color temperatures combined with long-term fading trends, but provide no discernible correlation between flux level and temperature. Investigating the most mid-infrared variable R Cor Bor stars found in IRAS, AKARI, and WISE data reveals similar fading trends, bursts that can show a factor of up to 10 change in flux density between epochs, and blackbody-fit dust color temperatures that span 400-1300 K. While some R Cor Bor stars such as IRAS 00450+7401 appear to undergo fade/burst cycles in the mid-infrared, significant gaps in temporal coverage prevent conclusively identifying any preferred timescale for their mid-infrared variability and circumstellar dust temperature changes.
1 Introduction
R Coronae Borealis-type (R Cor Bor) stars are rare and luminous stellar systems that present hydrogen-deficient and carbon-rich atmospheres, and experience irregular, sudden drops in optical brightness by up to 8 or more magnitudes (Clayton, 1996). The rarity of these systems (only 150 are currently known in the Galaxy; Tisserand et al. 2020; Karambelkar et al. 2021) suggest they may be the result of an atypical stellar evolutionary pathway, or that they rapidly progress through this phase of evolution into more typical stellar properties.
| Epoch | MJD | Bandpass | Magnitude | Flux (Jy) | Error (Jy) | Facility |
|---|---|---|---|---|---|---|
| 2022-09-21 | 59843.36100 | 53.56 m | 1.0 | SOFIA | ||
| 2022-09-15 | 59837.51315 | 37.12 m | 0.63 | 0.15 | SOFIA | |
| 2022-05-17 | 59716.48368 | 34.68 m | 0.64 | 0.07 | SOFIA | |
| 2022-09-15 | 59837.51013 | 33.43 m | 0.65 | 0.13 | SOFIA | |
| 2022-05-17 | 59716.46903 | 33.57 m | 0.57 | 0.19 | SOFIA | |
| 2022-05-17 | 59716.45410 | 31.36 m | 0.74 | 0.09 | SOFIA | |
| 2022-05-17 | 59716.46903 | 25.24 m | 0.93 | 0.11 | SOFIA | |
| 2022-05-17 | 59716.45410 | 19.7 m | 1.64 | 0.11 | SOFIA | |
| 2022-02-19 | 59629.23297 | 11.09 m | 3.39 | 0.25 | SOFIA | |
| 2022-02-17 | 59627.22448 | 6.35 m | 4.06 | 0.22 | SOFIA | |
| 2022-01-27 | 59606.064 | 4.60 m | 4.640.06 | 2.38 | 0.13 | WISE |
| 2022-01-27 | 59606.018 | 3.35 m | 5.900.05 | 1.34 | 0.06 | WISE |
| 2022-02-15 | 59625.10686 | H | 9.20.1 | 0.22 | 0.02 | P200 |
| 2022-02-15 | 59625.10972 | J | 10.400.03 | 0.112 | 0.003 | P200 |
| 2022-03-02 | 59640.14699 | I | 12.250.04 | 33.110-3 | 1.210-3 | MLO |
| 2022-03-02 | 59640.13435 | R | 13.560.03 | 11.010-3 | 0.310-3 | MLO |
| 2022-03-02 | 59640.17218 | V | 15.160.03 | 3.2710-3 | 0.0110-3 | MLO |
| 2022-03-02 | 59640.14699 | B | 17.040.08 | 0.6310-3 | 0.0410-3 | MLO |
Note WISE 3.35 and 4.60 m measurements are not color corrected corrections are on the order of 1%.
There are two prevailing models for the origin of R Cor Bor stars. In what could be considered the favored model, R Cor Bor stars are the remnants of a merger event between two white dwarf stars where one object is CO-rich and the other He-rich (e.g., Clayton 2012). Such a model would make R Cor Bor stars low-mass analogs of supernova Type Ia progenitors (Fryer & Diehl, 2008) where the components fail to surpass the Chandrasekhar limit and explode. This would be a rare and unusual stellar evolutionary pathway directly related to binary star evolution.
Another model has R Cor Bor stars result from a final helium shell flash of a dying giant star (e.g., Renzini 1990; Iben et al. 1996, and references therein). This final flash causes a significant portion of the stellar envelope to be lost and sufficient energy transfer to the remaining envelope and core to have it expand into a cool supergiant-like object resembling R Cor Bor stars. In this case the R Cor Bor phenomenon is a common event within the evolution of single low- to intermediate-mass stars and lasts only a short time.
The hallmark feature of R Cor Bor stars dramatic dimming events that can last on the order of years is caused by clouds of circumstellar material that cross our line of sight. All R Cor Bor stars have an infrared excess caused by dust associated with the star, differentiating them from other hydrogen-deficient stars (e.g., Feast & Glass 1973; Feast et al. 1997; Feast 1997). Understanding the nature and origin of the material that causes these dimming events can tell us about how these systems form and evolve. Evidence exists supporting dimming events being due to the ejection of clumps of atmospheric material (e.g., Clayton et al. 2011, 2013). Many R Cor Bor stars also have a 6–8 m “hump” in mid-infrared spectra thought to be due to carbon-dominated dust grains that could come from the carbon-rich stellar atmosphere (Hecht et al. 1984; Wright 1989; Lambert et al. 2001; García-Hernández et al. 2013).
In this paper we discuss the candidate R Cor Bor system IRAS 00450+7401 identified by Tisserand (2012) and confirmed to have R Cor Bor star lightcurve behavior and near-infrared spectroscopic characteristics by Karambelkar et al. (2021). IRAS 00450+7401 came out of a 4.5 year dimming episode in early 2022 and optical spectra presented in this paper taken near maximum light further confirm that it is indeed an R Cor Bor star.
Section 2 discusses the suite of data we obtained for IRAS 00450+7401 and Section 3 reports results obtained from these data. We present an optical/infrared spectral energy distribution (SED) for IRAS 00450+7401 one of the most complete ever compiled in a year or less for an R Cor Bor star and characterize its infrared variability over an 40 year time span using archival data. Section 4 synthesizes the new and historical data for IRAS 00450+7401 and places them into context by comparison with other well-studied R Cor Bor stars.
| Epoch | MJD | Bandpass | Magnitude (Vega) | Flux (mJy) | Error (mJy) |
| 2022-02-05 | 59615.16265 | I | 12.880.04 | 18.494 | 0.682 |
| 2022-02-05 | 59615.16840 | R | 14.460.07 | 4.822 | 0.294 |
| 2022-02-05 | 59615.16386 | V | 16.040.03 | 1.447 | 0.0465 |
| 2022-02-05 | 59615.15832 | B | 18.050.11 | 0.228 | 0.0258 |
| 2022-02-17 | 59627.13830 | I | 12.490.04 | 26.679 | 0.988 |
| 2022-02-17 | 59627.13524 | R | 13.810.03 | 8.812 | 0.246 |
| 2022-02-17 | 59627.17004 | V | 15.450.17 | 2.494 | 0.384 |
| 2022-02-17 | B | ||||
| 2022-02-19 | 59629.09461 | I | 12.420.04 | 28.226 | 1.046 |
| 2022-02-19 | 59629.08770 | R | 13.820.04 | 8.731 | 0.360 |
| 2022-02-19 | 59629.11290 | V | 15.410.05 | 2.600 | 0.115 |
| 2022-02-19 | 59629.10904 | B | 17.360.07 | 0.471 | 0.031 |
| 2022-03-02 | 59640.14699 | I | 12.250.04 | 33.130 | 1.222 |
| 2022-03-02 | 59640.13435 | R | 13.560.03 | 11.040 | 0.306 |
| 2022-03-02 | 59640.17218 | V | 15.160.03 | 3.275 | 0.100 |
| 2022-03-02 | 59640.14699 | B | 17.040.08 | 0.633 | 0.044 |
| 2022-09-15 | 59845.39081 | R | 17.570.07 | 0.276 | 0.017 |
| 2022-09-15 | 59845.38695 | V | 19.70.33 | 0.050 | 0.015 |
| 2022-09-15 | B |
Note On 2022 February 17 UT and 2022 September 15 UT IRAS 00450+7401 was not
detected in the B-band due to bad weather and being too faint, respectively.
2 Observations
We collected the following data for IRAS 00450+7401: mid- to far-infrared photometry from 3–54 m, mid-infrared spectra from 5–14 m, near-infrared imaging in the J- and H-bands, optical spectra covering 3600–9000 Å, and optical photometric measurements in the B-, V-, R-, and I- bands.
2.1 SOFIA Photometry
Stratospheric Observatory for Infrared Astronomy (SOFIA) imaging observations were obtained for IRAS 00450+7401 on multiple flights in 2022 with the FORCAST (Herter et al., 2013) and HAWC+ (Harper et al., 2018) instruments. All observations at wavelengths longer than 11 m were performed at an aircraft altitude of 43,000 feet. Table 1 reports all observation dates and measured flux values.
While FORCAST hosts short- and long-wavelength channels (SW and LW, respectively) that are capable of simultaneously taking images, most observations of IRAS 00450+7401 utilized only a single channel at a time to avoid sensitivity loss from using the dichroic. Dual-mode observations that simultaneously used both the SW and LW channels were done for the 19.7 and 31.36 m pair and for the 25.24 and 33.57 m pair. Observations were obtained in C2N (2-point, symmetrical) chop–nod mode with a chop throw of 30′′ (resulting in one positive beam and two negative beams with half the intensity of the positive beam). The telescope was nodded in an ABBA pattern with nod offsets of 60′′. The chopping and nodding position angles on the sky varied depending on the time of observation, but always aligned such that chopping and nodding angles were matched. Total on-source integration times ranged from roughly 1 to 8 minutes.
Images are reduced and calibrated into physical flux units by the SOFIA Data Cycle System (DCS) pipeline; pipeline-reduced images have pixel scales of 0.768′′ pixel-1. These Level 3 data products are retrieved from the SOFIA archive service. IRAS 00450+7401 is detected as a point source in all FORCAST imaging data with varying levels of signal-to-noise. As such, we attempted to follow the guidance of the FORCAST Photometry data analysis cookbook111https://github.com/SOFIAObservatory/Recipes/blob/master/FORCAST-photometry_detailed.ipynb for measuring photometry. In short, this entails using a 12-pixel (9.22′′) radius aperture (and larger sky annulus) to extract flux and estimate an uncertainty.
As discussed in detail within the cookbook and in Su et al. (2017), using aperture radii other than 12 pixels is not recommended for extracting flux as the point-spread function (PSF) is highly variable (even within a flight) and aperture corrections cannot be reliably established. IRAS 00450+7401 is detected with high signal-to-noise (20 at the aperture, meaning we take the signal in the aperture divided by the relative error in the photometry measurement as described in the FORCAST Photometry cookbook) for filters between 6–20 m, but is only detected at moderate or low signal-to-noise (15 at the aperture) for filters longward of 20 m. Unfortunately, we found that standard 12-pixel radius aperture extractions for these low- to moderate-signal-to-noise images resulted in photometry dominated by noise; the resulting behavior of the source’s flux between 30–40 m appeared quite erratic and unphysical.
The FORCAST Photometry cookbook suggests, following the work of Su et al. (2017), that PSF-fitting can be used to measure photometry when using high signal-to-noise observations of standard stars. Although the cookbook discusses this within the context of performing aperture corrections, we decided to explore the possibility of using PSF-fitting to directly obtain photometric measurements. We use bright standard star images as an empirical model of the PSF, multiply them by a constant factor to match the image of interest for IRAS 00450+7401, and then perform the regular cookbook aperture extraction on the scaled standard star image. Such aperture extractions are not dominated by noise and should more faithfully measure the flux from the science target.
All standard star observations obtained on the same night and with the same filter as observations for IRAS 00450+7401 were downloaded. Standard star observations for the F315 filter were not obtained on the same night as F315 observations for IRAS 00450+7401, so we used F315 standard star data from the subsequent night. All standard star images are Level 3 data products and calibrated into physical flux units.
With in-house IDL routines we modeled each image of IRAS 00450+7401 with the same filter image of the standard star effectively obtaining a scaling factor for the standard star image. Aperture photometry with a 12-pixel radius aperture was then performed on the scaled standard star image while the uncertainty was calculated from the IRAS 00450+7401 image as specified in the cookbook. This approach yielded consistent results for filters between 6–20 m and what appeared to be more accurate (at least more physically reasonable) results for filters longward of 20 m.
For moderate- and especially low-signal-to-noise detections in FORCAST data it seems standard aperture photometry with a 12-pixel radius aperture can produce questionable results. We have found PSF-fitting using standard star observations seems to produce more robust photometry values and strongly encourage such an approach when analyzing FORCAST data.
Far-infrared imaging was obtained toward IRAS 00450+7401 with HAWC+. Images were obtained at an aircraft altitude of 43,000 feet in total intensity mode with the Band A filter and used Lissajous scan imaging. Data are reduced within DCS and Level 3 calibrated data products are obtained from the SOFIA science archive. HAWC+ observations of IRAS 00450+7401 were obtained in one of the final SOFIA flights. During these last runs, HAWC+ experienced heightened consumption rates for its coolant that sometimes impacted end-of-flight targets. Unfortunately, IRAS 00450+7401 was one such target and HAWC+ ran out of coolant after 5 minutes of on-source observation. IRAS 00450+7401 was not detected in this short HAWC+ sequence and we report an upper limit in Table 1.
2.2 SOFIA Spectroscopy
FORCAST spectroscopic observations were conducted with the G063 and G111 grisms in the SW channel using the 4.7′′ slit resulting in a spectral resolving power of 140.
G063 spectra were obtained on 2022 February 17 UT (MJD 59627.25208) and covered roughly 5–8 m. During these observations the aircraft started at an altitude of 37,000 feet and ended at 39,000 feet. Chopping and nodding were performed in C2N mode. A total on-source integration time of 941 seconds was accrued with the G063 grism. G111 spectra were obtained on 2022 February 19 UT (MJD 59629.24306) and covered roughly 8.75–14 m. The aircraft altitude for these observations was 39,000 feet and C2N chopping and nodding were performed. G111 observations amassed a total on-source integration time of 469 seconds.
Spectroscopic data are reduced, extracted, and calibrated within DCS and Level 3 data products retrieved from the SOFIA science archive. G063 data had manual telluric corrections performed with an ATRAN model computed for a precipitable water vapor content of 3 m. The final spectral signal-to-noise ratio is 60 at 7 m and 20 at 11.5 m. However, this does not take into account systematic noise from telluric correction (especially apparent near the 9.5 m ozone feature).

2.3 WISE Photometry
We incorporate NEOWISE 3.35 and 4.60 m data into our analysis (Wright et al. 2010; Mainzer et al. 2014).
IRAS 00450+7401 is saturated in NEOWISE single-frame images. While the NEOWISE single-frame detection lists attempt to use the PSF wings of saturated sources to recover valid fluxes, the Explanatory Supplement222https://wise2.ipac.caltech.edu/docs/release/neowise/expsup/sec2_1civa.html shows that there are still biases for the brightest sources (like IRAS 00450+7401).
We perform an additional correction to the NEOWISE-reported magnitudes retrieved for IRAS 00450+7401 as follows: W1/2corr W1/2mpro + W1/2mcorr for W1/2mpro W1/2satlimit and W1/2mcorr and W1/2satlimit replaced by appropriate values for either W1 or W2. Uncertainties are the quadrature sum of the W1/2mpro catalog-quoted uncertainties and the uncertainty on W1/2mcorr.
2.4 Palomar Photometry
Palomar Hale 200 inch (P200) near-infrared imaging was obtained for IRAS 00450+7401 on 2022 February 15 UT using the Wide-field Infrared Camera (WIRC; Wilson et al. 2003) and the 20482048 Hawaii-II detector that was installed in 2016. Observations were obtained in the J- and H-bands, although only one H-band image was obtained as the target source was found to saturate with the minimum exposure time of 0.92 seconds. Five un-dithered exposures of 0.92 seconds each were obtained in the J-band. Two of the J-band images have peak counts for IRAS 00450+7401 that are well above the 1% non-linearity level (but still below full-well); we do not find results from these images to be discrepant with those from the other images in the set and thus include them in our analysis (excluding them does not have a significant impact on the final measured values).
WIRC images were reduced by subtracting a 0.92 second dark exposure and then dividing by a twilight flat for each respective band. Photometric extractions were performed for IRAS 00450+7401 and several in-field reference stars with 2MASS magnitudes brighter than 12 in the J- and H-bands. An aperture that encloses 97% of the flux was used for all sources; resulting in 1% variance within the set of five J-band images.
To obtain an H-band magnitude for IRAS 00450+7401, we performed PSF-fitting with bright, unsaturated point sources serving as the PSF reference. PSF fits were anchored on the unsaturated (and linear) wings of the source profile; saturated and strongly non-linear pixels were masked. As a test case, we first attempted a PSF fit for a field source also saturated in the H-band image and found excellent agreement with the 2MASS H-band magnitude quoted for the source. Despite this encouraging result, we adopt a generous uncertainty of 0.1 mag for the IRAS 00450+7401 H-band measurement.
Final P200 infrared photometry measurements for IRAS 00450+7401 are reported in Table 1.
2.5 Optical Photometry
Optical photometric measurements were taken with the San Diego State 40-inch Mount Laguna Observatory (MLO) telescope with the goal of characterizing the optical brightness of the star contemporaneous with the infrared measurements. B-, V-, R-, and I-band images were taken on four separate epochs in February–March of 2022, along with another epoch in September of 2022 (see Table 2).
| Epoch | Bandpass | Magnitude (Vega) | Flux (Jy) | Error (Jy) | Facility |
|---|---|---|---|---|---|
| 1983 | 60 m | 0.47 | 0.07 | IRAS | |
| 1983 | 25 m | 2.0 | 0.1 | IRAS | |
| 2010-02-12 | 22.09 m | 2.2040.016 | 1.09 | 0.02 | WISE |
| 2006 | 18 m | 1.33 | 0.02 | AKARI | |
| 1983 | 12 m | 3.80 | 0.15 | IRAS | |
| 2010-02-12 | 11.56 m | 3.0690.010 | 1.72 | 0.02 | WISE |
| 2006 | 9 m | 2.38 | 0.02 | AKARI | |
| 2010-02-12 | 4.60 m | 4.8340.061 | 2.0 | 0.1 | WISE |
| 2010-02-12 | 3.35 m | 6.6720.039 | 0.66 | 0.02 | WISE |
| 1999-10-22 | Ks | 7.6420.024 | 0.59 | 0.01 | 2MASS |
| 1999-10-22 | H | 8.9900.026 | 0.266 | 0.006 | 2MASS |
| 1999-10-22 | J | 10.2860.023 | 0.125 | 0.003 | 2MASS |
Note IRAS, AKARI, and WISE data are not color-corrected and are reported as retrieved from their respective catalogs. Table A2 presents color-corrected space mission flux values.
Data were reduced within IRAF, including performing bias subtraction and flat-fielding for each frame. Differential photometry for each frame was obtained for the science target with the nearby star TYC 4308 226 1 serving as a reference source (adopted magnitudes for TYC 4308 226 1 can be found in Table A1). Typically three frames for each filter were obtained and the final magnitude measurement is taken to be the average of the three frames with the uncertainty given by the standard deviation.
Final magnitudes are converted into flux density values in Jy following information provided in the NASA/IPAC Infrared Science Archive.333https://irsa.ipac.caltech.edu/data/SPITZER/docs/dataanalysistools/tools/pet/magtojy/ref.html. The complete set of optical photometry can be found in Table 2.
2.6 Optical Spectroscopy
IRAS 00450+7401 was observed through clear skies on 2022 January 28 UT at Lick Observatory with the Kast Double Spectrograph mounted on the Shane 3 m telescope. Before placing IRAS 00450+7401 on the slit, we obtained guider camera images of the science target and the nearby reference star TYC 4308 226 1 through a Spinrad-R filter. From these data we estimate an R-band Vega magnitude for IRAS 00450+7401 on 2022 January 28 UT (MJD 59607.12210) of 14.40.1.
Kast observations simultaneously employed the blue and red arms with light split by the d57 dichroic around 5700 Å. After splitting, blue light was passed through the 600/4310 grism while red light was passed through the 600/7500 grating. A slit width of 1.5′′ was used resulting in resolving powers of about 1100 in the blue spectra and 1750 in the red.
Kast data are reduced using standard IRAF long-slit tasks including bias subtraction, flat-fielding, wavelength calibration with arc lamps, and instrumental response calibration via observations of flux calibration standard stars. Arc lamp frames were not obtained close in time to science frames and as such the zero-point of the wavelength scale is not accurate. The final signal-to-noise ratio is 30 at 4900 Å in the blue spectrum and 50 across the entire red spectrum. We do not attempt to correct the Kast spectra for reddening.
.
3 Results
3.1 Photometric State
We measured the brightness of IRAS 00450+7401 in optical bands to assess what level of dimming the star was experiencing as the infrared data were being collected. During the four initial epochs when visual data were taken, the star got consistently brighter and marginally bluer. In nearly a month, from 2022 February 05 UT to 2022 March 02 UT, the star brightened by 1 mag in the B-, V-, and R-bands and brightened by 0.6 mag in the I-band (Table 2). The RI color of IRAS 00450+7401 decreased from 1.560.08 to 1.310.05 over the same time span. A fifth epoch of optical photometry on 2022 September 15 UT revealed that the star had dipped again in brightness, fading by nearly 4 mag in the R-band compared to the 2022 March epoch.
To better put MLO optical monitoring into context we utilized the dreams444https://dreams.anu.edu.au/monitoring/object?obj_name=WISE%20J004822.34%2B741757.4 monitoring webserver which contains brightness records for many R Cor Bor stars. ATLAS o-band monitoring (Tonry et al., 2018) provides the most complete modern optical photometry data set for IRAS 00450+7401 covering the times when the new data discussed above were being obtained and several years leading up to their acquisition. The ATLAS data set also cover what appears to be the brightest magnitudes and hence what we tentatively interpret as maximum light for IRAS 00450+7401. Around MJD 57966 (UT 2017 August 01), IRAS 00450+7401 had an o-band magnitude of 12.170.03. Following that maximum, IRAS 00450+7401 fell into a deep dimming state (o-band magnitudes consistently fainter than 15 and frequently 18) before beginning a resurgence around MJD 59490 (roughly 2021 October). At the time of Kast observations (where we measured a rough R-band magnitude of 14.4, see Section 2.6) ATLAS measured an o-band magnitude of 14.700.03. The star continued to brighten from that epoch consistent with MLO measurements, but unfortunately ATLAS did not visit the star between 2022 March 02 UT and 2022 June 11 UT (presumably because it was at poor elevation). By the time ATLAS measurements for IRAS 00450+7401 resumed, it had begun a new decline confirmed with the faint state measured at MLO in September 2022.
3.2 Spectroscopic Classification
In a recent work Crawford et al. (2022) define a spectral classification system for hydrogen-deficient carbon stars, including R Cor Bor stars. While mostly based on observed spectral appearance, the new classification system allows one to make a rough estimate of the temperature for a star of known spectral type.
Figure 1 shows a comparison between optical spectra for IRAS 00450+7401 and the earliest-type matching standard from Crawford et al. (2022). Earlier-type standards show a clear mis-match in the position of the steep molecular shelves (e.g., near 4700 Å for IRAS 00450+7401) or a lack of such features altogether, ruling out the HdC4 and earlier classifications, (see Figure 4 of Crawford et al. 2022).
Confounding a more exact spectral type estimate for IRAS 00450+7401 is the fact that the Kast spectra were obtained when the source was still recovering from a prolonged and deep dimming event (see Section 3.1). The Kast spectra appear to have been obtained when the source was 2.4 magnitudes below maximum light while all spectral standards from Crawford et al. (2022) were obtained near maximum light or at most 0.5 magnitudes below it.
Applying an AV2.23 magnitude (assumed RV3.1; Hecht et al. 1984 and references therein report RV values of 3 for R Cor Bor stars recovering from dimming events) reddening correction to the Kast spectra for IRAS 00450+7401 results in excellent agreement with the HdC5 standard shown in Figure 1. We cannot verify such a V-band extinction value with the available photometric monitoring data for IRAS 00450+7401. The Shane-measured R-band magnitude obtained on the same night as the Kast spectra (Section 2.6) and the ATLAS photometric monitoring around the same time (Section 3.1) suggest that AR2.4 would be more appropriate (this would correspond to AV3.06 for RV3.1).
R Cor Bor stars appear to have hot gas surrounding them that becomes more apparent during declines (e.g., Clayton et al. 1992; Section 3.2.2 of Clayton 1996; Kameswara Rao et al. 2004). While reddening by dust can impact the overall slope of the Kast spectra, veiling by such emission can act to weaken spectral features giving an R Cor Bor star the appearance of an earlier spectral type (e.g., Lambert et al. 1990 and references therein). What is not known is at what dimming state such veiling begins to become important (for the case of IRAS 00450+7401, such emission appears to be present in near-infrared spectra taken during a dimming event observed by Karambelkar et al. 2021).
Given the uncertainties around veiling for IRAS 00450+7401 at the time of the Kast spectroscopic observations, it is possible that it could be an HdC6 or even HdC7 type star. The best way to resolve this issue would be to obtain a spectrum of IRAS 00450+7401 near maximum light, although it is not clear when that may happen again. Until that time, we conservatively assign it a spectral type of HdC5 or later.
Based on Table 5 of Crawford et al. (2022), a spectral type of HdC5 or later corresponds to a stellar effective temperature of 4500 K. We thus conclude that IRAS 00450+7401 is a cool R Cor Bor star.
3.3 Dust Characteristics
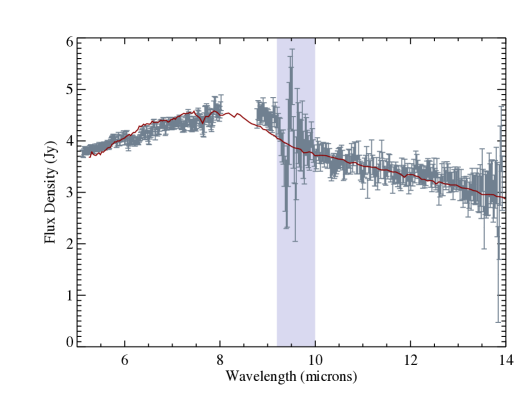
Mid-infrared spectroscopic data have been collected for 35 R Cor Bor stars with ISO and Spitzer (Lambert et al. 2001; Kraemer et al. 2005; García-Hernández et al. 2011a; García-Hernández et al. 2011b; García-Hernández et al. 2013). These mid-infrared spectra reveal a (likely carbon dust) “hump” feature between 6–8 m for most R Cor Bor stars, emission from polycyclic aromatic hydrocarbons for 10% of R Cor Bor stars, and a smaller fraction still that may be host to fullerenes.
The FORCAST spectra for IRAS 00450+7401 demonstrate that this R Cor Bor star falls in line with the majority of other R Cor Bor systems, displaying only a mild 6–8 m hump (Figure 2). In an effort to better categorize IRAS 00450+7401 amongst other R Cor Bor stars, we attempted to match Spitzer IRS spectra presented by García-Hernández et al. (2011b) with the FORCAST spectra for IRAS 00450+7401. IRS spectra are obtained from the CASSIS database (Lebouteiller et al., 2011) and are presented as retrieved. The best match overall is V739 Sgr which is shown in Figure 2. However, we note that V348 Sgr, Z Umi, RZ Nor, and WX Cra also provide acceptable matches to the IRAS 00450+7401 FORCAST spectra. Table 4 of Crawford et al. (2022) reports spectral types for 4 out of 5 of these R Cor Bor stars, with all but RZ Nor probably belonging to cool subtypes (types of HdC5 or later). This small sample possibly indicates that R Cor Bor dust does not depend on the temperature class of the host star, a finding that should be more exhaustively investigated before being considered conclusive.
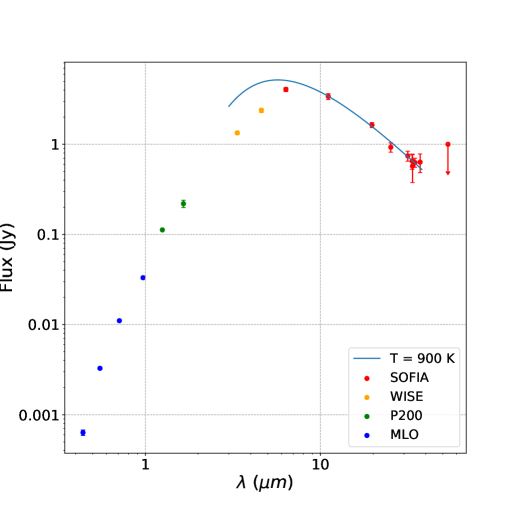
Figure 3 presents a 2022 epoch spectral energy distribution for IRAS 00450+7401 with an accompanying blackbody fit for data points 10 m to roughly characterize the dust temperature as measured in the mid-infrared (TMIR). The data cover 0.44–53.56 m with 53.56 m being an upper limit and the blackbody fit yields a temperature of TMIR90090 K. When doing this blackbody fit we do not include data at wavelengths less than 10 m; as seen in Figure 3 the fit over-predicts the flux at 3–6 m wavelengths. Fitting a 3-blackbody decomposition to all measurements from Table 1 representing contributions from the star, an inner dust component, and an outer dust component results in temperatures of 2700, 1350, and 650 K respectively. Such a fit reasonably reproduces all Table 1 measurements and is not unique, but outer dust component temperatures 600 K are ruled out.
While the 3-blackbody fitting procedure produces a better fit to the data, we will employ throughout this paper the mid-infrared-only fitting approach. As will be seen in the next section, this approach is necessary to maintain a consistent and homogeneous dust temperature measurement methodology when working with IRAS and AKARI data which only have data near 10 and 20 m. Temperatures estimated following the TMIR approach are better viewed as mid-infrared dust color temperatures since they miss contributions of dust components closer to the star.
Table 3 of García-Hernández et al. (2011b) presents multi-blackbody-fit dust temperatures for 30 R Cor Bor stars observed with Spitzer IRS. They find inner dust components ranging in temperature from 272-1600 K and outer dust components (when present) ranging from 100-900 K, thus placing the mid-infrared temperatures we report for IRAS 00450+7401 somewhere near the high-end of the mean.
4 Discussion
Overall, we have found IRAS 00450+7401 to share many of the same defining characteristics of other R Cor Bor stars. Photometrically, it has spent the majority of the past 5 years in a dim state, only resurfacing to near maximum light for a brief time in the end of 2021/beginning of 2022 around when observations for this paper were being collected. These characteristics mark IRAS 00450+7401 as a relatively active R Cor Bor star. However, without the kind of longer historical monitoring that is available for other well-known R Cor Bor stars we cannot assess if this is a consistent feature for IRAS 00450+7401. Optical spectra taken near maximum light confirm it to be a cool R Cor Bor star with temperature 5000 K. Circumstellar dust around IRAS 00450+7401 is of the expected carbon-rich composition for an R Cor Bor system and presents in 2022 with an average-for-R Cor Bor stars temperature of 600 K.
Being relatively bright in the infrared, IRAS 00450+7401 has detections from each of the IRAS, AKARI, and WISE all-sky missions. We examined these data to see how the emission from dust around IRAS 00450+7401 changes with time. Photometric measurements for each space mission need to be color-corrected to arrive at accurate flux values, and these color corrections are dependent on the intrinsic temperature of the source. We fit blackbodies to the non-color corrected data as retrieved from each mission’s respective catalogs (Table 3) and used the resulting temperature to find the color correction factors as reported in online resources555https://irsa.ipac.caltech.edu/IRASdocs/archives/colorcorr.html 666https://www.ir.isas.jaxa.jp/AKARI/Observation/support/IRC/IDUM/IRC_DUM.pdf 777https://wise2.ipac.caltech.edu/docs/release/allsky/expsup/sec4_4h.html#FluxCC; color-corrected flux values are reported in Table A2.
A blackbody is then fit to the color-corrected flux values to retrieve the mid-infrared dust color temperature (TMIR) in each of the IRAS, AKARI, and WISE epochs. IRAS and AKARI have only 2-3 data points available to inform blackbody fits for each epoch and all with wavelengths 9 m. As such, we restrict our analysis to wavelengths 9 m for all epochs as was done with the SOFIA data analysis and fitting methodology (Figure 3 and Section 3.3). With only 2-3 data points available per epoch, the blackbody fit is over-constrained and the fitting routine cannot produce reliable error estimates for the resulting color temperatures. We assign 10% error bars to the three historical blackbody temperature fits in accordance with what was obtained for the more comprehensive SOFIA data set.
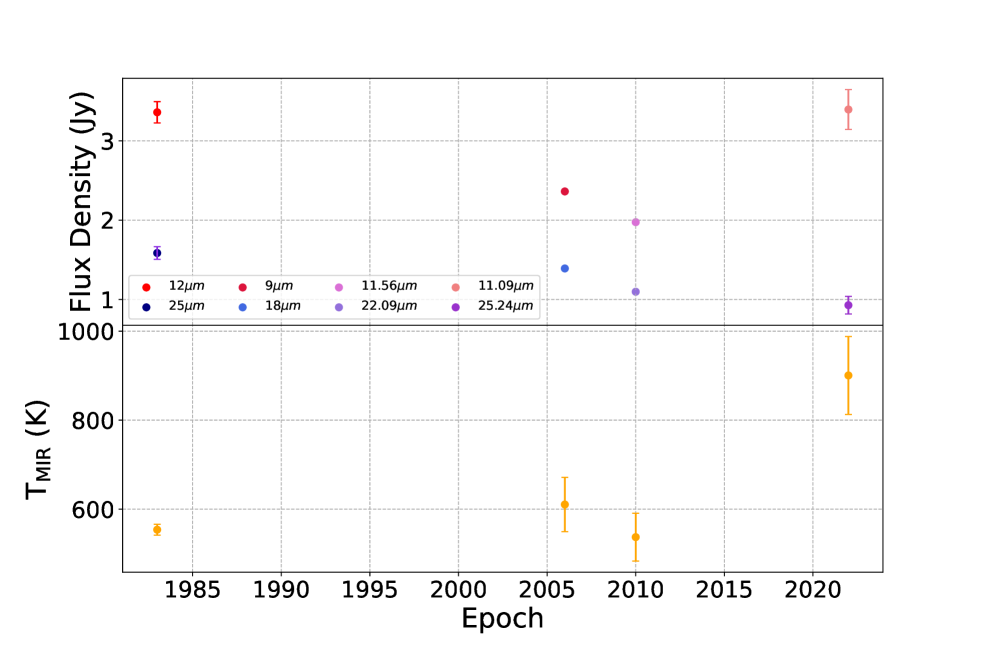
Figure 4 shows the mid-infrared flux and color temperatures for IRAS 00450+7401 as a function of time. Two curious features emerge from this figure. First, there does not seem to be an exact correlation between the mid-infrared flux level and the blackbody-fit color temperature. While the SOFIA epoch is indeed the hottest and brightest, the IRAS epoch is comparably bright but close to being the coolest. Second, while sparsely populated, the overall trend of the mid-infrared light curve seems to suggest a long-term fading of the circumstellar dust component followed by a return to a hot, bright phase.
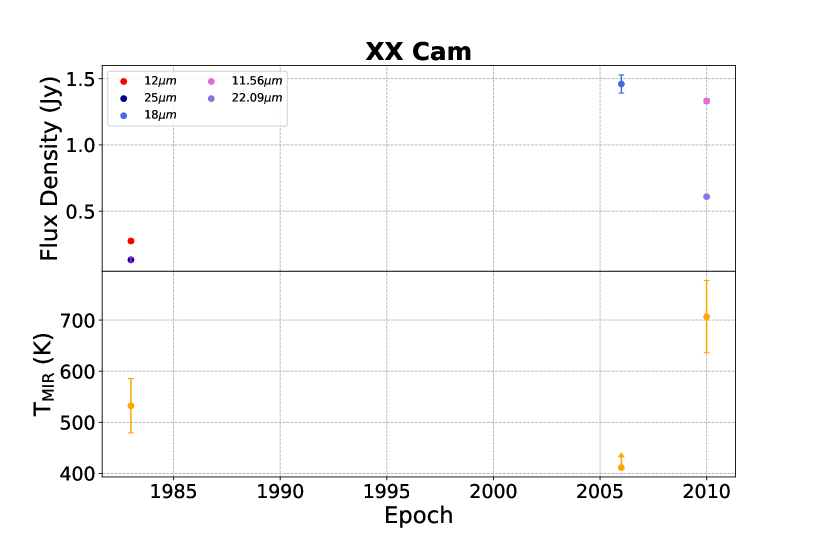
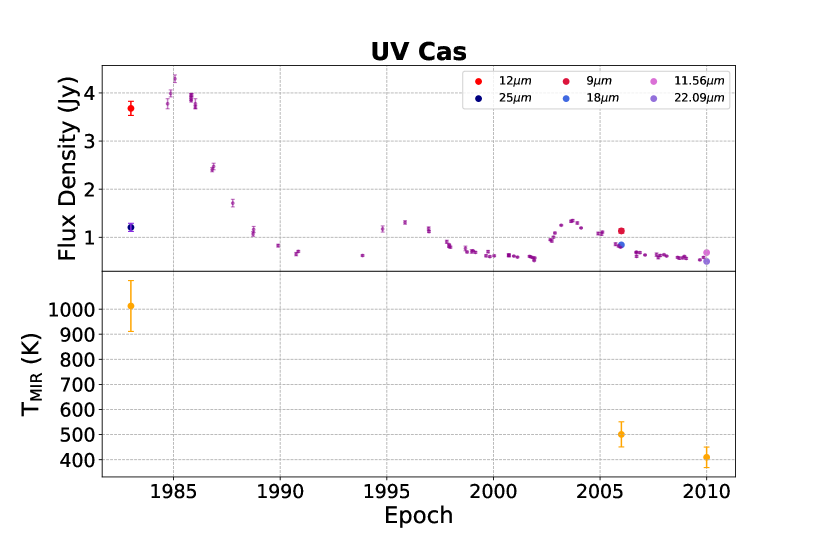
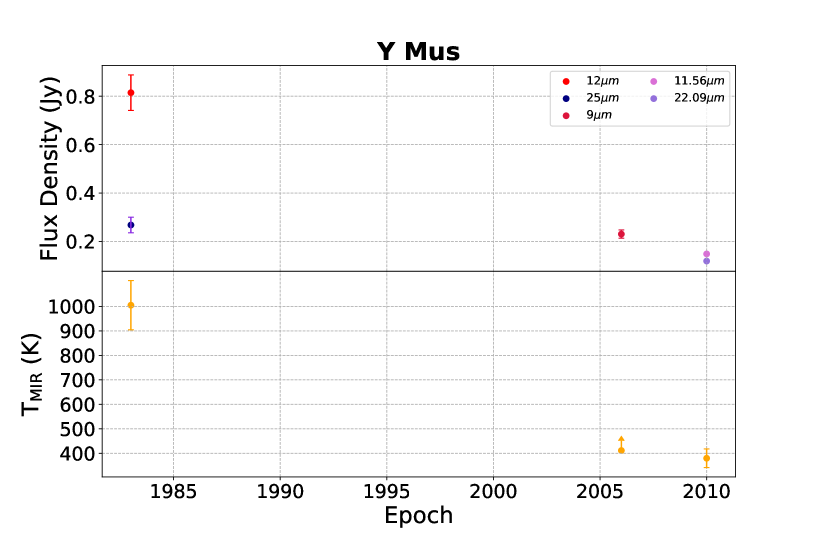
; symbols are as described in Figure 4. Y Mus only has a 9 m data point reported by AKARI and the dust color temperature is a limit assuming the 18 m flux is less than or equal to the 9 m flux. Raw L-band monitoring data for UV Cas from Table 1 of Bogdanov et al. (2010) are overplotted as small purple datapoints.
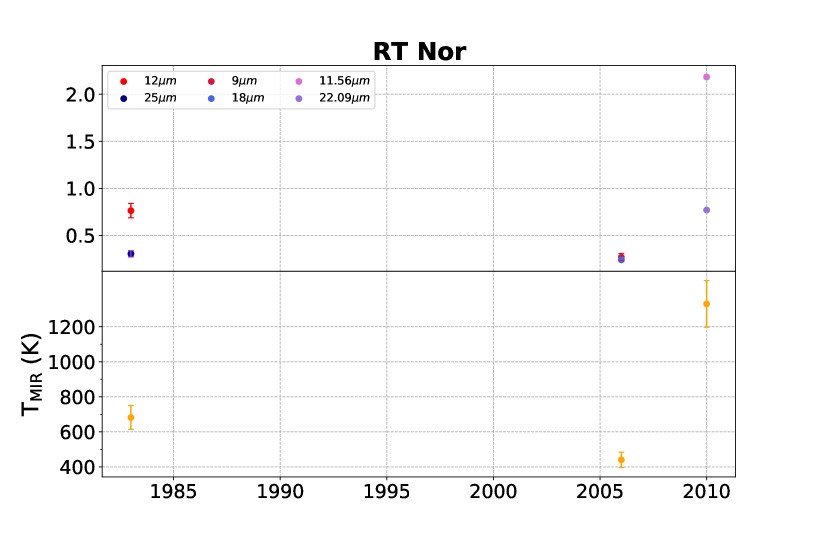
To put the mid-infrared variability of IRAS 00450+7401 into context we sought out other R Cor Bor stars that could be experiencing fading/brightening trends. We searched through IRAS, AKARI, and WISE data for 120 Galactic R Cor Bor systems and down-selected to the most dramatically variable sources which showed a factor of 5 or greater change in flux between any two epochs. This approach yielded four R Cor Bor stars: RT Nor, XX Cam, UV Cas, and Y Mus (all but XX Cam were similarly found to be highly variable in the mid-infrared by García-Hernández et al. 2011b).
Infrared data for each star are color corrected as described above and blackbody fits are made to determine mid-infrared dust color temperatures (TMIR) at different epochs. For Y Mus and XX Cam only one of the AKARI 9 or 18 m data points were available, but not both. Based on the observed 10 and 20 m data for other missions and complete data sets for other stars, we assume as a limiting case that the 9 m flux is greater than or equal to the 18 m flux and obtain a color temperature lower limit. Figures 5 and 6 show the mid-infrared lightcurves and estimated color temperatures for RT Nor, XX Cam, UV Cas, and Y Mus. Similar to the historical IRAS 00450+7401 fits, we assign 10% error bars to these blackbody-fit temperatures. Note that the AKARI epoch falls close to when García-Hernández et al. (2011b) made Spitzer observations of their R Cor Bor star sample which includes three of the four systems discussed in this paragraph; AKARI data and associated blackbody fits are in good agreement with the results of García-Hernández et al. (2011b).
UV Cas and Y Mus show what appears to be prolonged fading trends, although significant gaps in temporal coverage could hide a variety of behaviors (see additional details on UV Cas below). The color temperatures show a similar decay trend. This extends results by García-Hernández et al. (2011b) for these two stars which were informed by infrared data taken between 1983 and mid-2008.
RT Nor and XX Cam experience dramatic brightening episodes in the mid- to late-2000s, in the case of RT Nor with a factor of 10 change in 10 m flux over only a few year time-span. These high-flux epochs are found to be host to hot color temperatures, with values 1000 K for RT Nor (we strongly suspect XX Cam could have been similarly hot in the AKARI epoch, but the lack of a 9 m measurement prevents confirming this suspicion). García-Hernández et al. (2011b) observed RT Nor with Spitzer in mid-2005 and did not observe XX Cam and as such missed these burst-like events.
Indeed, as Figure 12 of García-Hernández et al. (2011b) shows, they did not identify any “burst” events between the IRAS and their Spitzer epochs. It is probably the case that other R Cor Bor stars have experienced less dramatic burst events than those seen for RT Nor and XX Cam (more akin to what IRAS 00450+7401 did between 2010 and 2022 as shown in Figure 4); investigating this will require a more exhaustive analysis of the available all-sky infrared databases.
Long term JHKL monitoring of 13 R Cor Bor stars conducted by Feast et al. (1997) and Bogdanov et al. (2010) over the roughly 1980-2010 period allows us to assess the above proposed mid-infrared fade/burst hypothesis. L-band data probes dust emission (although there is some stellar contribution) and is found to sometimes vary by up to 3 magnitudes over timescales of a few thousand days. The only overlap between the five stars discussed thus far in this paper and the JHKL monitoring sample is UV Cas. L-band photometry from Bogdanov et al. (2010) show that UV Cas experiences burst episodes every 10 years (Figure 6). These bursts have variable maximum amplitudes and rise-to-maximum times that are on the order of 2-3 years. Following the bursts, the dust emission experiences an exponential-like decay over the next 6-8 years. The times of maximum amplitude are not exactly 10 years apart with a peak in 1985 followed by a peak in roughly 1996, and then another near the end of 2003.
While UV Cas presents a smoothly varying L-band lightcurve with readily identifiable fading/bursting behavior, many of the stars presented in Feast et al. (1997) show more stochastic behavior and some even exhibit relatively flat L-band flux levels (the one star in Feast et al. 1997 with probable periodicity in its L-band dust emission level is R Coronae Borealis itself). It is not clear what would cause some R Cor Bor stars and not others to have dust emission that goes through fade/burst cycles; there does not appear to be any correlation with optical dimming events (e.g., Feast et al. 1997; García-Hernández et al. 2011b). Of course, for a sample of 10 stars as considered here and with only three epochs in the mid-infrared hosting a staggering coverage gap between 1983 and 2006, we should be careful not to hastily jump to any conclusions.
Comparing the L-band and 10–20 m lightcurves for UV Cas in Figure 6 shows that the 20 m flux level seems to track well with the L-band flux level. In 2006, during a time of decay after a burst episode, the 9 m flux is 50% higher than the L-band measurement while in 2010 the 11.56 m flux is comparable to the L-band flux level. With the available data it is not clear how the 10–20 m flux level would compare to the L-band at burst peak amplitude (it is also not clear that the L-band and mid-infrared wavelengths would necessarily peak at the same time). Figure 3 offers some insight, but only for the case of IRAS 00450+7401 which may or may not be applicable to other systems.
Our modern and historical mid-infrared analysis of IRAS 00450+7401 and a subset of other R Cor Bor stars make it clear that these systems would benefit from more frequent check-ups in the mid-infrared. Consistent monitoring over a wide range of wavelengths (e.g., 2–20 m) would elucidate if any fade/burst cycle is occurring for stars that have not shown obvious evidence for such cycling in the L-band. Coverage over at least two wavelengths e.g., 11 and 18 m for ground-based observations through the N- and Q-band atmospheric windows would enable rough dust temperature measurements for each epoch along with monitoring flux levels which would allow a new dimension of the dust characteristics of R Cor Bor stars to be probed.
We wish to thank Nicole Karnath and Bill Vacca for their excellent help in conducting SOFIA observations and assessing the resultant data. We thank Courtney Crawford for providing HdC spectral standard data and general discussion about R Cor Bor star spectral types. We also thank the referee whose valuable insight has strengthened our work. This publication makes use of data products from the Near-Earth Object Wide-field Infrared Survey Explorer (NEOWISE), which is a joint project of the Jet Propulsion Laboratory/California Institute of Technology and the University of Arizona. NEOWISE is funded by the National Aeronautics and Space Administration. We acknowledge with thanks the variable star observations from the AAVSO International Database contributed by observers worldwide and used in this research. This work has made use of data from the European Space Agency (ESA) mission Gaia (https://www.cosmos.esa.int/gaia), processed by the Gaia Data Processing and Analysis Consortium (DPAC, https://www.cosmos.esa.int/web/gaia/dpac/consortium). Funding for the DPAC has been provided by national institutions, in particular the institutions participating in the Gaia Multilateral Agreement. Research at Lick Observatory is partially supported by a generous gift from Google. This research has made use of NASA’s Astrophysics Data System, the SIMBAD database, and the VizieR service.
References
- Bogdanov et al. (2010) Bogdanov, M. B., Taranova, O. G., & Shenavrin, V. I. 2010, Astronomy Reports, 54, 620, doi: 10.1134/S1063772910070061
- Clayton (1996) Clayton, G. C. 1996, Publications of the Astronomical Society of the Pacific, 108, 225, doi: 10.1086/133715
- Clayton (2012) —. 2012, What are the R Coronae Borealis Stars?, arXiv. http://arxiv.org/abs/1206.3448
- Clayton et al. (2013) Clayton, G. C., Geballe, T. R., & Zhang, W. 2013, The Astronomical Journal, 146, 23, doi: 10.1088/0004-6256/146/2/23
- Clayton et al. (1992) Clayton, G. C., Whitney, B. A., Stanford, S. A., Drilling, J. S., & Judge, P. G. 1992, The Astrophysical Journal, 384, L19, doi: 10.1086/186253
- Clayton et al. (2011) Clayton, G. C., Sugerman, B. E. K., Stanford, S. A., et al. 2011, The Astrophysical Journal, 743, 44, doi: 10.1088/0004-637X/743/1/44
- Collaboration et al. (2016) Collaboration, G., Prusti, T., de Bruijne, J. H. J., et al. 2016, Astronomy and Astrophysics, 595, A1, doi: 10.1051/0004-6361/201629272
- Crawford et al. (2022) Crawford, C. L., Tisserand, P., Clayton, G. C., et al. 2022, A Spectral Classification System for Hydrogen-deficient Carbon Stars, Tech. rep. https://ui.adsabs.harvard.edu/abs/2022arXiv221004416C
- Feast (1997) Feast, M. W. 1997, Monthly Notices of the Royal Astronomical Society, 285, 339, doi: 10.1093/mnras/285.2.339
- Feast et al. (1997) Feast, M. W., Carter, B. S., Roberts, G., Marang, F., & Catchpole, R. M. 1997, MNRAS, 285, 317, doi: 10.1093/mnras/285.2.317
- Feast & Glass (1973) Feast, M. W., & Glass, I. S. 1973, Monthly Notices of the Royal Astronomical Society, 161, 293, doi: 10.1093/mnras/161.3.293
- Fryer & Diehl (2008) Fryer, C. L., & Diehl, S. 2008, 391, 335. https://ui.adsabs.harvard.edu/abs/2008ASPC..391..335F
- Gaia Collaboration et al. (2022) Gaia Collaboration, Vallenari, A., Brown, A. G. A., et al. 2022, Gaia Data Release 3: Summary of the content and survey properties, Tech. rep., doi: 10.48550/arXiv.2208.00211
- García-Hernández et al. (2011a) García-Hernández, D. A., Kameswara Rao, N., & Lambert, D. L. 2011a, The Astrophysical Journal, 729, 126, doi: 10.1088/0004-637X/729/2/126
- García-Hernández et al. (2011b) García-Hernández, D. A., Rao, N. K., & Lambert, D. L. 2011b, The Astrophysical Journal, 739, 37, doi: 10.1088/0004-637X/739/1/37
- García-Hernández et al. (2013) —. 2013, The Astrophysical Journal, 773, 107, doi: 10.1088/0004-637X/773/2/107
- Harper et al. (2018) Harper, D. A., Runyan, M. C., Dowell, C. D., et al. 2018, Journal of Astronomical Instrumentation, 7, 1840008, doi: 10.1142/S2251171718400081
- Hecht et al. (1984) Hecht, J. H., Holm, A. V., Donn, B., & Wu, C. C. 1984, The Astrophysical Journal, 280, 228, doi: 10.1086/161989
- Henden et al. (2015) Henden, A. A., Levine, S., Terrell, D., & Welch, D. L. 2015, 225, 336.16. https://ui.adsabs.harvard.edu/abs/2015AAS...22533616H
- Herter et al. (2013) Herter, T. L., Vacca, W. D., Adams, J. D., et al. 2013, Publications of the Astronomical Society of the Pacific, 125, 1393, doi: 10.1086/674144
- Iben et al. (1996) Iben, I., Tutukov, A. V., & Yungelson, L. R. 1996, 96, 409. https://ui.adsabs.harvard.edu/abs/1996ASPC...96..409I
- Kameswara Rao et al. (2004) Kameswara Rao, N., Reddy, B. E., & Lambert, D. L. 2004, Monthly Notices of the Royal Astronomical Society, 355, 855, doi: 10.1111/j.1365-2966.2004.08363.x
- Karambelkar et al. (2021) Karambelkar, V. R., Kasliwal, M. M., Tisserand, P., et al. 2021, The Astrophysical Journal, 910, 132, doi: 10.3847/1538-4357/abe5aa
- Kraemer et al. (2005) Kraemer, K. E., Sloan, G. C., Wood, P. R., Price, S. D., & Egan, M. P. 2005, The Astrophysical Journal, 631, L147, doi: 10.1086/497427
- Lambert et al. (1990) Lambert, D. L., Rao, N. K., & Giridhar, S. 1990, Journal of Astrophysics and Astronomy, 11, 475, doi: 10.1007/BF02709762
- Lambert et al. (2001) Lambert, D. L., Rao, N. K., Pandey, G., & Ivans, I. I. 2001, The Astrophysical Journal, 555, 925, doi: 10.1086/321504
- Lebouteiller et al. (2011) Lebouteiller, V., Barry, D. J., Spoon, H. W. W., et al. 2011, The Astrophysical Journal Supplement Series, 196, 8, doi: 10.1088/0067-0049/196/1/8
- Mainzer et al. (2014) Mainzer, A., Bauer, J., Cutri, R. M., et al. 2014, The Astrophysical Journal, 792, 30, doi: 10.1088/0004-637X/792/1/30
- Renzini (1990) Renzini, A. 1990, 11, 549. https://ui.adsabs.harvard.edu/abs/1990ASPC...11..549R
- Riello et al. (2021) Riello, M., De Angeli, F., Evans, D. W., et al. 2021, Astronomy and Astrophysics, 649, A3, doi: 10.1051/0004-6361/202039587
- Shappee et al. (2014) Shappee, B., Prieto, J., Stanek, K. Z., et al. 2014, 223, 236.03. https://ui.adsabs.harvard.edu/abs/2014AAS...22323603S
- Su et al. (2017) Su, K. Y. L., De Buizer, J. M., Rieke, G. H., et al. 2017, The Astronomical Journal, 153, 226, doi: 10.3847/1538-3881/aa696b
- Tisserand (2012) Tisserand, P. 2012, Astronomy & Astrophysics, Volume 539, id.A51, <NUMPAGES>16</NUMPAGES> pp., 539, A51, doi: 10.1051/0004-6361/201117874
- Tisserand et al. (2020) Tisserand, P., Clayton, G. C., Bessell, M. S., et al. 2020, Astronomy and Astrophysics, 635, A14, doi: 10.1051/0004-6361/201834410
- Tonry et al. (2018) Tonry, J. L., Denneau, L., Heinze, A. N., et al. 2018, Publications of the Astronomical Society of the Pacific, 130, 064505, doi: 10.1088/1538-3873/aabadf
- Wilson et al. (2003) Wilson, J. C., Eikenberry, S. S., Henderson, C. P., et al. 2003, 4841, 451, doi: 10.1117/12.460336
- Wright (1989) Wright, E. L. 1989, The Astrophysical Journal, 346, L89, doi: 10.1086/185586
- Wright et al. (2010) Wright, E. L., Eisenhardt, P. R. M., Mainzer, A. K., et al. 2010, The Astronomical Journal, 140, 1868, doi: 10.1088/0004-6256/140/6/1868
Here we report magnitudes for the reference source TYC 4380 226 1 (Table A1) and color-corrected mid-infrared flux values for IRAS, AKARI, and WISE data of IRAS 00450+7401 (Table A2).
| Instrument/Mission | Bandpass | Magnitude (Vega) |
|---|---|---|
| APASS DR9 | B | 12.7770.071 |
| APASS DR9 | V | 12.4860.052 |
| ASAS-SN | V | 12.430.022 |
| Gaia DR3 | V | 12.5270.03 |
| Gaia DR3 | R | 12.3320.03 |
| Gaia DR3 | I | 12.1200.04 |
Note Data used: AAVSO Photometric All Sky Survey (APASS; Henden et al. 2015), All-Sky Automated Survey for Supernovae (ASAS-SN; Shappee et al. 2014), and Gaia DR3 (Collaboration et al. 2016; Gaia Collaboration et al. 2022). Gaia G, BP, and RP magnitudes are converted to V, R, and I magnitudes following Riello et al. (2021). An average of the three V-band magnitudes was adopted.
| Mission | Bandpass | Flux (Jy) | Epoch |
|---|---|---|---|
| IRAS | 12 m | 3.36 0.13 | 1983 |
| IRAS | 25 m | 1.59 0.08 | 1983 |
| IRAS | 60 m | 0.37 0.05 | 1983 |
| AKARI | 9 m | 2.36 0.02 | 2006 |
| AKARI | 18 m | 1.39 0.01 | 2006 |
| WISE | 11.56 m | 1.97 0.02 | 2010 |
| WISE | 22.09 m | 1.10 0.02 | 2010 |