Detectability of Supermassive Dark Stars with the Roman Space Telescope
Abstract
The first bright objects to form in the Universe might have been Dark Stars, made primarily of hydrogen and helium, yet powered by dark matter. Formed in the early Universe at redshift , some can grow supermassive by accretion to more than and . In this study, we investigate the detectability of supermassive dark stars (SMDS) by the Roman Space Telescope (RST). RST will be able to detect SMDSs at redshifts as high as . For instance, if they exist at they will be detected as band dropouts, at , as band dropouts, and at as (i.e. H/K band) dropouts. In cases with gravitational lensing factors of , RST will be able to find SMDS as small as at at the or above level with exposure times of s. Due to its much larger effective field of view, RST will have a larger detection probability of SMDSs at redshifts than the James Webb Space Telescope (JWST). JWST, on the other hand, being sensitive to higher wavelengths, is sensitive to higher redshift objects as well. We advocate that SMDS candidates found with RST be further studied with JWST, to assist in differentiating SMDS from early galaxies containing zero metallicity nuclear burning stars at similar redshifts. To differentiate the two types of objects, we compare their spectra, photometry in RST bands, color indexes and image morphology. With RST alone, the differentiation is possible only for limited cases: SMDS formed via “adiabatic contraction” (DM pulled into the star via gravity alone) with and lensed by have distinct photometric signatures from those of the first galaxies. For SMDSs formed via “dark matter capture,” their spectra are degenerate to those of many galaxies with little to no nebular emission. Thus with RST alone, the only way to tell them apart from first galaxies would be via image morphology: i.e. point object (SMDSs) vs. extended object (sufficiently magnified galaxies). However, if the same objects are further examined by JWST, there is a “smoking gun” for detection of SMDS once the spectroscopy is available: a telltale spectroscopic signature, the HeII 1640 absorption line. While RST does not cover the wavelength band required to find this line (for ), JWST does. Hence the two detectors can be used together in identifying SMDS. The detection and confirmation of any supermassive dark star will provide evidence for a new type of star, powered by dark matter. Moreover, such massive stars can also be natural progenitors of the supermassive black holes powering the extremely bright quasars observed at early times ().
NORDITA-2023-027 \reportnumUTWI-24-2023
1 Introduction
The “dark ages” of the universe end with the formation of the first stars. This event -the cosmic dawn - happens roughly 200-400 Myrs after the Big Bang, when pristine, zero metallicity, molecular hydrogen clouds at the center of minihaloes start to undergo gravitational collapse, a necessary first step towards the formation of stars. In the standard picture of the formation of Population III stars (Abel et al., 2002; Barkana & Loeb, 2001; Bromm & Larson, 2004; Yoshida et al., 2006; O’Shea & Norman, 2007; Yoshida et al., 2008; Bromm et al., 2009), the collapsing hydrogen clouds eventually become protostars , which grow by accretion as long as radiative feedback doesn’t halt accretion. They are thought to grow to .111The question as to the numbers of these stars forming in a given minihalo is as yet unsettled, due to the possibility of fragmentation of the hydrogen cloud. In simulations, the fragmentation has been shown to be suppressed due to the effects of dark matter heating (Smith et al., 2012; Stacy et al., 2012, 2014). On the other hand, the large dark matter abundance at the centers of the minihalos may alter these conclusions. Dark matter, whether it be Weakly Interacting Massive Particles, Self-Interacting Dark Matter, or other candidates, may provide a heat source that halts the collapse of the hydrogen clouds (Spolyar et al. (2008)) and leads to a Dark Star, a star made almost entirely of hydrogen and helium but powered by dark matter heating (for a review, see Freese et al. (2016)). These Dark Stars may grow to becomes very massive and bright Supermassive Dark Stars (SMDS) (Freese et al. (2010)), up to and , and be visible in current and upcoming telescopes, including the James Webb Space Telescope (JWST) (Ilie et al., 2012) and, as is the subject of the current paper, the upcoming Roman Space Telescope (RST). The goal of the present paper is to make predictions for the observability of Dark Stars in RST and suggest how RST and JWST can be used in tandem to discover SMDS candidates and confirm them spectroscopically.
Before the era ushered in by the James Webb Space Telescope (JWST), our understanding of the formation and properties of first luminous objects in the universe came only from a combination of theoretical and numerical models. Already, only a few months after becoming operational, photometric data from JWST are finding the most distant galaxy candidates to date (e.g. Naidu et al., 2022a; Finkelstein et al., 2022; Donnan et al., 2023; Naidu et al., 2022b; Labbé et al., 2023; Robertson et al., 2023; Curtis-Lake et al., 2023) and stand to discover SMDSs. Those findings significantly strengthen the tension that begun to emerge during the HST era between the picture one gets via numerical simulations of the formation of the first stars and assembly of the first galaxies in the universe (e.g. Gnedin, 2016; Dayal & Ferrara, 2018; Yung et al., 2019; Behroozi et al., 2020) and what nature offers us (e.g. Stefanon et al., 2019; Bowler et al., 2020; Harikane et al., 2022; Bagley et al., 2022; Labbé et al., 2023). Simply put, we are observing too many extremely bright galaxy candidates too early in the universe. If some of those objects were supermassive dark stars () instead of galaxies, this tension would be alleviated. Important theoretical uncertainties, such as how massive the first generation of stars can be, or if they can be powered by dark matter annihilations (Dark Stars) or only by nuclear fusion (Population III stars), still remain open questions, that are now more relevant than ever.
In a recent paper (Ilie et al., 2023), two of us showed that JWST may have already discovered Dark Stars, although differentiation from early galaxies is not yet possible, given the low S/N of the available spectral data for the SMDS candidates we identified based on photometric data, as well as the lack of resolution to tell if the detected objects are point or extended in nature. As yet only high redshift objects found by JWST have spectra, which is required to prove that the objects are indeed at based on clean observation of the Lyman break. We examined the four high redshift objects in the JADES (JWST Advanced Extragalactic Survey) data (Robertson et al., 2023; Curtis-Lake et al., 2023), and showed that three of them (JADES-GS-z13-0, JADES-GS-z12-0, JADES-GS-z11-0) are consistent with being Dark Stars. In addition to JWST, the upcoming RST will also observe some of the first galaxies, and potentially even the first stars. In this paper we address the following question: how can one disambiguate between supermassive dark stars (SMDS) and the first galaxies made entirely of standard Population III stars with RST.
The standard picture of the formation of the first stars may be drastically changed due to the role of the large dark matter abundance at the center of the host minihalo, leading to a heat source for the collapsing molecular cloud. Spolyar et al. (2008) first considered the possibility that, if dark matter consists of Weakly Interacting Massive Particles (WIMPs), their annihilation products would be trapped inside the collapsing molecular cloud, thermalize with the cloud, and heat it up. This dark matter heating can overcome the dominant hydrogen cooling mechanisms and thereby halt the collapse of the protostellar gas cloud. As such, DM heating could lead to the formation of a new phase in the stellar evolution, a Dark Star. These are actual stars, made almost entirely of hydrogen and helium, with dark matter providing only 0.1% of the mass of the star. The stars are in hydrostatic and thermal equilibrium, obeying all the equations of stellar structure. Initially , dark stars grow by accretion and some can become very massive () and very bright (). They are puffy diffuse objects, A.U. in size, with dark matter annihilation power spread uniformly throughout the star. They have low surface temperatures (K), leading to very little ionizing radiation and thus very little feedback preventing their further accretion. Thus, some of the dark stars can grow to be supermassive SMDSs.
In a recent paper (Wu et al., 2022), one of us considered the possibility that dark matter, rather than being comprised entirely of WIMPs, consists instead of a different type of particle, namely Self Interacting Dark Matter (SIDM). In the case of SIDM, it was found that the deepening gravitational potential can speed up gravothermal evolution of the SIDM halo, yielding sufficiently high dark matter densities for Dark Stars to form. The SIDM-powered Dark Stars can have similar properties, such as their luminosity and size, as Dark Stars predicted in WIMP dark matter models. Regardless of the nature of the DM particle powering a SMDS (WIMPs vs SIMPs vs any other potential candidates that could form a DS) the final fate of SMDSs is the same: once the DM fuel runs out the object eventually collapses to a supermassive black hole (SMBH), leading to an interesting possible explanation of the many puzzling SMBHs in the Universe found even at high redshifts.
In this work we consider the possible detection of Supermassive Dark Stars (SMDSs) with the upcoming Roman Space Telescope (RST), which is set to launch in the mid-2020’s. Some, but not all, supermassive dark stars vs early galaxies comprised only of standard Pop III stars have different photometric signatures in JWST (see Zackrisson, 2011; Ilie et al., 2012). In order to familiarize the reader with the subject of SMDS detection and their observable signatures, in the remainder of this paragraph we summarize the results obtained by two of us (Ilie et al., 2012) regarding the predictions of SMDSs for JWST; many of the remarks here will apply also to RST. One of the main results of Ilie et al. (2012) was that at reshifts SMDSs of mass or higher are bright enough to be detectable in all the bands of the NIRCam instrument on JWST, even without gravitational lensing. With photometry distant objects () are detectable as dropouts, i.e. the presence of an image in a band and its absence in the immediately adjacent band probing shorter wavelengths. This is due to the efficient absorption of Lyman- photons by the neutral H present in abundance at redshifts higher than . For instance, with JWST, SMDS will show up as either J-band (), H-band (), or K-band dropouts (). Moreover, based on null detection results with HST (therefore assuming SMDS survive until where HST bounds apply) in Ilie et al. (2012) we estimated that a multiyear deep parallel survey with JWST covering an area of 150 arcmin2 can find anywhere between one and thirty unlensed SMDSs as either K band or H band dropouts. Of course this number can be even higher 222as high as , where is the fraction of early DM halos hosting SMDS. if SMDSs do not survive until , and therefore our bounds based on HST null detection do not apply. Compared to JWST, the wider effective field of view (FOV) of the RST will increase the probability of detection so that the predicted number of objects will be larger.
In principle there are three techniques to differentiate between SMDS and early galaxies dominated by Pop III stars. First, SMDS are point objects, whereas Pop III galaxies are not. This can show as a point spread function (PSF) difference, if the telescope has high enough resolution, and/or if the objects are gravitationally lensed. For RST we apply this technique in Sections 6 and 7. Secondly the photometric signatures in color-color plots can be quite different for SMDS vs. Pop III galaxies. This was shown in Zackrisson (2011); Ilie et al. (2012) for the case of JWST, and for RST we do this analysis in Sections 6 (see fig. 17) and 7 (see figs. 23 and 24). The differences are due to different spectral features, that, in turn, are converted into different colors in various bands. Lastly, the most precise way to disambiguate is to have a full spectral analysis. We use the TLUSTY code (Hubeny, 1988) to obtain spectra for the SMDSs, as presented in Sec. 3 (see also Ilie et al. (2012) for previous work). Since SMDSs are stars, their spectra can roughly be modeled as black bodies. The more detailed spectra obtained using TLUSTY also include the effects of the stellar atmospheres. For comparison with spectra of Pop III galaxies, we use simulations from the Yggdrasil model grids of early galaxies (Zackrisson et al., 2011).333see also https://www.astro.uu.se/~ez/ SMDS with K, such as all SMDSs formed via Adiabatic Contraction and powered by WIMPs more massive than GeV (see Fig. 1), are too cool to produce any nebular emission. For the hotter ones (such as those formed via DM Capture, or via Adiabatic Contraction and powered by WIMPs lighter than GeV) there is a possibility that they might create an ionization bound nebula, and therefore exhibit nebular emission. The main uncertainty in this scenario is how much gas is available around a SMDSs with K. The most massive SMDSs (i.e. ) have already accreted most of the baryons in the DM halo, and therefore should have little to no nebular emission, even if they are hot. For this reason in this paper we consider only SMDSs of purely stellar spectra. On the other hand, the spectrum of a Pop III/II galaxy is usually dominated by nebular emission.444For completness in this paper we also consider the case of Pop III/II galaxies with no nebular emission Particularly relevant for the JWST are the He-II emission line at m (also called the He II line) and the H- emission. Those would be telltale signatures of a Pop III galaxy. By contrast, for SMDSs, at the same wavelength we would have an absorption feature. Other prominent SMDS spectral features (that get redshifted into the region RST is sensitive to) are He-I absorption and the Lyman- break for the case of the coolest SMDS (K), whereas for the hottest SMDS (K) the main spectral features will be He II absorption lines. A detailed discussion of the SMDS spectra can be found in Sec. 3.
The literature on the possibility that DM annihilation might have effects on stars dates back to the s and early s, with the initial work studying the effects on current day stars (e.g. Krauss et al., 1985; Press & Spergel, 1985; Spergel & Press, 1985; Gould, 1988; Salati & Silk, 1989; Gould & Raffelt, 1990; Gould, 1992, to name a few). Regarding the DM heating effects on the first stars we mention Spolyar et al. (2008, 2009); Freese et al. (2008b, a, 2010); Taoso et al. (2008); Yoon et al. (2008); Iocco et al. (2008); Casanellas & Lopes (2009); Ripamonti et al. (2009, 2010); Gondolo et al. (2010); Hirano et al. (2011); Sivertsson & Gondolo (2011); Ilie et al. (2012). For reviews see Ch. 29 (“Dark Matter and Stars”) of Bertone (2010), Tinyakov et al. (2021) and Freese et al. (2016).
We organize this paper as follows. We start, in Sec. 2 with a brief review of dark stars and their properties. A discussion of the simulated spectra of supermassive dark stars (SMDSs) is presented in Sec. 3. Then, in Sec. 4, we study the detectability of SMDSs with the Roman Space Telescope and make predictions on observational results. In Sec. 6, we consider different possibilities for the observed high redshift () objects, such as Pop III galaxies, and compare their observable properties to those of SMDSs. The effect of gravitational lensing on our results is discussed in Sec. 7. In Sec. 8, we present conclusions and summarize our study. We end with Appendix A where we present key parameters used for our simulated images. Throughout this paper, we will assume Cosmology and use the following cosmological parameters: , and .
2 Dark Stars
The first stars form as clouds of molecular hydrogen start to collapse inside the dark matter rich centers of minihalos at . As first showed by Spolyar et al. (2008), the collapsing baryons gravitationally pull DM in with them, increasing even further the DM abundance. If the DM is made of Weakly Interacting Massive Particles (WIMPs), they annihilate among themselves. The WIMP annihilation rate is where is the WIMP number density, the standard annihilation cross section is
| (1) |
and WIMP masses are in the range 1 GeV-10 TeV. WIMP annihilation produces energy at a rate per unit volume
| (2) |
is the WIMP mass, and is the WIMP energy density. It is important to emphasize that Dark Stars are produced for a wide variety of WIMP masses and annihilation cross sections. Indeed the cross section may be several orders of magnitude larger or smaller than the canonical value in Eq.(1), and yet (roughly) the same DSs result. In previous work we studied WIMP masses TeV (as we will show below, see Fig. 1, the lighter WIMPs provide more heating and therefore slightly different DSs since ). Since the heating rate scales as , considering a variety of WIMP masses is equivalent to studying a variety of annihilation cross sections.
The annihilation products typically are electrons, photons, and neutrinos. The neutrinos escape the star, while the other annihilation products are trapped in the dark star, thermalize with the star, and heat it up. The luminosity from the DM heating is
| (3) |
where is the fraction of the annihilation energy deposited in the star and is the volume element.
Dark stars are born with masses . They are giant puffy ( AU), cool (surface temperatures K), yet bright objects (Freese et al., 2008a). They reside in a large reservoir of baryons, i.e., % of the total minihalo mass . These baryons can start to accrete onto the dark stars. Dark stars can continue to grow in mass as long as there is a supply of DM fuel. Two mechanisms–discussed below–can provide enough DM fuel to potentially allow the DS to become supermassive () and very luminous (). 1) Extended Adiabatic Contraction (AC): The infall of baryons into the center of the minihalo provides a deeper potential well that increases the DM density. A simple approach towards this gravitational effect is the Blumenthal method for adiabatic contraction. We (Freese et al., 2009) and others (Iocco et al., 2008; Natarajan et al., 2009) have previously confirmed that this simple method provides dark matter densities accurate to within a factor of two, sufficient for these studies. There remains the question of how long this process can continue. In the central cusps of triaxial DM halos DM particles follow a variety of centrophilic orbits (box orbits and chaotic orbits Valluri et al., 2010) whose population is continuously replenished, allowing DM annihilation to continue for a very long time (hundreds of millions of years or more). Freese et al. (2010) then followed the growth to supermassive dark stars (SMDSs) of mass . 2) Capture: At a later stage, there is an additional mechanism that provides DM fuel.
Once the initial DM reservoir is exhausted (or the DS is kicked away from the DM rich region), the star shrinks, its density increases, and subsequently further DM is captured from the surroundings (Freese et al., 2008b; Iocco, 2008; Sivertsson & Gondolo, 2011) as it scatters elastically off of nuclei in the star. In this case, the additional particle physics ingredient of WIMP scattering is required. This elastic scattering is the same process that direct detection experiments (e.g. LUX/XENON, SuperCDMS, DAMA, CRESST) rely upon in WIMP direct detection searches.
2.1 Dark Star Properties
The properties of dark stars have been studied in a series of papers, first using polytropic models (Freese et al., 2008a; Spolyar et al., 2009),555A polytrope of index is defined by the following relationship betwen pressure and density in a star: . Whenever such a relationship exist, the mechanical structure of the star, i.e. and , can be found without any knowledge of the energy source powering the star. and then using the MESA stellar evolution code. For the case of polytropic models for supermassive dark stars see Freese et al. (2010). Dark Stars start as convective stars in thermal and hydrostatic equilibrium, powered exclusively by adiabatically contracted DM annihilations. As such they can be well modeled by polytropes. Accretion leads to their growth, and by the time they reach roughly they become radiation pressure dominated and can be well modeled by polytropes. As any radiation pressure dominated star, dark stars more massive than will have a luminosity approximated well by the Eddington limit:
| (4) |
where is the Universal gravitational constant, is the speed of light, is the mass of the star in question, and is the stellar atmospheric opacity. To get an order of magnitude estimate we can assume that the dominant opacity source in metal-free atmospheres of supermassive dark stars is due to Thompson electron scattering. This is a function of the hydrogen fraction () of the star: . Further assuming a big bang nucleosynthesis (BBN) composition of the stellar atmospheres allows one to recast the Eddington limit as:
| (5) |
For the case of adiabatically contracted DM powered Dark Stars the polytropic approximation has been tested and confirmed by Rindler-Daller et al. (2015) using numerical solutions of the full stellar structure equations using the Modules for Experiments in Stellar Astrophysics (MESA) 1D stellar evolution code. By the time their mass becomes , for SMDS formed via either the extended AC (without capture) mechanism or via DM capture, their luminosity is as high as .
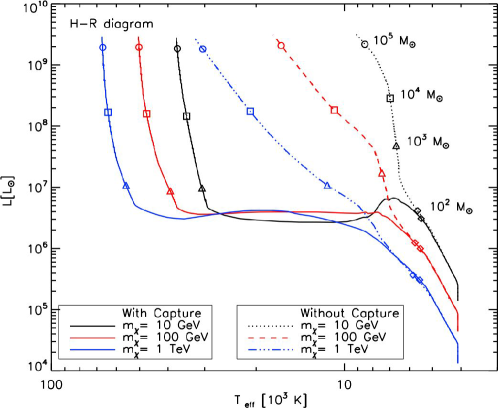
In Fig. 1 (reproduced from Freese et al. (2010)) we plot the evolutionary tracks in an HR diagram for dark stars that grow via accretion and reach a supermassive phase (SMDS) via either dark matter capture (labeled “with capture”) or extended AC (labeled “without capture”). Those evolutionary tracks are obtained by solving numerically the equations of stellar structure under the simplifying assumption of a polytrope of variable index. From Eq. 5 we can see that for even more massive dark stars, the luminosity scales linearly with the stellar mass. Note that lighter DM particles are more efficient in heating up a Dark Star, in both the Extended AC and the “with capture” cases, as (this fact is easy to see for the extended AC case by combining equations 2 and 3). This effect is manifest in Fig. 1 in two ways. First, at the same effective temperature () a SMDS powered by a lighter WIMP will be brighter and puffier for both formation mechanisms considered. For a given luminosity a SMDS powered by a lighter DM particle (in either scenario) will be cooler and puffier than those powered by heavier DM particles. We emphasize that the evolutionary tracks of Fig. 1 are largely insensitive to the assumed accretion rate, which only dictates how fast a DS can grow from the moment it was formed () until the moment it emits light to be observed by a telescope (). As such, the observable properties of SMDSs are largely independent of the assumed formation redshift or accretion rate, and are instead controlled by the stellar mass, stellar composition, surface temperature, and radius. In turn, the later two are fixed by DM parameters such as its mass (), annihilation cross section (), and, for the case “with capture” ambient DM density (). For future reference we list in Table 1 relevant parameters for SMDSs obtained via the polytropic approximation for the case of 100 GeV WIMPs and SMDS formed in DM halos at redshift .
| Formation Mechanism | ||||
|---|---|---|---|---|
| Extended AC | 407 | 31 | 10 | |
| Extended AC | 39 | 14 | ||
| Extended AC | 61 | 19 | ||
| Capture | 774 | 1.8 | 49 | |
| Capture | 2.7 | 51 | ||
| Capture | 8.5 | 51 |
2.2 Death of Dark Stars and the Formation of Supermassive Black Holes
Dark stars will continue to shine and grow as long as there are situated in a dark matter rich environment that provides the fuel for their existence. The minihaloes they formed in will merge with other minihaloes, potentially providing a new fuel source for the DS. Further DM may be captured from the surroundings. Eventually the DM fuel will run out. At that point, in smaller DSs, the ignition of nuclear fusion in the star after the DM fuel is gone may lead to a period on the Zero Age Main Sequence (ZAMS) lasting years before collapse to a black hole. Supermassive Dark Stars heavier than , on the other hand, will collapse directly to SMBHs. As such, supermassive dark stars offer an interesting explanation for the more than 50 SMBHs powering the high redshift () quasars observed over the past decade (for statistical studies see Wang et al., 2019). For instance, the most distant quasar observed, as of this writing, is J013-1806, at , corresponding to just 670 Myrs after the Big Bang (Wang et al., 2021). This object is powered by a supermassive black hole of a mass . The existence of such an enormously large black hole when the universe was so young poses great challenges to the regular theories and models of SMBH formation and growth. For example a BH seed ( the upper limit for the mass of a black hole (BH) formed by the collapse of a Pop III star (Hirano et al., 2014)) accreting continuously at the Eddington limit would reach a billion solar masses at redshifts of only if this accretion process started at . Thus the observation of quasars powered by SMBHs more massive than at implies super-Eddington accretion, if we insist on having a Pop III stellar seed for the initial BH. A much more natural explanation, as alluded to before, is to start with a supermassive seeds. The existence of J013-1806 (Wang et al., 2021) implies that, assuming accretion at the Eddington limit, that the seed black hole must have had a mass of if the growth begun at , i.e. 400-570 Myrs growth time via accretion. Supermassive dark stars are the ideal candidates for such massive BH seeds.666We mention here an alternative supermassive BH seed: direct collapse to black holes of very metal poor low angular momentum gas clouds via dynamical instabilities (Loeb & Rasio, 1994; Begelman et al., 2006; Lodato & Natarajan, 2006). For a recent review see Inayoshi et al. (2020) As soon as the DM fuel runs out the SMDS will convert almost instantaneously into a SMBH, and this process could happen at redshifts as high as or even higher.
3 Dark Star Spectra
Since the Dark Star spectra control most observable properties (such as color in various bands, signal to noise ratio, etc.) we discuss here the most prominent properties of the spectra, and the various differences in the two formation scenarios considered: with capture and extended AC. The spectra of SMDSs were first presented and discussed by two of us in Freese et al. (2010); Ilie et al. (2012).
To zeroth order the spectrum of a DS (like any other star) is a blackbody. The role of the SMDSs stellar atmospheres in reprocessing of photons and thus reshaping the black body spectrum approximation can be investigated by using the TLUSTY code (Hubeny, 1988). To simplify our discussion here, we only consider SMDSs of three masses: , and . Lower mass SMDS have very little chance of detection, unless they are significantly gravitationally lensed, as we will show in Fig. 22.
In Fig. 2 we present the rest-frame spectra of the three different mass SMDSs considered for both formation scenarios. The left panel illustrates the spectra for the case of “With Capture”, i.e. when WIMPs captured due to elastic scattering are included. The right panel illustrates the DS spectra for SMDSs in the case “Extended AC”, where only the WIMPs gravitationally pulled into the center of the minihalo provide the heat source. In this figure we have taken the WIMP mass to be 100 GeV. In the remainder of this section we discuss the wavelength, flux density, and most prominent spectral features (due to absorption by neutral H and He in the stellar atmospheres), since these will be important features in detecting SMDSs with Roman Space Telescope as well as differentiating them from high redshift galaxies containing more standard Pop III stars.
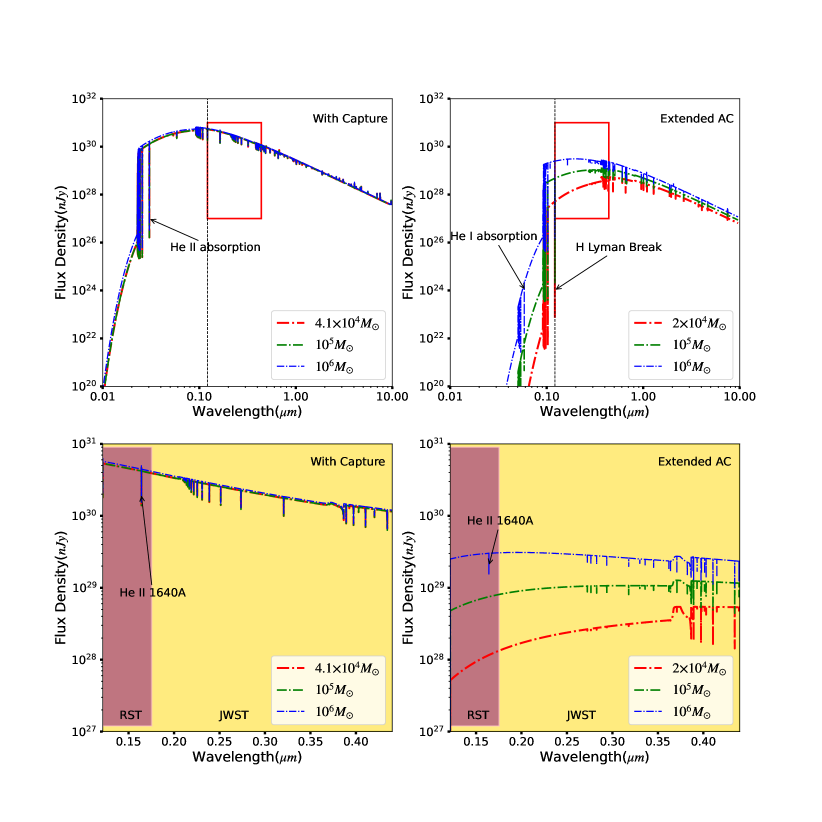
Peak Wavelength: As discussed above, the DS formed “with capture” are hotter than those formed via “extended AC” (as a reminder, DS “with capture” form at a later stage of stellar evolution, when the original gravitational DM has run out, and the star has collapsed via Kelvin-Helmholtz contraction to a denser object capable of capturing further WIMPs.) As a consequence the DSs “with capture” have spectra peaking at shorter wavelengths in the UV range at roughly . The flux does not decrease substantially (with decreasing wavelength) until after the HeII (singly ionlized He) absorption break (due to absorption by the stellar atmosphere, see discussion below) at wavelengths ranging between (see top left panel of Fig. 2). In contrast, for SMDSs formed via the Extended AC mechanism, absorption by neutral H or He cuts off most of the UV flux at wavelengths shorter than the Ly- line (see top right panel of Fig. 2). Yet SMDSs “with capture” have a steeper UV continuum slope (), which is one of the factors leading to those objects having a larger magnitude difference between neighboring IR bands relevant for both JWST and RST (and used to search for dropouts as described below).
Flux Density: First, we note that the flux density for SMDS formed via capture is roughly insensitive to the stellar mass since they have nearly equal surface temperatures. Secondly, by comparing the top two panels of Fig. 2 one can see that the surface flux density around the peak for SMDS of the same mass formed via DM capture is about larger than that formed via Extended AC. This is due to the higher effective temperature () in the case “with capture.” However, as they reach supermassive status both type SMDS will be Eddington limited (see Eq.(5)), and therefore their brightness is determined largely by the stellar mass, and to a lesser degree by their composition via the opacity of the stellar atmosphere (). The fact that different flux densities (extended AC vs capture) lead to the same total luminosity (Eddington limit) for both cases can be traced to their different radii: extended AC stars are more puffy since they never undergo a contraction phase.
Spectral Features: The most prominent spectral features of SMDSs are due to absorption by neutral H and He in the SMDSs stellar atmospheres (see Fig. 2). This is due to their relatively cool surface temperatures ( K). In contrast, the fluxes from Pop III galaxies are, in many scenarios, dominated by nebular emission (Zackrisson et al., 2011). Going back to the features in the SMDSs spectra, below we contrast them for the two formation scenarios considered. The relatively low surface temperature ( K) for the SMDS formed via the extended AC scenario (right panels of Fig. 2) leads to a larger fraction of neutral H and He in their stellar atmospheres, when compared to a SMDS of the same mass but formed via the DM capture mechanism. This explains the strong absorption lines at wavelengths corresponding to the Lyman series (), caused by neutral H, and, at shorter wavelengths () the HeI break. Additionally, the presence of neutral H in the cooler SMDSs formed via AC leads to a prominent Balmer break at , followed by a sequence of strong absorption lines in the Balmer series, as can be seen in the lower right panel of Fig. 2. Conversely, the higher surface temperature (T K) of SMDS formed via DM capture implies a large ionization fraction for H, hence the Lyman or Balmer absorption lines are weaker. The most prominent SED feature of SMDS formed via capture is the HeII (singly ionized He) break at wavelengths ranging between and . Common between the two cases are HeI lines at wavelengths , the isolated HeII absorption line at , a sequence of HeII lines at wavelengths , and more HeI lines at . Note that JWST and RST will be sensitive to a relatively narrow bin of restframe wavelengths, as shown in the lower two panels of Fig. 2. Thus, many of the spectral features discussed above will not be observable with either instrument. Since we expect SMDSs to be at , this implies that all the features to the left of the restframe Ly- line (i.e. ) are going to be erased by the Gunn-Peterson trough. At the other end, the highest value of the restframe wavelength probed is just , with being the maximum wavelength to which each instrument is sensitive (i.e. for the Grism spectrometer of RST and for NIRSpec onboard JWST). In turn, this implies that for objects at (such as SMDSs) RST will only probe the SEDs spectroscopically up to , whereas JWST will be sensitive to features in the SEDs up to . The single most intriguing spectral feature that can be potentially detected in the region of overlap of both instruments is the HeII absorption line at restframe wavelength . The observation of this feature would be a smoking gun for a SMDS, since at the same wavelength galaxies would typically exhibit a nebular emission line instead.
4 Detectability of Supermassive Dark Stars with the Roman Space Telescope
Here we examine the detectability of SMDSs with the Roman Space Telescope (RST). In this section we assume that the objects are unlensed777In future sections we will consider the case of SMDS with magnified imagaes due to lensing by foreground objects.. In Sec. 4.1, we estimate in which RST wavelength bands SMDSs of various masses will be observable with exposure times ranging from s. Then in Section 4.2 we examine the use of photometric dropout criteria for SMDSs in RST. We will show that SMDSs of mass can be detected by RST with exposure times of s as J, H and H/K band dropouts, corresponding to emission redshifts of , , and , respectively.
4.1 Detector Capability and SMDS redshifted spectra
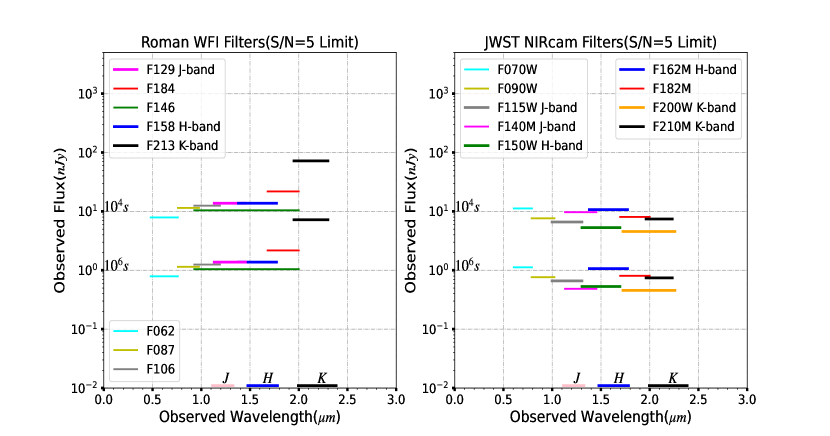
Roman’s wavelength coverage of visible and infrared light will span 0.5 to 2.3 microns. In Fig. 3 we plot the projected sensitivity limits of the Roman Space Telescope in its Wide Field Instrument (WFI) filters888https://roman.ipac.caltech.edu/ (left panel) and contrast them to those of the NIRCam filters covering the same wavelength range () onboard the James Webb Space Telescope 999https://jwst-docs.stsci.edu/jwst-near-infrared-camera/nircam-predicted-performance/nircam-sensitivity (right panel). For both detectors we show the flux necessary to achieve a signal to noise ratio S/N for two exposure times considered: and s. The two telescopes have comparable sensitivity below whereas at higher wavelengths RST loses sensitivity, as seen by the gradual increase in the necessary flux to achieve a detection (S/N=5) in the F184 and F213 WFI bands of RST. This is in contrast with the NIRCam instrument, for which the sensitivity actually mildly improves for filters probing those wavelengths. For instance the projected detection limits of the F213 WFI RST filter are about an order of magnitude weaker than the corresponding ones for the F200W NIRCam filter. This, in turn, corresponds to JWST being able to detect, in the F200W filter, objects that are ten times dimmer (i.e. 2.5 larger magnitude) than RST with the F213 WFI filter, assuming the same exposure time. For most other overlapping bands the difference in their detector capability is minimal.
JWST is able to probe the universe deeper than RST, i.e. to higher redshifts, due to it being sensitive to larger wavelengths (the Mid-Infrared Instrument (MIRI) is sensitive up to 28 microns). However, RST excels in its Field of View (FOV) capability. For instance, each of the RST deep field images will cover an area of the sky roughly equivalent to the apparent size of a full moon. Conversely, Webb’s First Deep Field image covers an area of the sky smaller than the apparent size of a grain of sand as viewed at armlength. As such, the probability of detecting SMDSs at redshifts as high as using wide field surveys is much larger for RST101010As we will see in Secs. 4.2 RST will be able to detect SMDS to redshifts as high as as photometric dropouts. than JWST, simply because each survey will cover a much larger area.
Given the sensitivity limits of RST and JWST, we can then overlay the relevant DS spectra to determine their detectability of a individual Dark Star in these instruments. We take the spectra in the rest frame of the star obtained in Section 3 and redshift them appropriately:
| (6) |
where and represents the observed and emitted wavelength, is the radius of SMDSs, is the luminosity distance, and and represents the original and shifted spectra. To be concrete, we assume a SMDS formed via either mechanism survives to various redshifts, as shown in Fig. 4. Moreover, we add the sensitivity limits discussed above, in order to assess the potential observablility of SMDSs with RST. Note that the SMDSs formed via AC (right panel) will appear brighter in all bands covered by RST, when compared to SMDSs of the same mass formed via DM capture (left panel). This is a combination of two factors. First, the SMDSs formed via DM capture are typically more compact, having undergone a Kelvin-Helmholtz contraction phase. Therefore, the enhancement factor (see Eq. 6) is milder. Moreover, the slope of the UV continuum for the restframe fluxes of SMDSs formed via DM capture is steeper, as noted in our discussion of Fig. 2. This, in turn, will lead to a faster decrease with wavelength of their redshifted fluxes, as one can see from comparing the left and right panels of Fig. 4.
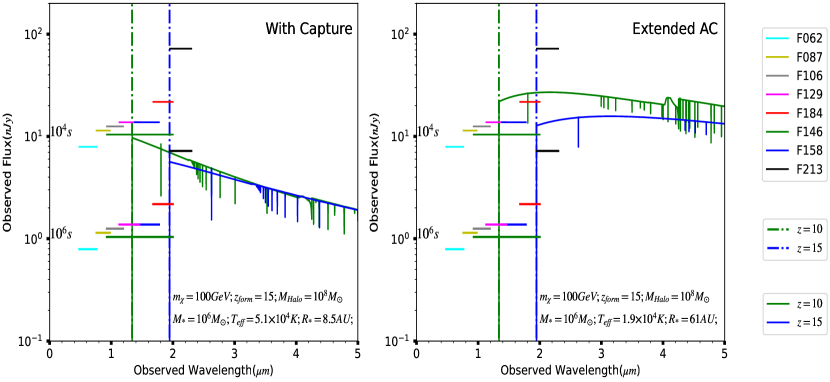
Unlensed SMDSs formed via extended AC could be observed if emitting at (green line in right panel of Fig. 4) even with s exposure time with RST in the following bands: F129, F146, F184, F158, F184. For the same objects, a greater exposure time is needed for observation in the F213 band, as the detector loses sensitivity in that higher wavelength filter. On the other hand, SMDSs of the same mass formed via DM capture (left panel of Fig. 4) require an exposure time longer than s (varying in the range depending on the band) in order to be detected at the level of S/N=5.
One common feature between all spectra presented in Fig. 4 is the sharp cutoff of the flux at wavelengths shortward of the redshfited Ly- line, which, in turn, will allow for the use of the photometric dropout detection technique for SMDSs or high redshift galaxies. Photons emitted from distant sources can be efficiently absorbed by the neutral H in the intergalactic medium (IGM). For sources at redshifts this effect is minimal, since it is roughly around that redshift that the universe has become fully reionized. In contrast, for more distant objects () redshifted photons that reach a cold gas cloud with neutral H along the line of sight will get absorbed very efficiently if their redshifted wavelengths as they reach the neutral H have a value of 1216Åor, equivalently, (the Ly- line). As a result, for any object emitting from , the observed fluxes shortward of the redshifted Ly- line, i.e. for Å, are highly suppressed.111111This is the so called Gunn-Peterson trough (Gunn & Peterson, 1965), and it was observed for a large number of quasars since 2001 (Becker et al., 2001). Depending on the model assumed for reionization, the effect of the absorption of Ly- photons by neutral H in the intergalactic medium (IGM) will be slightly different. However, for quasars emitting at observations show that most of the flux shortward of the redshifted Ly- line is completely absorbed. In turn, this implies that the redshifted SEDs of SMDSs are cut off to the left of the horizontal lines plotted in Fig. 4. In summary, the SMDSs formed via AC will appear brighter in all bands covered by RST, when compared to SMDSs of the same mass formed via DM capture. Unlensed SMDSs at , of formed via AC can be detected at the level of S/N=5 with s of exposure time in RST.
4.2 Photometric dropout criteria for Roman Space Telescope
In this subsection we turn the information regarding the redshifted fluxes of SMDSs into dropout criteria of their potential observation with RST. For luminous objects at photometry alone, i.e. color magnitudes in various bands, is sufficient to give a rough estimate of the emission redshift via the so called “dropout technique” pioneered by Steidel et al. (1996). This photometric redshift determination method requires a 5-sigma detection of an object in one band but a non-detection in a adjacent band of lower wavelength. The absence of emission in the latter bands is assumed to occur due to Ly absorption by hydrogen clouds in between the source and us, allowing for an approximate estimate of the redshift of the object. More specifically we take as our dropout criterion
| (7) |
where is the difference in apparent magnitude between adjacent bands of observation.
For instance, for the SMDS at and formed via the extended AC mechanism considered in the right panel (green line) of Fig. 4, there will be a sharp increase in magnitudes (decrease in flux) as observed in any filter with central wavelength shorter than . This, in turn, will lead to the SMDSs at appearing as J band dropouts.
The “dropout technique” has been applied extensively to J and H band observations of the Hubble Ultra Deep Field (HUDF). For example, Bouwens et al. (2011) used it to detect the first galaxy at as a ”J-band dropout.” This object was observed in the 1.60 (H-band) but was not seen in the 1.15 (Y -band) or 1.25 (J- band). Since then this technique has been used successfully to identify many high redshift luminous objects. For instance, the pre-JWST record holder as the most dinstant galaxy candidate was HD1, at a whopping , i.e. only 300 Myrs after the Big Bang. This object (HD1) has been recently identified as a H band dropout by Harikane et al. (2022). JWST data already broke this record multiple times (e.g. Castellano et al., 2022; Naidu et al., 2022a; Robertson et al., 2023; Donnan et al., 2023; Naidu et al., 2022b), and all those new candidates for the title of “most distant galaxy ever observed” were first detected as photometric dropouts. It is worth emphasising that spectroscopy is the only available tool to confirm such high candidates.121212The current record holder for the most distant spectroscopically confirmed Lyman break object is JADES-GS-z13-0 (Curtis-Lake et al., 2023), an object also consistent with a SMDS interpretation, as we have shown in Ilie et al. (2023) If confirmed as galaxies those objects could pose challenges to our current standard models of the formation of the first stars and galaxies, as they imply a much faster star formation rate and growth of galaxies in the cosmic dawn era than any of the available numerical simulations predict.
.
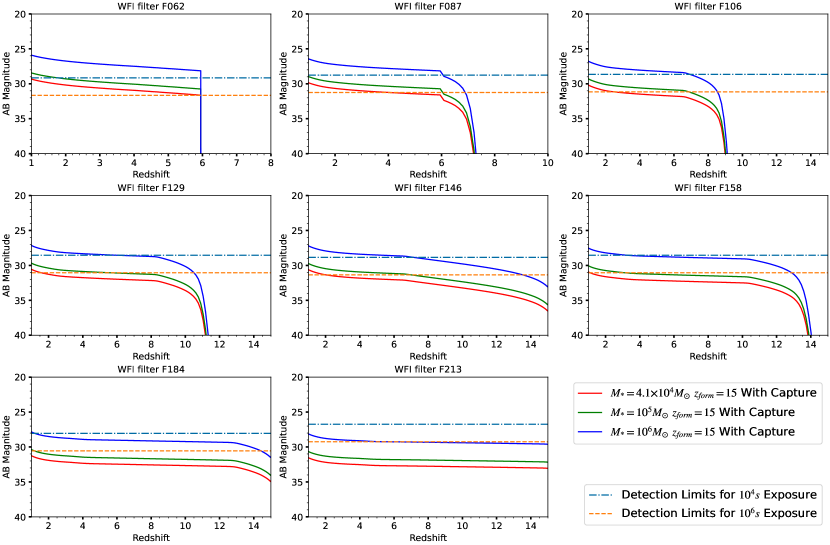
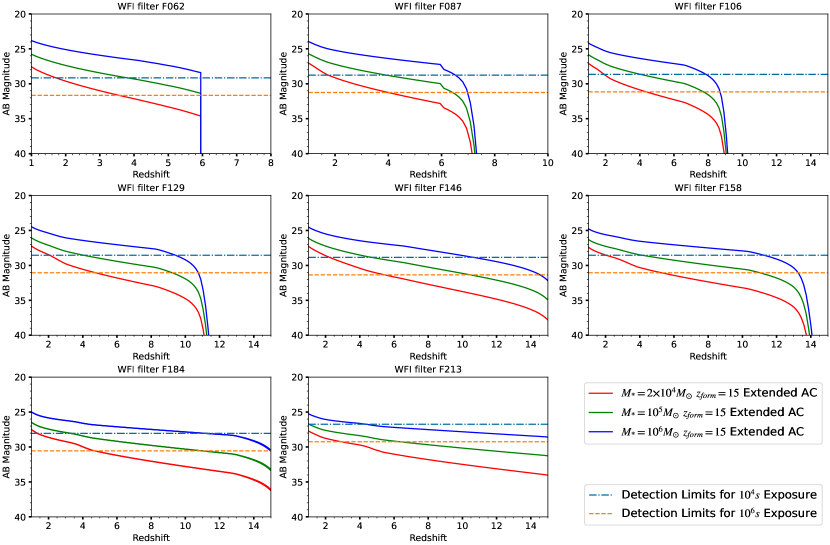
In Fig. 5 and 6 we plot the predicted AB magnitudes in different Roman WFI filters as a function of the emission redshift for SMDSs of three various masses: , , and . Those stars are powered by annihilations of WIMPs and are assumed to have formed via either the Extended AC (Fig. 6) or the DM capture mechanism (Fig. 5). The apparent AB magnitude () in any band (filter) is calculated by the following prescription (Oke & Gunn, 1983):
| (8) |
where is the throughput curve of the filter considered131313We used values obtained from the following website: https://roman.gsfc.nasa.gov/science/Roman_Reference_Information.html. Here, the effective area is equivalent to the throughput curve in calculating the magnitude. and is the redshifted flux density, obtained via Eq. 6. By comparing Figs. 5 and 6 we find, just as we did in Fig. 4, that at the same mass a SMDS formed via the extended AC mechanism has a larger observed flux, and therefore a smaller AB magnitude, rendering it easier to detect. This is mainly due to their larger radii, and therefore larger observed fluxes (see Eq.(6)). However, at around , for SMDSs of and below, their magnitudes fall below the S/N=5 detection limit even with of exposure. Therefore, for the case of unlensed SMDSs, in the subsequent sections we will limit our discussion to the case of a hypothetical SMDS.
A trend clearly seen in Figs. 5 and 6 is the increase of AB magnitudes with the redshift of emission . There are two reasons for this behavior. First, and foremost, the same object viewed from farther away will be dimmer. This very intuitive fact can be easily explained by increase of the luminosity distance with redshift, and therefore a larger suppression of the observed flux as per Eq. (6). Further the sharp increase in the AB magnitudes at redshifts corresponds to the Gunn-Peterson trough affecting different filters at different wavelengths. For instance for the WFI F106 filter, with a center wavelength of and covering the band will start to be affected by the Gunn-Peterson trough at and by the entire flux in the F106 band is completely suppressed by absorption due to neutral H along the line of sight. Those estimated values of the redshift where the F106 band would be affected by the Gunn-Peterson trough can be confirmed by looking at the third panel on the top row of either Fig. 5 or Fig. 6.
In the next three subsections we apply the dropout criterion in Eq.(7) to show that SMDSs at could be observed with RST as dropouts, whereas those at would appear as dropouts, and those at as (H/K) droputs.141414For the relation between the colors of JHKLM photometric system and other standard systems such as SAAO, CIT/CITIO, etc. the interested reader should consult Bessell & Brett (1988).
4.2.1 Detection of SMDSs with RST at as band dropouts
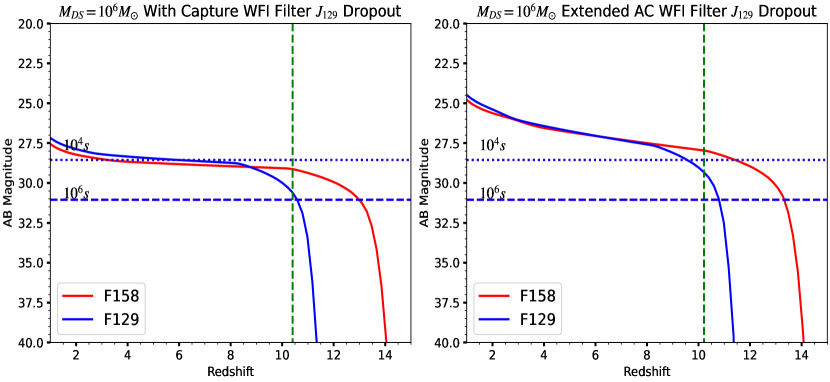
Here we show that SMDSs at can be found as -band dropouts in RST data. Fig. 7 illustrates this result, in the left panel for SDMSs formed via AC and in the right panel for those formed with capture. For the two filters F158 and F129, the figure shows the predicted SMDS magnitudes vs. redshift as solid lines, and the S/N=5 detection limits of RST assuming and s exposures. For a SMDS the difference in the magnitudes in the two bands will satisfy the dropout criterion at , independent of the formation mechanism, as marked by the vertical green dashed line that corresponds to the redshift where the magnitudes differ by 1.2. The Ly- absorption will completely cutoff the flux in the RST band at , which is slightly larger than the corresponding value () for JWST at band . This difference can be accounted for the fact that the Roman J-band filter () covers wavelengths up to whereas the corresponding JWST J-band filter () only covers wavelengths up to . In turn, this implies that J-band dropouts with RST have a slightly larger estimated photometric redshift than those detected with JWST. Of course, the actual redshift of any object can only be accurately determined via spectroscopy. We point out that for a SMDS formed via capture, an exposure time longer than s is necessary in order for them to show as band dropouts in RST. For the same mass SMDSs formed via extended AC even slightly lesser exposure times would suffice, as seen from contrasting the left and right panels of Fig. 7.
4.2.2 Detection of SMDSs with RST at as band dropouts
Objects of redshift higher than would show as photometric dropouts in filters of increasingly higher central wavelength. For instance an H-band dropout usually implies a photometric redshift of , a K-band dropout a photometric redshift of , and so on. In this subsection we demonstrate that SMDSs of mass at are bright enough to be detected as band dropout with the Roman Space Telescope by comparing its AB magnitudes as a function of redshift in the F158 (H band) and the F184 (H/K band) filters (see Fig. 8).
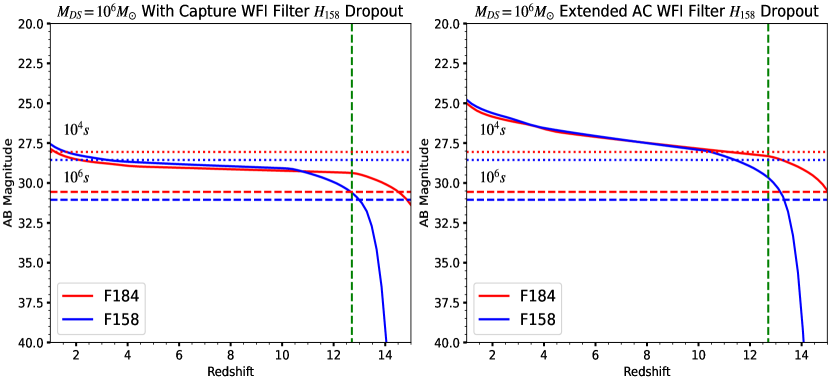
In both panels of Fig.8, the Ly- absorption by the IGM starts to take effect at for the (H/K) band and at for the . The dropout criterion is satisfied at , as shown by the green dashed vertical lines, and the Gunn-Peterson trough will completely suppress the flux in the band at . In both cases, one will need more than of total exposure time to capture this effect. In the following sections, we will consider SMDSs emitting at as our “canonical” case to contrast against other most likely possible luminous objects observable with RST at the same redshift (i.e. Pop III galaxies). Based on Figs. 7 and 8, we would expect complete cutoff of the SMDSs fluxes in F129 filter, and the image in F184 filter to be brighter than that in F158 band of the Roman Space Telescope.
4.2.3 Detection of SMDSs with RST at as (H/K) band dropouts
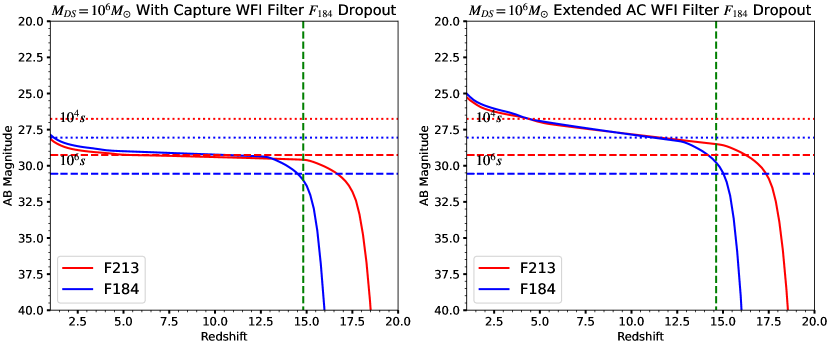
In this subsection we consider the possibility to detect SMDSs as photometric dropouts at . Specifically, we will demonstrate that SMDSs of mass are bright enough to be detected as F184 (H/K) band dropout () with the Roman Space Telescope. In Fig. 9 we are comparing the AB magnitudes of SMDSs formed via either mechanism (DM capture or Extended AC) as a function of redshift in the F184 (H/K band) and the F213 (K band) filters. For SMDSs formed via extended AC (right panel of Fig. 9), the dropout criterion is satisfied at (green dashed line) for s exposure times. For the case of the dimmer SMDSs formed via DM capture (left panel) longer exposure times would be needed in order to detect them at as dropouts. We point out that is the highest redshift SMDSs can be detected (even with “infinite” exposure time) as photometric dropouts (F184 H/K droputs) with RST. This is because RST lacks an L band, and, as such, no K band dropout is possible, i.e. no dropout detection at .
Having shown that SMDSs are bright enough to be observable as photometric dropouts with RST, at redshifts as high as , we move on next to a discussion of the objects that may look very similar to SMDS in RST and JWST data: early galaxies formed of regular, nuclear burning stars (i.e. Pop III and Pop II galaxies).
5 Population III/II Galaxies
Early galaxies containing many Population III or Population II stars are the competitors to SMDS in observations of high redshift data taken with RST or JWST. Indeed, according to simulations, large numbers of early galaxies are expected to be found at and may be hard to differentiate from SMDS. Before discussing the comparison between SMDS and galaxies in data, in this section we describe the relevant parameters and observable properties of Pop III and Pop II galaxies.
Whereas in the case of a SMDSs the flux is largely given by the SED of a single object, the supermassive dark star in question, the SEDs of galaxies are due to an interplay between the flux coming from all the stars inside the observed galaxy and nebular emissions, which are especially important for young galaxies that actively form stars. For the first type of galaxies those effects have been simulated by Zackrisson et al. (2011) using the Yggdrasil code. In this paper we use their model grids for the integrated spectra of first galaxies, available at https://www.astro.uu.se/~ez/yggdrasil/yggdrasil.html. The relevant input parameters and the possible choices are enumerated below:
-
1.
Initial mass function (IMF): The initial distribution of stellar mass population of Pop III stars for the single stellar populations (SSP) in Yggdrasil. There are three types IMFs we consider, following Zackrisson et al. (2011) and Ilie et al. (2012), corresponding to three types of Pop III galaxies: Pop III.1, Pop III.2 and Pop III Kroupa IMF. Pop III.1 galaxies have an extreme top heavy IMF151515 Top heavy refers to a stellar IMF that, at high mass end, has a less steep slope than the local Salpeter IMF (Salpeter, 1955); this implies a larger fraction of heavy stars than the “local” Salpeter distribution. For more detailed definitions one can see Davé (2008). and a Single Stellar Population (SSP) from Schaerer (2002). Speficically, for Pop III.1 galaxies, the simulation adopts a power-law IMF with a Salpeter slope () through the stellar mass range. Pop III.2 galaxies are characterized by a moderately top heavy IMF with a SSP from Tumlinson (2006); Raiter, A. et al. (2010). Specifically, we model Pop III.2 galaxies as having a log-normal IMF extending from to with a characteristic mass and dispersion . In view of recent simulations the mass of Pop III stars might be lower. Therefore we also include the case of the Kroupa (2001) IMF, usually describing Pop II/I galaxies. The stellar masses range in the and the SSP is a rescaled version of the one used in Schaerer (2002).
-
2.
Metallicity (): This index is used to describe the relative abundance of all elements heavier than helium. For reference, the metallicity of sun is . The characteristic value of represents typical Pop I galaxies while is average for Pop II galaxies. If one were to include intermediate cases, the following values are available in Yggdrasil model grids for the metallicity of galaxies: . Since our lowest redshift of interest lies around , previous works (e.g. Jaacks et al., 2018, 2019; Liu & Bromm, 2020) find via simulations that at such high redshift the metal enrichment process would not be sufficient to make the transition from Pop III to Pop II galaxies. The resulting estimation gives an upperbound of the mean metallicity: . This value is about an order of magnitude smaller than 0.02 , which corresponds to the transition to Pop II galaxies. Therefore, in order to be conservative, we will also include Pop II galaxies () in addition to Pop.III galaxies () in our comparisons.
-
3.
Gas covering factor (): This parameter determines the relative contribution of the nebular emissions to the integrated stellar SED. Depending on how compact the ionized hydrogen (HII) region is, the escape fraction () for ionizing radiation (Lyman continuum) from the galaxy into the IGM can vary anywhere from 0-1. Moreover the escape fraction is related to the gas covering factor via: . Hence we consider two extreme cases for the gas covering factor: (Type A galaxies; maximal nebular contribution and no escape of Lyman continuum photons), and (Type C galaxies; no nebular emission).
-
4.
Star formation history: Yggdrasil model grids include instantaneous burst and constant star formation rate (SFR) lasting for 10, 30, or 100 Myr. Following Ilie et al. (2012); Rydberg et al. (2015) we restrict our comparison to the instantaneous burst case, which produces a single age stellar population. However, that would imply a unrealistic SFR at , defined as the moment the galaxy forms. Therefore, we assume that all the stars are formed at Myr, as measured from the formation of the galaxy, the same as argued in Ilie et al. (2012); Rydberg et al. (2015).
For future reference we summarize in Tab. 2 the relevant parameters and the choices made that differentiate between the various Pop III or Pop II galaxies we considered in our comparison with supermassive dark stars.
| Object Name | Initial Mass Function | Gas Covering Factor | Star Formation History | ||
|---|---|---|---|---|---|
| Pop III.1 A | 0 | Extreme Top-heavy IMF | 1 | instantaneous-burst | |
| Pop III.2 A | 0 | Middle Top-heavy IMF | 1 | instantaneous-burst | |
| Pop III.Kroupa A | 0 | Kroupa IMF | 1 | instantaneous-burst | |
| Pop III.1 C | 0 | Extreme Top-heavy IMF | 0 | instantaneous-burst | |
| Pop III.2 C | 0 | Middle Top-heavy IMF | 0 | instantaneous-burst | |
| Pop III.Kroupa C | 0 | Kroupa IMF | 0 | instantaneous-burst | |
| Pop II.Kroupa A | Kroupa IMF | 1 | instantaneous-burst | ||
| Pop II.Kroupa C | Kroupa IMF | 0 | instantaneous-burst |
5.1 Appropriate Choice of which Early Galaxies to compare with SMDS.
In this section, we will imagine a object has been detected with RST as a photometric dropout, and we will investigate our ability to differentiate whether this object is an SMDS or an early galaxy, using photometry alone.
In previous work on differentiating galaxies vs. SMDSs in JWST, we (two of us) fixed the stellar masses () of all Pop II/III galaxies to be equal to the mass of the particular SMDSs considered (Ilie et al., 2012). However, for objects detected with RST as photometric dropouts, if a spectral analysis is not available, the mass and nature of the object in question would still be uncertain. The only available observables, in this scenario, would be the AB magnitudes for this object in the various bands it is detected, and, if resolved, an estimation of its effective radius.
Hence we address the question: Would it be possible, using only photometry, signal to noise ratios, and image morphology, to differentiate between a SMDSs and a Pop III/II galaxy as potential candidates for this object? Our approach is to compare SDMSs and Pop III/II galaxies with same absolute magnitude in the band as the SMDSs we compare them against. The reason we chose this band is that it is bridging the gap between the and the band, which invovle the only three RST filters in which the flux is not completely absorbed by neutral hydrogen in the IGM, for objects emitting at . Moreover, for objects at , which are our primary targets in this paper, the band is not affected by any emission or absorption features in the spectra of galaxies or SMDSs, respectively (See Fig. 11). Lastly, for a photometric detection, the object would typically be brightest (have lowest AB magnitude) in the filter.
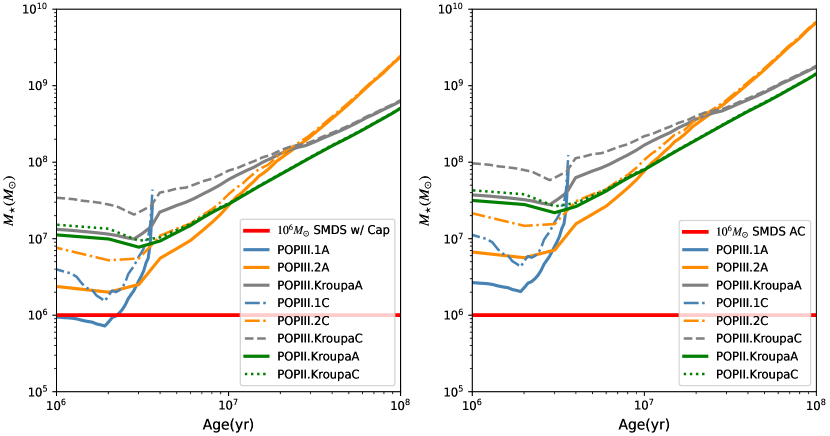
In Fig. 10 we plot the corresponding stellar mass we found for each of the Pop III/II galaxies considered in such a way that their AB magnitudes in the band match those of a SMDSs formed via AC (right panel) or via DM capture (left panel), assuming for all objects. In order to find the stellar mass () for each galaxy we assumed, following Zackrisson et al. (2011), that the total brightness of the galaxy is proportional to the stellar mass . This is a valid assumption for purely stellar spectra, i.e. for type C galaxies that have a gas covering factor . For galaxies with non-zero gas covering factor the assumption holds, as long as the stellar mass of the galaxy is not much greater than , when the nebular emission can start to have a slightly mass dependent contribution to the spectrum. For the Pop III/II galaxies we compare against SMDSs we find that this approximation is warranted, as can be seen from Fig. 10, where even the most massive galaxy considered is below .
As expected, for galaxies older than Myrs, their stellar mass required in order to match the observed flux of a SMDS monotonically increases with time, as can be seen in Fig. 10. This is due to the fact that by Myrs after the initial instantaneous burst, most of the stars more massive than have exhausted their fuel and exploded as supernovae or collapsed to black holes. This, in turn, leads to sharp dimming of any of the galaxies considered of fixed mass after roughly Myrs. This dimming continues as the galaxies grow older and even the least massive stars in each of them die. Since we are requiring a constant flux (AB magnitude) in the band, as per our comparison criterion with SMDSs, this dimming of a galaxy of constant mass will be compensated by an increase in the stellar mass of the galaxy, as seen in the trends of the lines representing our sample Pop III/II galaxies in Fig. 10. Note that the blue lines (for Pop III.1 galaxies) in Fig. 10 stop abruptly after Myrs. This is not a numerical artifact. Instead, it represents the fact that those extremely top heavy IMF galaxies cease to emit any significant amount of light once the afterglow of the almost simultaneous SN explosions dissipates.
An important takeaway of Fig. 10 is that, at the same mass, a SMDS is typically much brighter than a galaxy. For this reason SMDSs are a natural solution to the problem posed for the standard cosmological model of CDM by the JWST data, in terms of too much stellar light coming from high redshift sources, if those are interpreted as giant early galaxies.
To reiterate, we will compare SMDSs to sets of early galaxies, defined as “young” ( 1 Myr) and “older” (3.6 Myrs for Pop III.1 galaxies and 100 Myr for Pop III.2 or Pop III.Kroupa galaxies). We compare SMDS and galaxies that have the same observable magnitude (in the F184 band) and the same redshift.
6 Signatures of unlensed SMDS vs. the first galaxies with RST
In the remainder of this paper we present a detailed comparison of the properties of Supermassive Dark Stars vs. those of Population III/II galaxies, assuming both types of objects could be observed with the upcoming Roman Space Telescope as photometric dropouts at . We have shown this to be the case for SMDSs in Secs. 4.2.1-4.2.3. For Pop III galaxies see, for instance, Vikaeus et al. (2022), who demonstrate that Pop III galaxies can be photometrically detected even in blind surveys with RST, JWST,161616For a JWST specific analysis of the observability of Pop III galaxies see, for example, Zackrisson et al. (2011); Pawlik et al. (2011); Pacucci et al. (2015), among others. and Euclid. Here we perform an analysis regarding the possibility to disambiguate between those two classes of objects, if observed with the RST. In order to do so we use spectral analysis (spectroscopy), color magnitudes analysis (photometry), and image morphology (point source/extended objects). In Sec 6.1 we discuss the potential to use spectroscopy to tell apart SDMSs from Pop III or Pop II galaxies. In Sec. 6.3 we present simulated images of SMDSs vs Pop III galaxies in various RST filters. The potential to disambiguate between Pop III galaxies and SMDSs via photometry alone is discussed in Sec. 6.2 (AB magnitudes in various RST bands) and Sec. 6.4 (color-color plots technique). The effects of gravitational lensing are discussed in Sec. 7.
6.1 Spectroscopy to Differentiate SMDS vs. Early Galaxies:
In this subsection we investigate the possiblity to differentiate SMDS vs. early galaxies based on their spectra. We will first investigate the difference between SMDS and early galaxy spectra for young (1 Myrs old) Pop III/II galaxy candidates (see Fig. 11) and then turn to the same study for the oldest possible galaxies (see Fig. 12); in both cases the galaxies are assumed to have the same AB magnitude in the band as SDMSs counterparts. For “older” galaxies, the spectra is computed at an age of Myrs (measured since the formation of the galaxy), with the exception of the extreme top heavy Pop III.1 galaxies, which burn through their stars in Myrs, leading to an abrupt end of their evolutionary stage (see Fig. 10). All cases have been chosen such that they could be discovered as -band dropouts.
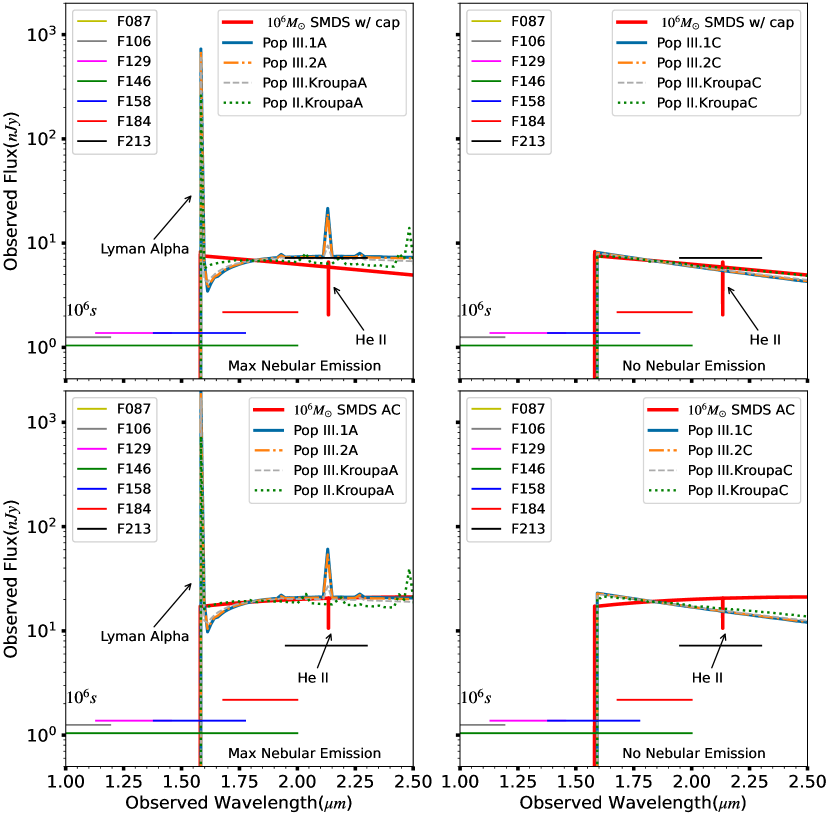
We begin with a study of comparison between young galaxies vs. SMDSs. In Fig. 11 we compare the redshifted spectra of SMDSs formed via the DM capture mechanism (top two panels) or those formed via the extended AC mechanism (lower two panels) to the SEDs of all the young (1 Myrs old) Pop III/II starburst galaxy candidates considered. An emission redshift of is assumed, however results and conclusions from this plot will not change significantly even if we took any other emission redshift in our interval of interest: . The most striking finding is that the spectra of young Type C galaxies (no nebular emission) is essentially identical to that of SMDSs formed via the DM capture mechanism, as one can see from the top right panel of Fig. 11. The only difference is the absorption feature at , present only for SMDSs. This feature corresponds to a He II absorption line, at a restframe wavelength of , i.e. the He II line. However, as shown in Vikaeus et al. (2022), the He II emission/absorption lines are unlikely to be detected in blind surveys, and dedicated spectroscopic followups are necessary. Therefore, in photometric surveys SMDSs formed via DM capture can masquerade for young Pop III/II galaxies with little to no nebular emission. In the lower right panel of Fig. 11 we compare redshifted SEDs for Type C Pop III/II galaxies to those of SMDSs formed via extended AC. In this case SEDs can be differentiated, in principle, based on their distinct slopes of the continuum. The SEDs of young Type A galaxies (maximum nebular emission) are different from those of SMDSs, formed via either formation mechanism, as can be seen from the left two panels of Fig. 11. The absence of any emission lines for the SEDs of SMDSs is in stark contrast to the two prominent emission features of the type A galaxies at and . Those two correspond to restframe wavelengths of (the Ly- line) and (the He II 1640 line). The strength of the Ly- line leads to a higher integrated flux in the F158 band for the galaxies, when contrasted to the SMDSs.171717This will be seen explicitly in Figs. 15 and 16. We have also considered the possibility that SMDSs and young Pop III/II galaxies have the same AB magnitude in the F158 band, instead of our choice F184, which was explained in our discussion of Fig. 10. In this case the galaxies will look much dimmer than SMDSs in all the other bands, since their flux in the F158 band is primarily driven by the prominent Ly- line, which is absent from purely stellar SMDSs spectra. For this reason, in what follows, our criterion when selecting galaxies to contrast against SMDSs is to require the same integrated flux in the F184 band. In conclusion, young Type C Pop II/III galaxies without nebular emission (upper right panel) cannot be differentiated from SMDSs on the basis of their spectra; in all other cases the young galaxies can in fact be differentiated from SMDSs.
In Fig. 12 we contrast the SEDs of SMDSs to those of older Pop III/II galaxies. For all, except the Pop III.1 galaxies we chose their age to be 100 Myrs. Pop III.1 galaxies have a top heavy IMF, and, as we mentioned in our discussion of Fig. 10, all their stars go dim when the galaxy is roughly 3.5 Myrs old, which is the age we assumed for those type galaxies (Pop III.1) in Fig. 12. Note how the spectra of all 100 Myrs old galaxies considered contain no distinctive features at the wavelengths of interest. On the other hand, the Pop III.1A galaxies (age 3.5 Myrs) are distinctive due to the strong Ly- nebular emission line, which should be easily detectable with spectroscopy and also drives up the integrated flux in the F158 to become higher than the corresponding one for the SMDSs.
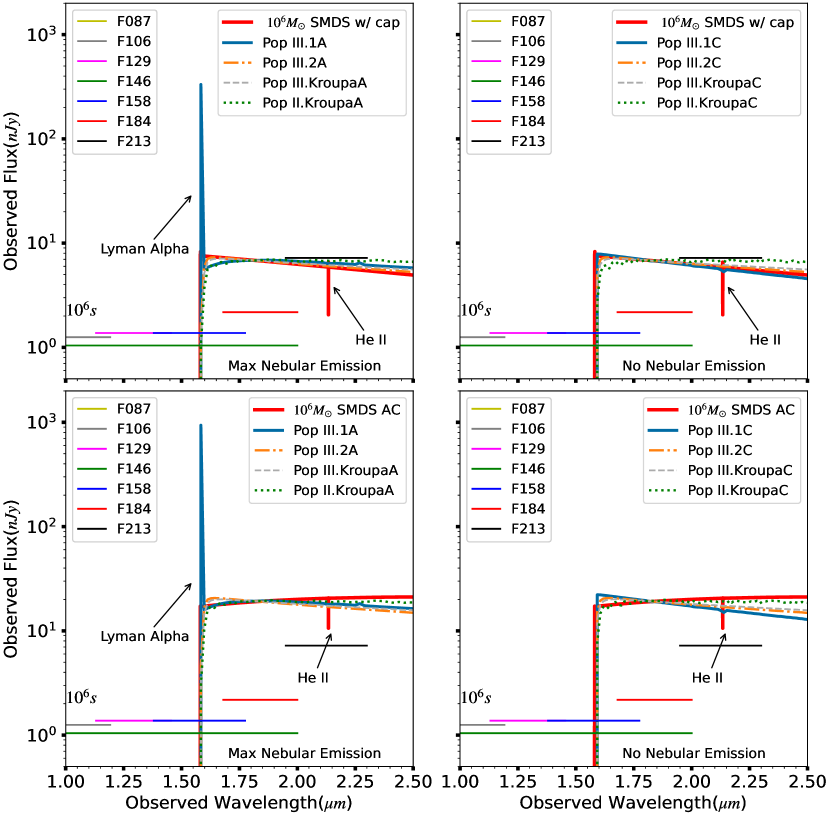
The main take away from Fig. 12 is that old (100 Myr) Pop III/II galaxies are great SMDSs chameleons. The SEDs of SMDSs formed via DM capture (top row of Fig 12) is nearly identical, up to the He II 1640 absorption line, to the SEDs of all 100 Myrs old galaxies considered (i.e. Pop III.2 A/C, Pop III.Kroupa A/C,Pop II.Kroupa A/C). When contrasting SEDs of SMDSs formed via adiabatic contraction to those of old (100 Myrs) Pop III/II galaxies (lower row of Fig. 12) we find that the spectra Pop II.Kroupa galaxies (dotted green lines) are essentially identical with those of SMDSs formed via AC. Yes, the later exhibit a He II absorption line, as long as they are more massive than (see lower right panel of Fig. 2). In principle one can detect this line with dedicated spectroscopic studies. However, for objects at z10.7, the line is outside of the wavelength range probed by RST and would require followup studies (e.g. with JWST).
We end the discussion of Figs. 11 and 12 by pointing out that the hottest SMDSs ( K, typically reached by SDMSs formed via DM capture) could actually have significant nebular emission, as shown by Zackrisson (2011). This would further complicate the prospects of disambiguation between SMDSs and the first galaxies based on their SEDs. Moreover, such objects (SMDSs surrounded by an ionization bounded nebula) could, in principle, be resolved as compact extended objects. We leave the detailed investigation of the possible role of nebular emission from the hottest dark stars on their detectable signatures for a future study.
In this subsection we have investigated the ability to distinguish SMDSs and early galaxies on the basis of their spectra. There is one clear signature of an SMDS in the spectra: if a HeII 1640 (i.e. restframe wavelenght ) absorption line is seen, then the object is a Dark Star and not a galaxy. However, the He II emission/absorption lines are unlikely to be detected in blind surveys, and dedicated spectroscopic followups will be necessary. The Grism spectrometer that will be part of the Wide Field instrument onboard RST is only sensitive to wavelengths as high as . Note that at the only significant spectral feature within the range of the RST Grism is the possible Ly- nebular emission of galaxies (see Figs. 11 and 12). Thus, until followup spectroscopic data is available (possibly from JWST, which is sensitive to much higher wavelengths), it will be impossible to differentiate SMDS vs old Pop III/II galaxies (or those with little nebular emission) on the basis of their spectra with RST. In the remainder of the paper we investigate how one could differentiate between SMDSs and Pop III/II galaxy candidates in the absence of spectroscopic data.
6.2 Photometry Alone cannot Differentiate unlensed SMDSs vs. Early Galaxies in RST:
Early data are likely to be photometric in nature, with detailed spectra only obtained later. Hence in this section we examine the capability to differentiate SMDS vs early galaxies in photometric data. We convert the information included in the direct spectroscopic comparison of the SEDs of SMDSs and Pop III/II galaxies (discussed in Sec. 6.1) in a comparison in terms of photometry with RST. We start with Fig. 13, where we plot the calculated AB magnitudes (left vertical axes) and average fluxes (right vertical axes) of SMDSs and young Pop III/II galaxies. This figure is the photometric representation of Fig. 11, meaning all the parameters are the same as in Fig. 11. Specifically, in order to get we convolved, according to Eq. 8, the redshifted SEDs with the RST throughput curves for each of the following bands: J129, H158, F184, and K213. In order to estimate the uncertainties in we used Pandeia to obtain the SNR for each object, assuming s exposures. The same conclusion we drew from Fig. 11, in terms of spectra, can be easily justified in terms of photometry from Fig. 13. Specifically, SMDSs formed via DM capture will have almost identical photometric signatures when compared with Pop III/II galaxies without nebular emission (top right panel of Fig. 13). Moreover, now we find that in terms of photometry even the SMDSs formed via AC are very similar with Pop III/II galaxies without nebular emission (lower right panel of Fig. 13).
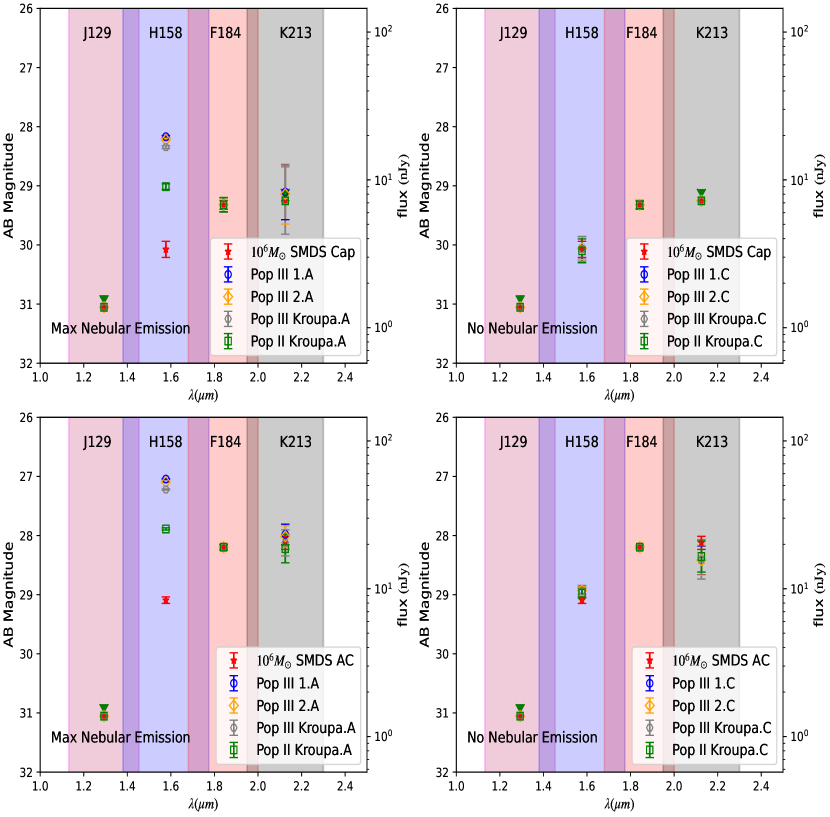
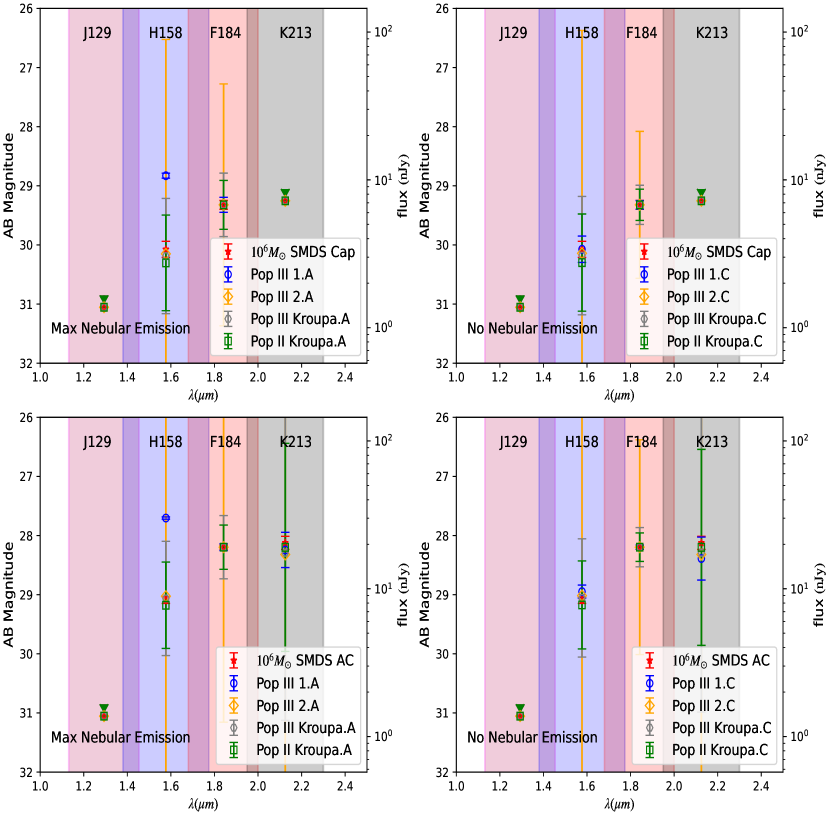
In Fig. 14 we repeat the same analysis done in Fig. 13, considering now old galaxies instead. From the left two panels we can conclude that SMDSs formed via either formation mechanism will have colors (AB magnitudes) that are indiscernible from old Pop III/II galaxies without nebular emission. And, in fact, most old galaxies should be expected to have little to no nebular emission. The only exception to this are “old” Pop III 1. galaxies, that, just before the end of their evolutionary tracks at Myrs, can still exhibit quite a lot of nebular emission. This can be explicitly seen in the comparison of left to right panels, where the only galaxies that have different colors in the left (Type A, i.e. maximal nebular emission) to the right (Type C, i.e. no nebular emission) are Pop III 1 galaxies, i.e. those with the most extreme top heavy IMF. Form them, the strong Ly- nebular emission drives the averages fluxes up in the H158 band (assuming, as we did here ).
To sum up: We find there is a clear difference between SMDSs formed via either formation mechanism vs. Type A young galaxies based on their vastly different colors in the H158 band (see left panels Fig. 13), but not vs. Type C young galaxies. Comparing SMDSs with old (100 Myrs old) galaxies, we find that there is no way to tell them apart from Pop III/II galaxies, using RST photometry (Fig. 14). Since we don’t know ab initio what type of galaxy is actually in the sky, we have to conclude that SMDSs cannot be differentiated from all possible galaxies via photometry alone. Thus RST photometric data will not be sufficient to uniquely determine that a SMDS has been discovered.181818For lower mass SMDS see discussion in Sec. 7.2, where we show that color color plots can be useful in dissambiguating SMDSs formed via AC, if sufficiently lensed.
6.3 RST Image Simulations using Pandeia for unlensed SMDS vs. Early Galaxies: Morphology alone cannot distinguish in RST
In this section we we address the following question: is it possible, based on image morphology–i.e. distinguishing between point and extended objects–to tell apart unlensed SMDSs from their counterpart Pop III/II galaxies (those that have the same observed flux in the F184 RST band). We will assume objects are observed with RST as dropouts with a photometric redshift . We start this analysis by estimating the effective angular size of high redshift galaxies as a function of stellar mass (see Eq. 10). By comparing the effective size of galaxies to the size of a RST pixel we will soon show that unlensed galaxies will barely cover a few pixels. Thus, just as SMDSs, unlensed galaxies (counterparts to SMDSs) will appear unresolved, and as such, are indistinguishable based on image morphology alone, when observed with RST.
To reinforce this point, we will also present RST image simulations of unlensed SMDSs and Pop III/II galaxies obtained using the Pandeia exposure time calculator (ETC) developed at STScI (Pontoppidan et al., 2016). Among other things, Pandeia allows the user to simulate the effects of the point spread function (PSF) of different instruments onboard JWST or RST. As such, one can perform high-fidelity modeling of the image(s), as seen with JWST or RST, of any hypothetical source(s) for which the restframe SEDs are known. For our comparison of simulated images for unlensed SDMSs vs galaxies, as viewed in various RST bands, see Figs. 15 and 16.
As stated above, we begin by estimating the effective angular size of galaxies and contrast it against the size of an RST pixel. The main ingredient in this calculation is the effective radii () of those objects. The size of Pop III/II galaxies are largely uncertain (due to the lack of observational data) and somewhat model dependent. However JWST already offers a glimpse into the size of very luminous galaxies at high redshift. For instance, one of most distant objects found with JWST, Maisie’s galaxy, at , has an estimated half-light radius of pc (Finkelstein et al., 2022). This is in excellent agreement with what one expects from extrapolating results from lower redshift observed galaxies. For instance Fig. 15 of Kawamata et al. (2018) presents the redshift evolution of the average size of bright galaxies observed up to 2018, in the redshift range . Using their best fit function and extrapolating to we find, remarkably, a value of pc, a perfect match to Maisie’s galaxy size.
In what follows we will proceed to estimate the galactic stellar mass dependence of the angular size of high redshift galaxies. Recall that for galaxies with a stellar mass not much greater than , the luminosity is directly proportional to the stellar mass. Therefore, by using the size-luminosity relationship from observed data, we can also make an estimate of how the effective size scales with the galactic stellar mass: , where is the scaling coefficient. The mass-size relationship for lensed galaxies found with HST at high redshift () can be found in Fig 2 and Fig 3 of Bouwens et al. (2021). In what follows we take value of as the typical size of galaxies of stellar mass (infered from their figures) and a value of , as found by Bouwens et al. (2021). Thus:
| (9) |
Since the redshift range considered by Bouwens et al. (2021) (i.e.) does not cover our range of interest (), we expect the linear fit given by Bouwens et al. (2021) to be mildly over-predicting the size of galaxies at higher redshifts, since, at the same stellar mass, the higher redshift galaxies are typically more compact, according to simulations and recent JWST observations. For Maisie’s galaxy (Finkelstein et al., 2022), leading to a predicted pc, which is within the observed pc, albeit mildly over-predicted, as discussed. For the most massive galaxies we consider (i.e. ) we get, using Eq.9, an estimated size of kpc, which agrees very well with the recent results from JWST observations of galaxies (e.g. Naidu et al., 2022a; Finkelstein et al., 2022). This further validates our method of estimating for a given mass galaxy (Eq. 9). Knowing the effective radius of a galaxy allows us to compute its angular size via the following prescription :
| (10) |
For an of 0.6 kpc corresponds to . The size of the pixel for RST is . In view of this, even the most massive galaxies we consider () have an unlensed size that is below two pixels. However, inherent diffraction always spreads out light over neighbouring pixels, so even a point object (such as a SMDS) will end up covering an area of the detector that is a few pixels across (see top panels of Figs. 15 and 16.) Therefore, it will be difficult to distinguish SMDSs from Pop III galaxies based on morphology alone, unless the objects of interest are gravitationally lensed, which is a possibility we consider in Sec. 7.
Next we investigate, using the Pandeia engine (Pontoppidan et al., 2016), possible differences between SMDSs and Pop III/II galaxies based on image morphology and/or SNR values. Of course, based on the discussion above, we already know that for unlensed objects, the disambiguation based on image morphology between SDMSs and Pop III/II galaxies will be challenging. The full power of the Pandeia engine will become transparent when we study lensed objects (see Sec 7), however we use it here as well, as a warm-up exercise, and to confirm our expectations obtained in the paragraphs above. The relevant parameters used in our image simulations can be found in Appendix A. For simplicity, we only assume one object in each scene, although in real scenario one might expect other luminous sources in the adjacent field. Following previous sections, we still use the SMDSs and take of total exposure time, as fiducial values.
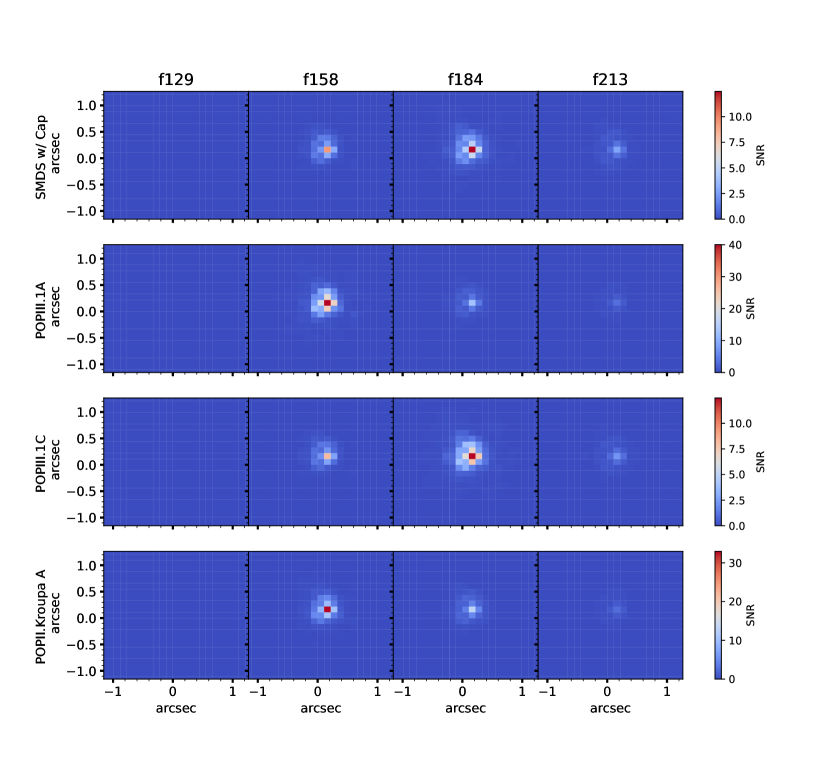
Simulated images of SMDS vs. young (1 Myr) galaxies for the case of no lensing: In Fig. 15 we present the simulated RST images of a SMDSs formed via capture (top row) vs. those of select young (1 Myrs) galaxies for the case of no lensing.191919We did not include the other two types of Pop III galaxies (Pop III.2 and Pop III.Kroupa), since their SEDs are essentially degenerate to those of the Pop III.1 galaxies we plot here (see Fig. 11). A similar plot for SMDSs formed via extended AC (top panels) can be found in Fig. 16. The angular diameter of the galaxies is given by Eq. 10, with the mass selected in such a way that the AB magnitude in the F184 band is the same for all objects considered. In order to be conservative, in our simulation galaxies are assigned a spherical shape, such that it would be harder to tell the difference between the extended objects and stellar object based on the image morphology alone. However, RST will be largely insensitive to the degree of symmetry of the object, at the redshifts of interest for us. At , even the galaxies have an effective size that barely covers a few pixels, which renders shape extraction impossible. From the simulation, we see that most of the flux received by the detector is concentrated in the central pixel of our target object. As predicted in the previous sections, we find that all of flux in the has been absorbed by the neutral H present in the IGM, leading to detection as photometric dropouts. In the F213 band, due to mostly to the decrease in the capability of the detector all objects appear extremely dim. The strong Ly- emission of young type A galaxies boost their fluxes in the F158 band (as can be seen from Fig. 11), which leads to an enhanced SNR in the same band (see second and fourth rows of Fig. 15). Note the almost perfect match between the simulated images for Pop III.1C galaxies and SMDSs formed via DM capture (see top and third from the top rows of Fig. 15), thus further demonstrating that SMDSs can pose as young Pop III type C galaxies (i.e. with little to no nebular emission). This is due primarily to their almost identical spectra (see top right panel of Fig. 11) and the fact that at those high redshifts, without gravitational lensing, even the most massive galaxies are not resolved by RST (see Fig. 19 for the effect of gravitational lensing).
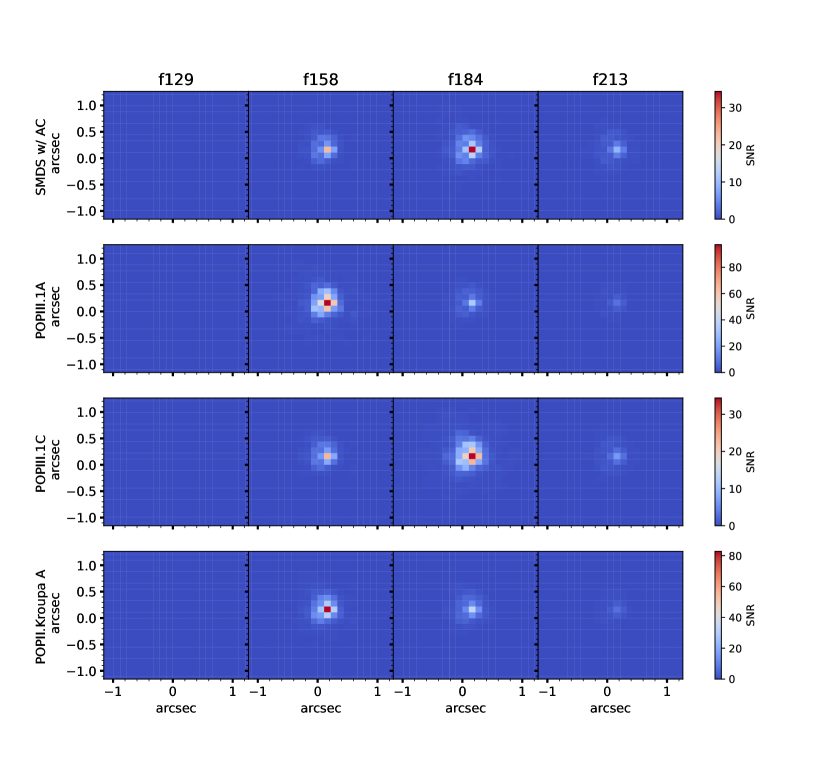
In Fig. 16 we compare the Pandeia simulated images of SMDSs formed via adiabatic contraction to those of young (1 Myrs) Pop III/II galaxies, selected following the same prescription followed for Fig 15, again for the case of no lensing. All objects are assumed to emit at . All type A young galaxies will have a much higher SNR in the F158 band, when compared to SMDSs with purely stellar spectra. This fact is due, again, to the strong Ly- nebular emission line present in the F158 filter at that redshift. Note that even if the slope of the UV continuum in the SEDs of SMDSs formed via AC and those of Type C galaxies is different (lower right panel of Fig. 11) RST will not be sensitive enough to detect this using photometry alone, as can be seen from comparing the top and third from the top rows of Fig. 16, and as we have explicitly seen in the lower right panel of Fig. 13. Therefore, young Pop III galaxies without significant nebular emission can also pose as SMDSs formed via the adiabatic contraction mechanism.
Image morphology of SMDS vs. older (3-100 Myr) galaxies for the case of no lensing: Here we discuss the image morphology of the older Pop III/II galaxies when contrasted to that of SMDSs, as they would be seen by RST. As explained in our discussion of Fig. 12, old (100 Myrs) galaxies no longer produce nebular emission, rendering the distinction between Type C and Type A irrelevant. Old Pop III/II galaxies have SEDs that are very similar to those of purely stellar SMDSs. However, the older a galaxy is, the more massive it has to be in order for it to match the brightness of a SMDSs of a fixed mass (see Fig. 10). Even for the most massive galaxies considered (), the effective area in RST is below the size of pixels, which renders them either impossible to resolve or with SNRs less than 5 in each pixel, if unlensed, as can be seen in Fig. 20
In summary, we find that unlensed SMDSs can be easily mistaken for unlensed Pop III.1C galaxies throughout their evolution. For the case of Pop III.1A (maximum nebular emission) galaxies, the strong Ly- line in the F158 band will be a telltale signature, even in photometry, that can set them apart from SMDSs with purely stellar spectra.
We end this section with the same cautionary note mentioned at the end of Sec. 5 regarding disambiguating between SDMSs and the first galaxies. As pointed out by Zackrisson (2011), the hottest SMDSs (those formed via DM capture) can have a detectable nebular emission contribution to their SEDs. This, in turn would lead them to appear as compact, but extended objects, with SEDs that are similar to those of type A galaxies. In a future publication we plan to analyse this possibility in detail. In this paper we restrict our attention to SMDSs with purely stellar spectra, which is the most likely scenario, as most of the baryons in the gas cloud have already been accreted by the SMDSs to reach a mass of .
In conclusion, for unlensed objects, morphology alone will not be enough to clearly identify an observed object as an SMDS vs. early galaxies in RST data. In other words, one cannot differentiate cleanly between an SMDS as a point object vs. galaxies as extended objects. Some types of early galaxies will look different from SMDSs. However, for any image in RST data that matches predictions for an SMDS, there is always some galaxy type that could produce a virtually indistinguishable image. We will address the effects of gravitational lensing on this question in Sec. 7.1.
6.4 Color-color index comparison for the case of no lensing
In this section we investigate the ability to differentiate unlensed SMDSs from Pop III/II galaxies using the color-color method, following Zackrisson et al. (2010); Ilie et al. (2012). In principle different objects could occupy different locations in a color/color plot, thereby allowing a way to identify the nature of the object in the data. As before, we focus on objects found as dropouts. Specifically, we will plot the color-color diagram in vs. for different objects, as those are the only three RST bands available for objects at . By the the Gunn-Peterson trough will cover the entire F158 band, and as such, for one can no longer use the color index method, as it requires detection in at least three photometric bands.
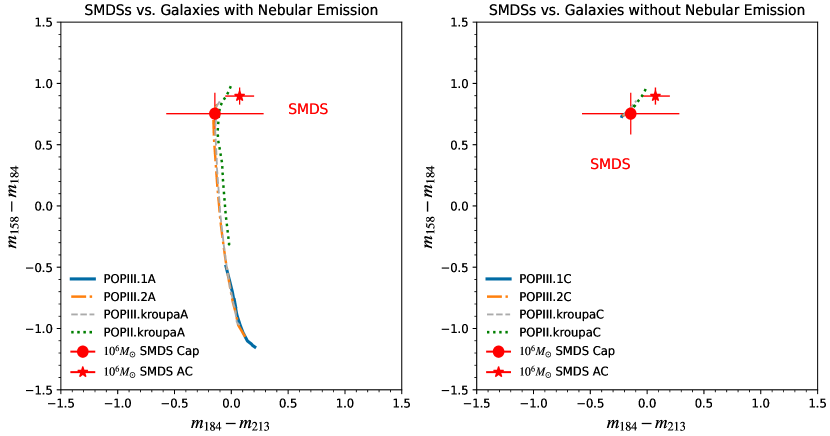
In Fig. 17 we present the color-color diagram for unlensed SMDSs 202020We don’t include here lower mass SMDSs since they are not detectable with RST without gravitational lensing, the effects of which are discussed in Sec. 7 (see Figs. 23 and 24). formed via DM capture (red circles) or adiabatic contraction (red stars). On the left/right panels we contrast the colors of SMDSs to those of unlensed Pop III/II galaxies with maximal/no nebular emission (Type A/C), as they evolve from young (1Myrs; lowest points along the evolutionary tracks) to “old” (100 Myrs; highest points along the tracks) galaxies. The error bars of the magnitude difference are calculated by the following formula:
| (11) |
where and represent the standard deviation of the magnitude in the neighboring filters, which is given by the inverse of the SNR value that correspond to the image simulation results calculated by Pandeia. Thus, the color magnitude for SMDS formed via Capture is and , and those for SMDS formed via AC are: and . Note that the colors of unlensed SMDSs are well within one standard deviation of the evolutionary tracks, for Pop III/II galaxies, with or without nebular emission.
Therefore it would be impossible to differentiate between unlensed SMDSs and most Pop III/II galaxies using the color-color plot alone; the inclusion of the error bars for the evolutionary lines of galaxies, which we omitted here for simplicity, would only strengthen this conclusion. The only exception is Pop III.1A (i.e. top heavy IMF with maximal nebular emission) galaxies (blue solid lines in the left panel of Fig. 17). Due to them becoming dim at an age of Myrs, their evolutionary tracks never reach the loci occupied in the color color plot by SMDSs. In the next section we will consider the effects of gravitational lensing on both image morphology and color index for the prospects of telling apart SMDSs from the first galaxies.
6.5 Conclusions for unlensed SMDSs in RST
Our studies in this Section have shown that, for unlensed objects, there is no way to prove we have found an SMDS in RST data. None of the techniques is good enough: Photometric SEDs, spectroscopy, morphology, and color-color plots are all unable to cleanly find an SMDS that doesn’t look like any of the possible galaxy competitors. Hence, once a candidate SMDS is found via one of these techniques, followup observations e.g. with JWST will be required. Observation of the He-1640 line would be a smoking gun for a Dark Star. However, for SMDSs at redshifts higher than z10.7, that line is outside the wavelength range of RST. JWST could see it.
7 Effects of Gravitational Lensing
Our discussion in Section 5 above only pertained to unlensed objects, both SMDS and early galaxies. Now we turn to the case where these objects are gravitationally lensed by foreground material. The method of strong lensing as a tool to find high redshift objects has been successfully applied and refined in recent years. The detectability of dark stars via lensing was first explored by Zackrisson et al. (2010), who found that a magnification factor is needed in order to observe dark stars (at ) with low masses with JWST. For the Roman Space Telescope we find (see Fig. 5 and 6) that unlensed SMDSs of mass smaller than are too faint to be detected even with exposure times of . Therefore, SMDSs of can only be detected if they are gravitationally lensed, as we will explicitly show in this section.
Lensing by massive foreground galactic clusters at (as described by Zitrin et al., 2009, for example) would lead to large magnification factors (). For example Coe et al. (2013); Lam et al. (2019) describe the discovery of high redshift candidate galaxies () through lensing. Perhaps one of the most striking examples of strong gravitational lensing is the recent discovery of the most distant star () ever observed: Earendel (Welch et al., 2022a, b). The light from the stellar object has been emitted when the universe was merely 900 million years old.212121This shatters the previous record held by Icarus, who’s light was emitted when the universe was 4.4 billion years old (Kelly et al., 2018). The lensing effect from the foreground cluster boosts the stellar flux by to times, providing a great example on how strong gravitational lensing allows the observation of very distant individual stars. Additionally, soon after JWST released its first images, the list of high redshift galaxy candidates has been growing almost on a weekly basis, with the record for the “most distant candidate galaxy” being broken multiple times (e.g. Castellano et al., 2022; Naidu et al., 2022a; Finkelstein et al., 2022; Donnan et al., 2023; Naidu et al., 2022b). If those objects are indeed at the redshifts indicated by photometry, then at least some of them must have been gravitationally lensed in order to have been observed. In a separate publication we plan to analyse if the available data from any of those candidates can be well fit by SMDSs SEDs. Recently we have shown that out of the four spectroscopically confirmed “galaxies” found by (Robertson et al., 2023; Curtis-Lake et al., 2023), the three most distant ones (specifically JADES-GS-z13-0, JADES-GS-z12-0, and JADES-GS-z11-0) are each consistent with a Supermassive Dark Star interpretation (Ilie et al., 2023).
In this section we discuss the effects of gravitational lensing on the prospects of telling apart SMDSs from the first galaxies using RST by using image morphology (Sec. 7.1) and color color indices (Sec 7.2). Below we remind the reader what are some reasonable amounts of lensing we expect based on a non-exhaustive list of previous observations. Besides the extreme case of Earandel, discussed above, we mention other examples of greatly lensed stars: Kaurov et al. (2019) finds a star with at low redshift ; Meena et al. (2023), one star with and one star with at high redshift . For galaxies: Hsiao et al. (2022) finds a triply lensed candidate, with combined ; Bradley et al. (2022) find galaxies lensed by ; Adams et al. (2023), one lensed by with .
7.1 Image Morphology
Gravitational lensing magnification would increase the apparent size of an object, but for nearly point sources (stars), this translates to the magnification in the flux density by a factor , called the magnification factor (for details see Schneider et al., 1992, for example). This factor is given by (e.g. Kilbinger, 2015, for a review):
| (12) |
where is determined by the mass field of the lens as a function of the position vector: , where , and refer to the angular distance to the lens, the source and their distance in between, respectively. is the shear factor that determines the distortion of the source object. In a strong-lensing survey out of the catalogue of 12 galaxy clusters from the MAssive Cluster Survey (MACS), 9 of them have a large area ()222222 is a notation for the unit . of high lensing magnification () for source objects at (Zitrin et al., 2011). Since our targeted redshift is , we find a simultaneous increase in and , thus a increase in the value of . Therefore, for the same relative position in the sky, a higher redshift corresponds to a higher , which means we have a even larger area for high lensing magnification. And since this area is much larger than the size our target sources (order of ),232323 is a notation for arcsecond2. it is possible for multiple Pop III galaxies and/or SMDSs to fit in this magnification area.
It is likely to observe multiple images or giant arcs from strong lensing (e.g. Welch et al., 2023) but given the relatively small size of galaxies at very high redshift, they might still appear as spatially unresolved (e.g. Coe et al., 2013; Lam et al., 2019). For simplification, and in order to be the most conservative, we assume a spherical shaped image and that throughout which means the magnification wouldn’t distort the shape of the object for each individual image (although this simplification is unlikely in practice as it requires homogeneous distribution of mass). The reason for this choice is that a distorted image would be a telltale sign of an extended object (galaxy), rather than a point object (SMDS with no nebular emission). As a result of lensing, the surface area is increased by a factor known as the convergence factor. Assuming a uniform convergence, as justified above, this factor simply becomes . Furthermore, we consider our sources to be close to the critical curve to a degree such that a high magnification factor () could be achieved without generating spatially resolved arc.
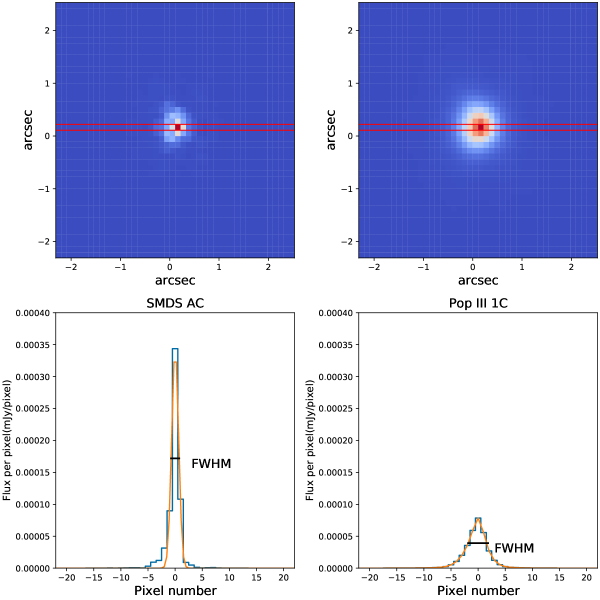
The main goal of this sub-section is to investigate how gravitational lensing could be used to tell apart first galaxies from supermassive dark stars, as observed with RST. The former are extended objects, with radii from ranging a few tens of parsecs to hundreds of parsecs while the later are puffy stars, with radii of the order of AU. As we have seen in Sec. 6.3, RST’s angular resolution is not sufficient to tell those two kind of apart conclusively, without gravitational lensing. For each galaxy considered we determined their magnified angular size by using the Pandeia simulator. Our procedure is exemplified in Fig. 18, where we extract the effective lensed sizes for two objects of interest magnified by : a SMDSs formed via adiabatic contraction (left panel) and a young (1 Myrs) Pop III.1C galaxy (right panel). Note how now the light from the galaxy covers a significantly larger area of the detector, indicating an extended object. In order to estimate the effective size of each object we use the standard Full Width Half Maximum (FWHM) histogram technique. Namely, we slice the images along a direction. In the figure this is represented by the red horizontal band that goes to the left and the right central pixel of each simulated image. The unit flux values in pixels along this band are then plotted as a histogram (blue lines in the bottom panels of Fig. 18). For SMDSs, as they are spherically symmetric stellar objects we apply the conventional Gaussian fit (e.g. Mighell, 2005). Conversely, for Pop III galaxies we simply interpolate the flux values at each pixel. The corresponding FWHM values are extracted and plotted as black lines in each of the bottom panels of Fig. 18. For instance, for the SMDSs we find that its effective size will be roughly and for the Pop III galaxy chosen here the estimated effective size is . For the band considered (F184) the angular resolution, according to the Rayleigh criterion (), where is the diameter of the telescope, leads to a minimum angular size of for an object to be resolved. Thus, the SMDSs, even if lensed, is still unresolved, whereas the Pop III.1C galaxy will show as an extended object. It is important to note here that the estimated effective size for all objects that remain unresolved is merely an upper bound of the actual size of the object.
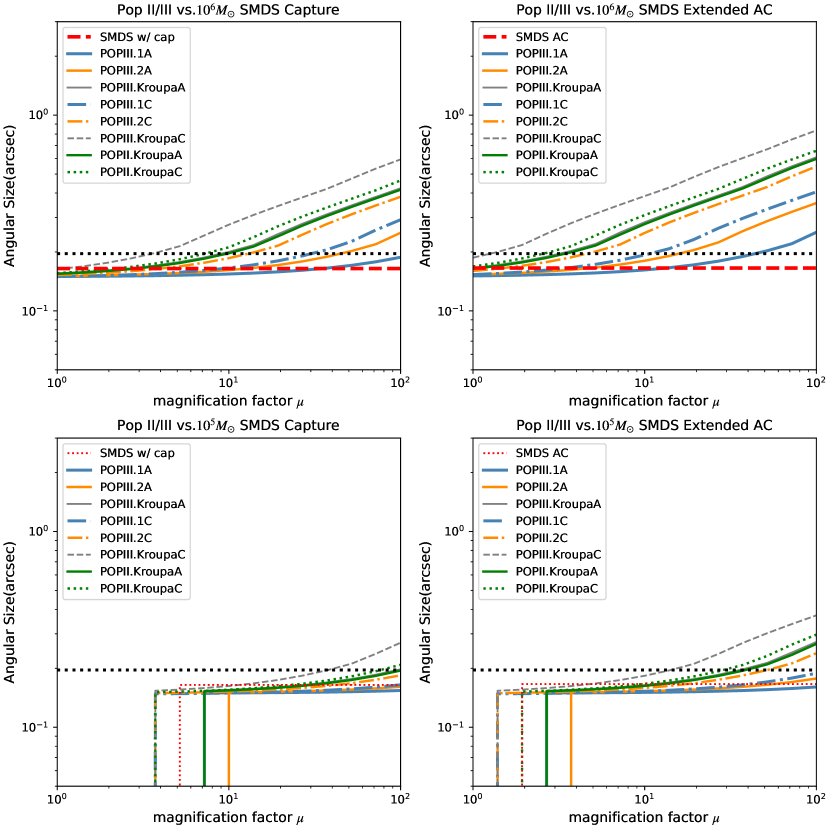
Using the procedure described above, in Fig. 19 we estimate the apparent sizes as a function of lensing magnification factor () for young (1 Myrs) Pop III/II galaxies (upward trending lines, as labeled) that match the integrated F184 flux of supermassive dark stars (top/bottom rows for SMDSs) formed via either formation mechanism (left/right columns correspond to DM capture/AC). In the lower panels the evolutionary lines break sharply downward, signifying that below the magnification where this break happens, the SNR in each pixel of the F184 band becomes lower the minimum SNR=5 value required for detection. In each of the four panels the black dashed horizontal line (labelled Rayleigh criterion) is the angular resolution of the RST in the band considered here (F184), estimated to be . Note that SMDSs at are unresolved even at . In fact, at a highly unrealistic would be required to resolve a SMDS with radius of A.U. Thus, for all intents and purposes SMDSs without nebular emission will remain point objects, even with extreme magnifications, and even with telescopes with much better angular resolution than RST. The galaxies considered will become resolved once becomes larger than a critical value that can be read off the plot at the intersection of the horizontal dotted line (labeled as Rayleigh criterion) and the upward trending curve corresponding to the galaxy in question. As expected, at an age of 1 Myrs, the Pop III.Kroupa Type C galaxies will be the easiest to resolve, in view of their large mass needed in order to match the flux of the SMDSs in the F184 band (See Fig. 10). In contrast, Pop III.1 Type A galaxies need the smallest stellar mass to match the flux of the SMDSs, and are more difficult to resolve. When contrasted against a SMDS formed via DM capture, a Pop III.1A galaxy will need to be magnified by at least in order to have an angular size barely above the resolution limit and, as such, somewhat distinguishable, based on image morphology from the SMDS. For the case of SMDSs formed via AC, the corresponding Pop III/II galaxies that match their F184 flux are easier to resolve, as it can be seen from contrasting the left and right panels of Fig. 19. This is due to the SMDS formed via AC having a larger redshifted I.R. flux (see Fig. 11) which is matched by larger, more massive galaxies, as one can see by comparing directly the left and right panels of Fig. 10. In the lower two panels of Fig. 19 we consider SMDSs formed via either mechanism. In this case, even at there are still many Pop III/II galactic counterparts that will not be resolved. Thus, for SMDSs with , differentiation from young ( 1 Myrs old) Pop III/II galactic sources based on image morphology is only possible at . However, as we will soon see, the color-color technique can be very useful in telling apart a , formed via AC, from Pop III/II galaxies (see Figs. 23and 24 )
The main takeaway of Fig. 19 is that at SMDSs will appear as point objects, independent of the magnification factor. In contrast, all young Pop III/II galactic counterparts of a SMDS formed via AC would be resolved by RST with thus making disambiguation possible based on image morphology whenever . For SMDSs formed via Capture, the same would be possible with a higher magnification factor of but at it will be hard to disambiguate them from young Pop III.1A galaxies. For lower mass SMDSs (), independent of formation mechanism, one needs to be able to use image morphology as a RST differentiating tool from young Pop III/II galaxies.
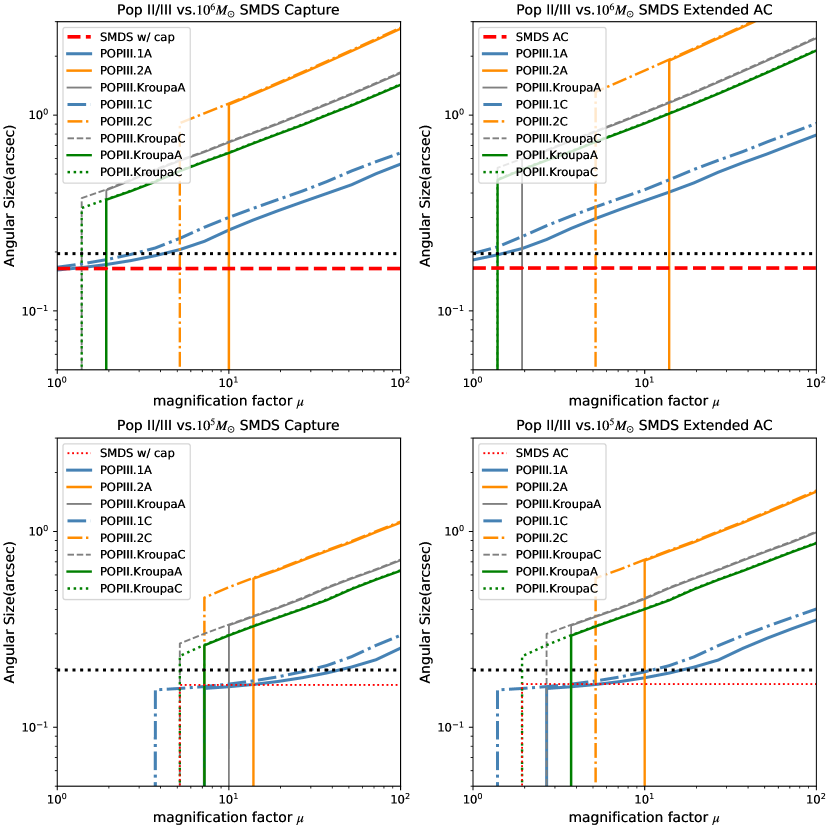
In Fig. 20 we repeat the same analysis done in Fig. 19, this time for older galaxies, with age of 100 Myrs.242424For the case of the top heavy IMF Pop III.1 galaxies, since most of their stars exhaust the nuclear fuel after Myrs, we select a time just shy of this value as their “old” age. The top two panels of Fig. 20 demonstrate that most old galaxies that match the flux of a SMDSs in the F184 band will be above the resolution limit as soon as they are detected at a level. The only exception is the Pop III.1 galaxies (blue lines), which, when contrasted against a SMDSs formed via DM capture (top left panel) can be detected as unresolved, as long as it is magnified by . With this in mind we conclude that old galaxies would be, in principle, differentiable from SMDSs based on image morphology. Regarding the SMDSs, all of their old Pop III/II galactic counterparts are large enough to be resolved at ranging from a few to a few tens. In particular, for the case of the SMDS formed via DM Capture (lower left panel of Fig. 20) by even the more compact Pop III.1A (blue solid line) galaxies are resolved. When contrasting SMDSs formed via extended AC (lower right panel) we note that at all Pop III/II galaxies will show as extended objects, in contrast to the SMDS. Thus, differentiation based on image morphology of a SMDS, formed via either mechanism, from Pop III/II old galaxies is possible with magnifications .
Since the age of an object detected with photometry cannot be estimated exactly, one should view our two extreme cases considered in Figs. 19 and 20 as the two limits in between which any observation would lie. Moreover, we point out that the size of the galaxies or other lensed objects will depend on the assumed lensing model and is usually associated with a large error bar, as shown for example in Fig. 8 of Lam et al. (2019). Thus one should be careful in using the Rayleigh criterion as a disambiguation between galaxies (extended objects) and SMDSs with purely stellar spectra (point objects), especially whenever the objects are barely resolved.
In summary, in this section we have demonstrated that, with sufficient magnification (), a SMDS formed via AC can be differentiated via image morphology from all Pop III/II galaxies considered. The galaxies would all appear as extended objects whereas the SMDSs are still unresolved, even for (see top right panels of Figs. 19 and 20). In contrast, for all , image morphology cannot be used to conclusively differentiate between galaxies and SMDS (lower panel of Figs. 19) or between galaxies and a SMDS formed via DM Capture (top left panel of Fig. 19). In the next section we will explore if lensed SMDSs can be differentiated from Pop III/II galaxies based on their locations in color-color diagrams.
7.2 SNR Ratio and Color-color Diagram
In this subsection we discuss the effects of gravitational lensing on the prospect of detecting smaller mass SMDSs and the possibility to use color-color diagrams to differentiate those SMDSs from Pop III/II galaxies. We begin our analysis by asking the following question: what is the required magnification factor needed for a SMDS of a given mass in order to be detectable with RST at the level of SNR=5? In order to answer this question we plot in Fig. 21 the values of the SNR in the F184 band as a function of magnification () for SMDS of various masses (as labeled) formed either via DM capture (left panel) or adiabatic contraction (right panel). The SNR values are estimated using Pandia and are selected from the pixel where most of the the photons from the SMDS will generate a signal, in a hypothetical s exposure. We noted before that at the same mass SMDSs formed via AC look brighter that their counterparts formed via DM capture, which can also be seen in the slightly larger SNR values on the curves in the right panel (SMDS AC) of Fig. 21. The main takeaway of Fig. 21 is that magnification factors of are sufficient to lead to SMDSs of (formed via either mechanism) to be detectable with s exposures by RST.
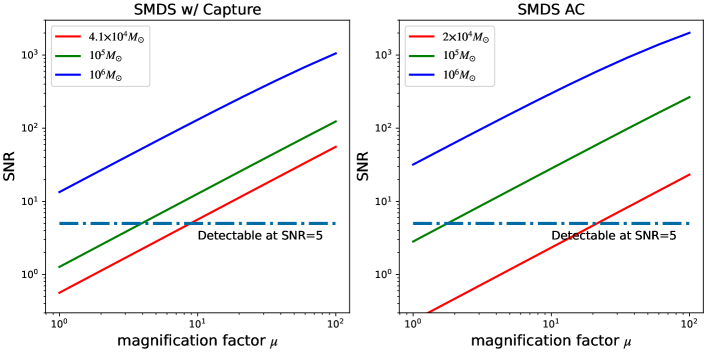
In Fig. 22 we repeat the same exercise done in Fig. 21, but this time we consider Dark Stars of lower masses, i.e. with . We assume , and a heat source from 100 GeV WIMPs powering the DSs. The properties of DS models used here (such as and ) are taken from Table 2 of Spolyar et al. (2009). In the left panel of Fig 22 we show the SNR values in the F184 RST band, whereas the right panel depicts the SNR values in the F213 RST band. In both cases an exposure time of s is assumed. The weakened sensitivity in the F213 filter leads to higher values required for a detection at the same SNR level. Further, we can comment on the difference between the cases of SMDS formed by AC (the 479 and 716 SMDSs shown in the figure) vs. the DS formed via capture (the 756 and 787 DSs shown in the figure). SMDSs formed via capture are hotter, leading to a peak in the SED is at shorter wavelengths. Thus, in the two filters considered here, the 479 and 756 DSs (formed via capture) are somewhat dimmer and require more magnification (a larger ) than the 716 and 787 DSs formed via AC.
The main takeaway of Fig. 22 is that Dark Stars as distant as , with masses as low as can be observed with RST, if magnified by of a few hundreds or more. This is consistent with the findings of Zackrisson et al. (2010), who shows that for DS at , with masses as low as can be detected at the SNR=5 level in JWST, assuming exposure times of 100 hours.
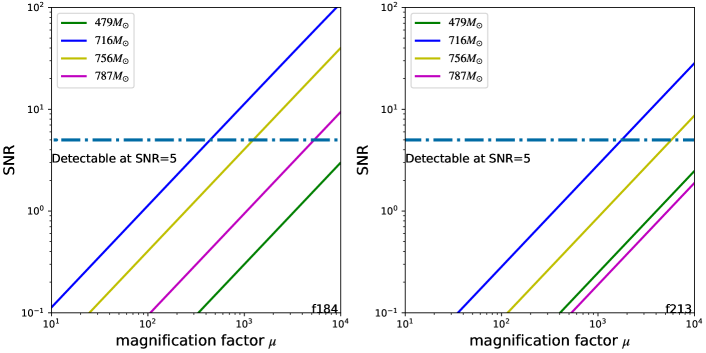
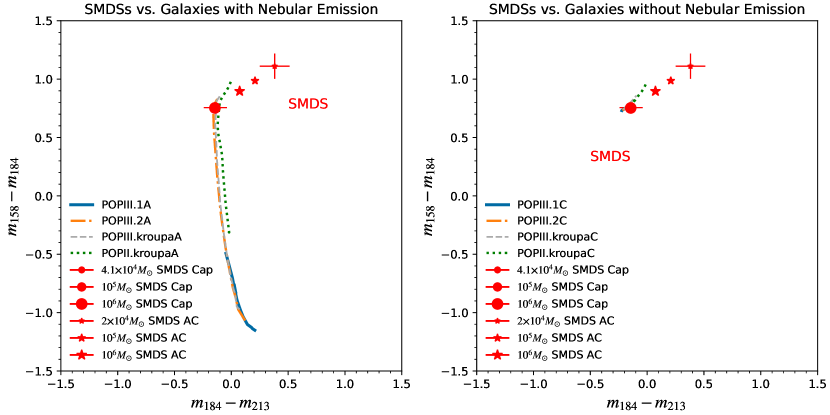
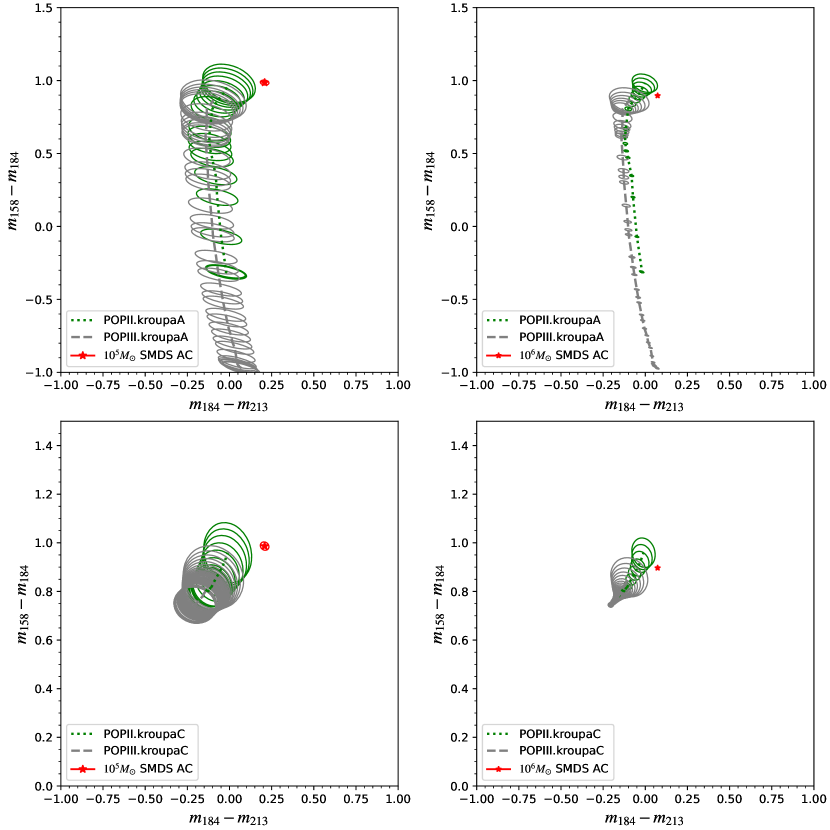
In the reminder of this subsection we focus on the role of gravitational lensing on differentiating SMDSs from Pop III/II galaxies using the color color techique discussed in Sec. 6.4. We start with Fig. 23, where the color index analysis in the vs. plane presented in Fig 17 is redone, assuming now that all objects are magnified with a lensing factor . In the left/right panel we compare the color indices of SMDSs formed via DM capture (red circles) and adiabatic contraction (red star symbols) to the evolutionary tracks of Pop III/II type A/C. For each SMDS we calculate the size of the error bar according to Eq. (11). The boosted SNRs lead to a significant reduction of the uncertainty in the color indices of SMDSs, as can be seen by comparing Figs. 17 and 23. Moreover, since SMDSs formed via DM capture have roughly equal temperature, independent of stellar mass, their SEDs (and therefore colors) do not change significantly as the SMDS grows. For this reason all the color indices of the SMDSs formed via DM capture are stacked upon each other at a point that is very close to the evolutionary tracks of both type galaxies. This reinforces once more that SMDS formed via DM capture can be easily mistaken for early galaxies if neither of those objects is resolved. We don’t add here error bars for the points along the evolutionary tracks of galaxies, as those uncertainties will will be dependent on the SNR (via Eq. 11), and, as such, on the mass of the SMDSs counterpart. However, we revisit this in Fig. 24 where we plot separately each SMDSs formed via AC, which allows for inclusion of uncertainties in color indices of both galaxies and SMDSs.
As already stated, Fig. 23 reinforces the point that SMDSs formed via capture are great Pop III/II galactic chameleons. Independent of their mass, they will occupy the same spot in the vs. color color plot, a spot that is along the evolutionary lines of both type A (left panel) and type C (right panel) galaxies. We already knew that from the SED comparisons, where we found that SMDSs formed via DM capture will have almost indistinguishable SEDs from old Type A galaxies and most type C galaxies (Figs. 11 and 12). A natural question arises: can one, in absence of spectral data, tell apart a SMDSs formed via DM capture from the Pop III/II galaxies counterparts that occupy roughly the same location in the color color plot of Fig. 23? First, notice that the color-color technique is very valuable, as it clearly disambiguates between both types SMDSs and Pop III.1A galaxies. Therefore, considering the case of a SMDS formed via DM capture, for , image morphology can break the degeneracy presented in Fig. 23, as at those magifications the galactic counterparts (that also occupy the same location in the color color plot) will be all resolved, whereas the SMDSs will still be well under the resolution limit (see Fig. 19). Naturally, for lower mass SMDSs, a larger magnification is required to achieve the same effect.
When contrasting SDMSs formed via extended AC (red star symbols in Fig. 23) to Pop III/II galaxies, the situation becomes more promising, as SMDS of smaller and smaller mass deviate more and more from the evolutionary tracks of both type A and C of galaxies. All SMDSs formed via this mechanism, boosted by , will be more than away from the evolutionary tracks of galaxies. The one caveat here is that Fig. 23 does not include the uncertainty in the color indices of galaxies, as explained above. We address this point in Fig. 24, where we present the color index comparison between SMDSs formed via AC of and to the evolutionary tracks of Type A/C Pop III/II galaxies (top/bottom panels) that are selected in such a way that they match the F184 flux of the SMDS, as per our comparison criterion. For all objects a gravitational lensing magnification factor of is assumed. As opposed to Fig. 23, here we can include both uncertainties for the SMDS colors and those of the Pop III/II galaxies, along their evolutionary tracks, as in each panel the SNR of galaxies and the star is determined uniquely. In order to be conservative, and avoid unnecessarily cluttering the plots, we only keep the Kroupa IMF type galaxies in this figure, since their evolutionary tracks lie closest to the SMDSs. However, our conclusions are unaffected by this aesthetic simplification.
For the magnification assumed in Fig. 24, we find that and SMDS formed via extended AC are separated at the 2 level (in each direction) from the evolutionary tracks of the Pop III/II galaxies counterparts that have the same F184 flux. For smaller SMDS, the distinction between SMDS and galaxies is even smaller. Hence a larger magnification would be required to cleanly differentiate the type of object in a color-color plot. If objects with high enough magnification are found to unambiguously identify a SMDS, such a discovery could indirectly confirm the nature of the DM.
8 Summary and Conclusions
Dark Stars (DSs) can form at redshift . Made almost entirely of hydrogen and helium, they are fueled by Dark Matter heating. As they are relatively cool ( K) Dark Stars can grow, via accretion, to become supermassive (SMDS) and extremely bright. In this paper we examined the capability of the upcoming Roman Space Telescope (RST) to detect SMDSs. First we showed that the sensitivity of RST does indeed allow for detection of SMDS, and then we turned to the question of whether or not they can be differentiated in the data from high redshift galaxies.
Roman Space Telescope will be an excellent observatory in the search for Dark Stars. Due to its large field of view, it has great potential for discovery of new objects at redshifts . In this paper we considered Supermassive Dark Stars in the mass range formed via two possible mechanisms: Extended AC and Capture. Here, “Extended AC” refers to the case in which the DM is accreted gravitationally only; the “Capture” mechanism relies upon an additional ingredient, capture of further DM via scattering off nuclei in the star. As our fiducial values, we have studied SMDS emitting at and DM mass 100 GeV.
SMDS detectability in RST: First, we compared predictions of SMDS spectra (simulated with TLUSTY as shown in Fig. 2) against the sensitivity of RST filters to determine which SMDSs at which redshifts would be detectable by RST, using the standard dropout techniques. We found that SMDS candidates formed via either the capture or extended AC formation mechanism could indeed be detected by RST using photometry alone.
Figures 5 and 6 show the comparison of AB magnitudes of unlensed SMDSs at different redshifts, in contrast to the detection limit (S/N=5) for each RST filter assuming exposure times of s and s. For SMDSs with masses , formed via AC or Capture, we find that at emission redshift they would be observable by RST with s of exposure time, even if unlensed. With lensing factors of , RST can easily observe SMDSs with masses as low as (See Fig. 21). SMDSs will appear as J-band dropouts at and H-band dropouts at , and as (H/K) dropouts at . In order to be able to also include the color index technique, that requires photometric data in at least three bands, we chose , as our fiducial value throughout this paper.
Differentiating SMDS from high redshift galaxies: A key question is whether or not SMDS can be differentiated in the data from high redshift [zero (Pop III) or very low metallicity (Pop II)] galaxies. For these galaxies, the spectral evolution with respect to age, nebular emission, IMF and metallicity were obtained using the YggDrasil (Zackrisson et al., 2011) simulated model grids, and the relevant choice of parameters are given in Table 5. For the purposes of comparison to SDMS, we chose Pop III/II galaxies that have the same integrated observed F184 flux as the dark stars in question. We used several approaches to see if we can differentiate SDMS from early galaxies: SEDS in photometric data, location in color-color plots and image morphology (point vs. extended objects).
Given the resolution of RST, SMDS will be point objects whereas galaxies may be resolved. Without lensing, many galaxies will remain unresolved so that one cannot tell the difference from supermassive stars. The higher the magnification, the more likely that galaxies are resolved whereas SMDS remain point sources. We estimate that magnification is sufficient to resolve the all galaxies we have investigated, but upcoming observations will determine this number more accurately. We note that Airy patterns, being specific only for point objects, would definitively identify them as such. However, very long exposure times O(year) would be needed for their detection, since the first ring is only 1.75% as bright as the central spot. Therefore, discovery of such a pattern in RST is unlikely for Dark Stars, yet it is a signature of SMDS that future telescopes would be able to see.
For objects only seen with RST photometry (rather than spectroscopy), SEDs of both SMDS and Pop III/II galaxies can equally well match observations. One approach to differentiate SMDS vs galaxies would be their location in color-color plots. We used the Pandeia engine to simulate RST observations of different candidate objects (e.g. Fig. 15 and 16).252525The simulated SNR values also allow us to estimate the uncertainty in the absolute magnitude, in any RST band in which an object is detected. Specifically., we use the F-K vs. H-F color indices for all of the objects of interest (see Figs. 17, 23 and 24).
| Formation | Drop-out | () | Morphology | Morphology | Color-color | Color-color | |
|---|---|---|---|---|---|---|---|
| Mechanism | No Lensing | No Lensing | No Lensing | ||||
| Extended AC | No | Yes | No | No | No | No | |
| Extended AC | No | Yes | No | No | No | at 2 | |
| Extended AC | Yes | Yes | No | Yes | No | at 2 | |
| Capture | No | Yes | No | No | No | No | |
| Capture | No | Yes | No | No | No | No | |
| Capture | Yes | Yes | No | Yes | No | No |
In Table 3 we summarize the potential to detect SMDSs and then to disambiguate them via image morphology and/or color index techniques from their respective Pop III/II galactic counterparts. The third and fourth columns take binary (Yes/No) values and address the question of detection at level, without lensing (column three) or with lensing (column four). Similarly, in the fourth and fifth columns we summarize the answers to the following question: can a SMDSs be differentiated from all possible galactic counterparts based on image morphology, i.e. point source (SMDSs) vs. potentially resolved extended object (galaxy). The last two columns summarize the potential to use the vs. color diagram to separate SMDSs of a given mass vs. galaxies.
Differentiating SMDS with masses up to against early galaxies without spectroscopy proves to be difficult. As mentioned above, both types of SMDS as well as early galaxies have SEDs that match RST data equally well. For SMDS formed via Extended AC, for SMDS masses with , the loci occupied by the SMDSs in the color-color plots deviate from the evolutionary lines of Pop III/II galaxies at the level for the case of (see Fig. 24). For smaller SMDS or for higher statistical significance of the difference between the objects, even larger magnifications would be required. For SMDS formed via capture, the locations in color-color plots cannot be differentiated from early galaxies; the only differentiating characteristic would then be that these are point objects whereas galaxies can be resolved at sufficient magnifications. For instance, for the SMDS via DM Capture, by all the galactic counterparts are resolved (top left panels of Figs .19 and 20).
There is a “smoking gun” for detection of SMDS once the spectroscopy is available: a telltale spectroscopic signature, the HeII 1640 absorption line. While RST does not cover the wavelength band required to find this line (for ), JWST does. Hence the two detectors can be used together in identifying SMDS. SMDS formed via capture would produce this line; for the cooler SMDS formed via extended AC, this feature is present only for extremely massive () SMDSs (See Fig. 2). However, there is a caveat: as yet we have not modeled the nebula surrounding the star, which in the case of the hotter SMDS formed via capture could wash out the absorption line and/or produce emission lines. The cooler SMDS formed via extended AC are not likely to be affected. In followup work, we plan to use the CLOUDY code to add the effects of the nebula to the stellar spectra produced by TLUSTY. In any case, should a HeII 1640 absorption line be found, it would be a strong indicator that an object found in RST is a supermassive star rather than an early galaxy.
While the HeII 1640 line is a very useful spectroscopic tool, since it is isolated from other neighbouring lines (see Fig. 2), we note here that SMDSs differ from Pop III/II galaxies with respect to their spectral signatures in other important ways. First of all, the Balmer break, i.e. the sudden jump in the flux at around (restframe), which can be seen in the lower two panels of Fig. 2 as a “hump-like” feature. This feature will be more pronounced for Pop III/II galaxies with nebular emission, but most importantly, the sequence of lines that follows the Balmer break, i.e. the Balmer series, are emission lines for galaxies with nebular emission vs. absorption lines for SMDS with purely stellar spectra. Thus, in addition to the He II 1640 line, as a spectroscopic disambiguation tool, one can also use lines in the Balmer series as well.
On heavier SMDS: In this paper we have focused on SMDS with masses up to . However, in principle SMDS could grow to become even heavier, e.g. if they formed in minihalos or if smaller minihaloes merged together and the DS remains in a dark matter rich region. We therefore consider below the detectability of SMDS. Since total luminosity scales linearly with mass, these objects would be ten times brighter than SMDS and thus easier to detect. We note, however, that differentiation in color-color plots against early galaxies would actually be more difficult (see Figure 21). On the plus side, galaxies this bright should be easier to resolve. Thus the differentiation of these very heavy SMDS vs. early galaxies should be possible. Further, the He II 1640 line would be more pronounced (deeper) for these hotter objects; such a line would be detectable in RST only for while JWST could find it even for higher redshift objects. In summary, SMDS are much brighter, therefore easier to detect as well as differentiate from early galaxies.
Using RST and JWST together: The primary advantage of RST is that it will have a much larger field of view than that of JWST. Thus, at the redshifts RST is able to probe, it will have a larger probability of successfully finding SMDSs. Two of us ( Ilie et al. (2012)) have previously studied SMDS in JWST data (including estimating the numbers of SMDS one could find with JWST). As shown in Fig.3, RST and JWST have comparable detector sensitivity for wavelengths up to , including the J and H bands relevant for identifying objects as J- and H-band dropouts, corresponding to and respectively. JWST is far more sensitive at higher wavelengths and thus can find higher redshift objects than RST can, e.g. K-band dropouts at . JWST can probe, via photometry wavelengths up to (NIRCam up to and MIRI from to ), whereas the Wide Field Instrument (WFI) onboard RST will be sensitive only up to . In terms of spectroscopy the Grism on RST will be probing up to , whereas NIRSpec onboard JWST is sensitive up to . As such RST will be essentially blind with respect to any objects at . At those high redshifts the Gunn-Peterson trough will cutoff the entirety of the redshifted flux in the region RST is potentially sensitive to. Moreover, even at the redshift of interest to us in this paper () there is quite important information one can gain from possible redshifted spectral features that fall outside of the sensitivity range of RST, such as, for example, the Balmer Break, or other H or He absorption lines present in the SMDS SEDs. Moreover, with a much larger aperture, JWST has a better angular resolution. Therefore, once a candidate DS object is identified by RST, followup observations with JWST could be used to further verify and validate the Dark Star hypothesis. As mentioned above, a smoking gun for SMDS is the existence of a He II 1640 line, which would not be expected for the case of early galaxies. While RST wavelengths are insensitive to this line, spectroscopy with JWST may be able to detect it.
We note that the ability of NIRSpec on JWST to obtain clean spectra is remarkable, see e.g. GNz11 in Bunker et al. (2023). This galaxy has a spectrum seen to in the H-band, which would be comparable to the brightness of a SMDS formed via AC, see Fig. 5 in (Ilie et al., 2012). While GNz11 is clearly not a Dark Star, as it is resolved, and moreover shows numerous metal emission lines (see Fig. 1 of Bunker et al. (2023)), based on the relatively short total exposure time ( hours) needed to generate its exquisite spectrum with NIRSpec, we would expect spectroscopy with JWST is a viable tool for a SMDSs. In summary, RST will be an excellent instrument for finding SMDS candidates, with followup observations from JWST potentially providing definitive determination of Dark Star discovery.
In Conclusion: Dark Stars are very bright sources. In fact, a million solar mass dark star can emit as much light as a billion solar mass galaxy so that the two look very similar in RST and JWST observations. Hence the conundrum posed by the many observed bright high redshift objects in JWST, in the context of the standard CDM cosmological model, could be alleviated by the existence of Dark Stars containing much less baryonic mass than would be required of a comparably bright galaxy.
In this paper we showed that SMDSs candidates formed via either the capture or extended AC formation mechanism and emitting at redshifts up to could be found by RST using photometry alone. We examined how those candidates could be differentiated from high redshift Pop III or Pop II galaxies, and summarized our results in this section. There are a number of potential signatures, including their location in color-color plots and image morphology. SDMSs with purely stellar spectra would appear as point objects, very bright (), yet relatively cool ( K) sources. The detection of a He II absorption line at restframe wavelength (the He II 1640 line) with followup spectroscopic observations would be a clear signature of supermassive dark stars, as this feature is absent in any galactic sources. The identification of supermassive dark stars would be truly remarkable, as it would imply the existence of a novel heat source powering stars, such as the DM annihilation we have studied. Further, such a discovery could open up the possibility of DM parameter estimations based on observed properties of dark stars.
9 Acknowledgments
K.F. and S.Z. are grateful for support from the Jeff and Gail Kodosky Endowed Chair in Physics held by K.F. at the Univ. of Texas, Austin. K.F. and S.Z. acknowledge funding from the U.S. Department of Energy, Office of Science, Office of High Energy Physics program under Award Number DE-SC0022021. K.F. acknowledges support by the Vetenskapsradet (Swedish Research Council) through contract No. 638- 2013-8993 and the Oskar Klein Centre for Cosmoparticle Physics at Stockholm University. We would acknowledge the useful discussions with James Rhoads, and help from Steve Finkelstein, Volker Bromm through personal communication. We are especially grateful for Jonathan Levine’s help with the error ellipses and for him sharing with us the code he uses to generate such ellipses for his research. S.Z. would like to give special thanks to his roommate Changhan Ge who offered help with the Pandeia simulation installation.
References
- Abel et al. (2002) Abel, T., Bryan, G. L., & Norman, M. L. 2002, Science, 295, 93, doi: 10.1126/science.295.5552.93, 10.1126/science.1063991
- Adams et al. (2023) Adams, N. J., Conselice, C. J., Ferreira, L., et al. 2023, MNRAS, 518, 4755, doi: 10.1093/mnras/stac3347
- Bagley et al. (2022) Bagley, M. B., Finkelstein, S. L., Rojas-Ruiz, S., et al. 2022, arXiv e-prints, arXiv:2205.12980. https://arxiv.org/abs/2205.12980
- Barkana & Loeb (2001) Barkana, R., & Loeb, A. 2001, Phys. Rept., 349, 125, doi: 10.1016/S0370-1573(01)00019-9
- Becker et al. (2001) Becker, R. H., Fan, X., White, R. L., et al. 2001, AJ, 122, 2850, doi: 10.1086/324231
- Begelman et al. (2006) Begelman, M. C., Volonteri, M., & Rees, M. J. 2006, MNRAS, 370, 289, doi: 10.1111/j.1365-2966.2006.10467.x
- Behroozi et al. (2020) Behroozi, P., Conroy, C., Wechsler, R. H., et al. 2020, MNRAS, 499, 5702, doi: 10.1093/mnras/staa3164
- Bertone (2010) Bertone, G., ed. 2010, Particle Dark Matter: Observations, Models and Searches (Cambridge University Press), doi: 10.1017/CBO9780511770739
- Bessell & Brett (1988) Bessell, M. S., & Brett, J. M. 1988, PASP, 100, 1134, doi: 10.1086/132281
- Bouwens et al. (2021) Bouwens, R. J., Illingworth, G. D., van Dokkum, P. G., et al. 2021, AJ, 162, 255, doi: 10.3847/1538-3881/abfda6
- Bouwens et al. (2011) Bouwens, R. J., et al. 2011, Nature, 469, 504, doi: 10.1038/nature09717
- Bowler et al. (2020) Bowler, R. A. A., Jarvis, M. J., Dunlop, J. S., et al. 2020, Mon. Not. Roy. Astron. Soc., 493, 2059, doi: 10.1093/mnras/staa313
- Bradley et al. (2022) Bradley, L. D., Coe, D., Brammer, G., et al. 2022, arXiv e-prints, arXiv:2210.01777, doi: 10.48550/arXiv.2210.01777
- Bromm & Larson (2004) Bromm, V., & Larson, R. B. 2004, Ann. Rev. Astron. Astrophys., 42, 79, doi: 10.1146/annurev.astro.42.053102.134034
- Bromm et al. (2009) Bromm, V., Yoshida, N., Hernquist, L., & McKee, C. F. 2009, Nature, 459, 49, doi: 10.1038/nature07990
- Bunker et al. (2023) Bunker, A. J., Saxena, A., Cameron, A. J., et al. 2023, arXiv e-prints, arXiv:2302.07256, doi: 10.48550/arXiv.2302.07256
- Casanellas & Lopes (2009) Casanellas, J., & Lopes, I. 2009, Astrophys. J., 705, 135, doi: 10.1088/0004-637X/705/1/135
- Castellano et al. (2022) Castellano, M., Fontana, A., Treu, T., et al. 2022, ApJ, 938, L15, doi: 10.3847/2041-8213/ac94d0
- Coe et al. (2013) Coe, D., Zitrin, A., Carrasco, M., et al. 2013, ApJ, 762, 32, doi: 10.1088/0004-637X/762/1/32
- Curtis-Lake et al. (2023) Curtis-Lake, E., Carniani, S., Cameron, A., et al. 2023, Nature Astronomy, 7, 622, doi: 10.1038/s41550-023-01918-w
- Davé (2008) Davé, R. 2008, MNRAS, 385, 147, doi: 10.1111/j.1365-2966.2008.12866.x
- Dayal & Ferrara (2018) Dayal, P., & Ferrara, A. 2018, Phys. Rep., 780, 1, doi: 10.1016/j.physrep.2018.10.002
- Donnan et al. (2023) Donnan, C. T., McLeod, D. J., Dunlop, J. S., et al. 2023, MNRAS, 518, 6011, doi: 10.1093/mnras/stac3472
- Finkelstein et al. (2022) Finkelstein, S. L., Bagley, M. B., Haro, P. A., et al. 2022, ApJ, 940, L55, doi: 10.3847/2041-8213/ac966e
- Freese et al. (2008a) Freese, K., Bodenheimer, P., Spolyar, D., & Gondolo, P. 2008a, Astrophys. J., 685, L101, doi: 10.1086/592685
- Freese et al. (2009) Freese, K., Gondolo, P., Sellwood, J., & Spolyar, D. 2009, Astrophys. J., 693, 1563, doi: 10.1088/0004-637X/693/2/1563
- Freese et al. (2010) Freese, K., Ilie, C., Spolyar, D., Valluri, M., & Bodenheimer, P. 2010, ApJ, 716, 1397, doi: 10.1088/0004-637X/716/2/1397
- Freese et al. (2016) Freese, K., Rindler-Daller, T., Spolyar, D., & Valluri, M. 2016, Reports on Progress in Physics, 79, 066902
- Freese et al. (2008b) Freese, K., Spolyar, D., & Aguirre, A. 2008b, JCAP, 0811, 014, doi: 10.1088/1475-7516/2008/11/014
- Gnedin (2016) Gnedin, N. Y. 2016, ApJ, 825, L17, doi: 10.3847/2041-8205/825/2/L17
- Gondolo et al. (2010) Gondolo, P., Huh, J.-H., Do Kim, H., & Scopel, S. 2010, J. Cosmology Astropart. Phys, 2010, 026, doi: 10.1088/1475-7516/2010/07/026
- Gould (1988) Gould, A. 1988, Astrophys. J., 328, 919, doi: 10.1086/166347
- Gould (1992) —. 1992, Astrophysical Journal, 387, 21
- Gould & Raffelt (1990) Gould, A., & Raffelt, G. 1990, ApJ, 352, 654, doi: 10.1086/168568
- Gunn & Peterson (1965) Gunn, J. E., & Peterson, B. A. 1965, ApJ, 142, 1633, doi: 10.1086/148444
- Harikane et al. (2022) Harikane, Y., Inoue, A. K., Mawatari, K., et al. 2022, ApJ, 929, 1, doi: 10.3847/1538-4357/ac53a9
- Hirano et al. (2014) Hirano, S., Hosokawa, T., Yoshida, N., et al. 2014, The Astrophysical Journal, 781, 60, doi: 10.1088/0004-637x/781/2/60
- Hirano et al. (2011) Hirano, S., Umeda, H., & Yoshida, N. 2011, Astrophys. J., 736, 58, doi: 10.1088/0004-637X/736/1/58
- Hsiao et al. (2022) Hsiao, T. Y.-Y., Coe, D., Abdurro’uf, et al. 2022, arXiv e-prints, arXiv:2210.14123, doi: 10.48550/arXiv.2210.14123
- Hubeny (1988) Hubeny, I. 1988, Computer Physics Communications, 52, 103, doi: 10.1016/0010-4655(88)90177-4
- Ilie et al. (2012) Ilie, C., Freese, K., Valluri, M., Iliev, I. T., & Shapiro, P. R. 2012, MNRAS, 422, 2164, doi: 10.1111/j.1365-2966.2012.20760.x
- Ilie et al. (2023) Ilie, C., Paulin, J., & Freese, K. 2023, arXiv e-prints. https://arxiv.org/abs/2304.01173
- Inayoshi et al. (2020) Inayoshi, K., Visbal, E., & Haiman, Z. 2020, ARA&A, 58, 27, doi: 10.1146/annurev-astro-120419-014455
- Iocco (2008) Iocco, F. 2008, Astrophys. J., 677, L1, doi: 10.1086/587959
- Iocco et al. (2008) Iocco, F., Bressan, A., Ripamonti, E., et al. 2008, Monthly Notices of the Royal Astronomical Society, 390, 1655, doi: 10.1111/j.1365-2966.2008.13853.x
- Jaacks et al. (2019) Jaacks, J., Finkelstein, S. L., & Bromm, V. 2019, MNRAS, 488, 2202, doi: 10.1093/mnras/stz1529
- Jaacks et al. (2018) Jaacks, J., Thompson, R., Finkelstein, S. L., & Bromm, V. 2018, Monthly Notices of the Royal Astronomical Society, 475, 4396
- Kaurov et al. (2019) Kaurov, A. A., Dai, L., Venumadhav, T., Miralda-Escudé, J., & Frye, B. 2019, ApJ, 880, 58, doi: 10.3847/1538-4357/ab2888
- Kawamata et al. (2018) Kawamata, R., Ishigaki, M., Shimasaku, K., et al. 2018, ApJ, 855, 4, doi: 10.3847/1538-4357/aaa6cf
- Kelly et al. (2018) Kelly, P. L., Diego, J. M., Rodney, S., et al. 2018, Nature Astronomy, 2, 334, doi: 10.1038/s41550-018-0430-3
- Kilbinger (2015) Kilbinger, M. 2015, Rept. Prog. Phys., 78, 086901, doi: 10.1088/0034-4885/78/8/086901
- Krauss et al. (1985) Krauss, L. M., Freese, K., Press, W., & Spergel, D. 1985, Astrophys. J., 299, 1001, doi: 10.1086/163767
- Kroupa (2001) Kroupa, P. 2001, Monthly Notices of the Royal Astronomical Society, 322, 231
- Labbé et al. (2023) Labbé, I., van Dokkum, P., Nelson, E., et al. 2023, Nature, 616, 266, doi: 10.1038/s41586-023-05786-2
- Lam et al. (2019) Lam, D., Bouwens, R. J., Coe, D., et al. 2019, arXiv e-prints, arXiv:1903.08177. https://arxiv.org/abs/1903.08177
- Liu & Bromm (2020) Liu, B., & Bromm, V. 2020, Monthly Notices of the Royal Astronomical Society, 497, 2839
- Lodato & Natarajan (2006) Lodato, G., & Natarajan, P. 2006, Mon. Not. Roy. Astron. Soc., 371, 1813, doi: 10.1111/j.1365-2966.2006.10801.x
- Loeb & Rasio (1994) Loeb, A., & Rasio, F. A. 1994, Astrophys. J., 432, 52, doi: 10.1086/174548
- Meena et al. (2023) Meena, A. K., Zitrin, A., Jiménez-Teja, Y., et al. 2023, ApJ, 944, L6, doi: 10.3847/2041-8213/acb645
- Mighell (2005) Mighell, K. J. 2005, MNRAS, 361, 861, doi: 10.1111/j.1365-2966.2005.09208.x
- Naidu et al. (2022a) Naidu, R. P., Oesch, P. A., van Dokkum, P., et al. 2022a, ApJ, 940, L14, doi: 10.3847/2041-8213/ac9b22
- Naidu et al. (2022b) Naidu, R. P., Oesch, P. A., Setton, D. J., et al. 2022b, arXiv e-prints, arXiv:2208.02794. https://arxiv.org/abs/2208.02794
- Natarajan et al. (2009) Natarajan, A., Tan, J. C., & O’Shea, B. W. 2009, ApJ, 692, 574, doi: 10.1088/0004-637X/692/1/574
- Oke & Gunn (1983) Oke, J. B., & Gunn, J. E. 1983, ApJ, 266, 713, doi: 10.1086/160817
- O’Shea & Norman (2007) O’Shea, B. W., & Norman, M. L. 2007, Astrophys. J., 654, 66, doi: 10.1086/509250
- Pacucci et al. (2015) Pacucci, F., Ferrara, A., Volonteri, M., & Dubus, G. 2015, Monthly Notices of the Royal Astronomical Society, 454, 3771
- Park et al. (2022) Park, C., Lee, J., Kim, J., et al. 2022, ApJ, 937, 15, doi: 10.3847/1538-4357/ac85b5
- Pawlik et al. (2011) Pawlik, A. H., Milosavljević, M., & Bromm, V. 2011, ApJ, 731, 54, doi: 10.1088/0004-637X/731/1/54
- Pontoppidan et al. (2016) Pontoppidan, K. M., Pickering, T. E., Laidler, V. G., et al. 2016, in Observatory Operations: Strategies, Processes, and Systems VI, Vol. 9910, International Society for Optics and Photonics, 991016
- Press & Spergel (1985) Press, W. H., & Spergel, D. N. 1985, Astrophys. J., 296, 679, doi: 10.1086/163485
- Raiter, A. et al. (2010) Raiter, A., Schaerer, D., & Fosbury, R. A. E. 2010, A&A, 523, A64, doi: 10.1051/0004-6361/201015236
- Rindler-Daller et al. (2015) Rindler-Daller, T., Montgomery, M. H., Freese, K., Winget, D. E., & Paxton, B. 2015, ApJ, 799, 210, doi: 10.1088/0004-637X/799/2/210
- Ripamonti et al. (2009) Ripamonti, E., Iocco, F., Bressan, A., et al. 2009, PoS, IDM2008, 075, doi: 10.22323/1.064.0075
- Ripamonti et al. (2010) Ripamonti, E., Iocco, F., Ferrara, A., et al. 2010, Mon. Not. Roy. Astron. Soc., 406, 2605, doi: 10.1111/j.1365-2966.2010.16854.x
- Robertson et al. (2023) Robertson, B. E., Tacchella, S., Johnson, B. D., et al. 2023, Nature Astronomy, 7, 611, doi: 10.1038/s41550-023-01921-1
- Rydberg et al. (2015) Rydberg, C.-E., Zackrisson, E., Zitrin, A., et al. 2015, The Astrophysical Journal, 804, 13
- Salati & Silk (1989) Salati, P., & Silk, J. 1989, Astrophys. J., 338, 24
- Salpeter (1955) Salpeter, E. E. 1955, ApJ, 121, 161, doi: 10.1086/145971
- Schaerer (2002) Schaerer, D. 2002, A&A, 382, 28, doi: 10.1051/0004-6361:20011619
- Schneider et al. (1992) Schneider, P., Ehlers, J., & Falco, E. E. 1992, Gravitational Lenses, doi: 10.1007/978-3-662-03758-4
- Sivertsson & Gondolo (2011) Sivertsson, S., & Gondolo, P. 2011, ApJ, 729, 51, doi: 10.1088/0004-637X/729/1/51
- Smith et al. (2012) Smith, R. J., Iocco, F., Glover, S. C. O., et al. 2012, ApJ, 761, 154, doi: 10.1088/0004-637X/761/2/154
- Spergel & Press (1985) Spergel, D. N., & Press, W. H. 1985, Astrophysical Journal, 294, 663
- Spolyar et al. (2009) Spolyar, D., Bodenheimer, P., Freese, K., & Gondolo, P. 2009, Astrophys. J., 705, 1031, doi: 10.1088/0004-637X/705/1/1031
- Spolyar et al. (2008) Spolyar, D., Freese, K., & Gondolo, P. 2008, Phys. Rev. Lett., 100, 051101, doi: 10.1103/PhysRevLett.100.051101
- Stacy et al. (2012) Stacy, A., Greif, T. H., & Bromm, V. 2012, MNRAS, 422, 290, doi: 10.1111/j.1365-2966.2012.20605.x
- Stacy et al. (2014) Stacy, A., Pawlik, A. H., Bromm, V., & Loeb, A. 2014, MNRAS, 441, 822, doi: 10.1093/mnras/stu621
- Stefanon et al. (2019) Stefanon, M., Labbé, I., Bouwens, R. J., et al. 2019, ApJ, 883, 99, doi: 10.3847/1538-4357/ab3792
- Steidel et al. (1996) Steidel, C. C., Giavalisco, M., Pettini, M., Dickinson, M., & Adelberger, K. L. 1996, Astrophys. J. Lett., 462, L17, doi: 10.1088/1538-4357/462/1/L17
- Taoso et al. (2008) Taoso, M., Bertone, G., Meynet, G., & Ekström, S. 2008, Phys. Rev. D, 78, 123510, doi: 10.1103/PhysRevD.78.123510
- Tinyakov et al. (2021) Tinyakov, P., Pshirkov, M., & Popov, S. 2021, Universe, 7, 401, doi: 10.3390/universe7110401
- Tumlinson (2006) Tumlinson, J. 2006, ApJ, 641, 1, doi: 10.1086/500383
- Valluri et al. (2010) Valluri, M., Debattista, V. P., Quinn, T., & Moore, B. 2010, MNRAS, 403, 525, doi: 10.1111/j.1365-2966.2009.16192.x
- Vikaeus et al. (2022) Vikaeus, A., Zackrisson, E., Schaerer, D., et al. 2022, MNRAS, 512, 3030, doi: 10.1093/mnras/stac488
- Wang et al. (2019) Wang, F., Yang, J., Fan, X., et al. 2019, ApJ, 884, 30, doi: 10.3847/1538-4357/ab2be5
- Wang et al. (2021) —. 2021, ApJ, 907, L1, doi: 10.3847/2041-8213/abd8c6
- Welch et al. (2022a) Welch, B., Coe, D., Diego, J. M., et al. 2022a, Nature, 603, 815, doi: 10.1038/s41586-022-04449-y
- Welch et al. (2022b) Welch, B., Coe, D., Zackrisson, E., et al. 2022b, ApJ, 940, L1, doi: 10.3847/2041-8213/ac9d39
- Welch et al. (2023) Welch, B., Coe, D., Zitrin, A., et al. 2023, ApJ, 943, 2, doi: 10.3847/1538-4357/aca8a8
- Wu et al. (2022) Wu, Y., Baum, S., Freese, K., Visinelli, L., & Yu, H.-B. 2022, Phys. Rev. D, 106, 043028, doi: 10.1103/PhysRevD.106.043028
- Yoon et al. (2008) Yoon, S.-C., Iocco, F., & Akiyama, S. 2008, Astrophys. J. Lett., 688, L1, doi: 10.1086/593976
- Yoshida et al. (2008) Yoshida, N., Omukai, K., & Hernquist, L. 2008, Science, 321, 669, doi: 10.1126/science.1160259
- Yoshida et al. (2006) Yoshida, N., Omukai, K., Hernquist, L., & Abel, T. 2006, Astrophys. J., 652, 6, doi: 10.1086/507978
- Yung et al. (2019) Yung, L. Y. A., Somerville, R. S., Finkelstein, S. L., Popping, G., & Davé, R. 2019, MNRAS, 483, 2983, doi: 10.1093/mnras/sty3241
- Zackrisson (2011) Zackrisson, E. 2011, arXiv e-prints, arXiv:1101.2895. https://arxiv.org/abs/1101.2895
- Zackrisson et al. (2011) Zackrisson, E., Rydberg, C.-E., Schaerer, D., Östlin, G., & Tuli, M. 2011, ApJ, 740, 13, doi: 10.1088/0004-637X/740/1/13
- Zackrisson et al. (2010) Zackrisson, E., Scott, P., Rydberg, C.-E., et al. 2010, ApJ, 717, 257, doi: 10.1088/0004-637X/717/1/257
- Zitrin et al. (2011) Zitrin, A., Broadhurst, T., Barkana, R., Rephaeli, Y., & Benítez, N. 2011, MNRAS, 410, 1939, doi: 10.1111/j.1365-2966.2010.17574.x
- Zitrin et al. (2009) Zitrin, A., Broadhurst, T., Rephaeli, Y., & Sadeh, S. 2009, ApJ, 707, L102, doi: 10.1088/0004-637X/707/1/L102
Appendix A Pandeia Parameters
In this appendix, we present the key parameters we have used for image simulation, as described in Tables 4 to 6. The complete input dictionary can be found on the Pandeia reference paper (Pontoppidan et al., 2016), as well as at the following link: https://outerspace.stsci.edu/display/PEN/Pandeia+Engine+Input+API. Below we explain some of the parameters particularly relevant to our work and possible input choices for those.
-
1.
Sersic Index: The morphology of Pop III galaxies remains largely unknown due to lack of observations. Since the masses of target galaxies are relatively small, we would expect them to have a shape similar to stellar clusters or irregular galaxies. The choice of this index (exponential) reflects that the flux is not overly concentrated at the center. For those galaxies with stellar mass on the order of , we use the recent argument on the shape of the first galaxies from Park et al. (2022), where they have simulated that galaxies of this mass will have Sersic index . Also, in the recent results from JWST, Naidu et al. (2022a) fitted the Sersic index of the observed two galaxies and the results are both , which is consistent with the simulation. Therefore, we still choose throughout our paper when we scale up the mass. Although, for smaller galaxies, this might not be accurate description, but it would not significantly change our conclusion since its angular size is relatively small to be resolved.
-
2.
Group/Integration/Exposure Number: For simplicity, the readout pattern is chosen as the default for Roman (Deep2). To avoid saturation, the maximal allowed group number() for this readout pattern is 20, and the integration time () is a linear function of the group number. For that case of Deep2, it is given by , where as the sample exposure time. Since our desired exposure time would be , we choose the maximum value for the group number as .262626Differences in the integration pattern are explained in the fig. 2 of the documentation page: https://jwst-docs.stsci.edu/jwst-near-infrared-camera/nircam-instrumentation/nircam-detector-overview/nircam-detector-readout-patterns. We also have the integration number per exposure () and exposure number (), that multiply the integration time to give the total exposure time: . Since there’s no special preference on the choice of these two numbers,272727For a more detailed understanding of the integration process and observation strategies, one can refer to https://jwst-docs.stsci.edu/understanding-exposure-times. we choose and such that the total exposure time is closest to .
-
3.
Background Level: the relevant background properties and spectrum are described at https://jwst-docs.stsci.edu/jwst-general-support/jwst-background-model. For the range of wavelengts of interest (), the background noise contribution from zodiacal lights and galactic dust dominates. To acquire optimal observation results and for simplicity, we choose the minimum zodiacal background as ’minzodi’ and set the background level to be its benchmark level.
In the three tables below we list input parameters specific to SMDSs (Table 4), Pop III/II galaxies (Table 5), and lastly common to both of those objects (Table 6) In.
| Aperture Size | Sky Annulus |
|---|---|
| 0.2” | [0.4”,0.6”] |
| Major | Minor | Geometry | Sersic Index | Norm Method | Aperture Size | Sky Annulus |
|---|---|---|---|---|---|---|
| Sersic | 1 | integ infinity | 0.1” | [0.15”,0.2”] |
| Background | Background | Background | Aperture | Group | Integration | Exposure | Readout |
| Level | Subtraction | Number | Number | Number | Pattern | ||
| minzodi | benchmark | True | imaging | 20 | 29 | 30 | deep2 |