The Ecological Fallacy in Annotation:
Modelling Human Label Variation goes beyond Sociodemographics
Abstract
Many NLP tasks exhibit human label variation, where different annotators give different labels to the same texts. This variation is known to depend, at least in part, on the sociodemographics of annotators. Recent research aims to model individual annotator behaviour rather than predicting aggregated labels, and we would expect that sociodemographic information is useful for these models. On the other hand, the ecological fallacy states that aggregate group behaviour, such as the behaviour of the average female annotator, does not necessarily explain individual behaviour. To account for sociodemographics in models of individual annotator behaviour, we introduce group-specific layers to multi-annotator models. In a series of experiments for toxic content detection, we find that explicitly accounting for sociodemographic attributes in this way does not significantly improve model performance. This result shows that individual annotation behaviour depends on much more than just sociodemographics.
1 Introduction
Different annotators will not necessarily assign the same labels to the same texts, resulting in human label variation (Plank, 2022). Previous work finds that this variation depends at least in part on the sociodemographics of annotators, such as their age and gender (Binns et al., 2017; Al Kuwatly et al., 2020; Excell and Al Moubayed, 2021; Shen and Rose, 2021). These results are particularly pronounced for subjective tasks like toxic content detection (Sap et al., 2019; Kumar et al., 2021; Sap et al., 2022; Goyal et al., 2022). Since human label variation is relevant to a wide range of NLP tasks, recent research has begun to model individual annotator behaviour, rather than predicting aggregated labels (Davani et al., 2022; Gordon et al., 2022). In this setting, we would expect sociodemographic attributes to help explain annotator decisions. Therefore, we investigate whether explicitly accounting for the sociodemographic attributes of annotators leads to better predictions of their annotation behaviour111Code to run our experiments and analyses is available at https://github.com/morlikowski/ecological-fallacy.
There is a risk of misreading these efforts as an example of the ecological fallacy: aggregate group behaviour does not necessarily explain individual behaviour (Robinson, 1950; Freedman, 2015). For example, while on average, white annotators may be more likely to label African-American Vernacular English as toxic (Sap et al., 2019), that does not mean it is true for every white annotator individually. However, we aim at exactly this distinction to discuss the relevance of sociodemographic groups in models of individual annotator behaviour. Likewise, we do not assume prior work to commit ecological fallacies, even if a less-nuanced read might suggest it.
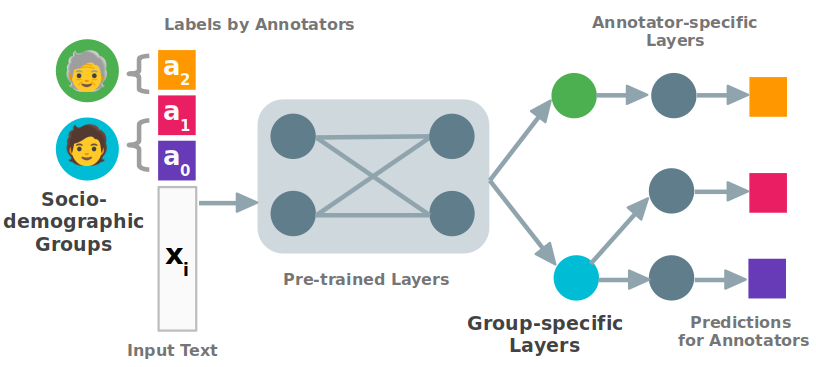
Davani et al. (2022) introduce a simple multi-annotator model, where each annotator is modelled with a separate classification head. We expand their model with group-specific layers, which are activated for each annotator based on their sociodemographic attributes. We compare the two model setups to a control setup where we randomise group assignments. All comparisons use annotator-level toxicity data from Kumar et al. (2021). We find that find that explicitly accounting for sociodemographic attributes does not significantly improve model performance. This result suggests that human label variation happens at a more individual level than sociodemographics, and that annotator decisions are even more complex.
Contributions
1) We introduce group-specific layers to model groups of annotators with shared attributes in multi-annotator models. 2) We evaluate the effect of group-specific layers for toxic content detection, and show that explicitly accounting for sociodemographic attributes does not significantly improve performance, thus highlighting the risk of the ecological fallacy in annotator modelling.
As a corollary, we show that multi-annotator models can be applied to many times more annotators than in prior work.
2 Related Work
Sociodemographics in Annotation Behaviour
A growing body of research studies how annotator sociodemographics relate to their annotation decisions, for tasks ranging from natural language inference (Biester et al., 2022) to the detection of racist (Larimore et al., 2021) or generally toxic (Sap et al., 2022) language. Goyal et al. (2022), for example, find that annotators from certain sociodemographic groups (e.g., LGBTQ people) tend to find content attacking their own groups (e.g., homophobic content) to be more toxic. This motivates our research into explicitly accounting for sociodemographics to model annotation behaviour. However, the link between sociodemographics and behaviour is not uncontested. Biester et al. (2022), for example, do not find significant differences in annotation behaviour between annotators of different genders for four different tasks.
Predicting Annotators’ Decisions on Text
Different from analyses of annotation behaviour, a recent line of research attempts to learn models based on individual annotations (Plank et al., 2014; Jamison and Gurevych, 2015; Akhtar et al., 2020; Fornaciari et al., 2021; Cercas Curry et al., 2021). These models are motivated by the concern that aggregating labels into a single “truth” is too simplistic for many tasks (Uma et al., 2021; Basile et al., 2021) and might introduce uneven representation of perspectives (Prabhakaran et al., 2021; Abercrombie et al., 2022).
A particular way of learning from disaggregated labels are models that predict individual annotator decisions for an example. Our work builds directly on such a model, multi-annotator models (Davani et al., 2022), which we describe in more detail separately (§4). Gordon et al. (2022) present a model which also predicts individual annotations and allows a user to interactively aggregate them based on “a jury” inspired by the US judicial system. Their work is similar to ours in central aspects as they explicitly model annotators’ sociodemographics and use the same dataset as we do (Kumar et al., 2021). Different from our work, they frame the task as a regression problem and develop a model based on recommender systems. While they also explore ecological fallacies, they focus on usage risks of their system and countermeasures. In contrast, we consider the issue of the ecological fallacy in modelling annotation behaviour more generally. We compare our findings to their results (§6).
3 Data
We use a sample of the Kumar et al. (2021) dataset for our experiments. The full dataset contains 107,620 English comments from Twitter, Reddit, and 4Chan, annotated for toxicity by 17,280 annotators. The annotation process encouraged annotator subjectivity (Röttger et al., 2022) which is a desired feature for modelling annotator behaviour. For each annotator, there is extensive sociodemographic information, collected with a survey. Annotations are given as ratings on a five-point scale which we convert to binary annotations by mapping ratings of 2 to 4 to toxic, and ratings 0 and 1 to non-toxic.
We randomly sample comments from the dataset until we reach annotations from more than 5,000 annotators. We then add all other annotations by these annotators. This approach maximizes the number of examples while controlling the number of annotators in our sample.
Our final sample contains 111,780 annotations from 5,002 annotators on 22,360 comments with 20 to 120 annotations per annotator (mean 22.35). Most comments have five annotations. 20 comments have four because we removed any underage annotators before sampling. In total 78,357 annotations (70.10%) are toxic, and 33,423 annotations (29.90%) are non-toxic.
We focus on four sociodemographic attributes: gender, age, education, and sexual orientation. Group sizes vary by attribute. For gender, 2,450 annotators (48.98%) identify as female, 2,116 (42.30%) as male, 23 (0.46%) as non-binary (rest in residual categories, full statistics in A.1).
4 Experiments
We compare three models. The baseline model is the multi-annotator model by Davani et al. (2022). We use their multi-task variant: For each annotator, there is a separate classification layer trained on annotations from that annotator. All annotator layers share a pre-trained language model used to encode the input. We use RoBERTa (Liu et al., 2019) for this, motivated by computational constraints. The other models in our experiments build on this baseline model.
For the sociodemographic models, we add group-specific layers based on sociodemographic attributes of the annotators. A single attribute, e.g., age, implies several groups, e.g., ages 25-34, ages 35-44. We add the group-specific layers between the pre-trained model and the annotator layers. Each group of annotators shares a separate group-specific layer. We implement group-specific layers as fully-connected, linear layers, each learning a feature transformation applied for one group of annotators.
Finally, for the random models, we shuffle the assignment of annotators to groups from the sociodemographic model, retaining the relative group sizes. In other words, the probability of each annotator staying in the same group or being reassigned to another group corresponds to the relative size of each group. This approach keeps the model architecture constant while removing the connection between actual sociodemographic attributes and group assignment. It allows us to distinguish the effects of additional parameters, which group-specific layers add in comparison to the baseline, from the effects of sociodemographic information.
4.1 Evaluation Setup
We evaluate all models on individual annotations from gender, age, education, and sexual orientation groups. This setup is comparable to the “individual label” evaluations in Davani et al. (2022) and Gordon et al. (2022), but with scores calculated per group of annotators. We measure performance in macro-average , to weigh each class equally.
Cross-Validation
As there is no standard split available for our dataset, we perform three iterations of a four-fold cross-validation with different seeds (training details in Appendix A.3). We choose four folds, so that even very small groups have more than a hundred annotations in each test set. Across folds, the numbers of annotations per sociodemographic group are similar (see Appendix A.4). We construct test sets that only contain comments unseen by the annotators in the training set. We also ensure that all test sets have similar proportions of toxic or non-toxic comments (assigned by the majority of annotators) to address the class imbalance in the dataset (70.62% toxic, see §3).
Statistical Significance
We test for statistical significance of our results from multiple runs of k-fold cross-validation via replicability analysis (Dror et al., 2017). We report the number of significant folds and the Bonferroni-corrected count (Dror et al., 2018) in Appendix A.2. We compute the p-values for each fold via a paired bootstrap-sampling test with BooStSa (Fornaciari et al., 2022). We set the significance level , draw 1000 bootstrap samples per fold, and use a sample size of 50% of the respective test set.
Remarks on Groups
Annotators from different groups of the same attribute will in most cases not have annotated the same examples. Therefore, comparisons between models are only meaningful within each group.
The groups modeled via group-specific layers and those in the result tables are always the same. For example, if we report scores for gender groups, then the sociodemographic and randomized models are also based on gender groups. In the following, we focus on a subset of groups, omitting, e.g., "Prefer not to say" (see Appendix A.5).
5 Results
Table 1 shows the results for gender, age, education, and sexual orientation. A naive majority class baseline that predicts all input to be toxic performs worse than all other models with a large margin (exact results in Appendix A.5).
Sociodemographics vs. Baseline
Across attributes, the average scores of the sociodemographic model and the baseline are similar. The sociodemographic model often has a slightly higher average macro F1 than the baseline, but no statistically significant gains. Where average performance is better by several points, as for homosexual annotators, this gain is offset by a large variance in performance (a consequence of small group sizes).
Sociodemographics vs. Random
We also do not find significant performance differences between sociodemographic group-layer models and the corresponding random group assignment models. For most groups, the randomized models achieve the highest average scores, but differences to the sociodemographic model are never statistically significant.
6 Discussion
We do not find strong evidence that explicitly modelling sociodemographics helps to predict annotation behaviour with multi-annotator models. These results might seem counter-intuitive, given the evidence of systematic annotation differences between sociodemographic groups (see §2). This discrepancy, however, echoes the issue highlighted by ecological fallacies (Robinson, 1950): Not every annotator will be a perfect representative of their group, so we will not necessarily learn additional information based on their group identity. This seems especially true if we already have access to individual behaviour (i.e., individual annotations).
In contrast to Davani et al. (2022), we made sociodemographic information explicit in our experiments, as one of the factors influencing annotation behaviour. Group-specific layers can be seen as an inductive bias putting emphasis on the sociodemographic relations between annotators. However, there are potentially many other factors influencing annotation behaviour (e.g., attitudes, moral values, cognitive biases, psychological traits). In light of our results, it seems plausible that multi-annotator models learn about these factors implicitly as part of predicting individual behaviour, so that making one factor explicit does not change prediction quality, at least in the case of sociodemographics.
Still, we also know that generally group attributes can help predict individual decisions, i.e., as base rates or priors. To avoid ecological fallacies in modelling annotation, we therefore need to better understand when and how modelling sociodemographic information is useful in predicting an individual annotator’s decisions. For example, we have only evaluated group-specific layers for single attributes. In contrast, social scientists have long adopted the idea of intersectionality (Crenshaw, 1989), which also informs research on fairness in machine learning (Wang et al., 2022). Intersectionality means that the effect of interactions between sociodemographic attributes enables specific experiences that are not captured by the attributes in isolation. For example, identifying as a man means something different depending on the person’s education. Groups derived from single attributes might simply be too coarse to improve classifiers learnt from individual labels, as in multi-annotator models.
The dataset we use (Kumar et al., 2021) has many characteristics which are ideal for our study (see §3). However, it uses a broad notion of toxicity, in contrast to other studies of toxic language (Larimore et al., 2021; Sap et al., 2022), which match content and analysed groups. When modeling the groups frequently referenced in the datasets themselves, we would expect greater benefits from group-specific layers. Similar to us, Biester et al. (2022) who do not find significant differences between annotators of different genders, do so in a more general setting.
We can only partially compare to Gordon et al. (2022), despite using the same dataset. In addition to differences in approach (see §2), our and their work also differ in their research questions and thus experimental conditions. Gordon et al. (2022) compare their full model (group and individual) against using group information alone. We compare our full model (group and individual) against using individual information alone. So it is unclear if their model would benefit from group information in comparison to individual-level information alone. While they find an improvement from group information it is only in comparison to a baseline predicting not individual but aggregated labels. Additionally, the composition of test sets sampled from the full dataset differs between the studies: Gordon et al. (2022) use a test set of 5,000 comments, while we use 22,360 comments in a four-fold cross-validation. We leave an explicit comparison to future work.
Group-specific layers (§4) are a natural extension of annotator-specific classification layers in multi-annotator models. However, other architectures to predict annotator-level labels use different ways to represent sociodemographic information, e.g., via embeddings in a recommender system (Gordon et al., 2022). Future work could explore additional representations of annotator attributes (e.g., as part of the input, either textual or as separate features) and other approaches to modelling the relation of individual labeling decisions and attributes (e.g., probabilistic graphical models).
7 Conclusion
We ask how relevant modelling explicit sociodemographic information is in learning from individual annotators. Our experiments with group-specific layers for four sociodemographic attributes on social media data with toxicity annotations (Kumar et al., 2021) show no significant benefit of modelling sociodemographic groups in multi-annotator models. However, as the issue of ecological fallacies highlights, it is not implausible that these models do not learn additional information from group information beyond the inherent variation. However, our results do not refute the usefulness of sociodemographic attributes in modelling annotation, but underscore the importance of their judicious use. Different tasks and model architectures will likely benefit to different extents. Ultimately, annotation behaviour is driven by complex factors and we will need to consider more than annotators’ sociodemographics.
Acknowledgements
We thank Deepak Kumar for providing access to the disaggregated dataset and his continued support. We also thank Aida Mostafazadeh Davani for providing information on implementation details of multi-annotator models. Members of MilaNLP (Bocconi) and the Semantic Computing Group (Bielefeld) provided feedback on earlier versions of this paper, for which we thank them again.
This work has in part been funded by the European Research Council (ERC) under the European Union’s Horizon 2020 research and innovation program (grant agreement No. 949944, INTEGRATOR). Likewise, this work has in part been funded by the VolkswagenStiftung as part of the "3B Bots Building Bridges" project.
Limitations
While the dataset by Kumar et al. (2021) enabled us to test models for a range of often overlooked groups (e.g., non-binary or bisexual annotators), we ultimately modelled only four specific attributes (gender, age, education, sexual orientation). There are likely to be more factors that could play a role. Additionally, annotators in the Kumar et al. (2021) dataset are exclusively from the United States of America, so that results do not necessarily hold for other countries or cultures Hovy and Yang (2021). Specifically perceptions of harmful content online are known to vary across countries (Jiang et al., 2021).
We used only the (Kumar et al., 2021) dataset. This is mainly due to our strict criteria regarding dataset size and availability of annotator-level labels and sociodemographic information. These characteristics were a prerequisite for our experiments across different attributes with sufficient numbers of annotators. Most datasets which include annotator-level labels and sociodemographic information contain much smaller numbers of annotators and attributes. Nevertheless, with the Measuring Hate Speech Corpus there is at least one additional dataset (Sachdeva et al., 2022) with comparable characteristics that could be used in future experiments. Also, additional small-scale, more focused experiments could use datasets like Sap et al. (2022) or HS-Brexit (Akhtar et al., 2021) which was annotated by 6 annotators, each from one of two sociodemographic groups.
We do not study the aggregation of individual predictions or evaluate against majority labels, as these are not directly relevant to our investigation of sociodemographic attributes in models of annotation behaviour. Consequently, we cannot derive a conclusion about performance in those settings from our results. This is a noteworthy limitation, because part of the experiments introducing multi-annotator models in Davani et al. (2022) compare labels aggregated from multi-annotator models against predictions from a standard classifier (directly trained on aggregated labels).
For computational reasons, our experiments use a comparatively small pre-trained language model (RoBERTa, Liu et al. 2019). Thus, results might differ with larger models.
Ethics Statement
As sociodemographic attributes are sensitive information, we do not infer attributes, but build on a self-reported, IRB-reviewed dataset (Kumar et al., 2021). We also see potential for a discussion of “privacy by design” in modelling human label variation based on our results: There can be circumstances in which knowing more about annotators is not relevant, and indeed might lead to violations of privacy.
As multi-annotator models attempt to capture the preferences of individual annotators, there are valid concerns around privacy and anonymity. As discussed in Davani et al. (2022), increasing the annotator count can be one option to reduce privacy risks. We show it is feasible to learn a model for a large number of individual annotators (5002 vs. 18 and 82 in their work). But a prerequisite for improved privacy is to apply effective aggregation on top of individual predictions, which we do not study in the present work.
References
- Abercrombie et al. (2022) Gavin Abercrombie, Valerio Basile, Sara Tonelli, Verena Rieser, and Alexandra Uma, editors. 2022. Proceedings of the 1st Workshop on Perspectivist Approaches to NLP @LREC2022. European Language Resources Association, Marseille, France.
- Akhtar et al. (2020) Sohail Akhtar, Valerio Basile, and Viviana Patti. 2020. Modeling annotator perspective and polarized opinions to improve hate speech detection. In Proceedings of the AAAI Conference on Human Computation and Crowdsourcing, volume 8, pages 151–154.
- Akhtar et al. (2021) Sohail Akhtar, Valerio Basile, and Viviana Patti. 2021. Whose opinions matter? perspective-aware models to identify opinions of hate speech victims in abusive language detection. Preprint arXiv:2106.15896.
- Al Kuwatly et al. (2020) Hala Al Kuwatly, Maximilian Wich, and Georg Groh. 2020. Identifying and measuring annotator bias based on annotators’ demographic characteristics. In Proceedings of the Fourth Workshop on Online Abuse and Harms, pages 184–190, Online. Association for Computational Linguistics.
- Basile et al. (2021) Valerio Basile, Michael Fell, Tommaso Fornaciari, Dirk Hovy, Silviu Paun, Barbara Plank, Massimo Poesio, and Alexandra Uma. 2021. We need to consider disagreement in evaluation. In Proceedings of the 1st Workshop on Benchmarking: Past, Present and Future, pages 15–21, Online. Association for Computational Linguistics.
- Biester et al. (2022) Laura Biester, Vanita Sharma, Ashkan Kazemi, Naihao Deng, Steven Wilson, and Rada Mihalcea. 2022. Analyzing the effects of annotator gender across NLP tasks. In Proceedings of the 1st Workshop on Perspectivist Approaches to NLP @LREC2022, pages 10–19, Marseille, France. European Language Resources Association.
- Binns et al. (2017) Reuben Binns, Michael Veale, Max Van Kleek, and Nigel Shadbolt. 2017. Like trainer, like bot? inheritance of bias in algorithmic content moderation. In Social Informatics, Lecture Notes in Computer Science, pages 405–415. Springer International Publishing.
- Cercas Curry et al. (2021) Amanda Cercas Curry, Gavin Abercrombie, and Verena Rieser. 2021. ConvAbuse: Data, analysis, and benchmarks for nuanced abuse detection in conversational AI. In Proceedings of the 2021 Conference on Empirical Methods in Natural Language Processing, pages 7388–7403, Online and Punta Cana, Dominican Republic. Association for Computational Linguistics.
- Crenshaw (1989) Kimberle Crenshaw. 1989. Demarginalizing the intersection of race and sex: A black feminist critique of antidiscrimination doctrine, feminist theory and antiracist politics. University of Chicago Legal Forum, 1989(1):Article 8.
- Davani et al. (2022) Aida Mostafazadeh Davani, Mark Díaz, and Vinodkumar Prabhakaran. 2022. Dealing with disagreements: Looking beyond the majority vote in subjective annotations. Transactions of the Association for Computational Linguistics, 10:92–110.
- Dror et al. (2017) Rotem Dror, Gili Baumer, Marina Bogomolov, and Roi Reichart. 2017. Replicability analysis for natural language processing: Testing significance with multiple datasets. Transactions of the Association for Computational Linguistics, 5:471–486.
- Dror et al. (2018) Rotem Dror, Gili Baumer, Segev Shlomov, and Roi Reichart. 2018. The hitchhiker’s guide to testing statistical significance in natural language processing. In Proceedings of the 56th Annual Meeting of the Association for Computational Linguistics (Volume 1: Long Papers), pages 1383–1392, Melbourne, Australia. Association for Computational Linguistics.
- Excell and Al Moubayed (2021) Elizabeth Excell and Noura Al Moubayed. 2021. Towards equal gender representation in the annotations of toxic language detection. In Proceedings of the 3rd Workshop on Gender Bias in Natural Language Processing, pages 55–65, Online. Association for Computational Linguistics.
- Fornaciari et al. (2021) Tommaso Fornaciari, Alexandra Uma, Silviu Paun, Barbara Plank, Dirk Hovy, and Massimo Poesio. 2021. Beyond black & white: Leveraging annotator disagreement via soft-label multi-task learning. In Proceedings of the 2021 Conference of the North American Chapter of the Association for Computational Linguistics: Human Language Technologies, pages 2591–2597, Online. Association for Computational Linguistics.
- Fornaciari et al. (2022) Tommaso Fornaciari, Alexandra Uma, Massimo Poesio, and Dirk Hovy. 2022. Hard and soft evaluation of NLP models with BOOtSTrap SAmpling - BooStSa. In Proceedings of the 60th Annual Meeting of the Association for Computational Linguistics: System Demonstrations, pages 127–134, Dublin, Ireland. Association for Computational Linguistics.
- Freedman (2015) David A. Freedman. 2015. Ecological inference. In James D. Wright, editor, International Encyclopedia of the Social & Behavioral Sciences (Second Edition), pages 868–870. Elsevier.
- Gordon et al. (2022) Mitchell L. Gordon, Michelle S. Lam, Joon Sung Park, Kayur Patel, Jeff Hancock, Tatsunori Hashimoto, and Michael S. Bernstein. 2022. Jury learning: Integrating dissenting voices into machine learning models. In Proceedings of the 2022 CHI Conference on Human Factors in Computing Systems, CHI ’22, pages 1–19. Association for Computing Machinery.
- Goyal et al. (2022) Nitesh Goyal, Ian D. Kivlichan, Rachel Rosen, and Lucy Vasserman. 2022. Is your toxicity my toxicity? exploring the impact of rater identity on toxicity annotation. Proceedings of the ACM on Human-Computer Interaction, 6:1–28.
- Hovy and Yang (2021) Dirk Hovy and Diyi Yang. 2021. The importance of modeling social factors of language: Theory and practice. In Proceedings of the 2021 Conference of the North American Chapter of the Association for Computational Linguistics: Human Language Technologies, pages 588–602, Online. Association for Computational Linguistics.
- Jamison and Gurevych (2015) Emily Jamison and Iryna Gurevych. 2015. Noise or additional information? leveraging crowdsource annotation item agreement for natural language tasks. In Proceedings of the 2015 Conference on Empirical Methods in Natural Language Processing, pages 291–297, Lisbon, Portugal. Association for Computational Linguistics.
- Jiang et al. (2021) Jialun Aaron Jiang, Morgan Klaus Scheuerman, Casey Fiesler, and Jed R. Brubaker. 2021. Understanding international perceptions of the severity of harmful content online. PLOS ONE, 16(8).
- Kumar et al. (2021) Deepak Kumar, Patrick Gage Kelley, Sunny Consolvo, Joshua Mason, Elie Bursztein, Zakir Durumeric, Kurt Thomas, and Michael Bailey. 2021. Designing toxic content classification for a diversity of perspectives. In Seventeenth Symposium on Usable Privacy and Security (SOUPS 2021), pages 299–318. USENIX Association.
- Larimore et al. (2021) Savannah Larimore, Ian Kennedy, Breon Haskett, and Alina Arseniev-Koehler. 2021. Reconsidering annotator disagreement about racist language: Noise or signal? In Proceedings of the Ninth International Workshop on Natural Language Processing for Social Media, pages 81–90, Online. Association for Computational Linguistics.
- Liu et al. (2019) Yinhan Liu, Myle Ott, Naman Goyal, Jingfei Du, Mandar Joshi, Danqi Chen, Omer Levy, Mike Lewis, Luke Zettlemoyer, and Veselin Stoyanov. 2019. Roberta: A robustly optimized bert pretraining approach. Preprint arXiv:1907.11692.
- Pedregosa et al. (2011) F. Pedregosa, G. Varoquaux, A. Gramfort, V. Michel, B. Thirion, O. Grisel, M. Blondel, P. Prettenhofer, R. Weiss, V. Dubourg, J. Vanderplas, A. Passos, D. Cournapeau, M. Brucher, M. Perrot, and E. Duchesnay. 2011. Scikit-learn: Machine learning in Python. Journal of Machine Learning Research, 12:2825–2830.
- Plank (2022) Barbara Plank. 2022. The “problem” of human label variation: On ground truth in data, modeling and evaluation. In Proceedings of the 2022 Conference on Empirical Methods in Natural Language Processing, pages 10671–10682, Abu Dhabi, United Arab Emirates. Association for Computational Linguistics.
- Plank et al. (2014) Barbara Plank, Dirk Hovy, and Anders Søgaard. 2014. Learning part-of-speech taggers with inter-annotator agreement loss. In Proceedings of the 14th Conference of the European Chapter of the Association for Computational Linguistics, pages 742–751, Gothenburg, Sweden. Association for Computational Linguistics.
- Prabhakaran et al. (2021) Vinodkumar Prabhakaran, Aida Mostafazadeh Davani, and Mark Diaz. 2021. On releasing annotator-level labels and information in datasets. In Proceedings of the Joint 15th Linguistic Annotation Workshop (LAW) and 3rd Designing Meaning Representations (DMR) Workshop, pages 133–138, Punta Cana, Dominican Republic. Association for Computational Linguistics.
- Robinson (1950) W. S. Robinson. 1950. Ecological correlations and the behavior of individuals. American Sociological Review, 15(3):351–357.
- Röttger et al. (2022) Paul Röttger, Bertie Vidgen, Dirk Hovy, and Janet Pierrehumbert. 2022. Two contrasting data annotation paradigms for subjective NLP tasks. In Proceedings of the 2022 Conference of the North American Chapter of the Association for Computational Linguistics: Human Language Technologies, pages 175–190, Seattle, United States. Association for Computational Linguistics.
- Sachdeva et al. (2022) Pratik Sachdeva, Renata Barreto, Geoff Bacon, Alexander Sahn, Claudia von Vacano, and Chris Kennedy. 2022. The measuring hate speech corpus: Leveraging rasch measurement theory for data perspectivism. In Proceedings of the 1st Workshop on Perspectivist Approaches to NLP @LREC2022, pages 83–94, Marseille, France. European Language Resources Association.
- Sanh et al. (2019) Victor Sanh, Lysandre Debut, Julien Chaumond, and Thomas Wolf. 2019. DistilBERT, a distilled version of BERT: smaller, faster, cheaper and lighter. In 5th Workshop on Energy Efficient Machine Learning and Cognitive Computing @ NeurIPS 2019.
- Sap et al. (2019) Maarten Sap, Dallas Card, Saadia Gabriel, Yejin Choi, and Noah A. Smith. 2019. The risk of racial bias in hate speech detection. In Proceedings of the 57th Annual Meeting of the Association for Computational Linguistics, pages 1668–1678, Florence, Italy. Association for Computational Linguistics.
- Sap et al. (2022) Maarten Sap, Swabha Swayamdipta, Laura Vianna, Xuhui Zhou, Yejin Choi, and Noah A. Smith. 2022. Annotators with attitudes: How annotator beliefs and identities bias toxic language detection. In Proceedings of the 2022 Conference of the North American Chapter of the Association for Computational Linguistics: Human Language Technologies, pages 5884–5906, Seattle, United States. Association for Computational Linguistics.
- Shen and Rose (2021) Qinlan Shen and Carolyn Rose. 2021. What sounds “right” to me? experiential factors in the perception of political ideology. In Proceedings of the 16th Conference of the European Chapter of the Association for Computational Linguistics: Main Volume, pages 1762–1771, Online. Association for Computational Linguistics.
- Uma et al. (2021) Alexandra N. Uma, Tommaso Fornaciari, Dirk Hovy, Silviu Paun, Barbara Plank, and Massimo Poesio. 2021. Learning from disagreement: A survey. Journal of Artificial Intelligence Research, 72:1385–1470.
- Wang et al. (2022) Angelina Wang, Vikram V Ramaswamy, and Olga Russakovsky. 2022. Towards intersectionality in machine learning: Including more identities, handling underrepresentation, and performing evaluation. In 2022 ACM Conference on Fairness, Accountability, and Transparency, FAccT ’22, pages 336–349. Association for Computing Machinery.
- Wolf et al. (2020) Thomas Wolf, Lysandre Debut, Victor Sanh, Julien Chaumond, Clement Delangue, Anthony Moi, Pierric Cistac, Tim Rault, Remi Louf, Morgan Funtowicz, Joe Davison, Sam Shleifer, Patrick von Platen, Clara Ma, Yacine Jernite, Julien Plu, Canwen Xu, Teven Le Scao, Sylvain Gugger, Mariama Drame, Quentin Lhoest, and Alexander Rush. 2020. Transformers: State-of-the-art natural language processing. In Proceedings of the 2020 Conference on Empirical Methods in Natural Language Processing: System Demonstrations, pages 38–45, Online. Association for Computational Linguistics.
Appendix A Appendix
A.1 Annotator Sociodemographics in Sample
Table 2 shows how many annotators the sample contains. Counts are given per group of the four attributes gender, age, education and sexuality.
In the Kumar et al. (2021) dataset, sociodemographic attributes are given for each individual annotation - not once per annotator. For some annotators, conflicting attribute values exist (e.g., two different age groups). As the data collection spanned several months (Kumar et al., 2021), these value changes can in principle be reasonable (e.g., because an annotator got older, finished a degree, changed sexual preference or gender identity). However, as reasonable changes can not easily be discerned from erroneous input, we disambiguate values based on a heuristic: If an annotator reports several values for an attribute, we assume the most frequent value to be valid. In cases of no clear most frequent value, we set the attribute to "Prefer not to say". Thus, the main results do not contain annotators with ambiguous attributes.
A.2 Significance Tests
Results of a replicability analysis (Dror et al., 2017) testing for significant differences in macro on scores from three runs of four-fold cross-validation. Table 3 shows results for a comparison of the sociodemographic models against the baseline models. Table 4 shows results for a comparison of the sociodemographic models against the randomized assignment models. The Bonferroni correction for the corrected count of significant folds is used to account for the fact that we have overlapping test sets from multiple runs of four-fold cross-validation.
A.3 Training Details, Hyperparameters and Computational Resources
We implement models and the training loop using the Hugging Face Transformers library (version 4.19.2, Wolf et al. 2020). Maximum sequence length is 512 tokens, with truncation and padding to the maximum length. We train for 3 epochs with a batch size of 8 and an initial learning rate of . Otherwise, we used default parameters. We found results to particularly depend on the learning rate, with higher or lower values leading to worse results.
We use a weighted loss function. Label weights are calculated per annotator on the training set of each fold. Label weights, evaluation scores and the four-fold dataset splits (StratifiedKFold) are calculated using the scikit-learn library (version 1.0.2, Pedregosa et al. 2011). The folds are based on a fixed random seed per iteration: 2803636207, 165043843, 2923262358
The majority of parameters in our model belong to the pre-trained language model shared between all group-specific and annotator-specific layers. Specifically, RoBERTa (Liu et al., 2019) in the roberta-base variant has 125 Million parameters. We keep the pre-trained model’s default output dimensionality of 768, so that each group-specific layer adds parameters and each annotator layer adds parameters.
All experiments ran on a single GPU (GeForce GTX 1080 Ti, 12GB GPU RAM). Per fold, training and evaluation together take about three and a half hours in our setting. Three runs of four-fold cross-validation (12 folds), thus take around 42 hours (1.75 days). With four attributes and three trainable models the combined run time of the reported experiments is estimated to be 21 days. Including preliminary experiments, which, however, mostly were not full runs of k-fold cross-validation and also utilized DistilBERT (Sanh et al., 2019) with slightly faster run times, it will be many times more. There is no discernible difference in experiment run times between multi-annotator models with or without groups or different numbers of groups.
A.4 Number of Annotations per Group across all Test Sets
Table 5 contains the number of annotations we have per group across the total of 12 folds (from three runs of four-fold cross-validation). This number of annotations is the effective test set size per group. As the numbers do not vary substantially, performance on each fold is equally representative for all groups.
A.5 Full Results
Table 6 shows full results of experiments (see 4), including results for all residual categories and a naive baseline which always predicts toxic.